The rate of sea ice loss for April 2023 was slow, owing to cool conditions across the ice-covered Arctic Ocean and below-average to near-average temperatures near the ice edge. Antarctic sea ice extent remained sharply below average throughout the month.
Overview of conditions
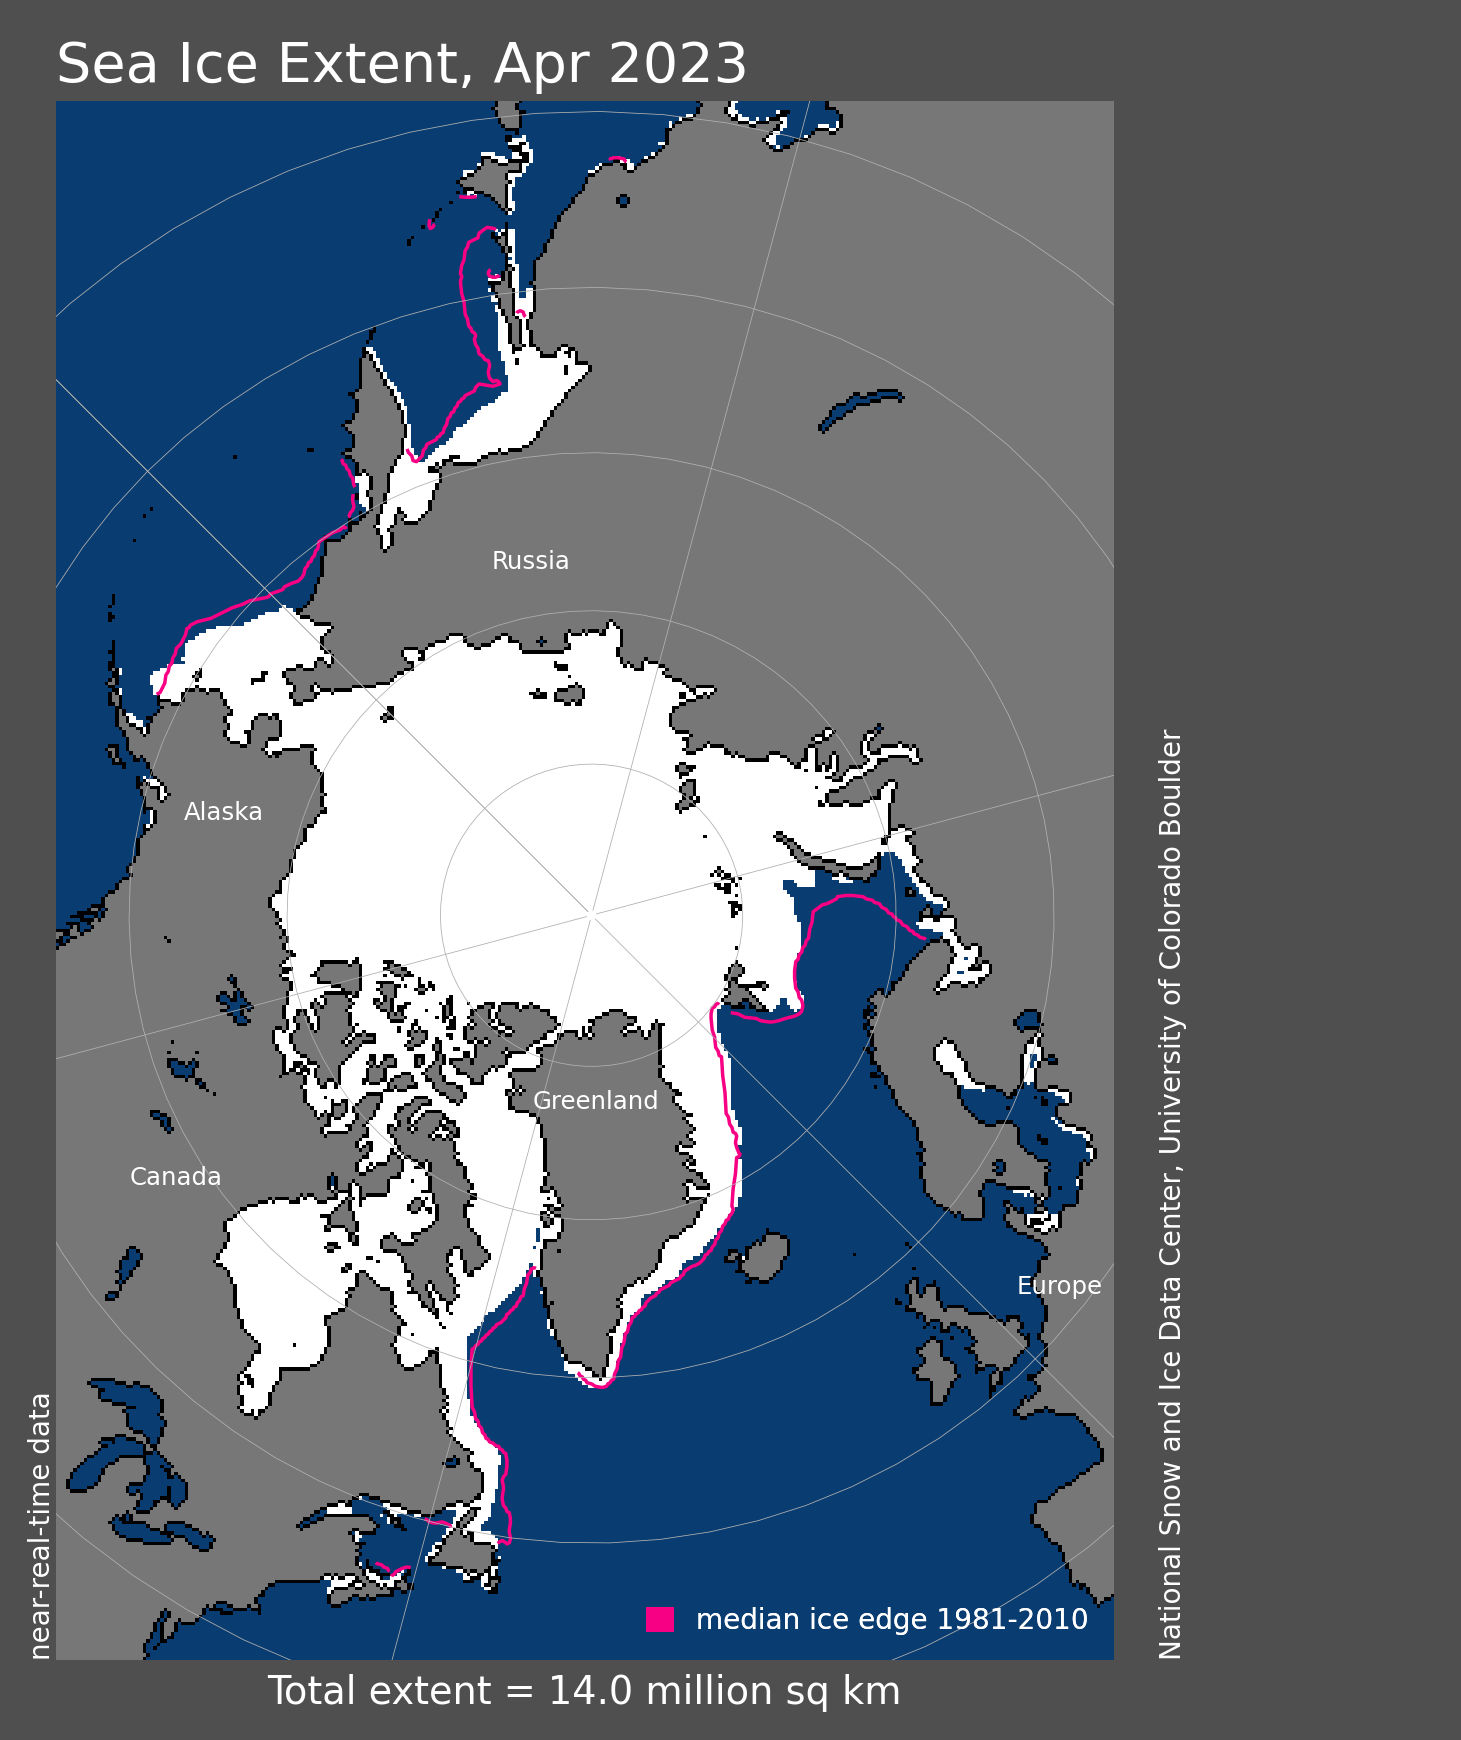
Figure 1a. Arctic sea ice extent for April 2023 was 13.99 million square kilometers (5.40 million square miles. The magenta line shows the 1981 to 2010 average extent for that month. Sea Ice Index data. About the data
Credit: National Snow and Ice Data Center
High-resolution image

Figure 1b. The graph above shows Arctic sea ice extent as of May 2, 2023, along with daily ice extent data for four previous years and the record low year. 2023 is shown in blue, 2022 in green, 2021 in orange, 2020 in brown, 2019 in magenta, and 2012 in dashed brown. The 1981 to 2010 median is in dark gray. The gray areas around the median line show the interquartile and interdecile ranges of the data. Sea Ice Index data.
Credit: National Snow and Ice Data Center
High-resolution image
The April 2023 average Arctic sea ice extent was 13.99 million square kilometers (5.40 million square miles), tied with 2004 as the tenth lowest April in the satellite record (Figure 1a). The average monthly extent was 700,000 square kilometers (270,000 square miles) below the 1981 to 2010 average of 14.69 million square kilometers (5.67 million square miles), but 560,000 square kilometers (216,000 square miles) above the record low set in April 2019 (Figure 1b). The rate of sea ice loss through April was only 20,600 square kilometers (8,000 square miles) per day, well below the 1981 to 2010 average of 36,400 square kilometers (14,000 square miles) per day. Toward the end of the month, extent reached the lowest decile of daily extents as assessed over the satellite record. Overall, sea ice extent decreased 690,000 square kilometers (266,000 square miles) during April 2023, compared to the 1981 to 2010 average April decrease of 1.16 million square kilometers (448,000 square miles). At the end of the month, extent remained below average primarily in the Barents Sea. The ice edge is also north of its usual position over part of the Bering Sea.
Conditions in context
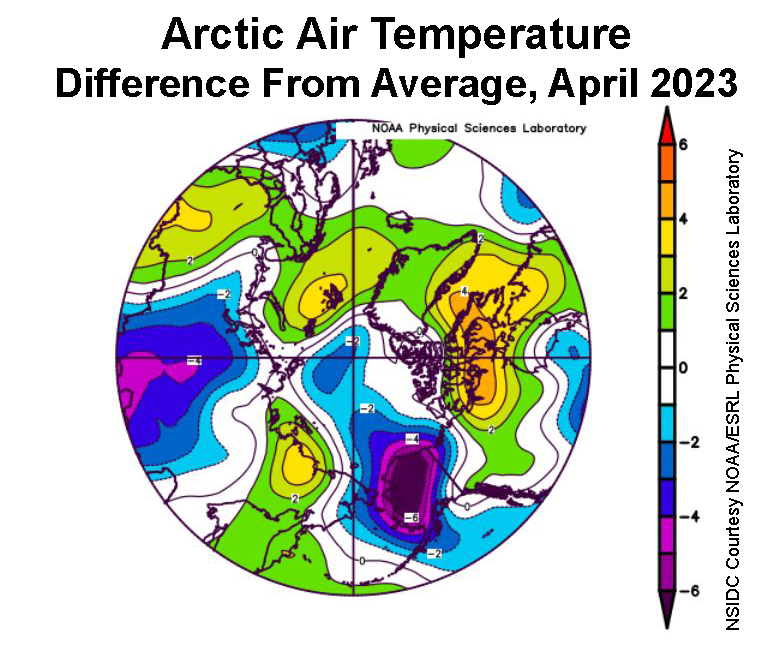
Figure 2a. This plot shows the departure from average air temperature in the Arctic at the 925 hPa level, in degrees Celsius, for April 2023. Yellows and reds indicate higher than average temperatures; blues and purples indicate lower than average temperatures.
Credit: NSIDC courtesy NOAA Earth System Research Laboratory Physical Sciences Laboratory
High-resolution image
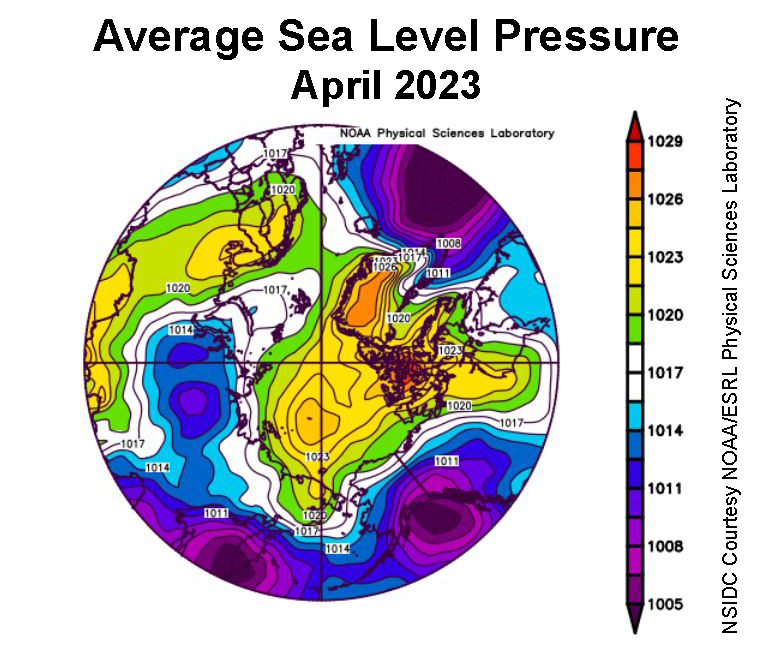
Figure 2b. This plot shows average sea level pressure in the Arctic in millibars for April 2023. Yellows and reds indicate high air pressure; blues and purples indicate low pressure.
Credit: NSIDC courtesy NOAA Earth System Research Laboratory Physical Sciences Laboratory
High-resolution image
Air temperatures at the 925 hPa level in April were near average to below average over most of the Arctic Ocean (Figure 2a). This helps to explain the slow rate of sea ice loss during April. While temperatures were modestly above average over the Barents Sea, these areas are already largely free of sea ice. The sea level pressure pattern was characterized by fairly high pressure over most of the Arctic Ocean (Figure 2b). The clockwise winds around a separate high-pressure center over Scandinavia brought warm winds from the south over the Barents Sea, consistent with the above air average temperatures in that area. Similarly, below-average temperatures over Alaska were driven by the combination of a strong low pressure area in the Gulf of Alaska and high pressure in the Beaufort Sea, driving air generally southward from the ice-covered Arctic Ocean.
April 2023 compared to previous years
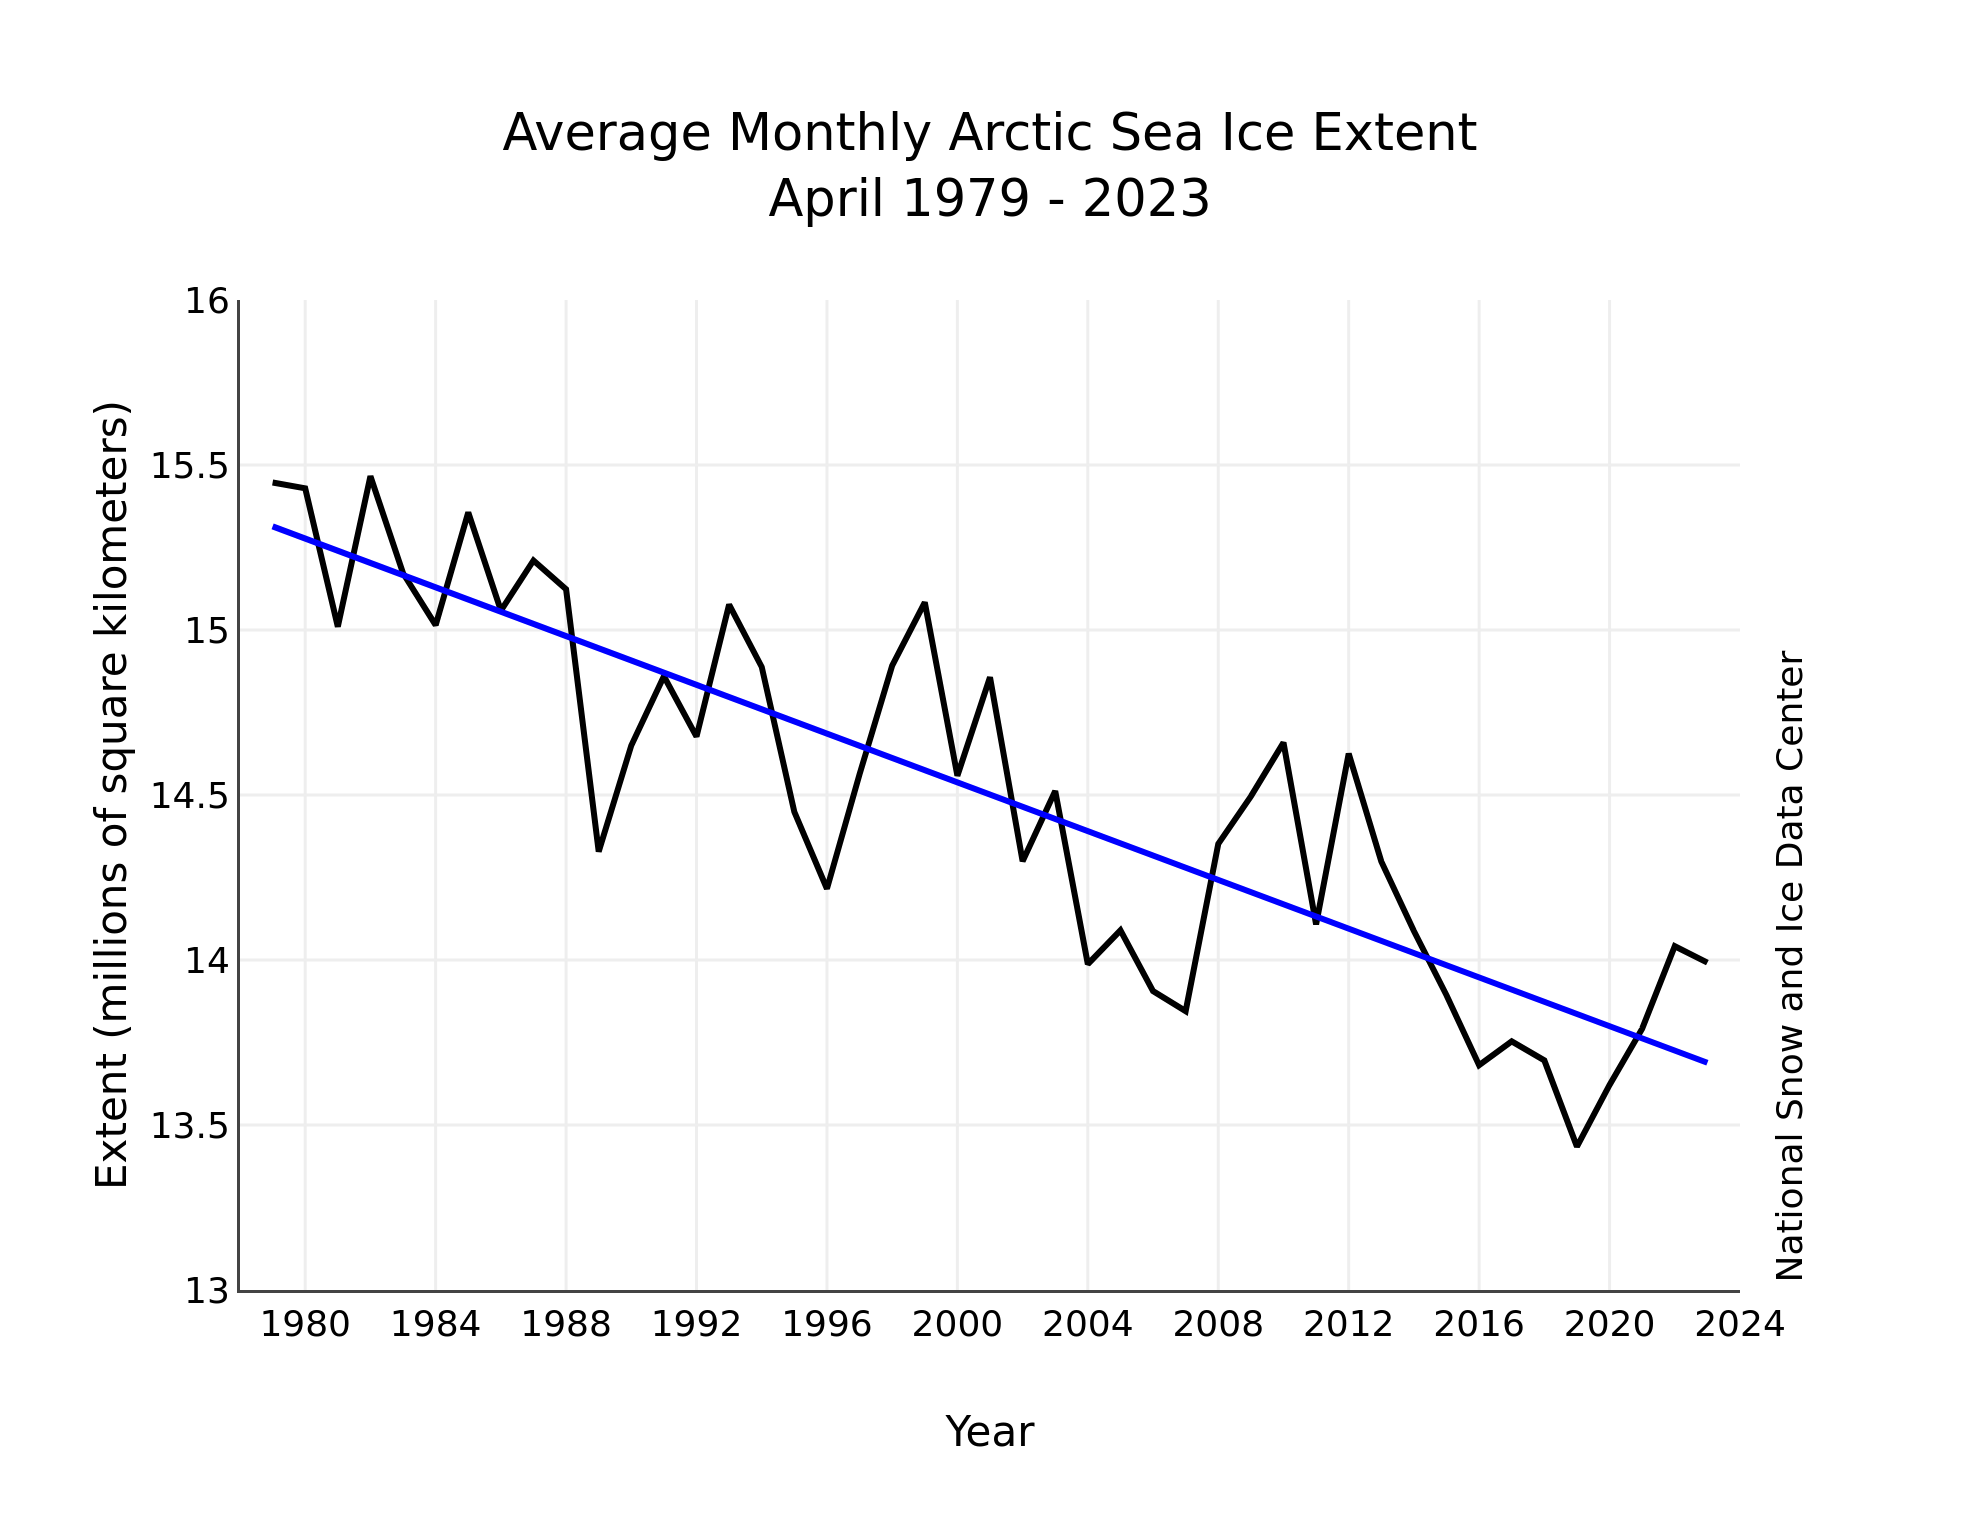
Figure 3. Monthly April ice extent for 1979 to 2023 shows a decline of 2.5 percent per decade.
Credit: National Snow and Ice Data Center
High-resolution image
The downward linear trend for Arctic sea ice extent in April over the 45-year satellite record is 37,000 square kilometers (14,300 square miles) per year, or 2.5 percent per decade relative to the 1981 to 2010 average (Figure 3). Based on the linear trend, since 1979, April has lost 1.65 million square kilometers (637,000 square miles) of ice. This is roughly equivalent to twice the size of Ukraine.
Clouds and Arctic sea ice
A new study by Sledd et al. offers evidence that as carbon dioxide levels rise, summer clouds will have an increasingly strong influence on Arctic sea surface temperatures (SSTs). This is because as the Arctic warms and sea ice retreats earlier, more solar radiation is absorbed by the upper ocean, causing the ocean to warm. Over snow- and ice-covered areas, clouds normally have a similarly high reflectance, reflecting most of the sun’s energy back out to space. But as the ocean becomes ice-free, the high albedo of clouds can counteract the ocean warming expected from increased solar absorption. Their study, based on climate model experiments, argues that with low levels of carbon dioxide (e.g. pre-industrial), sea ice covers the ocean through most of the summer, and clouds have little influence on sea surface temperatures. However, as carbon dioxide levels rise and the sea ice retreats, the countering cooling effect of clouds grows. Looking to the future, their findings suggest that when the Arctic becomes seasonally ice free, the maximum sea surface temperature becomes three times more sensitive to clouds than in the pre-industrial era. This argues that the representation of clouds and their radiative impacts is important for accurately modeling heat input to the upper ocean as the Arctic transitions to being seasonally ice free.
Antarctic extent remains low
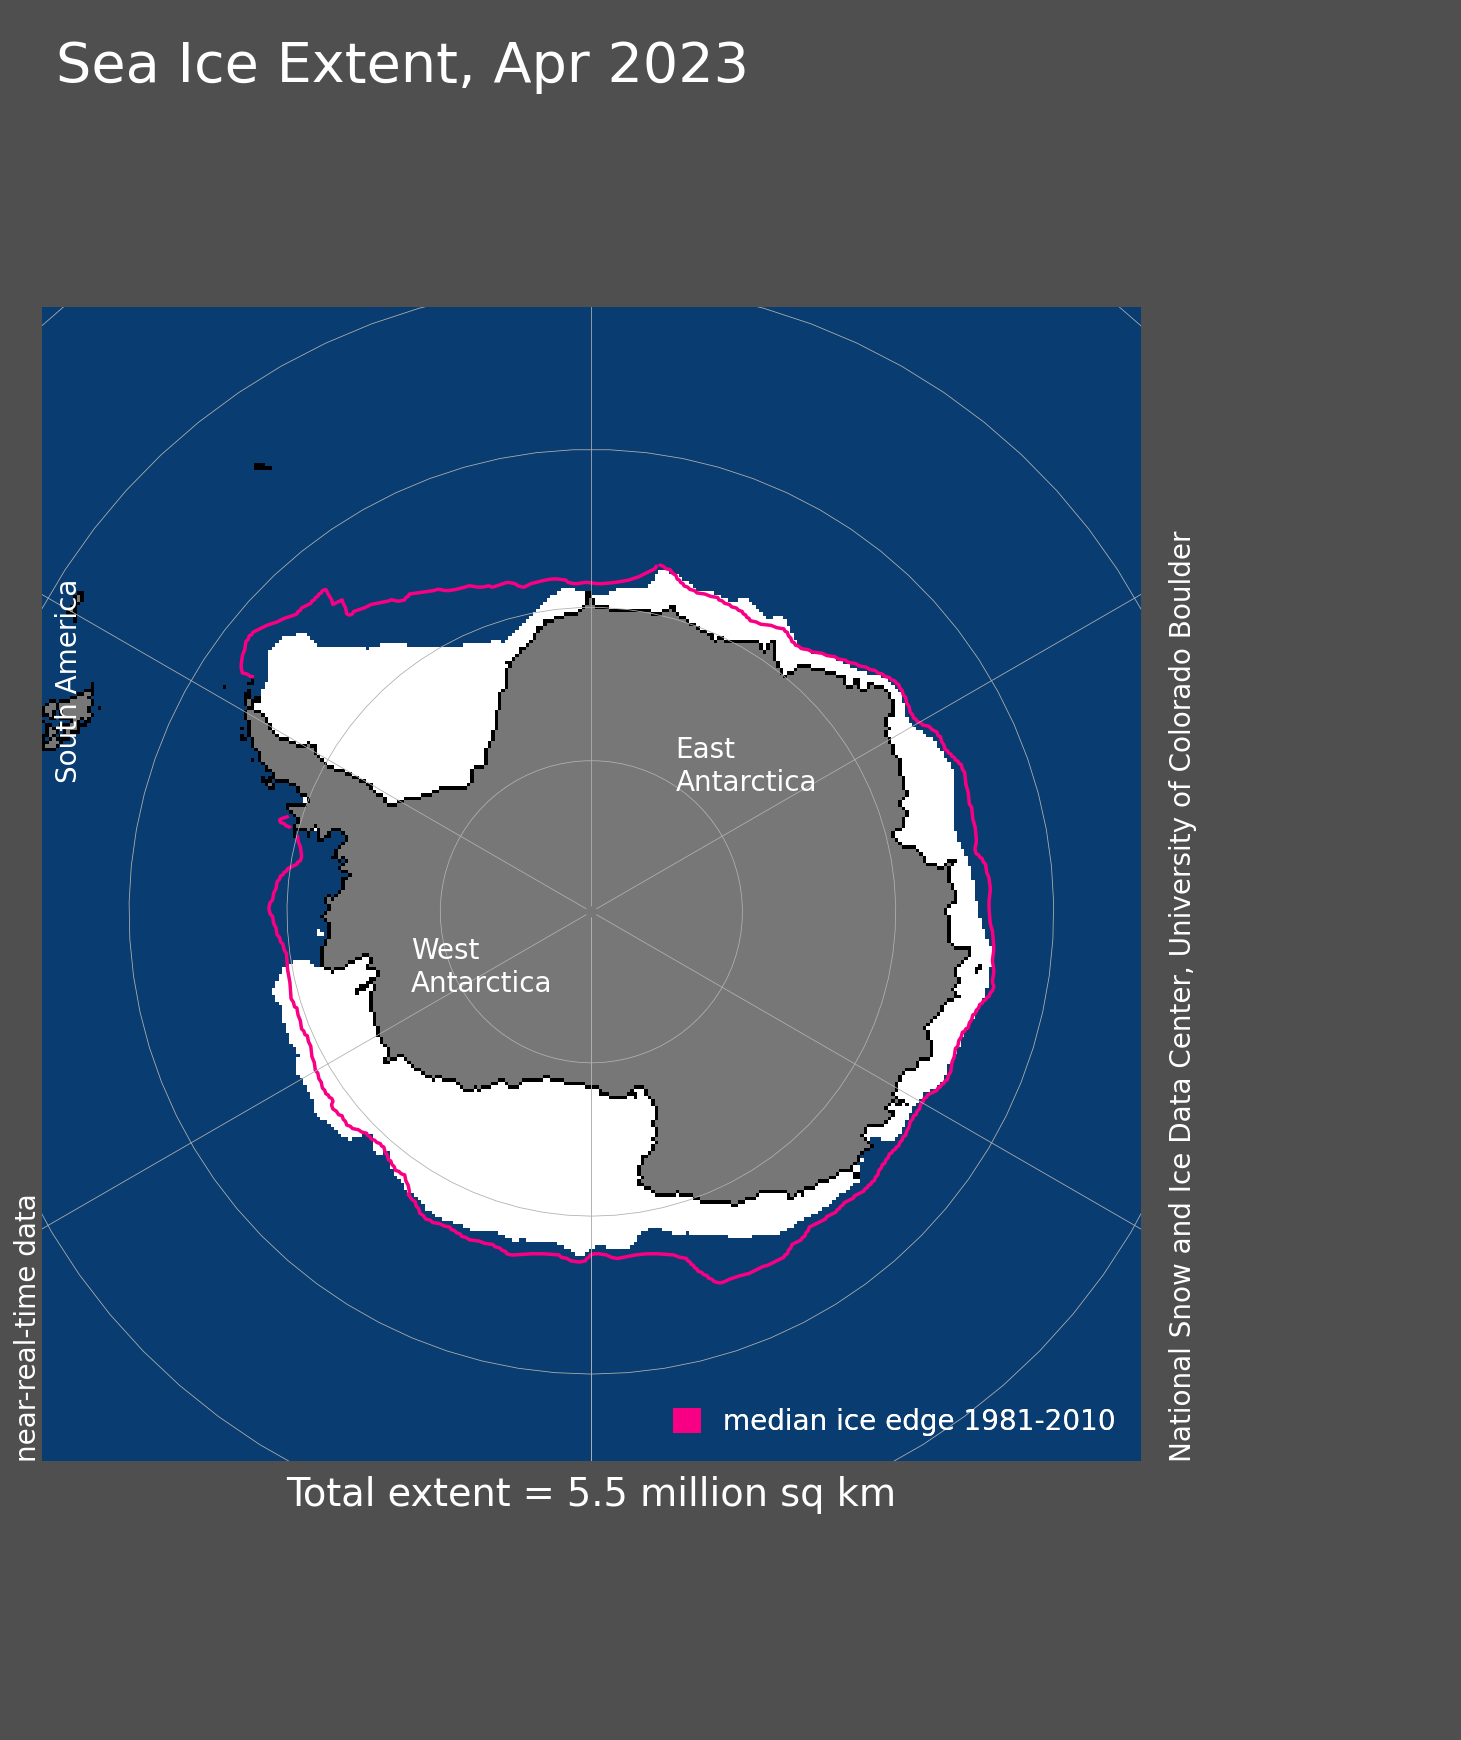
Figure 4. Antarctic sea ice extent for April 2023 was 5.50 million square kilometers (2.12 million square miles). The magenta line shows the 1981 to 2010 average extent for that month. Sea Ice Index data. About the data
Credit: National Snow and Ice Data Center
High-resolution image
While ice extent in the Antarctic is increasing in response to the changing of the seasons, extent remained well below average through April, particularly in the Bellingshausen Sea, where the ocean is nearly ice free along the entire coast, and the eastern Weddell Sea (Figure 4). Sea ice extent quickly returned to near average in the Amundsen and Ross Seas and most of the East Antarctic coast after the record low set in February of this year. At the end of the month, daily extent was the second lowest in the satellite record.
A recent study discussed the earlier 2022 record low Antarctic sea ice extent as a consequence, in part, of an unusually strong and eastward-shifted Amundsen Sea Low (ASL) during the austral spring of 2021. While this study emphasized ice export caused by the western arm of the ASL, we note that its eastern side is responsible for bringing northerly winds into the Bellingshausen Sea and strong surface melting and ice advection away from the Antarctic Peninsula coast. This pattern occurred again in the austral spring of 2022 with an almost identical position and strength of the ASL, leading to a new record low ice extent in February 2023 as we reported in March.
References
Sledd, A., R. S. L’Ecuyer, J. E. Kay, and M. Steele. 2023. Clouds increasingly influence Arctic sea surface temperatures as CO2 rises. Geophysical Research Letters. doi:10.1029/2023GL102850.
Wang, S., J. Liu, X. Cheng, D. Yang, T. Kerzenmacher, X. Li, Y. Hu, and P. Braesicke. 2023. Contribution of the deepened Amundsen Sea Low to the record low Antarctic sea ice extent in February 2022. Environmental Research Letters. doi:10.1088/1748-9326/acc9d6.

