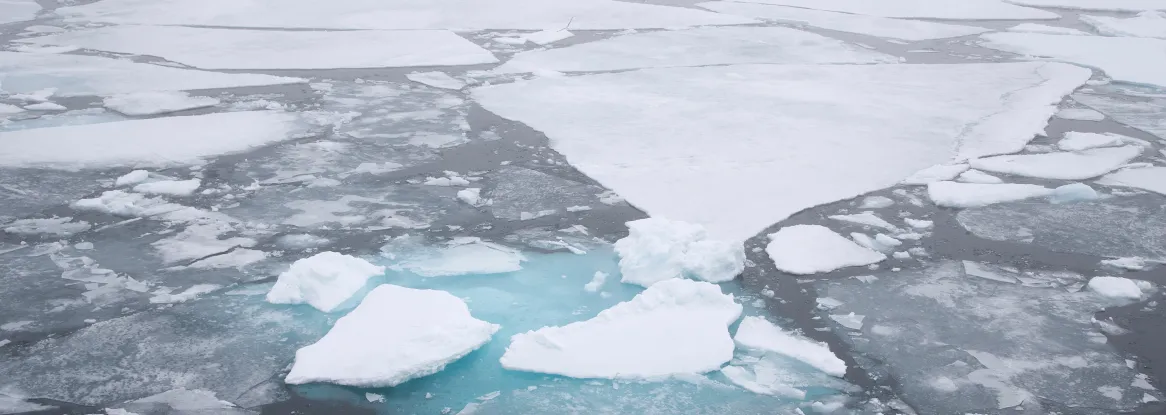
On September 12, Arctic sea ice likely reached its annual minimum extent of 4.60 million square kilometers (1.78 million square miles). The 2026 minimum shares the tenth lowest spot in the nearly 48-year satellite record with 2008, 2010, and 2025. The last 20 years, from 2007 to 2026, are the lowest 20 sea ice extents in the satellite record.
In the Antarctic, sea ice extent has been tracking near record low levels for most of the growth season, most likely reaching its maximum extent on September 14 at 17.59 million square kilometers (6.79 million square miles). If this maximum date holds, this will be the third lowest Antarctic sea ice maximum on record. It must be noted that large fluctuations in extent are typical of Antarctic sea ice near the seasonal maximum, often leading to some delay in confidently identifying the maximum, which typically occurs in late September or early October but has been reached as early as August 30.
Note that this is a preliminary announcement. Changing winds or late-season melt could still reduce the Arctic ice extent, as happened in 2005 and 2010. NSIDC scientists will release a full analysis of the Arctic melt season, and discuss the Antarctic winter sea ice growth, in early October.
Overview of conditions
On September 12, Arctic sea ice likely reached its annual minimum extent of 4.60 million square kilometers (1.78 million square miles) (Figure 1a). The 2026 Arctic sea ice extent has tied with three previous years, 2025, 2008, and 2010, for tenth lowest minimum in the satellite record (Figure 1b). However, with significant patches of low ice concentration still remaining, a late-season storm could compact the sea ice cover and push the ice extent even lower.
If September 12 holds as the minimum date, the 2026 minimum extent was reached two days earlier than the 1981 to 2010 median minimum date of September 14. The interquartile range of minimum dates is September 11 to September 19.
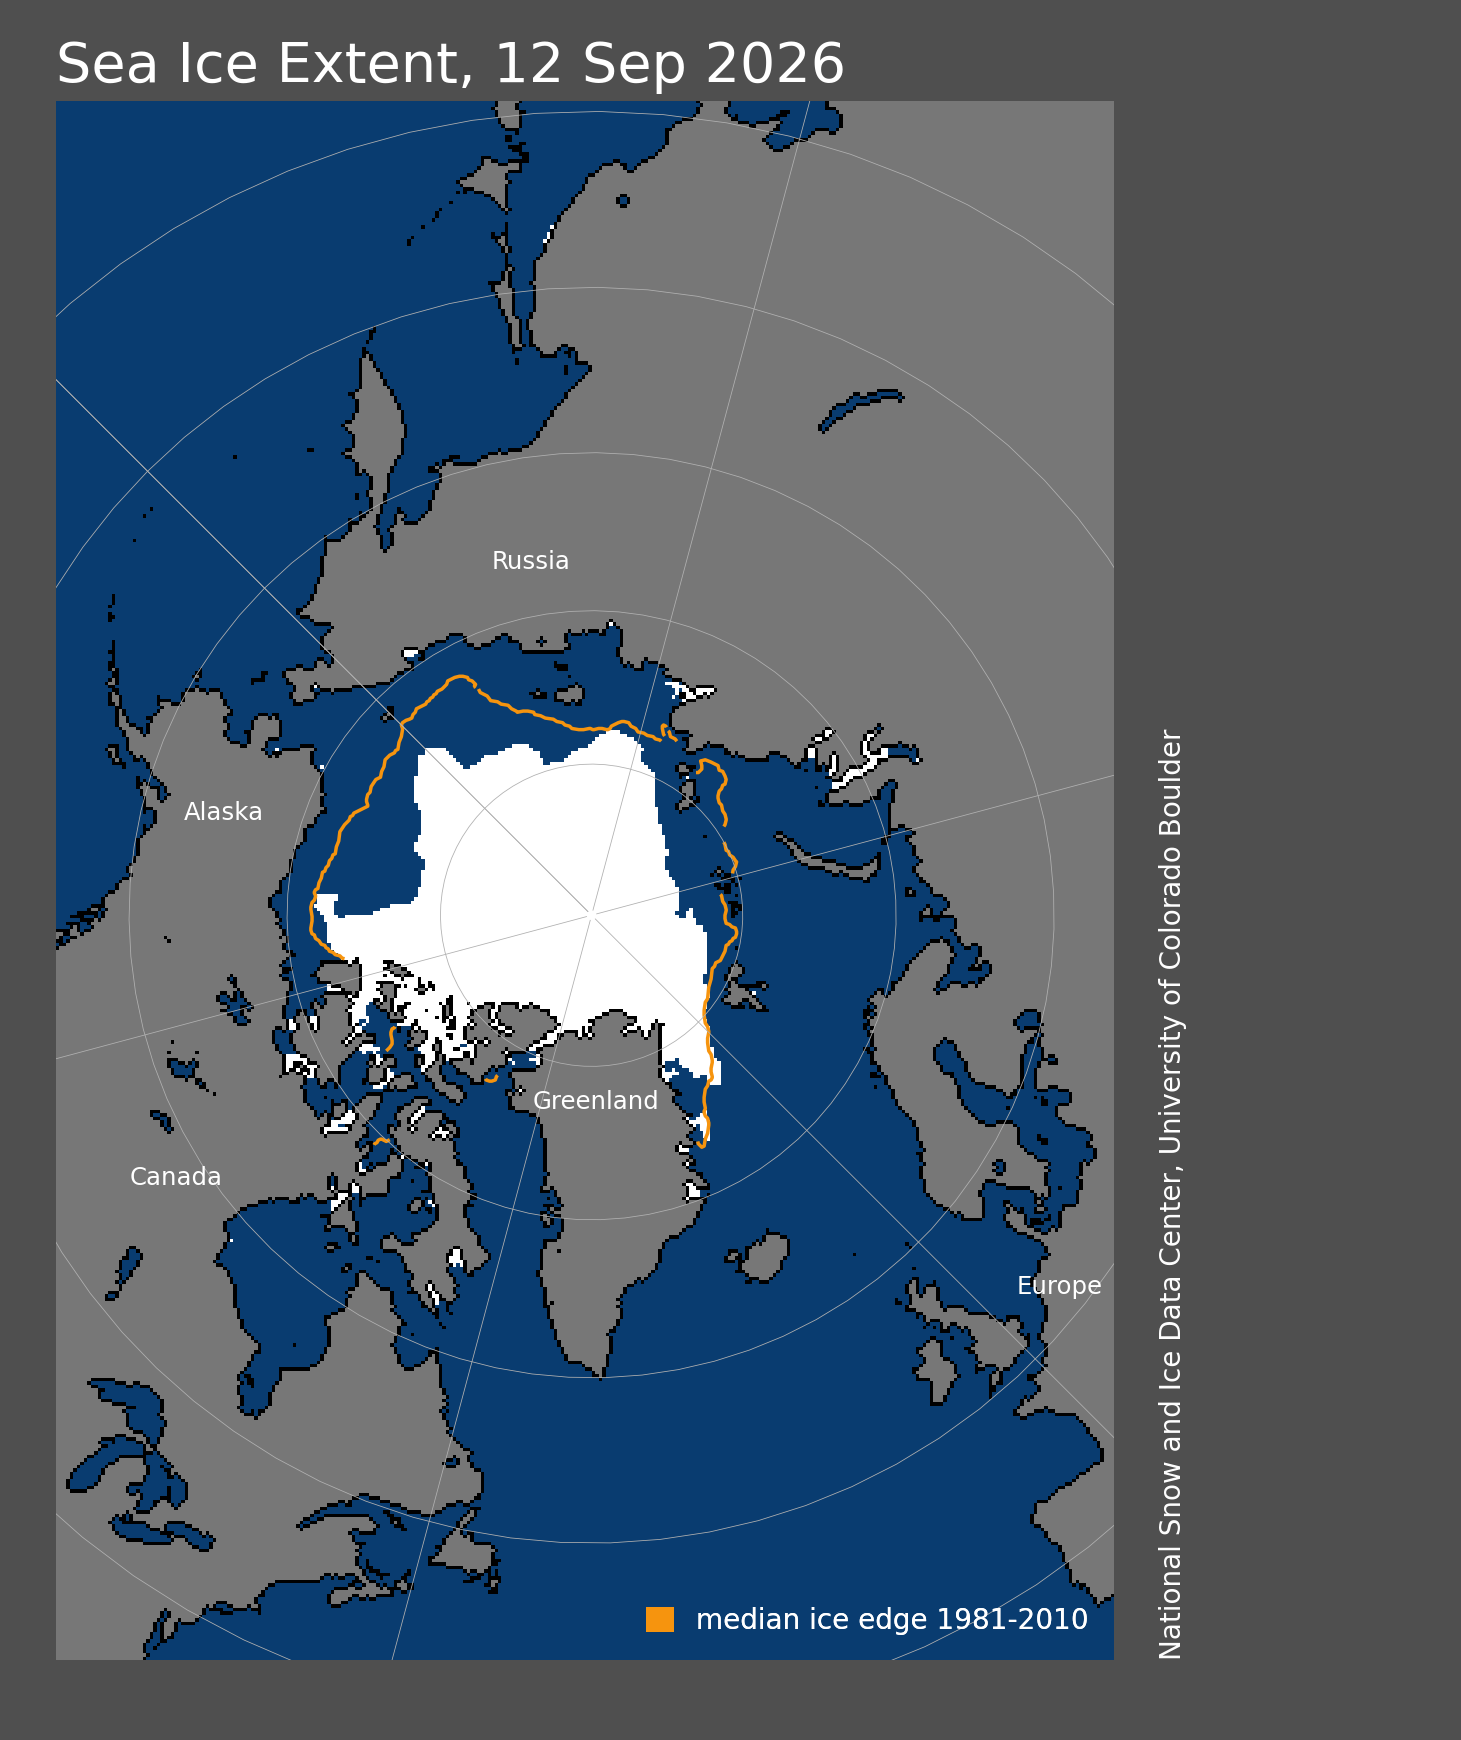
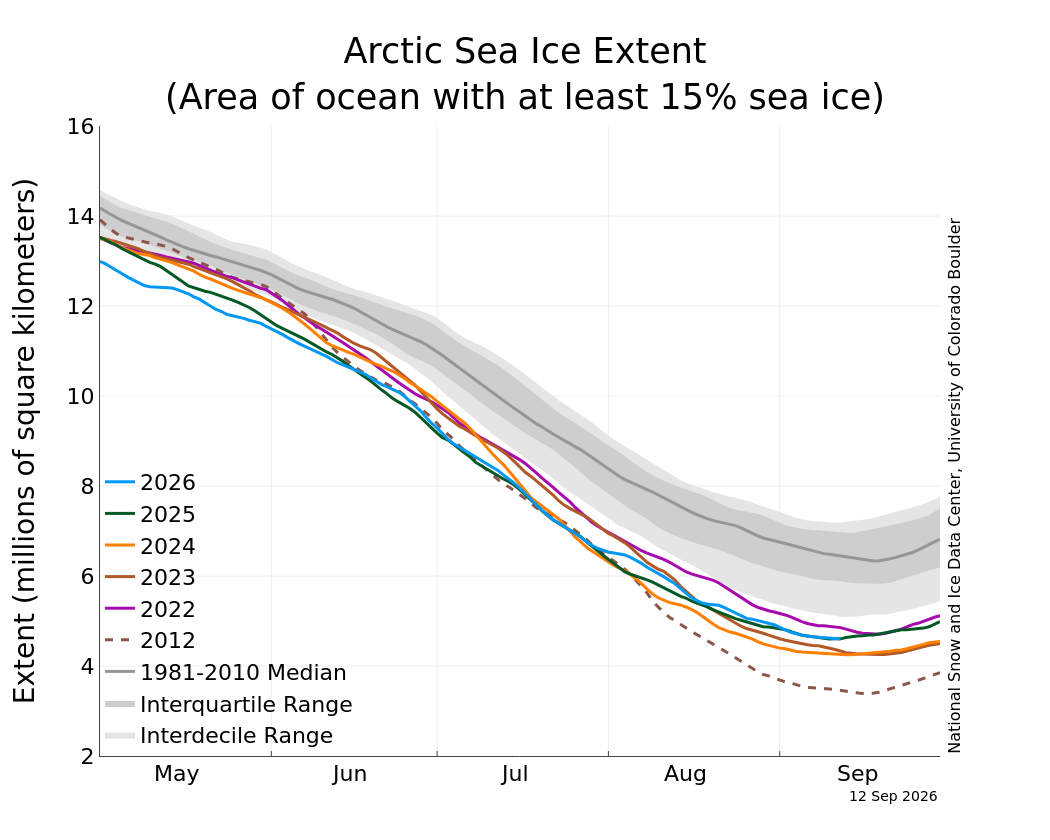
Figure 1a. Arctic sea ice extent for September 12, 2026, was 4.60 million square kilometers (1.78 million square miles). The orange line shows the 1981 to 2010 average extent for that day. Sea Ice Index data. About the data — Credit: National Snow and Ice Data Center
Figure 1b. This graph shows Arctic sea ice extent as of September 12, 2026, along with daily ice extent data for four previous years and the record low year. 2026 is shown in blue, 2025 in green, 2024 in orange, 2023 in brown, 2022 in magenta, and 2012 in dashed brown. The 1981 to 2010 median is in dark gray. The gray areas around the median line show the interquartile and interdecile ranges of the data. Sea Ice Index data. — Credit: National Snow and Ice Data Center
Conditions in context
This year’s minimum extent, based on a 5-day average, appears to have been set on September 12. It is 1.21 million square kilometers (467,000 square miles) above the satellite-era record minimum extent of 3.39 million square kilometers (1.31 million square miles), which occurred on September 17, 2012 (Figure 1b). It is also 1.62 million square kilometers (625,000 square miles) below the 1981 to 2010 average minimum extent, which is equivalent to about the loss in size of Alaska.
In the 48-year-satellite record, the 20 lowest minimums have all occurred in the last 20 years.
The overall, downward trend in the minimum extent from 1979 to 2026 is 11.8 percent per decade relative to the 1981 to 2010 average. From the linear trend, the loss of sea ice is about 73,200 square kilometers (28,300 square miles) per year.
This overall trend should be viewed with the caveat that there has been no significant decline in September minimum extents over the past two decades. Causes for this flattening trend are a matter of active debate in the Arctic science community. However, all years after 2006, from 2007 to 2025, have still had a lower minimum extent than all the previous years in the record from 1979 to 2006.
| RANK | YEAR | MINIMUM ICE EXTENT | DATE | |
|---|---|---|---|---|
| IN MILLIONS OF SQUARE KILOMETERS | IN MILLIONS OF SQUARE MILES | |||
| 1 | 2012 | 3.39 | 1.31 | Sept. 17 |
| 2 | 2020 | 3.82 | 1.47 | Sept. 16 |
| 3 | 2007 2016 2019 | 4.16 4.17 4.19 | 1.61 1.61 1.62 | Sept. 18 Sept. 10 Sept. 18 |
| 6 | 2024 2023 | 4.25 4.26 | 1.64 1.64 | Sept. 13 Sept. 19 |
| 8 | 2011 | 4.34 | 1.68 | Sept. 11 |
| 9 | 2015 | 4.43 | 1.71 | Sept. 9 |
| 10 | 2008 2025 2026 2010 | 4.59 4.60 4.60 4.62 | 1.77 1.78 1.78 1.78 | Sept. 19 Sept. 10 Sept. 12 Sept. 21 |
Values within 40,000 square kilometers (15,000 square miles) are considered tied.