By Jane Beitler
NSIDC and NASA data scientists proved the use of 21st-century techniques to revive data from 1960s satellites.
Archived, but not forgotten
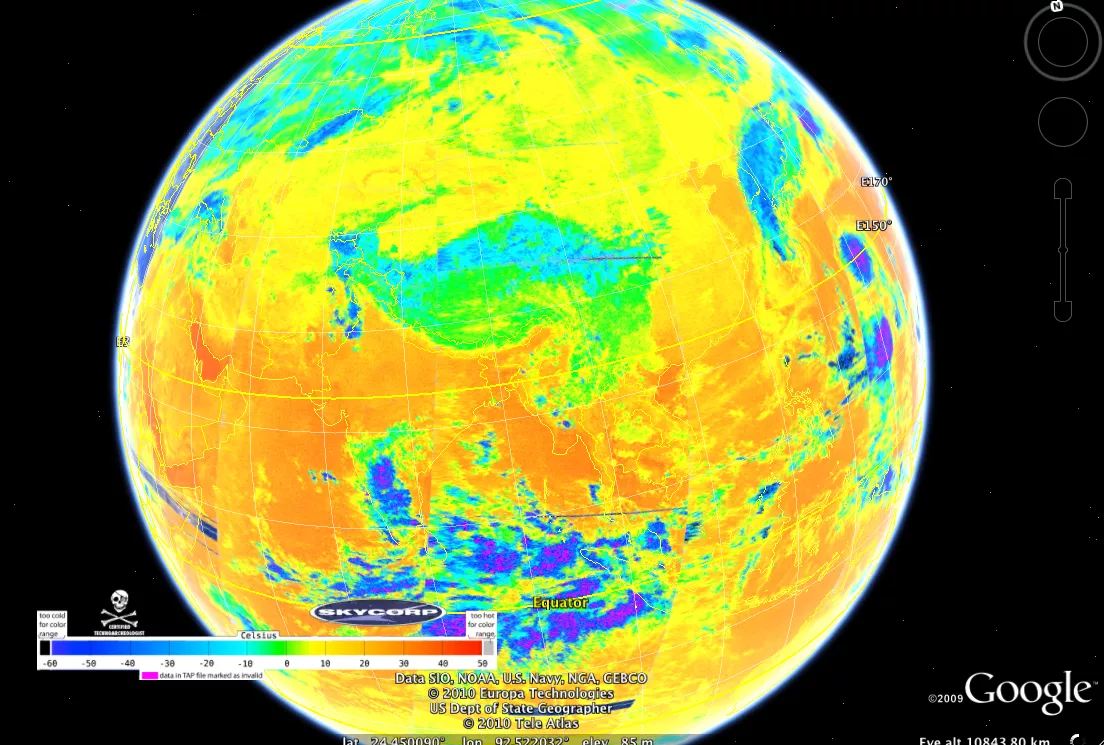
Scientists today who study polar sea ice conditions rely on satellite records reaching back to 1979. But soon, data scientists hope to extend the look back by another decade or more. Researchers at NSIDC and NASA have shown that the oldest Earth observing satellite data can be made to yield new information, adding significantly to the view of Earth's climate history. When NASA launched the first Nimbus satellite in the 1960s, they also launched an era of Earth observations from space. While the early Nimbus satellites provided meteorological and other observations, methods did not yet exist to detect features such as the margins of the sea ice cover in the Arctic and Antarctic. Even if they had, the limits of computer processing in those days would have made quantitative analysis unfeasible. These early satellite data still reside in NASA archives on archaic, two-inch tape media. When NSIDC scientist Walt Meier and project manager Dave Gallaher learned that NASA researchers had retrieved 1960s images of Earth from the Lunar Orbiter, they wondered if early NASA satellite data could also yield information about sea ice conditions before 1979. They saw a disappearing window of opportunity to recover these data. Only one tape drive remained in the world that could read the Ampex two-inch media. Plus, the original Nimbus researchers were now in their late 70s and 80s, and contact with them would be critical to answering some of the necessary instrumentation questions. Reprocessing could make new 1960s-era global data available to the entire Earth science community. The techniques could also bring the quality of archaic data from other Earth-observing satellites up to contemporary standards, reinvigorating the data sets for current applications.
Modern data science meets historic data
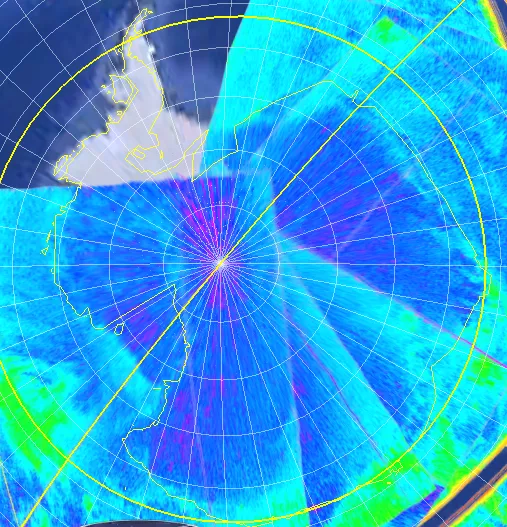
The Nimbus satellites carried a High Resolution Infrared Radiometer (HRIR), with a resolution of 8 kilometers, a medium-resolution infrared radiometer (MRIR), and an Advanced Vidcon Camera System (AVCS). Although Nimbus collected data for only short periods, Meier suspected that these early Nimbus satellites likely captured the annual Arctic sea ice minimum, occurring each September. Starting with the methods developed for the Lunar Orbiter Image Recovery Project (LOIRP) at NASA Ames Research Park, a team at NSIDC worked with Dennis Wingo at LOIRP to search NASA archives for the original Nimbus tapes containing raw images and calibrations. Their first goal was to read and reprocess the data at a higher resolution, removing errors resulting from the limits of the original processing. These tasks proved more challenging than expected, due to truncated data, missing algorithms, and other issues. But the result was a global image of the Arctic from Nimbus II, captured on September 23, 1966, in higher resolution than ever seen before from this type of data. This date falls around the time that Arctic sea ice would have reached its end-of-season minimum extent. The image demonstrates the possibility of reprocessing the entire available time series, supporting new scientific study of past conditions on Earth.
Unlocking the hoard
This proof-of-concept research was supported by an Innovative Research Program seed grant from the Cooperative Institute for Research in Environmental Science (CIRES) at the University of Colorado at Boulder, the home of NSIDC.The team now plans to apply for further research funding to expand the study. More work is needed to reprocess 2,600 half-orbit records, develop a de-jitter algorithm, and then complete a painstaking process of image comparison to separate clouds from ice. Processing of more data could allow Meier and other scientists to determine sea ice extent during the Nimbus I through III campaigns (1964, 1966, and 1969). The team also hopes to extend their methods to later instruments, and characterize both minimum Arctic and maximum Antarctic sea ice extent for 1964 to 1978. If successful, the sea ice climatologies would gain up to fourteen years of data—an increase of 50 percent over their temporal span today.


