By Jane Beitler
High above the clouds, some twenty NASA satellites circle Earth each day, measuring an astounding range of phenomena, from the minute soot particles that make up the plume of a forest fire, to the movement of massive plates of the Earth's crust. Put together, the data are an impressive long-term record of observations on Earth's environment and climate for the last 50 years. NASA is making sure these data, called Earth system data records (ESDRs), remain valid across old and new satellite missions and a myriad of sensors. The NASA Making Earth System Data Records for Use in Research Environments (MEaSUREs) program supports scientists who make these long-term ESDRs in their area of speciality. Researchers will soon be able to access several cryospheric MEaSUREs data sets via NSIDC. Ted Scambos, NSIDC's Lead Scientist, is coordinating two of the efforts at the data center. "These are critical data products that NASA-funded scientists have been generating at high precision for the past several years," he said. "Now they will be transferred to a data center, and made available to everyone."
Tapping the expertise
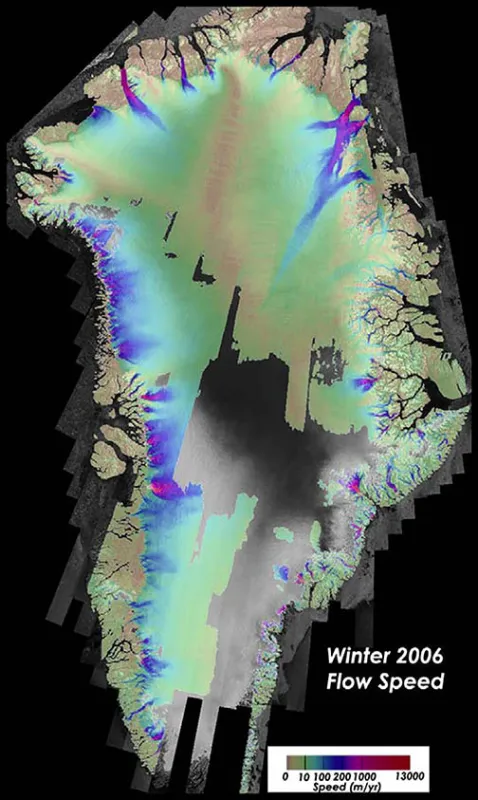
For example, Ian Joughin at the Applied Physics Laboratory at the University of Washington has been producing ice velocity maps of the Greenland Ice Sheet for nearly a decade. The data show how rapidly the ice is moving, from the ice sheet summit towards the ocean; in recent years, many areas have seen increased velocity as a result of warmer ocean water and more surface melt. Scambos said the new data will be a huge help to researchers interested in ice sheet dynamics. "The data will tell us how well models of ice sheets are doing in predicting ice flow and their net contribution to the oceans," he said. "The main result will be better models of ice sheet dynamics and glacier processes." Ultimately, these data will help in understanding climate warming and its impacts, such as the potential for sea level rise.
Data for better models
Joughin's data are now available online, while pending review by the MEaSUREs program. Researchers can also access a global record of daily freeze and thaw from 1988 to 2007, produced by John Kimball at the University of Montana Flathead Lake Biological Station, and Kyle McDonald, at the NASA Jet Prolusion Laboratory in California. This big-picture, daily look of frozen and thawing land informs research on the interactions of water, heat, and carbon on Earth's oceans and land masses. These data are also pending review. NSIDC expects to offer data sets from two other MEaSUREs projects: ice velocities in Antarctica from Eric J. Rignot at the University of California at Irvine, and snow extent in the Northern Hemisphere, from David A. Robinson at Rutgers University.
For more information and to access the data, see NASA MEaSUREs Data at NSIDC.
For more information about the NASA MEaSUREs Program, see the NASA MEaSUREs Program.
