By Agnieszka Gautier
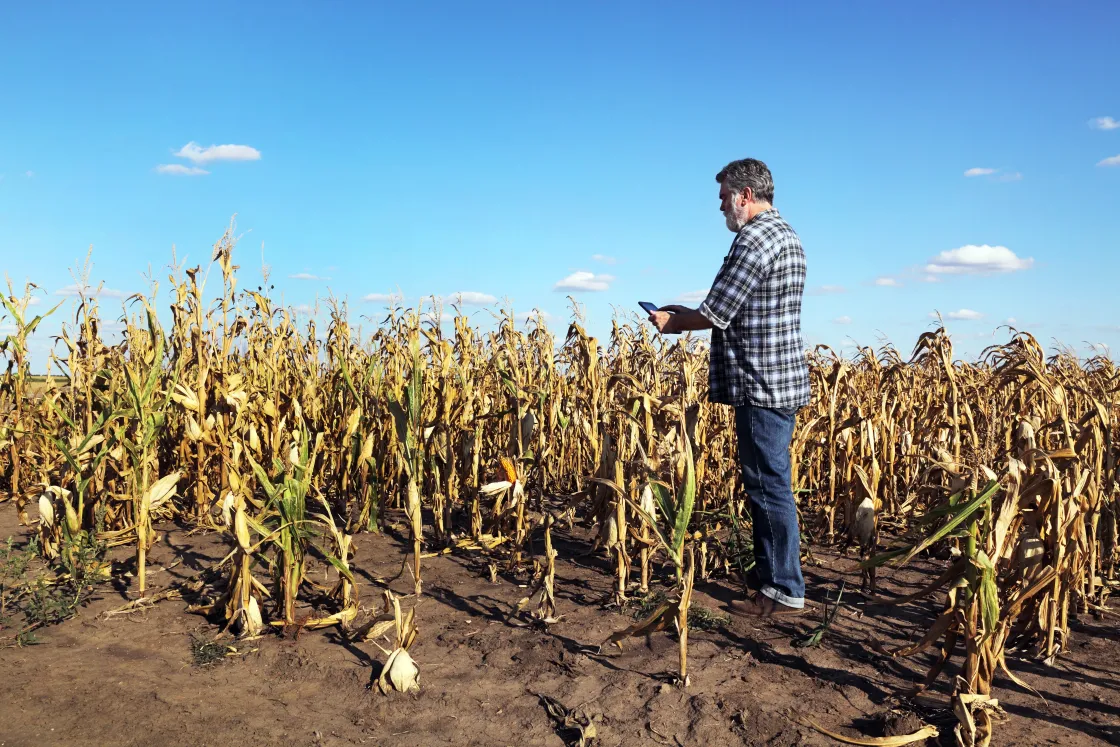
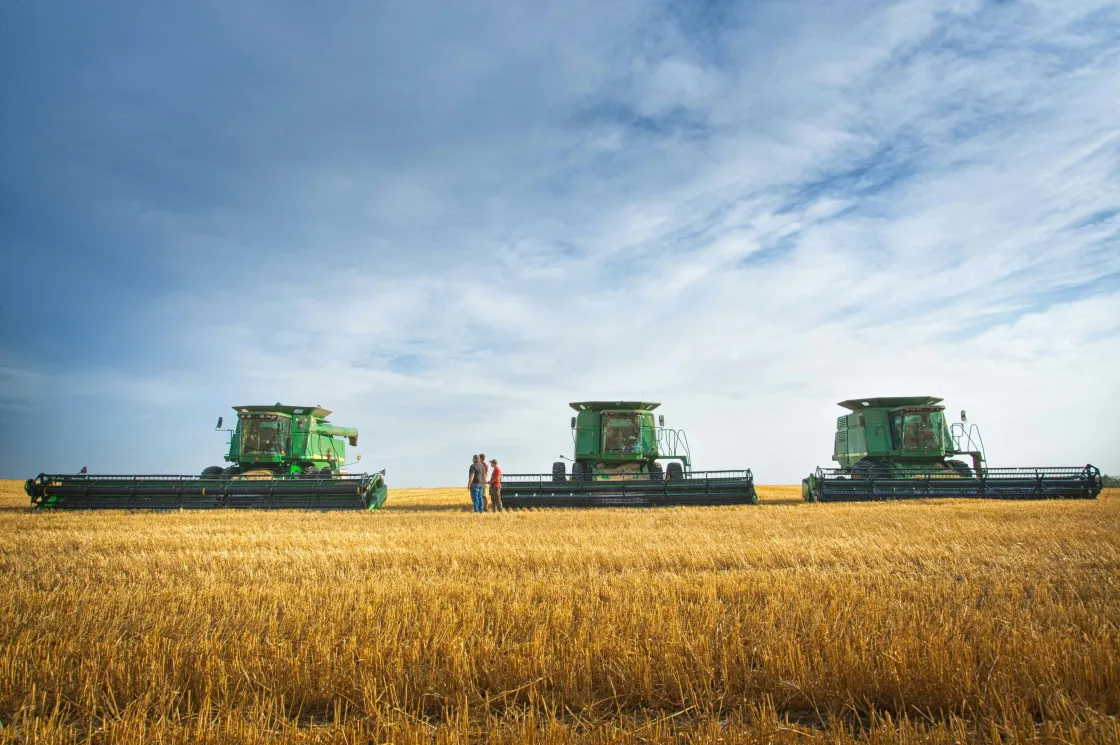
Transforming dirt into fields of orchards and food is as much a fine art as it is a science. Using their experience and generational knowledge, farmers optimize growing conditions with spacing and timing to create the best yields. Plant seeds too early, and they may not germinate as unforeseen frosts can damage seedlings. Plant seeds too late, and the yield from a shortened growing season could be cut by 10 percent or more. Farmers in the High Plains of Montana and the Dakotas sow spring wheat in late April or early May. In 2017, farmers sowed the land as usual, expecting a typical summer, but three months later, without warning, their crops were decimated.
That summer, unprecedented dry conditions—not observed in 100 years of record keeping—prevented proper seed germination and stunted growth, resulting in crop losses worth over $2.6 billion. Pasturelands dried up. A hay shortage forced ranchers to find alternative feed or sell off livestock. And dry, scorched lands were fodder for fires. In Montana alone, over 1 million acres burned.
No forecast available then could have predicted the lingering high temperatures and little rainfall to come. This rapid intensification of drought conditions, which parched the soil in a matter of days to weeks, has become known as a flash drought. Drought forecasting has typically monitored precipitation rates and temperature, along with snowmelt runoff in the western United States, but these data are only made available weekly or monthly. So, traditional weather forecasting predictability is only marginally better than a random guess.
However, soil hydrology researchers Vinit Sehgal and Binayak Mohanty have now changed that. By using NASA Soil Moisture Active Passive (SMAP) data archived at the National Snow and Ice Data Distributed Active Archive Center (NSIDC DAAC), their team has brought drought forecasting to near real-time. In a first, farmers, water resource managers, and communities can be alerted to a flash drought on the horizon. So then, they can mitigate its effects through adaptive measures such as irrigation, alternative seeding methods and timing, pest management, and tillage.
What you see is not what you get
Mohanty, a distinguished professor at Texas A&M University, had a vision of making satellite soil moisture data equally accessible to all public stakeholders for improving their economic and social well-being. Sehgal, a PhD student with him at the time and now an assistant professor at Louisiana State University, realized that SMAP data may have untapped potential to monitor drought. “We had a lot of satellite soil moisture data, but the practical application of that data was missing,” Sehgal said. Sehgal teamed up with Nandita Gaur—an assistant professor of soil physics at the University of Georgia—to help make sense of the data.
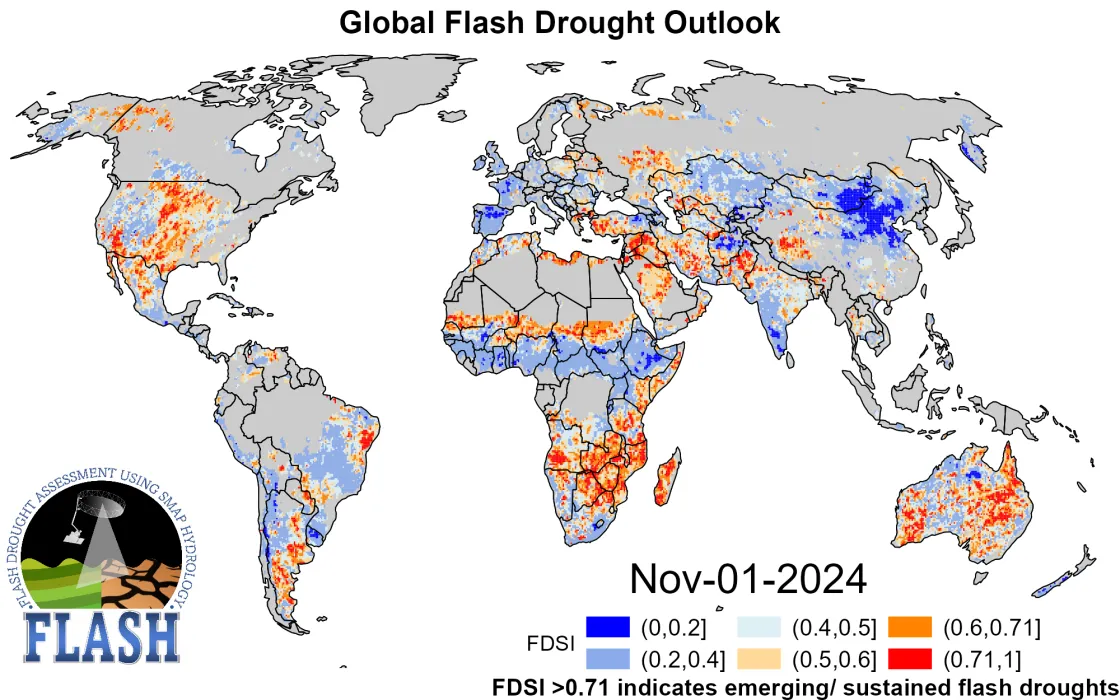
Ultimately, they ended up using SMAP surface moisture observations from 2015 to 2021 to build a powerful data visualization tool called FLASH or Flash drought Assessment using SMAP Hydrology. FLASH displays a daily, global map marking potential areas for burgeoning flash droughts in near real-time.
This map displays the potential for a flash drought based on the Flash Drought Stress Index (FDSI) for November 1, 2024. Cooler colors have a lower FDSI value, indicting less potential for a flash drought; warmer colors have a higher FDSI value, indicating more potential for a flash drought. — Credit: Vadose Zone Research Group, Texas A&M University
This map displays the potential for a flash drought in the United States on November 1, 2024. Cooler colors indicate less potential for a flash drought; warmer colors indicate more potential for a flash drought. — Credit: Vadose Zone Research Group, Texas A&M University
But challenges arose when building FLASH because the team had to work around SMAP’s limitations. For one, SMAP measures only the top 5 centimeters (2 inches) of soil moisture with a large 36-square kilometer spatial resolution. This information is not useful for most farmers, who want to know moisture levels in small areas much deeper down at the root zone, typically 25 centimeters to 30 centimeters (10 to 12 inches) below the surface. Farmers assess the root zone to know when, how often, and how much to irrigate. Yet in field methods to do so are costly and not available to many, while SMAP cannot measure that deeply.
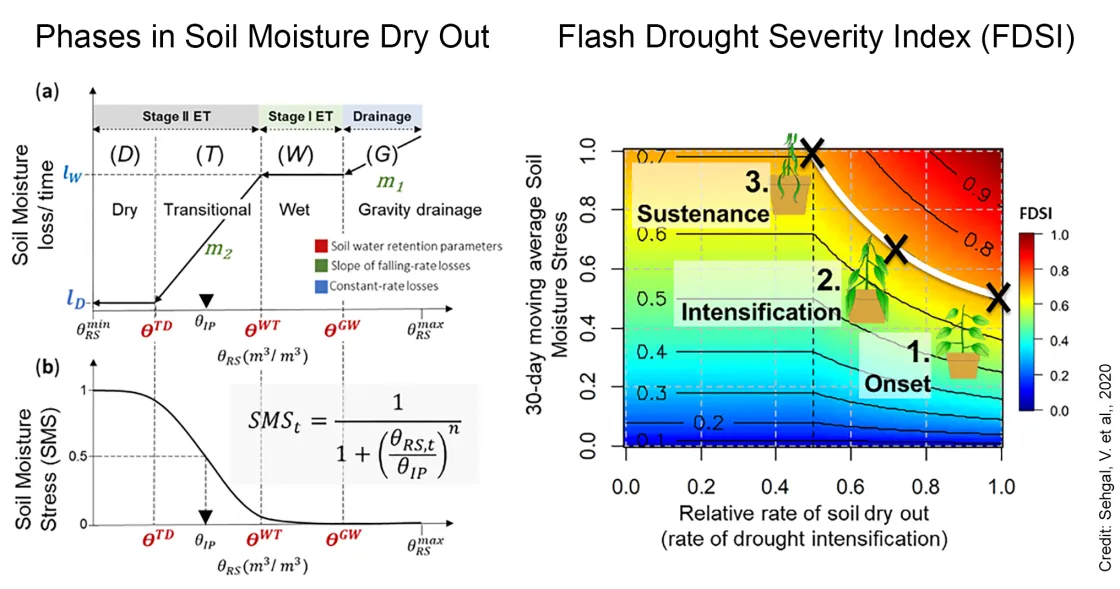
How could SMAP data be made useful to farmers then? Gaur was skeptical that near-surface soil moisture data could reliably say something about the vegetation. But to her surprise, FLASH showed strong correlations between soil moisture and vegetation thanks to an index she helped Sehgal develop. The Flash Drought Stress Index (FDSI) drives the output for the FLASH maps. It is based on a numerical range from 0 to 1, with 0 equating to fully saturated soil and 1 to dried out soil. What the team needed now was to determine what value between 0 and 1 could warn of a developing flash drought.
Waiting for soil to dry
To get that value, the team needed to know more about the relationship between soil and vegetation. “If you understand soil processes better, you can tease out much more information than just the moisture value that the satellite gives you,” Sehgal said. Together, the team identified two critical transition points, known in soil physics as the critical and wilting points, to gauge how the soil wetness conditions were changing and when to potentially sound the alarm.
The critical point occurs when plants get so stressed that they have to work harder to extract water; the wilting point occurs when plants become limp. “Plants cannot survive the wilting point,” said Sehgal. “You’ll see a mass dry off event when the soil reaches that threshold.” So, the team needed to know a value within the data where the soil would inevitably head toward the wilting point, offering a warning in near real-time to farmers, water resource managers, and communities.
To get that numerical value, the team also needed to know the rate of moisture loss or how quickly the soil transitioned from the critical to wilting point. But this rate of soil stress buildup is not consistent; it depends on its starting condition and meteorological factors. “For instance, if the soil is wet, it will dry faster,” said Sehgal. “When the soil is drier, it will start to dry slowly.”
To get the dry out rates, the team first labeled each pixel, a 36-kilometer-by-36-kilometer area, as having average, dry, or saturated conditions regardless of the complexity in landscape or moisture. “We decided, let's just take each pixel for what it is,” Gaur said. “It's a mixed signal that is still telling us something about the ecosystem within that.” The dry down rates combined with environmental conditions resulted in the index identifying a threshold of 0.71 as the numerical equivalent for when a particular ecosystem was heading into a flash drought. “If the soil is drying faster and it is already in the dry regime, that means your drought is going to build up much faster and you are heading into a flash drought,” Sehgal said.
Seeing beyond the canopy
Though FLASH has been out for three years now, Sehgal is still surprised by how few people know about flash droughts. The worry is that the pace of public awareness is lagging behind rapid environmental change. “Droughts used to be a creeping phenomenon,” Sehgal said, “but they’re not creeping at all; they're accelerating.” So, farmers need to stay more alert than even a few decades ago. With climate change, weather patterns have gone amuck. Climate variability is increasing. “The same is true of the hydrological cycle,” Sehgal added. “Because everything is connected, one place will get more moisture, while another gets less. Previously, change would be gradual; now things are either heating up way too fast or getting wet way too fast.”
Climate variability leads to crop failures that eventually reach consumers’ pocketbooks. The United States is highly competitive in global wheat exports, toggling between first and second place with Russia. Montana ranks fourth in US wheat production, behind Kansas, North Dakota, and Oklahoma. Agriculture in North Dakota is an $11 billion a year industry, and the state leads in production of nearly a dozen crops. Extreme weather, including heat waves, flash droughts, and floods, is already linked to the rising cost of food, with the problem expected to get much worse in the future.
When attending drought conferences, Sehgal kept hearing from farmers that a two- to three-week lead would be ideal, allowing them to act before crops hit the unforgiving wilting point. Once FLASH raises an alarm, vegetation shows visible signs of stress within two weeks. “In recent years, weather is fine a given week, and within two weeks, things turn to catastrophe.” This happened in Sehgal’s home state of Louisiana, where a flash drought in 2023 cost the state $290 million in agriculture. Unfortunately, FLASH doesn’t work everywhere, including about 90 percent of Louisiana, which is cut off from the FLASH map because of SMAP's inability to accurately read soil moisture in areas with dense plant cover. All SMAP sees is water. If there is a canopy, like much of Louisiana, the plants and trees hold water as well as the soil, but there is no current algorithm to isolate soil moisture. Sehgal hopes to expand the map in the future to include these high uncertainty landscapes using improved coverage of ground sensors across the state.
Despite these limitations, the team has come a long way with FLASH and SMAP data from offering no hope in drought forecasting, to now being able to prepare many communities. “Because in the case of flash droughts,” Sehgal said, “if you wait too long, you have already lost.”
Access data through the NSIDC DAAC
NASA’s NSIDC DAAC manages, distributes, and supports a variety of cryospheric and climate-related datasets as one of the discipline-specific Earth Science Data and Information System (ESDIS) data centers within NASA’s Earth Science Data Systems (ESDS) Program. User Resources include data documentation, help articles, data tools, training, and on-demand user support. Learn more about NSIDC DAAC services.
NASA NSIDC DAAC data highlighted in this article include: SMAP L3 Radiometer Global Daily 36 km EASE-Grid Soil Moisture
This Level-3 (L3) soil moisture product provides a composite of daily estimates of global land surface conditions retrieved by the Soil Moisture Active Passive (SMAP) passive microwave radiometer.
For more information
Reference
O'Neill, P. E., S. Chan, E. G. Njoku, T. Jackson, R. Bindlish, and J. Chaubell. 2020. SMAP L3 Radiometer Global Daily 36 km EASE-Grid Soil Moisture. (SPL3SMP, Version 7). [Data Set]. Boulder, Colorado USA. NASA National Snow and Ice Data Center Distributed Active Archive Center. doi:10.5067/HH4SZ2PXSP6A.
Sehgal, V., N. Gaur, and B. P. Mohanty. 2021. Global flash drought monitoring using surface soil moisture. Water Resources Research, 57, e2021WR029901. doi:10.1029/2021WR029901.


