By Michon Scott
Most people who know about the National Snow and Ice Data Center (NSDIC) are familiar with the data center’s role in monitoring snow, sea ice, mountain glaciers, ice sheets, icebergs, and other features of the Earth's cryosphere. Snow and ice might seem distant—in both location and seasonal relevance—but data archived and distributed by NSIDC also touch the everyday lives of people far from the polar regions and outside of winter.
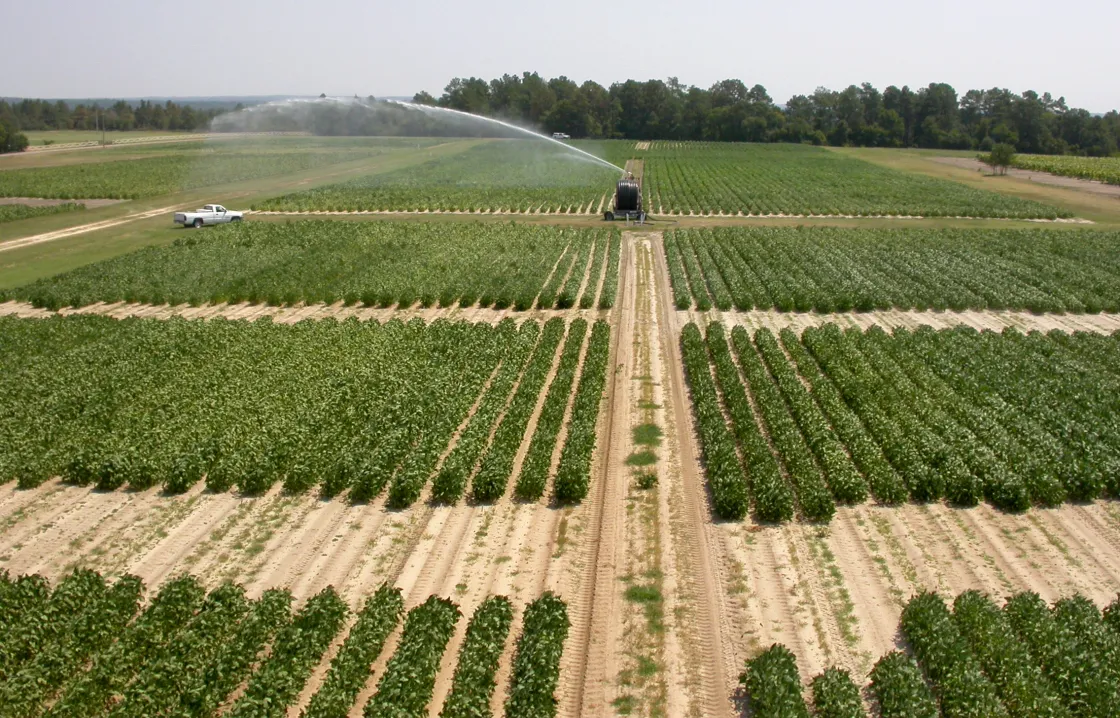
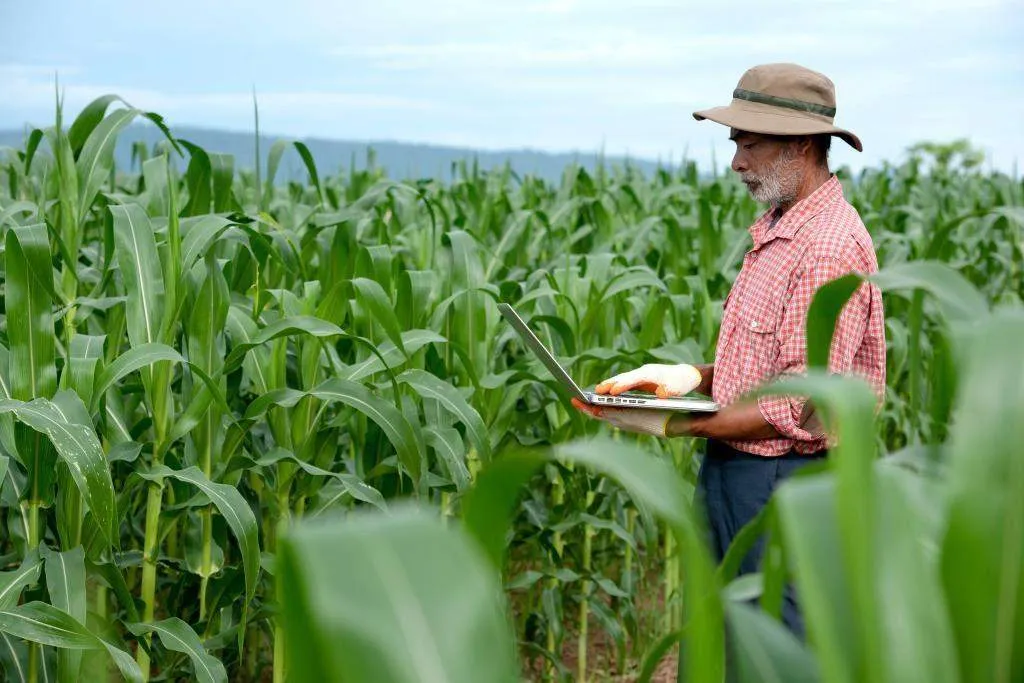
Beyond snow and ice data, the NASA NSIDC Distributed Active Archive Center (DAAC) archives and distributes soil moisture data sets that directly support American agriculture. These data help farmers, water managers, municipalities, and interested citizens understand how much moisture is available in the soil, a key variable for crop health, irrigation decisions, and drought response. Whether you're growing wheat in Kansas, peanuts in Georgia, or soybeans in Illinois; soil moisture data can provide a real-time snapshot of conditions in the soil, helping you plan smarter and adapt faster.
Challenges to measuring soil moisture from space
NASA launched the Soil Moisture Active Passive (SMAP) satellite in 2015. The mission was originally designed with two types of instruments: an active radar and a passive radiometer. The radar would bounce microwave pulses off the planet’s surface and record what bounced back to the sensor. The mission’s radiometer would measure microwave emissions from our planet, receiving electromagnetic wavelengths longer than visible light but shorter than radio waves.
Passive reception of microwaves requires an antenna so large that it would be extremely difficult to launch on a satellite. SMAP planners overcame this obstacle by designing a mesh antenna that could be folded up like an umbrella and later unfold after launch. SMAP’s antenna is a whopping 6 meters (20 feet), roughly the height of a two-story house.
SMAP began operating in April 2015, but by July of that year, a problem arose. The radar instrument stopped transmitting data. Fortunately, the radiometer kept working. Scientists specializing in passive microwave and soil moisture have found multiple workarounds. One workaround includes a data set that incorporates Sentinel data. Another workaround includes a data set that captures observations with the radar’s receiver mode. Yet another workaround entails developing robust algorithms to retrieve soil moisture from radiometer data. So, even without radar data, the SMAP science team managed to fulfill the mission’s purpose.
Making sense of soil
Translating microwave signals into useful soil moisture estimates requires context: What type of surface is being observed? Using SMAP observations to identify soaked soil, parched soil, and states in between require information about other factors, such as surface type (forest, urban, agriculture, or something else), elevation, characteristics of the soil such as the amount of sand it contains, temperature, precipitation, and so on. With this ancillary information, scientists can use SMAP observations to determine soil moisture levels.
At present, the NSIDC DAAC distributes nearly 30 SMAP data sets, along with many more validation and related data sets. Some SMAP data sets are routinely used, such as SMAP Enhanced L2 Radiometer Half-Orbit 9 km EASE-Grid Soil Moisture and SMAP L4 Global 9 km EASE-Grid Surface and Root Zone Soil Moisture Land Model Constants, to support crop monitoring and management.
USDA puts SMAP to work
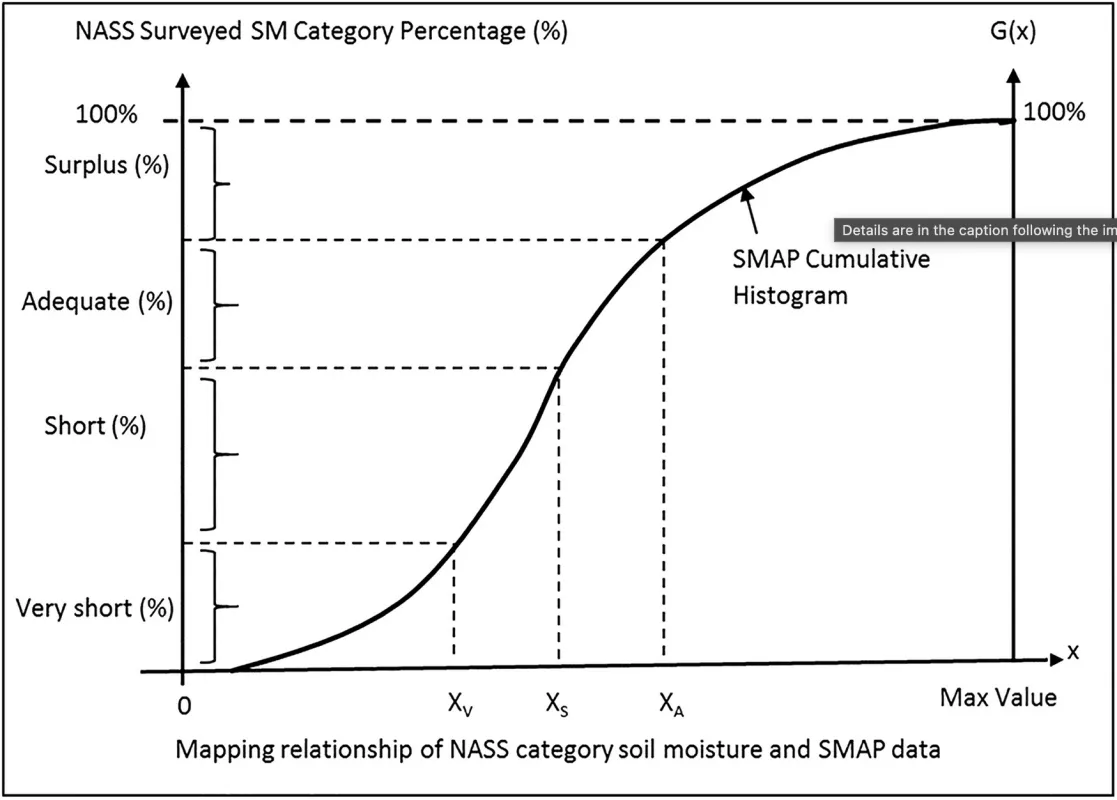
Scientists Zhengwei Yang and Rick Mueller with the US Department of Agriculture (USDA) National Agricultural Statistics Service (NASS) saw promise in SMAP’s capabilities. In 2019, they coauthored a study with NASA and MIT scientists confirming that SMAP data aligned closely with long-standing NASS soil moisture categories used in weekly crop surveys.
For many years, NASS has relied on a vast volunteer network to assess crop progress during the growing season. Each year, weekly reports start in early April and continue through November, assembled from surveys completed by an army of dedicated volunteer surveyors. The reports span metrics on a variety of crops: corn, cotton, peanuts, soybeans, and wheat, for instance. Progress assessments cover status, such as planted, emerged, and harvested. The reports also address crop conditions, ranging from very poor to excellent. The reports also discuss soil moisture, sorted into four categories. From highest to lowest, those categories include:
- Surplus: wet soil that cannot absorb much more moisture, if any
- Adequate: moist soil in which seed germination and crop growth are unimpeded
- Short: dry soil that limits germination and growth
- Very Short: soil so dry that normal plant growth is highly unlikely and plants show signs of stress
NASS defines soil layers as follows:
- Topsoil: top 15 centimeters (6 inches)
- Subsoil: soil between 15 centimeters (6 inches) and 91 to 122 centimeters (3 to 4 feet) below ground
Soil layer depths, the 2019 study authors pointed out, were largely consistent between SMAP data and NASS reports. They further found a fit between how SMAP measures soil moisture and how volunteers and NASS reports categorize soil moisture, ranging from surplus to very short.
Study authors also found that relying on SMAP data could simplify an important aspect of field reporting. To assess subsoil moisture, volunteers completing the weekly surveys occasionally dig holes about 15 centimeters (6 inches) below the surface. SMAP’s ability to see below the surface does its own “digging.”
The findings of the 2019 study were well received. NASS began incorporating SMAP soil moisture observations in crop progress reports in April 2021. The data supplements other reporting methods. “Our volunteer reporters are the primary and sole source that provide weekly assessments of crop progress and condition,” Yang and Mueller explained in an email. NASS incorporated SMAP data for soil moisture assessments. Currently, state-level data are available through the CropCASMA web tool.
From satellites to farms: Crop-CASMA
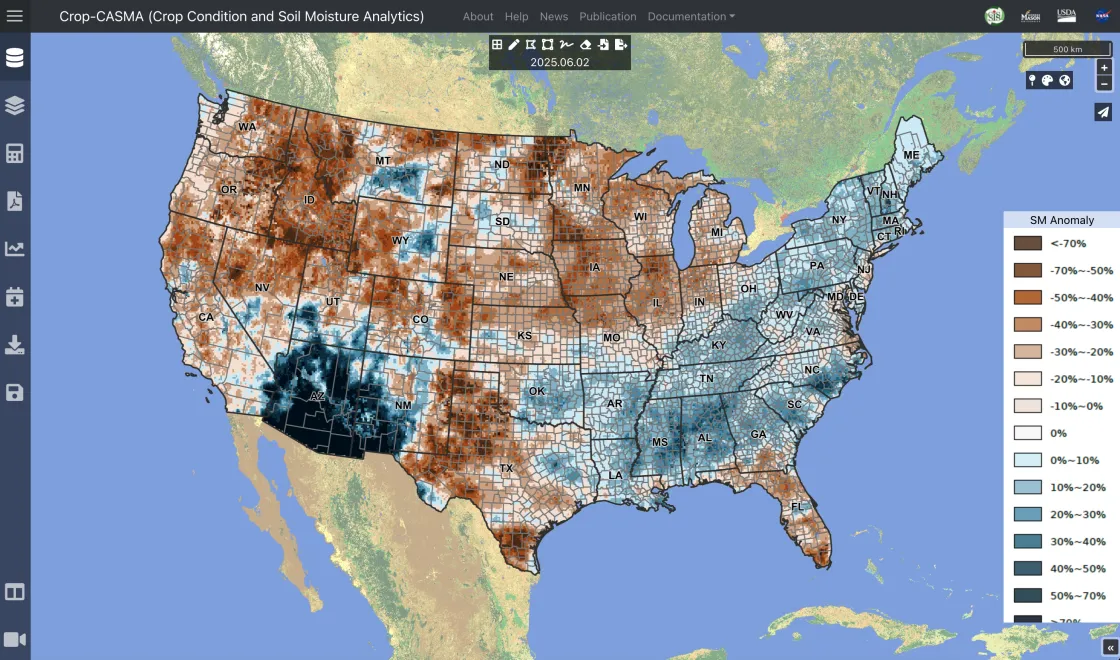
To bring these data directly to users, NASS collaborated with George Mason University and NASA to build the Crop Condition and Soil Moisture Analytics Tool (Crop-CASMA), a free interactive visualization tool anyone can access through a web browser. It pulls from SMAP data archived at the NSIDC DAAC.
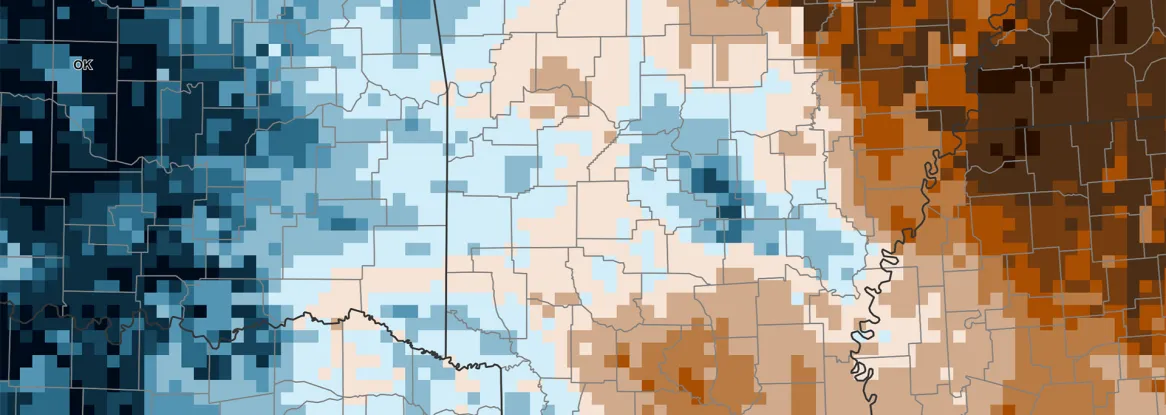
Anyone with Internet access can use Crop-CASMA to visualize soil moisture conditions. Users can zoom in or out to the desired level of detail across the country. Soil moisture data appear at a 9-kilometer resolution, providing significant detail even when zoomed in to county level. The tool shows soil moisture as the difference from average soil moisture levels calculated since 2015. Farmers can zoom into their region, see how this year’s conditions compare to historical averages, and make better-informed decisions about irrigation, planting, and crop management. The user guide offers details on tool use and interpretation.
Crop-CASMA does more than provide convenient online access to soil moisture data. The tool also helps fill the occasional gaps in weekly reporting. Volunteer surveyors are diligent, but life intervenes, so not every inch of every crop gets assessed in every weekly survey. “Our regional field office staff can use Crop-CASMA to fill in for non-response areas,” Yang and Mueller wrote. Crop-CASMA developers matched the crop-modeling week to the NASS crop-reporting week, which runs from Monday through Sunday, so filling in gaps is straightforward in terms of reporting periods.
Crop-CASMA provides another advantage. “SMAP data provides the locational information of crop soil moisture conditions at a finer granularity, which is not available to customers from traditional NASS reports,” Yang and Mueller wrote. Although it does not provide information on crop progress or condition, Crop-CASMA provides an independent, objective assessment of soil moisture throughout the growing season.
When disaster strikes
Soil moisture not only help farmers identify the optimal time for planting or irrigation; these data also help farmers and their neighbors prepare for oncoming disasters. Some growing seasons progress smoothly, while disasters hamper others. Helping predict and manage soil moisture anomaly events count among SMAP’s science objectives, whether the event leaves soil drenched or parched.
The main issue that comes to mind with a hurricane might be wind, but flooding often causes the greatest devastation. Soil moisture data can provide insights on how saturated the ground is, and how long the excess water takes to depart. Ahead of an approaching storm, soil moisture data can improve flood prediction. At the other end of the moisture spectrum, soil moisture data can improve prediction of drought risk, especially for flash droughts that can occur suddenly. Droughts do more than just harm crops; they also raise the risk of wildfires.
When disasters strike, NASS leverages SMAP data to provide near-real-time monitoring of disasters to determine the impact on crops. For example, NASS used Crop-CASMA to assess the disaster impact on cropland inflicted by in July 2025 by Tropical Storm Barry. In the early morning of July 4, the storm caused catastrophic flooding across parts of Texas. Within weeks, the official death toll had passed 130 and was expected to continue rising.
The NSIDC DAAC offers additional SMAP data sets useful to natural hazards planning and response, such as Near Real-time SMAP L1B Radiometer Half-Orbit Time-Ordered Brightness Temperatures. and Near Real-time SMAP L2 Radiometer Half-Orbit 36 km EASE-Grid Soil Moisture.
Future plans
“The weekly crop progress report is our most popular continuous weekly report and SMAP data provides a unique independent perspective on soil moisture availability,” Yang and Mueller wrote. “As we work to expand soil moisture monitoring across the United States within our regional field offices, Crop-CASMA provides an efficient means to disseminate and monitor national soil moisture conditions.”
The European Space Agency operates the Soil Moisture and Ocean Salinity (SMOS) mission, which observes the same general phenomena as SMAP, but at lower resolution. The NSIDC DAAC recently released a soil moisture data product that combines SMOS and SMAP data. The SMAP satellite passes over the same place on Earth every two to three days—a “revisit” interval of two to three days. The data set incorporating SMOS data, SMAP/SMOS L3 Radiometer 9 km EASE-Grid Soil Moisture, provides a revisit interval of one day. The temporal converge for this product spans May 1, 2015, though December 31, 2021, and therefore does not include the latest observations.
Extreme weather events intensify the severity and/or suddenness of floods, such as the Texas flood in July 2025, and even droughts that come on suddenly, making growing conditions harder to predict. In this environment, tools such as SMAP and Crop-CASMA offer farmers rare benefits: clarity and accessibility. SMAP data archived at the NSIDC DAAC turn satellite signals into actionable insights for the farmers who feed the nation. The data provides a lifeline for agriculture, resilience, and informed decision making in a changing world.
Whether monitoring extreme weather events or long-term conditions, NASA’s WorldView provides a convenient way to visualize SMAP data.
Access data through the NSIDC DAAC
NASA’s NSIDC DAAC manages, distributes, and supports a variety of cryospheric and weather-related data sets as one of the discipline-specific Earth Science Data and Information System (ESDIS) data centers within NASA's Earth Science Data Systems (ESDS) Program. User Resources include data documentation, help articles, data tools, training, and on-demand user support. Learn more about NSIDC DAAC services.
NASA NSIDC DAAC data highlighted in this article include:
Reichle, R., De Lannoy, G., Koster, R.D., Crow, W.T., Kimball, J.S. & Liu, Q. (2021). SMAP L4 Global 9 km EASE-Grid Surface and Root Zone Soil Moisture Land Model Constants. (SPL4SMLM, Version 6). [Data Set]. Boulder, Colorado USA. NASA National Snow and Ice Data Center Distributed Active Archive Center. https://doi.org/10.5067/MWAFPGI1KMMH.
Das, N., Entekhabi, D., Dunbar, R. S., Kim, S., Yueh, S., Colliander, A., O'Neill, P. E., Jackson, T., Jagdhuber, T., Chen, F., Crow, W. T., Walker, J., Berg, A., Bosch, D., Caldwell, T. & Cosh, M. (2020). SMAP/Sentinel-1 L2 Radiometer/Radar 30-Second Scene 3 km EASE-Grid Soil Moisture. (SPL2SMAP_S, Version 3). [Data Set]. Boulder, Colorado USA. NASA National Snow and Ice Data Center Distributed Active Archive Center. https://doi.org/10.5067/ASB0EQO2LYJV.
O'Neill, P. E., Chan, S., Njoku, E. G., Jackson, T., Bindlish, R. & Chaubell, J. (2022). Near Real-time SMAP L2 Radiometer Half-Orbit 36 km EASE-Grid Soil Moisture. (SPL2SMP_NRT, Version 107). [Data Set]. Boulder, Colorado USA. NASA National Snow and Ice Data Center Distributed Active Archive Center. https://doi.org/10.5067/NCTT8THPWRTL.
Piepmeier, J. R., Mohammed, P., Peng, J., Kim, E. J., De Amici, G., Chaubell, J. & Ruf, C. (2022). Near Real-time SMAP L1B Radiometer Half-Orbit Time-Ordered Brightness Temperatures. (SPL1BTB_NRT, Version 105). [Data Set]. Boulder, Colorado USA. NASA National Snow and Ice Data Center Distributed Active Archive Center. https://doi.org/10.5067/UH70WUPQKCFR.
Rodriguez-Alvarez, N., Munoz-Martin, J. F., Bosch-Lluis, X. & Oudrhiri, K. (2024). SMAP L1B Polarimetric GNSS Reflectometry. (NSIDC-0795, Version 1). [Data Set]. Boulder, Colorado USA. NASA National Snow and Ice Data Center Distributed Active Archive Center. https://doi.org/10.5067/ZF4OXSD2NS7W.
Reference
Colliander, A., Z. Yang, R. Mueller, A. Sandborn, R. Reichle, W. Crow, D. Entekhabi, and S. Yueh. 2019. Consistency between NASS surveyed soil moisture conditions and SMAP soil moisture observations. Water Resources Research 55(9): 7682-7693. doi:10.1029/2018WR024475
