By Jane Beitler
Stringing around the Arctic for tens of thousands of miles, the edges of the sea ice pack are a maker of seasons and ecosystems. As seasons and climate and local weather change, so does the position of the ice edge. Until now, the satellite view of sea ice extent for climate studies has been too panoramic for studying the ice edge, and ice charts for navigation have been too close-up. But a new marriage of these data promises to provide that just-right view.
The cold locker
Butterfly sightings may signal spring in mid-latitudes, but in the Arctic, it is the sight of open water along the coasts, as sea ice begins to recede. Travel over the ice ceases, and travel over the water may, at some peril, begin. The ice edge teems with phytoplankton, anchoring a longer food chain: fish, and the seals that eat them, and the polar bears that eat seals. The ice locks to the shore in winter, allowing man and beast to travel quickly over the smooth, solid ice pack.
Local weather and longer-term changes in climate can move that edge and its dependents. Can fauna and humans adapt? What if polar bears need to swim farther to reach the ice edge? What if the hunting season for humans ends earlier, because the ice has opened more quickly? Will shorter shipping routes over the Arctic create new economies, and alter political balances? These are only some of the questions that call for better data on sea ice edges.
Where is Arctic sea ice NOW?
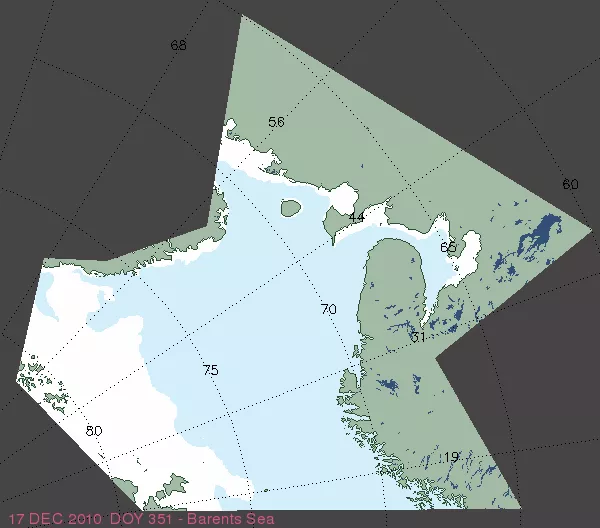
To give the best available Arctic-wide answer to the question,"Where is Arctic sea ice NOW?" NSIDC worked with the U.S. National Ice Center to create MASIE (may-zee), the Multisensor Analyzed Sea Ice Extent project. MASIE lets you view and download several kinds of data about sea ice edge:
- Northern Hemisphere-wide sea ice coverage for yesterday and the last four weeks
- Sea ice coverage by region
- A file of sea ice extent, in square kilometers, for the entire Northern Hemisphere and by region for the last four weeks, updated daily
- Convenient formats: georeferenced image (GeoTIFF), compressed image (PNG), GIS-ready (shapefile), and Google Earth (KMZ)
MASIE is similar to NSIDC's Sea Ice Index (SII) product: it is easy to use and gives a graphical view of ice extent in various formats. However, the SII uses only low-resolution satellite passive microwave data. As a result, the monthly average product is a consistently processed 30+ year record, good for climate studies, but the daily product can be off by tens or hundreds of kilometers in tracking any specific ice edge. In contrast, MASIE relies more on visible imagery than on passive microwave data.
MASIE takes advantage of important features of the daily 4-kilometer sea ice component of the National Ice Center (NIC) Interactive Multisensor Snow and Ice Mapping System (IMS) product: visible and radar imagery, passive microwave data, NIC weekly analysis products and other data that are combined via intensive daily manual analysis at the NIC.
MASIE processes the data to provide an accessible, rolling view of ice edge position. MASIE and the Sea Ice Index fill a need for immediate information over several temporal scales. A FAQ explains when to use MASIE and when to use the SII, and directs users to operational sources if needed. As of December 2010, MASIE launches with Northern Hemisphere data, but soon the team plans to release data for the Southern Hemisphere as well. MASIE was developed with support from NIC and the Naval Oceanographic Office, and is hosted by the NOAA at NSIDC project. We are seeking funding for its long-term maintenance.
For more information on NOAA at NSIDC, see the NOAA at NSIDC page.
For more information on MASIE and to access MASIE data, see the MASIE Home Page.
