The year 2006 continues the pattern of sharply decreasing Arctic sea ice, raising further concern that the Arctic is responding to greenhouse warming. NSIDC Senior Research Scientist Mark Serreze said, “If fairly cool and stormy conditions hadn’t appeared in August, slowing the rate of summer ice loss, I feel certain that 2006 would have surpassed last year’s record low for September sea ice.”
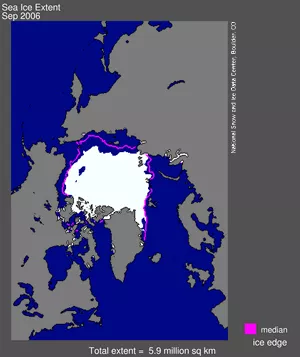
On September 14, the melting season came to a close. On this day, known as the sea ice minimum, sea ice covered 5.7 million square kilometers (2.2 million square miles) of the Arctic, the fourth lowest of the twenty-nine-year satellite record for a single day. The average sea ice extent for the entire month of September was 5.9 million square kilometers (2.3 million square miles), the second lowest on record, missing the 2005 record by 340,000 square kilometers (131,000 square miles). Sea ice extent is the sum of all regions where ice covers at least 15 percent of the ocean surface.
Figure 1 shows average ice extent for September 2006; the magenta line indicates average September conditions over the long-term record. In nearly all areas, sea ice retreated well north of where it should have been in a typical September, continuing the pattern of dwindling September sea ice.
Including 2006, the September rate of sea ice decline is now approximately –8.59 percent per decade, or 60,421 square kilometers (23,328 square miles) per year. NSIDC Research Scientist Julienne Stroeve said, “At this rate, the Arctic Ocean will have no ice in September by the year 2060." The loss of summer sea ice does not bode well for species like the polar bear, which depend on the ice for their livelihood, she said.
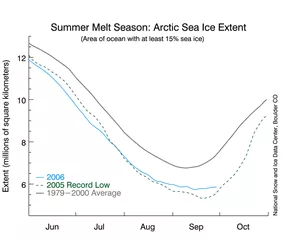
Ice extent from January through the middle of July 2006 was well below 2005 conditions, which, if it had continued, would have led to a new record low. Figure 2 shows a timeline of sea ice extent from June through October; the solid blue line that indicates 2006 trails beneath the dashed line of 2005 until mid-July.
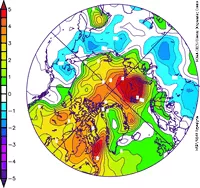
The low sea ice through mid-July was consistent with the very warm air temperatures that scientists were also tracking in the Arctic (see Figure 3). Serreze said, “High temperatures over the winter helped limit ice growth so that less ice formed. Much of the ice that did grow was probably thinner than normal. Unusually high temperatures through most of July then fostered rapid melt—a bad combination, as far as the sea ice was concerned.”
However, air temperatures dipped a bit lower in August. "August broke the Arctic heat wave and slowed the melt, and storm conditions led to wind patterns that tend to spread the existing ice over a larger area," Serreze said. Then, in September, temperatures returned to the above-normal pattern. The warmer temperatures have meant a slow recovery from the September minimum; the slow recovery of the sea ice is seen in the flat line in Figure 2. At this rate, sea ice may set a new record, this time for lowest October sea ice extent, Serreze said.
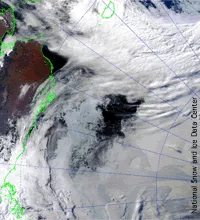
Another notable feature of the 2006 melt season was the development of a large polynya, or area of persistent open water surrounded by sea ice, north of Alaska (see Figure 4). Research scientist Walt Meier said that near its largest, in early September, the polynya was the size of the state of Indiana. How the polynya formed is still not clear. Unusual wind patterns may have forced the ice cover to spread apart. Scientists also speculate that thin ice moved into the area over the winter, melting out over the summer and creating the polynya. Another possibility is that warm waters rose to the surface, helping melt the ice.
The team felt it would be irresponsible to attribute the polynya to greenhouse warming. “However, as the ice continues to thin with increasing climate warming, we may see features like this more often,” Meier said.
NSIDC Lead Scientist Ted Scambos added, “Arctic sea ice is an important climate indicator because it's so sensitive to this initial warming trend.” As sea ice melts in response to rising temperatures, it creates a positive feedback loop: melting ice means more of the dark ocean is exposed, allowing it to absorb more of the sun’s energy, further increasing air temperatures, ocean temperatures, and ice melt. The observed changes in the ice cover indicate that this feedback is now starting to take hold. Sea ice is only one indicator of Arctic change amongst many, such as warming of permafrost, changing patterns of vegetation from tundra to shrubs, a warming ocean, and accelerated melt of the Greenland ice sheet.
Given the especially steep decline of sea ice since 2002 and the record low in September 2005, scientists at NSIDC have been closely monitoring this year’s sea ice conditions, posting new images and commentary in online updates throughout the end of the melt season. NSIDC plans to continue to watch the sea ice and report on milestones in the coming year.
“I’m not terribly optimistic about the future of the ice,” Serreze said. “Although it would come as no surprise to see some recovery of the sea ice in the next few years—such fluctuations are part of natural variability—the long-term trend seems increasingly clear. As greenhouse gases continue to rise, the Arctic will continue to lose its ice. You can’t argue with the physics.”


