This is a press release from the National Snow and Ice Data Center (NSIDC), which is part of the Cooperative Institute for Research in Environmental Sciences at the University of Colorado at Boulder.
Media Relations Contact: press@nsidc.org or +1 303.492.1497
At the end of the Arctic summer, more ice cover remained this year than during the previous record-setting low years of 2007 and 2008. However, sea ice has not recovered to previous levels. September sea ice extent was the third lowest since the start of satellite records in 1979, and the past five years have seen the five lowest ice extents in the satellite record.
NSIDC Director and Senior Scientist Mark Serreze said, “It’s nice to see a little recovery over the past couple years, but there’s no reason to think that we’re headed back to conditions seen back in the 1970s. We still expect to see ice-free summers sometime in the next few decades.”
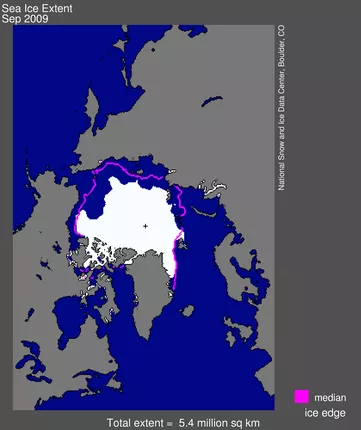
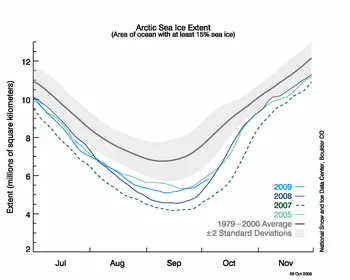
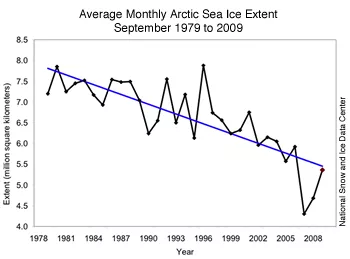
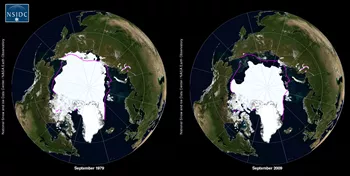
The average ice extent over the month of September, a reference comparison for climate studies, was 5.36 million square kilometers (2.07 million square miles) (Figure 1). This was 1.06 million square kilometers (409,000 square miles) greater than the record low for the month in 2007, and 690,000 square kilometers (266,000 square miles) greater than the second-lowest extent in 2008. However, ice extent was still 1.68 million square kilometers (649,000 square miles) below the 1979 to 2000 September average (Figure 2). Arctic sea ice is now declining at a rate of 11.2 percent per decade, relative to the 1979 to 2000 average (Figure 3).
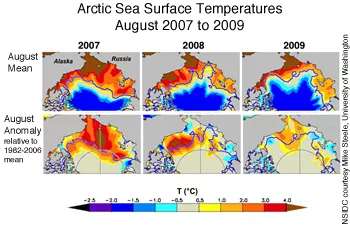
Sea surface temperatures in the Arctic this season remained higher than normal, but slightly lower than the past two years, according to data from Mike Steele at the University of Washington in Seattle. The cooler conditions, which resulted largely from cloudy skies during late summer, slowed ice loss compared to the past two years (Figure 4). In addition, atmospheric patterns in August and September helped to spread out the ice pack, keeping extent higher.
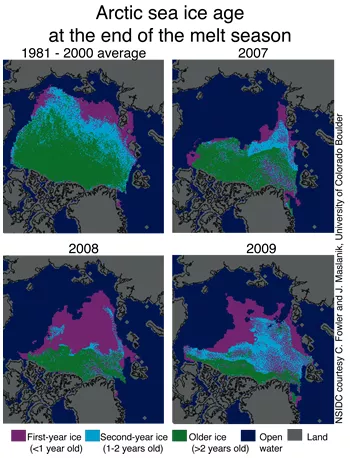
The ice cover remained thin, leaving the ice cover vulnerable to melt in coming summers. Scientists use satellites to measure ice age, a proxy for ice thickness. This year, younger (less than one year old), thinner ice, which is more vulnerable to melt, accounted for 49 percent of the ice cover at the end of summer. Second-year ice made up 32 percent, compared to 21 percent in 2007 and 9 percent in 2008 (Figure 5). Only 19 percent of the ice cover was over 2 years old, the least in the satellite record and far below the 1981-2000 average of 52 percent. Earlier this summer, NASA researcher Ron Kwok and colleagues from the University of Washington in Seattle published satellite data showing that ice thickness declined by 0.68 meters (2.2 feet) between 2004 and 2008.
NSIDC Scientist Walt Meier said, “We've preserved a fair amount of first-year ice and second-year ice after this summer compared to the past couple of years. If this ice remains in the Arctic through the winter, it will thicken, which gives some hope of stabilizing the ice cover over the next few years. However, the ice is still much younger and thinner than it was in the 1980s, leaving it vulnerable to melt during the summer.”
Arctic sea ice follows an annual cycle of melting and refreezing, melting through the warm summer months and refreezing in the winter. Sea ice reflects sunlight, keeping the Arctic region cool and moderating global climate. While Arctic sea ice extent varies from year to year because of changeable atmospheric conditions, ice extent has shown a dramatic overall decline over the past thirty years. During this time, ice extent has declined at a rate of 11.2 percent per decade during September (relative to the 1979 to 2000 average) (Figure 6), and about 3 percent per decade in the winter months.
NSIDC Lead Scientist Ted Scambos said, “A lot of people are going to look at that graph of ice extent and think that we've turned the corner on climate change. But the underlying conditions are still very worrisome.”
Reference:
Kwok, R., and D. A. Rothrock. 2009. Decline in Arctic sea ice thickness from submarine and ICESat records: 1958–2008, Geophys. Res. Lett., 36, L15501, doi:10.1029/2009GL039035.
