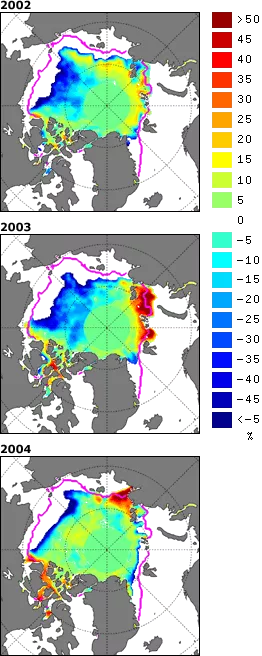
The extent of Arctic sea ice in September — the end of the summer melt period — is the most valuable indicator of the health of the ice cover. On average, sea ice in September covers an area of 7.04 million square kilometers, a little smaller than the continent of Australia. In 2002, September ice extent was 15 percent below average conditions. This represents an area roughly twice the size of Texas (or Iraq). From comparisons with records prior to the satellite era, this was probably the least amount of sea ice that had covered the Arctic over the past 50 years. Quite often, a "low" ice year is followed by recovery the next year. However, September of 2003 was also very extreme, with 12 percent less ice than average. Calculations performed on September 30, 2004 show a sea ice loss very nearly matching that of 2002, especially north of Alaska and eastern Siberia.
Why has Arctic sea ice declined so sharply over the past few years? One argument is that greenhouse warming — increases in the earth's temperature due to the burning of fossil fuels that increase the atmosphere's content of "heat trapping" carbon dioxide — is more apparent. With progressively more summer melt and less ice growth in winter, sea ice may reach a threshold beyond which it can no longer rebound. Climate models are in general agreement that one of the strongest signals of greenhouse warming will be a loss of Arctic sea ice. Some indicate complete disappearance of the summer sea ice cover by the year 2070. Interestingly, as averaged from October 2003 through August 2004, temperatures in the lower troposphere (about 1,000 m above the surface) were 1-2°C (1.8 to 3.6°F) above normal over much of the Arctic Ocean, but much greater in some months, bringing about less ice growth in autumn and winter, and more summer melt.
But the problem is not so simple. Work at the University of Washington, led by Dr. Ignatius Rigor, suggests a strong role of variability in the atmospheric circulation, which can be described by positive and negative phases of the so-called Arctic Oscillation (AO). From the 1950s through the 1980s, the AO index fluctuated between negative and positive phases. However, over the period 1989-1995, the AO entered strongly positive mode. This led to a persistent pattern of winds that tended to "flush" much of the older, thicker ice southward out of the Arctic and into the North Atlantic Ocean, leaving the Arctic with younger, thinner ice that is more prone to melt away during summer. While over the past five years or so, the AO has retreated from this strong previous positive state, they argue that the sea ice is suffering a "hangover" from the period of thinning from which it has yet to recover.
The general downward trend in sea ice, and the extreme losses of the past three years, might therefore be part of a natural cycle. On the other hand, there is growing evidence that the positive mode of the AO that favors ice losses may itself be favored by greenhouse warming, implying that the recent negative mode of the AO might itself be temporary.
The most reasonable view is that the sea ice decline represents a combination of natural variability and the greenhouse effect, with the latter becoming increasingly evident in coming decades.
For more information, see Arctic Sea Ice News & Analysis at https://nsidc.org//sea-ice-today.
- Press contact: +1 303.492.1497 or press@nsidc.org
- General public contact: +1 303.492.6199 or nsidc@nsidc.org
