By Walt Meier, Florence Fetterer, and Nancy Geiger-Wooten
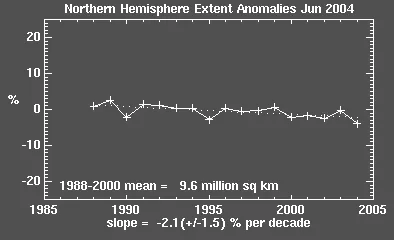
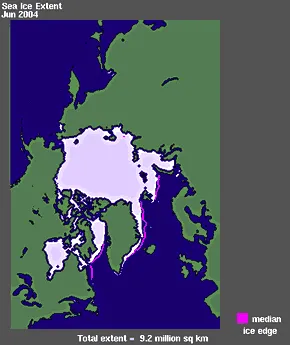
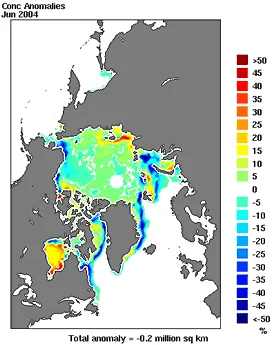
Is the Arctic in for another record low sea ice year? It is starting to look like it. The recently released June 2004 ice extent and concentration are much lower than normal (Fig. 1-3), indicating that annual minimum ice extent, which occurs in September, is likely to be well below normal. If so, this would be the third year in a row with substantial below-normal ice conditions in the Arctic, an unprecedented event in the 30+ year record of satellite observations of Arctic sea ice.
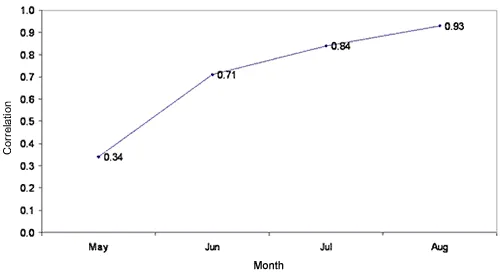
After a record minimum sea ice extent in September 2002, followed by a September 2003 extreme that was nearly as low, early indications are that 2004 will be a very low ice year. May 2004 extent was poleward of the mean extent in virtually all regions of the Arctic (see NSIDC's Sea Ice Index for images). This indicates that ice began melting faster than normal; however, May conditions are not necessarily indicative of conditions at the end of the melt season in September. The correlation between concentration anomalies (Fig. 4) in May and September is low (0.34); however, correlation with June anomalies is much more significant (0.71). Thus, the below normal June extent (Fig. 1, 2) and large negative concentration anomalies (Fig. 3) are suggestive that the Arctic may be in for a third low ice year in a row.
Such low concentrations may be indicative of climate change. While there is substantial interannual variability in the summer minimum ice extent, the satellite record has revealed a significant downward trend of ~9% per decade (e.g., Comiso, 2002) in the summer minimum extent, which corresponds to ~300,000 km 2 per decade (e.g., Cavalieri et al., 2003). This trend could have substantial ramifications for the Arctic region in terms of commerce, wildlife, and the human population and may be a harbinger of large-scale global changes. If current trends continue, the Arctic may be completely free of ice during at least some of the summer by 2050 (e.g., Flato and Boer, 2001; Johannessen et al., 1999).
Caution should be used in interpreting a three-year sequence of much-below average ice extents; however, if September 2004 ice extent does approach that of 2002 and 2003, it would be an unprecedented event and perhaps an indication that “possibility” may soon be turning into “reality.”
Data Sources
The monthly images are produced as part of NSIDC's Sea Ice Index.
Monthly mean sea ice concentrations are produced at NSIDC from DMSP Special Sensor Microwave/Imager (SSM/I) data.
The 1979-2002 time series used to determine correlations were calculated from Nimbus-7 Scanning Multichannel Microwave Radiometer (SMMR) and DMSP SSM/I data.
References
Cavalieri, D.J., C.L. Parkinson, K.Y. Vinnikov, 30-year satellite record reveals contrasting Arctic and Antarctic decadal sea ice variability, Geophys. Res. Lett., 30(18), 1970, doi: 10.1029/2003GL018031, 2003.
Comiso, J.C., A rapidly declining perennial sea ice cover in the Arctic, Geophysical Research Letters, 29(20), 1956, doi: 10.1029/2002GL015650, 2002.
Flato, G.M., and G.J. Boer, Warming asymmetry in climate change simulations, Geophysical Research Letters, 28(1), 195-198, 2001.
Johannessen, O.L., E.V. Shalina, and M.W. Miles, Satellite evidence for an Arctic sea ice cover in transformation, Science, 286, 1937-1939, 1999.


