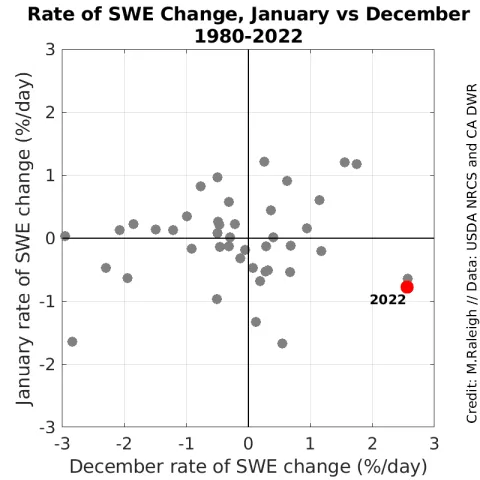
Figure 6. This chart compares rates of change in snow water equivalent (SWE) percentage (relative to average) for January versus December over 1980 to 2022. Each marker is the average for a single year and across all snow stations in the western United States. The lower right quadrant includes years with a snowy December (relative to average) followed by a dry January (relative to average). The current year is highlighted as a red marker. — Credit: M. Raleigh, Oregon State University
