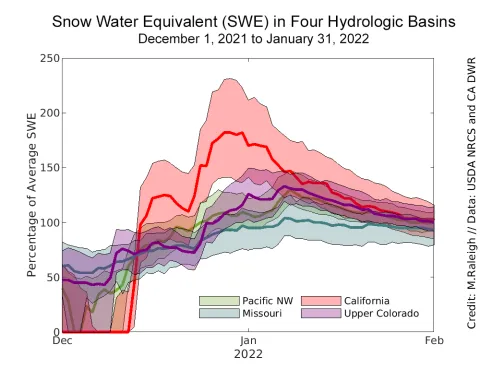
Figure 5. This graph shows the percentage of average snow water equivalent (SWE) across stations in four hydrologic unit code 2 (HUC2) basins from December 1, 2021, to January 31, 2022. The solid thick lines are the averages across the station networks while the shaded areas represent the interquartile range, which includes the middle 50 percent of stations in each basin. After weeks of notable SWE increases in late December and early January, SWE steadily decreased through the end of January to near-average conditions in all four basins. — Credit: M. Raleigh, Oregon State University
