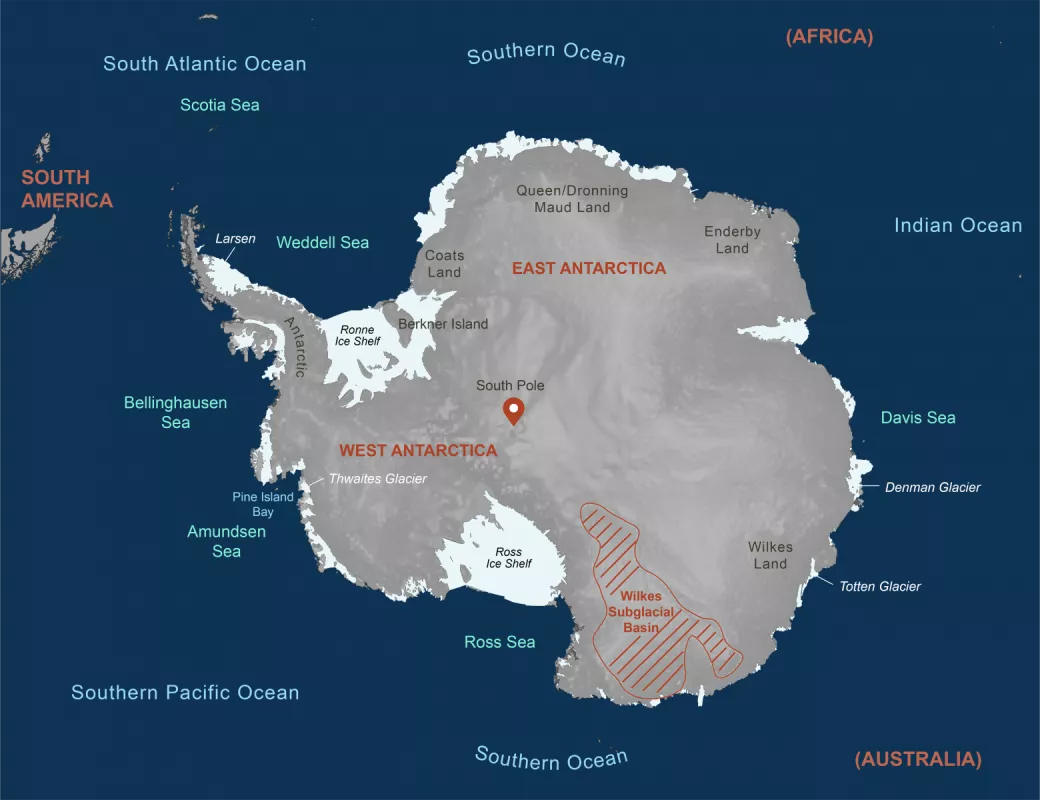
About 70 percent of the planet’s freshwater is locked up in ice sheets: massive ice bodies spanning more than 50,000 square kilometers (20,000 square miles). Our planet has two ice sheets, one covering roughly 80 percent of Greenland and the other covering 98 percent of Antarctica. The Antarctic Ice Sheet is so big that glaciologists have divided it into regions based on geography and the underlying landforms: East Antarctic, West Antarctic, and the Antarctic Peninsula.
The complete loss of any of Earth’s ice sheets due to melting is unlikely to occur in the next several centuries, even given our planet’s warming trend. But if ice sheets did melt, the East Antarctic portion would likely lose its ice last, thanks to its underlying bedrock, and to its extreme cold. Though it would go last, East Antarctic ice may be more sensitive to global warming than previously thought, and even the loss of a tiny percentage of this gigantic ice sheet, by far the largest of them all, could raise sea level enough to affect coastal communities worldwide.
An introduction to the Antarctic Ice Sheet
Studies of the ice melt that fuels sea level rise often focus on the prominent warming and melting of glaciers in Greenland and Western Antarctica, such as at Thwaites Glacier. While the massive East Antarctic Ice Sheet is not often included, recent research suggests the need to look deeper into this area. University of Colorado Boulder glaciologist Ted Scambos said, “East Antarctica has two or three areas with the same kind of vulnerability that Thwaites has, though they are not evolving as rapidly.”
The East Antarctic Ice Sheet, which mostly lies in the Eastern Hemisphere, has generally colder conditions and more ice stability than West Antarctica and the Antarctic Peninsula. In fact, the coldest place on Earth lies in East Antarctica.
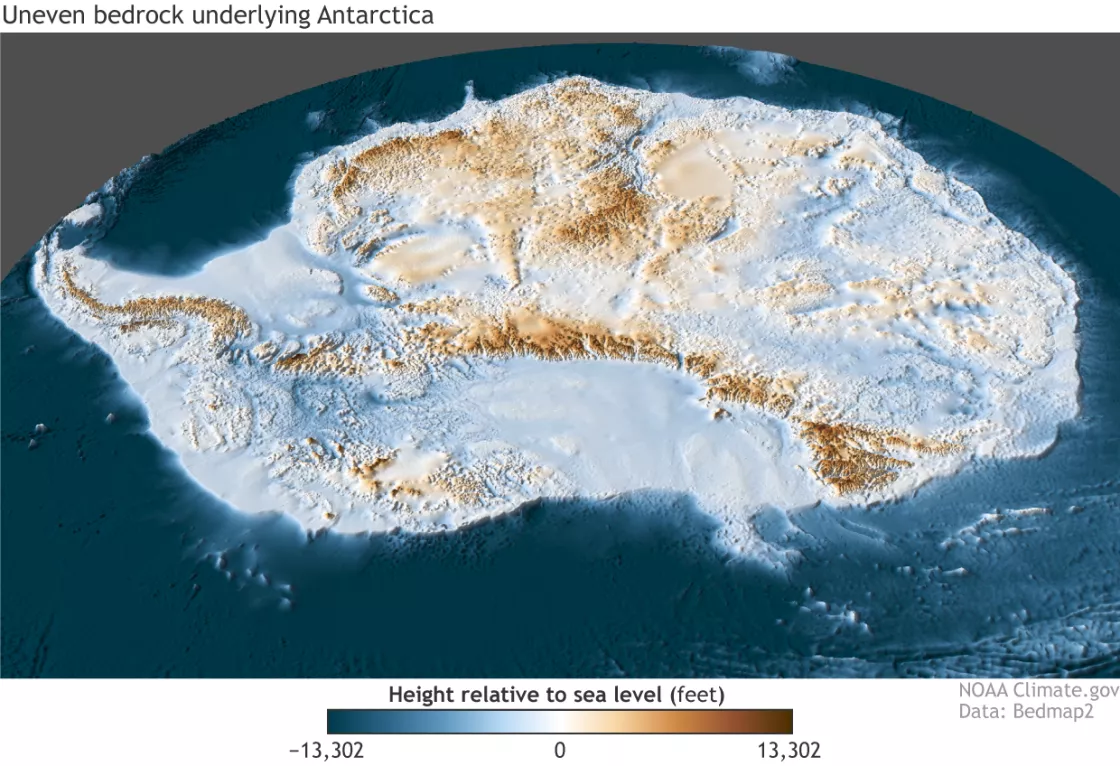
The diversity of Antarctica’s three ice sheet regions reflects the underlying bedrock. Airborne missions, traverses across the ice, and drilling operations have gradually revealed the bedrock over the past several decades. The most comprehensive mapping effort so far has been the British Antarctic Survey’s BEDMAP2 survey. This survey compiled nearly all the available data on the bedrock of the continent to produce an ice-free image of the southern continent.
The West Antarctic and Antarctic Peninsula Ice Sheets rest somewhat uneasily upon a constellation of islands. The East Antarctic Ice Sheet rests mostly upon bedrock above sea level. Even so, parts of the East Antarctic Ice Sheet overlie islands and deep, below-sea-level troughs. Scientists identify a few East Antarctic trough areas, in the Wilkes Subglacial Basin, Totten Glacier, and Denman Glacier as being particularly prone to rapid retreat. Troughs make the ice sheet vulnerable to melting because the deep ocean areas near the troughs allow tongues of warm ocean water to reach the ice.
Measuring the mass of a massive ice body
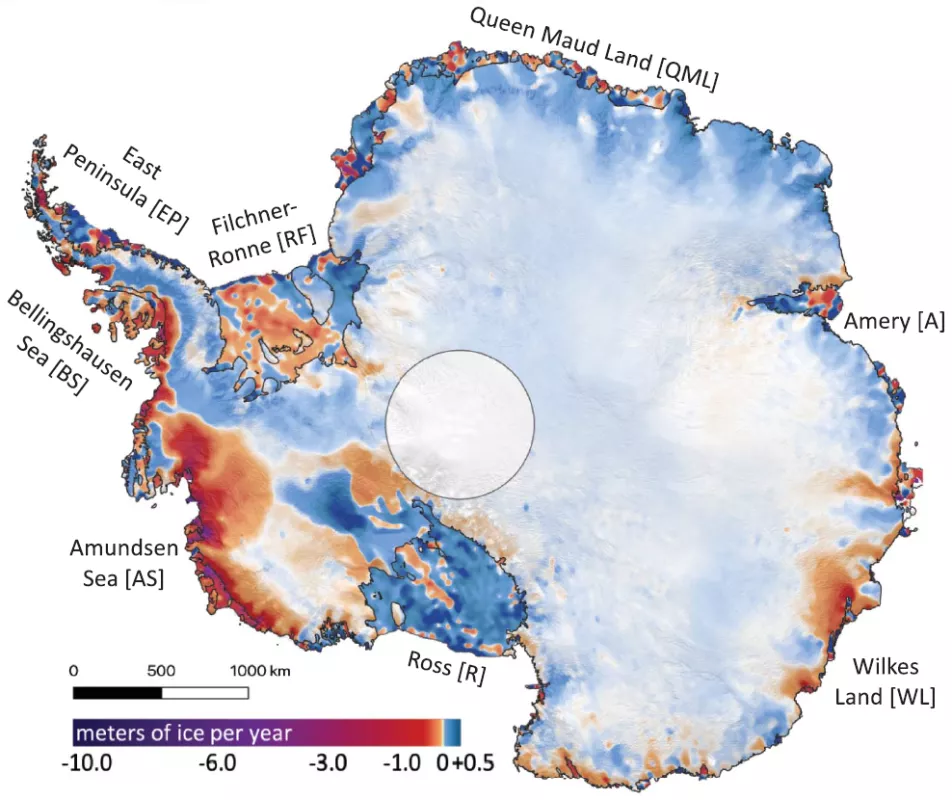
Glaciologists can tell whether an ice sheet is growing or shrinking by measuring the ice sheet’s gain from snowfall, versus its loss from calving, evaporation, and melt. The difference between gains and losses is known as the ice sheet’s mass balance. Glaciologists use a few methods to measure mass balance: comparing observed gains and losses, measuring ice sheet height, and measuring changes in Earth’s gravitational field. Glaciologists have also employed models to understand ice sheet behavior. Using these techniques, individually or combined, scientists have undertaken multiple studies to understand what is happening with the ice sheet. Not all studies have arrived at the same results.
A study led by Eric Rignot in 2019 measured changes in the mass of Antarctica’s ice sheet over a 40-year period.. The study concluded that the East Antarctic Ice sheet lost ice from 1979 to 2017, shedding enough ice to raise global sea level by 4.4 millimeters (0.17 inches). At the time of the paper's publication, though, these conclusions had not been corroborated by satellite observations of gravity or elevation changes.
Near the other end of the mass balance measurement spectrum, a study led by Ben Smith in 2020 used elevation observations from NASA’s Ice, Cloud, and land Elevation Satellite (ICESat) and ICESat-2 satellites to assess Antarctic mass balance. While this study found that the Antarctic ice sheet lost mass overall, East Antarctica gained between 69 and 111 billion metric tons per year from 2003 to 2019. The authors noted that their conclusions were significantly higher than other measurements of East Antarctic ice mass.
Why such broad discrepancies? A significant challenge to measuring mass balance change is that any change—even if it amounts to billions of tons of ice per year—is miniscule compared to the ice sheet’s overall mass. For example, an elevation change (or error in measurement) of just 1 centimeter (0.4 inches) over the entire ice sheet is equal to about 100 billion tons of ice.
To reduce uncertainties in ice sheet mass balance estimates, polar scientists have engaged in a community effort, the Ice sheet Mass Balance Inter-comparison Exercise (IMBIE). In 2018, some 80 members of the IMBIE team combined satellite observations with modeling to assess the mass balance of the Antarctic Ice Sheet from 1992 to 2017. Overall, the team found the ice sheet lost mass, despite estimated mass gains in East Antarctica of 5 billion metric tons per year on average. The range of uncertainty for this measurement, however, is 46 billion metric tons, and the team cautioned that its estimate for East Antarctica was the least certain outcome of the study.
Sensitivity and sea level
Although the East Antarctic Ice Sheet would almost certainly be the last massive ice body to melt, a 2013 study showed that the East Antarctic Ice Sheet is more sensitive to climate shifts than previously suspected. Chris Stokes and his team examined 50 years of observed flight and satellite data of 175 glaciers along 5,400 kilometers (3,355 miles) of coastline. For every degree increase, the glaciers retreated 0.5 kilometers (0.3 miles) per decade. “We detected a clear synchronization between what the glaciers were doing and what the climate was doing,” Stokes said.
Another 2013 study suggested that the East Antarctic Ice Sheet had melted before, during the Pliocene Epoch some 5 to 2.5 million years ago. Carys Cook and her colleagues analyzed marine sediment cores drilled off shore near East Antarctica and about 2.9 kilometers (1.8 miles) below sea level. They found signs of significant coastal erosion, indicating significant ice sheet retreat. Cook and colleagues found that the East Antarctic Ice Sheet alone added about 10 meters (30 feet) to global sea level—after West Antarctica and Greenland had also deglaciated. The total addition to sea level was estimated at 22 meters (72 feet) of global sea level rise.
Reflecting on Antarctic ice during the Pliocene, Scambos said, “Even then there was a good sized ice cap in the center of East Antarctic Ice Sheet, but much of the coast was ice-free, and global temperatures were on the order of 5°C to 8°C, or 9°F to 14°F, higher than today.”
Further back in geologic time, paleoclimate studies and computer models of the history of the ice sheet suggest, the Antarctic Ice Sheet experienced was even smaller. Roughly halfway through the Miocene Epoch (23 to 5 million years ago), warming conditions might have caused the complete loss of the ice sheet, according to a 2020 study. This scenario is based on paleoclimate proxies that provide only partial information, however, and paleoclimate models disagree on how much ice was lost.
Complete loss of any ice sheet—or even a partial loss comparable to what occurred during the Pliocene—is extremely unlikely in the next few centuries. But a 2021 study found that, worldwide, 267 million people already live less than 2 meters (6 feet) above mean sea level. So, if the ice sheets shed even small portions of their ice, they could raise sea level with severe consequences to coastal communities. What is more, ice sheet loss could raise sea level in surprising places.
An ice sheet mass is great enough to exert a gravitational pull on nearby ocean water. As the ice sheet loses mass, its gravitational pull decreases. Ocean water moves away from the ice sheet coast and adds to sea level in other areas. This means that, if the East Antarctic Ice Sheet were to lose enough mass to significantly affect ocean level, sea level would actually fall in the vicinity of the ice sheet. Stretches of the United States East Coast and Gulf Coast will be among the places that experience a larger rise in sea level, above the global average.
The big picture
Whereas estimates generally agree that West Antarctica and the Antarctic Peninsula are losing ice, uncertainties remain in estimating the mass balance of the East Antarctic Ice Sheet. So far, though, the bulk of studies suggest that the ice sheet is gaining mass. But even the studies that estimate East Antarctica’s mass gain on the high end of the spectrum acknowledge areas along the East Antarctic coast that are losing ice.
Studies to date indicate that nearly all of the ice in the East Antarctic Ice Sheet will outlive most people alive today—even their children and grandchildren. Still, a tiny portion of that ice is vulnerable, and that tiny fraction of ice, should it melt or calve away, might redraw coastlines in the near future. The East Antarctic Ice Sheet does not have to change much to change millions of lives.
References
Cook, Carys P. et al. 2013. Dynamic behaviour of the East Antarctic ice sheet during Pliocene warmth. Nature Geoscience 6, 765-769, https://doi.org/10.1038/ngeo1889.
Gasson, E.G.W., and B.A. Keisling. 2020. The Antarctic Ice Sheet: A paleoclimate modeling perspective. Oceanography 33(2): 90-100. https://doi.org/10.5670/oceanog.2020.208.
Hooijer, A., R. Vernimmen. 2021. Global LiDAR land elevation data reveal greatest sea-level rise vulnerability in the tropics. Nature Communications 12: 3592. https://doi.org/10.1038/s41467-021-23810-9.
IMBIE team. 2018. Mass balance of the Antarctic Ice Sheet from 1992 to 2017. Nature 558: 219-222, https://doi.org/10.1038/s41586-018-0179-y.
Miles, B. W. J., C. R. Stokes, A. Vieli, and N. J. Cox. 2013. Rapid, climate-driven changes in outlet glaciers on the Pacific coast of East Antarctica. Nature 500, 563-566, https://doi.org/10.1038/nature12382.
Rignot, E., J. Mouginot, B. Scheuchl, M. van den Broeke, M.J. van Wessem, and M. Morlighem. 2019. Four decades of Antarctic Ice Sheet mass balance from 1979–2017. PNAS 116(4): 1095-1103, https://doi.org/10.1073/pnas.1812883116.
Scambos, T.A., G.G. Campbell, A. Pope, T. Haran, A. Muto, M. Lazzara, C.H. Reijmer, and M.R. van den Broeke. 2018. Ultralow surface temperatures in East Antarctica from satellite thermal infrared mapping: The coldest places on Earth. Geophysical Research Letters 45(12): 6124-6133, https://doi.org/10.1029/2018GL078133.
Smith, B. H.A. Fricker, A.S. Gardner, B. Medley, J. Nilsson, F.S. Paolo, N. Holschuh, S. Adusumilli, K. Brunt, B. Csatho, K. Harbeck, T. Markus, T. Neumann, M.R. Siegfried, and H.J. Zwally. 2020. Pervasive ice sheet mass loss reflects competing ocean and atmosphere processes. Science 368(6496): 1239-1242, https://doi.org/10.1126/science.aaz5845.


