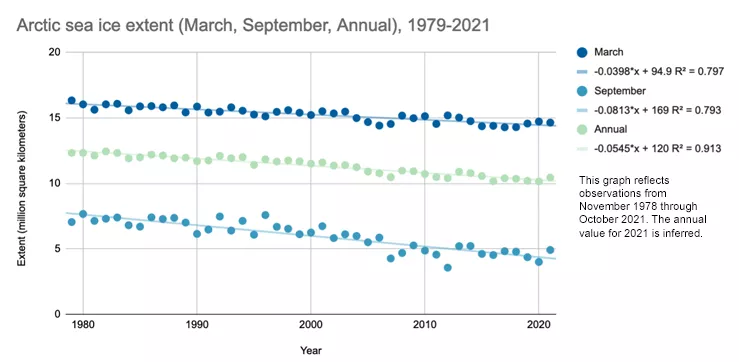
Satellites have continuously monitored Earth’s polar regions since November 1978. Over that period, Arctic sea ice has declined. Compared to the 1981 to 2010 average, sea ice extent has declined just over 2 percent per decade in March and April, and extent has declined nearly 13 percent per decade in September. These declines have occurred against a backdrop of rising temperatures—across the globe and particularly in the Arctic.
Studies indicate that year-round Arctic sea ice retreat most likely results from a combination of natural variability and climate change. Multiple studies indicate that roughly half the decline is caused by natural variability, but the overall long-term trend is a direct result of climate change.
What the observations show
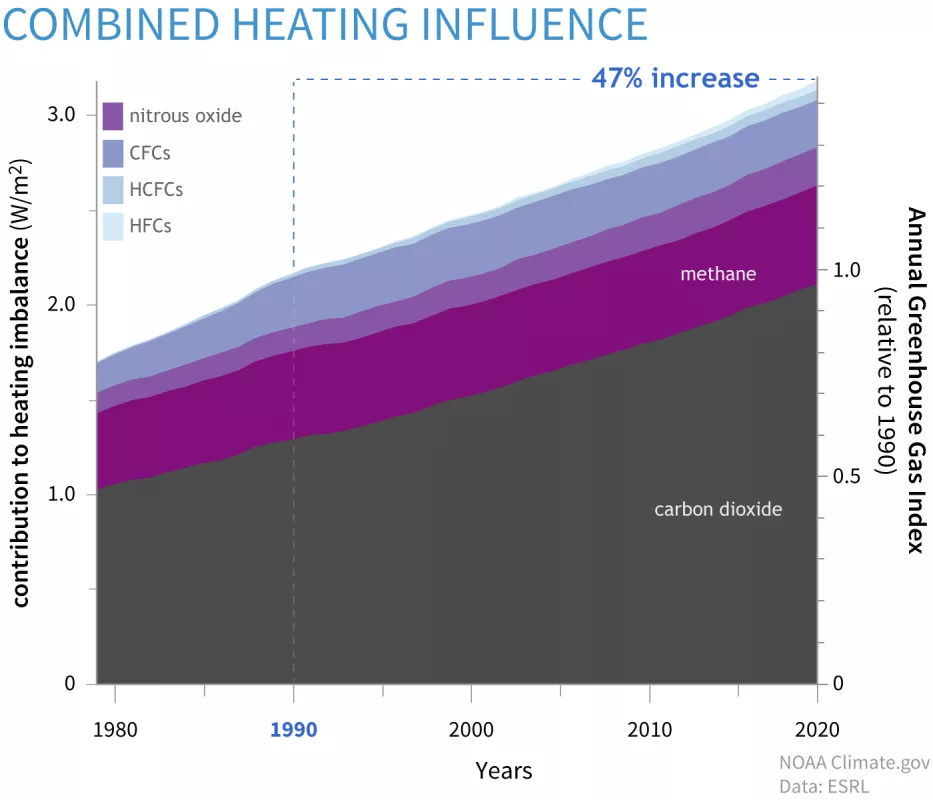
Observational records show that heat-trapping gases like carbon dioxide have risen steadily in Earth’s atmosphere over several decades.
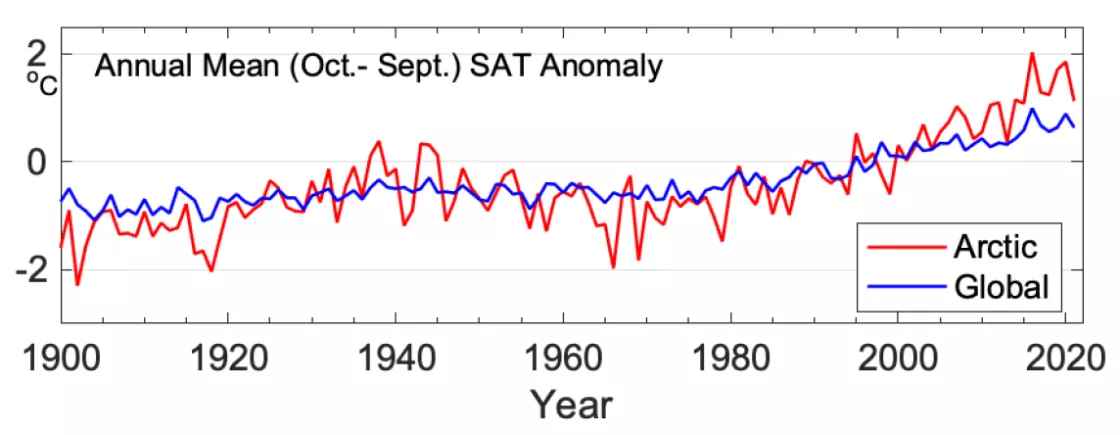
At the same time, global temperatures have risen by 0.08°C (0.14°F) per decade since 1880. Since the year 2000, Arctic temperatures have risen roughly twice as fast as global temperatures.
This faster increase in temperature in the Arctic is known as Arctic amplification, and it is consistent with climate-model projections of global warming. Multiple factors contribute to Arctic amplification: heat transport to the Arctic through atmospheric and oceanic circulation, reduced snow cover, and sea ice loss. Sea ice retreat contributes to amplification, and amplification drives even more sea ice retreat.
Enter the models
Researchers often use models to study climate change, and to see how complex factors work together. Models can replay past events—a good test of their skill. Models can simulate responses to hypothetical events, such as how fast sea ice could reform after an ice-free summer. Models can predict potential future conditions, to support long-term planning. Models can also help researchers untangle different drivers of sea ice change.
In 2011, Jennifer Kay and colleagues used a computer climate model that included atmospheric, land, and ocean processes to study how much natural variability and human-caused climate change contribute to sea ice retreat. The study showed that approximately half of the decline in Arctic sea ice from 1979 to 2005 resulted from increased greenhouse gases. But the other half resulted from variability in the climate system, such as variations in wind patterns. This indicates that, even in a warming world, persistent periods of weather that encourage ice growth could cause the ice to expand for a few years before declining again.
Subsequent studies have reached broadly similar conclusions. In 2017, a research team led by Qinghua Ding used an atmospheric general circulation model coupled with an ocean-sea-ice model. The researchers showed that September sea ice loss correlated with atmospheric circulation changes centered over Greenland, which may have caused 30 to 60 percent of the September sea ice losses. A 2019 study led by Ding found similar results: 40 to 50 percent of the long-term Arctic sea ice decline could be attributed to natural variability.
Discussing the study findings, NSIDC scientist Walt Meier pointed out an important difference between the effects of natural variability and long-term climate forcing. “Natural variability has bigger effects at shorter timescales. It mainly plays a role over a time span of about 10 to 15 years,” he said. “As the length of the observation period increases, natural variability has less effect, and the long-term forcing—greenhouse gas emissions—dominates,” he added.
In 2016 and 2018, NSIDC scientist Julienne Stroeve published studies with Dirk Notz examining the causes of long-term Arctic sea ice decline and greenhouse gas emissions. In both studies, they found a long-term linear relationship between anthropogenic carbon dioxide emissions and Arctic sea ice decline.
In short, multiple studies have arrived at roughly the same conclusion: Natural variability accounts for about half of the sea ice decline observed so far; the other half comes from climate change.
Trends can change
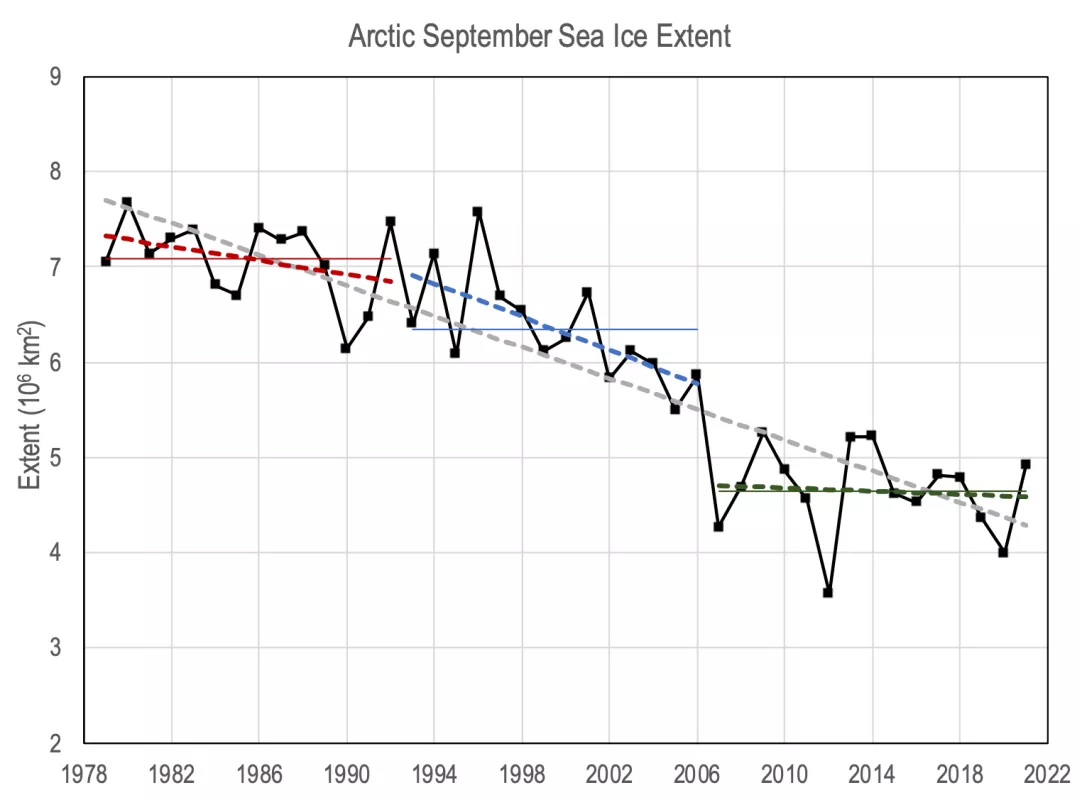
After the Arctic sea ice reached its September minimum extent in 2021, Meier took a closer look at the long-term trend, dividing it into three periods of roughly equal length: 1979 to 1992, 1993 to 2006, and 2007 to 2021 (periods of 14, 14, and 15 years). Meier observed that the early period showed a downward trend, and the middle period showed the strongest downward trend in the record. The late period showed a downward trend so slight that it was not statistically significant, a near-zero trend.
Meier offered two possible explanations for the different trend rates at different times in the long-term record. “One could argue that natural variability was probably helping to accelerate loss from 1993 to 2006,” he said. “However, there is probably also an effect from the ice itself.” Arctic sea ice loss was so substantial from 1993 to 2006 that, after that time, surviving summer sea ice was much farther north—where colder conditions, less sunlight, and generally thicker multiyear ice make the surviving ice more resistant to melt. “This may change once temperatures rise enough to again start melting away more of that thicker, northerly ice cover,” he said.
Lingering questions
Given the long-term decline in Arctic sea ice, it is natural to wonder when the Arctic Ocean may lose its ice cover completely, at least in summer. Inherent variability in sea ice extent makes that question impossible to answer with precision. “What happens on short timescales depends a lot on inherent variability that may be impossible to predict,” said Kay. But in the long term, the influence of climate change means that sea ice will continue to decline. Kay said, “There is no escaping that we will see an Arctic with no summer sea ice this century if we continue to rapidly increase greenhouse gases in the atmosphere.”
In the Arctic, while natural variability accounts for perhaps half of the observed changes, the long-term declines in Arctic sea ice could not have happened without the decades-long forcing of warming climate.
References
Ballinger, T.J., J.E. Overland, M. Wang, U.S. Bhatt, B. Brettschneider, E. Hanna, I. Hanssen-Bauer, S.-J. Kim, R.L. Thoman, and J.E. Walsh, 2021. Surface air temperature. Arctic Report Card: Update for 2021. https://arctic.noaa.gov/Report-Card/Report-Card-2021
Ding, Q., A. Schweiger, M., L’Heureux, D.S. Battisti, S. Po-Chedley, N.C., Johnson, E. Blanchard-Wrigglesworth, K. Harnos, Q. Zhang, R. Eastman, and E.J. Steig. 2017. Influence of high-latitude atmospheric circulation changes on summertime Arctic sea ice. Nature Climate Change, 7: 289.295. https://doi.org/10.1038/nclimate3241
Ding, Q., A. Schweiger, M., L’Heureux, E.J. Steig, D.S. Battisti, N.C., Johnson, E. Blanchard-Wrigglesworth, S. Po-Chedley, Q. Zhang, K. Harnos, M. Bushuk, B. Markle, and I. Baxter. 2019. Fingerprints of internal drivers of Arctic sea ice loss in observations and model simulations. Nature Geoscience, 12: 28-33. https://doi.org/10.1038/s41561-018-0256-8
Kay, J.E., M.M. Holland, and A. Jahn. 2011. Inter-annual to multi-decadal Arctic sea ice extent trends in a warming world. Geophysical Research Letters, 38: L15708, https://doi.org/10.1029/2011GL048008
Notz, D., and J. Stroeve. 2016. Observed Arctic sea-ice loss directly follows anthropogenic CO2 emission. Science, 354(6313):747-750. https://doi.org/10.1126/science.aag2345
Stroeve, J., and D. Notz. 2018. Changing state of Arctic sea ice across all seasons. Environmental Research Letters, 13: 103001. https://doi.org/10.1088/1748-9326/aade56
Tietsche, S., D. Notz, J. H. Jungclaus, and J. Marotzke. 2011. Recovery mechanisms of Arctic summer sea ice. Geophysical Research Letters, 38: L02707. https://doi.org/10.1029/2010GL045698


