How do I import AMSR-E Daily Soil Moisture data into ArcGIS?
The following are instructions on how to import and display AMSR-E Daily Soil Moisture HDF data in ArcGIS. These instructions were tested with ArcGIS 10.0.
1. Download the AMSR-E Daily L3 Soil Moisture HDF data file of interest to you.
Note that you will not need any other files (i.e., header file) in order to open the HDF data in ArcMap.
2. Add the AMSR-E Soil Moisture data to ArcMap using the ‘Extract Subdataset’ tool.
This tool allows you to extract a data field in an HDF file and save it to a different raster format.
- Start ArcMap and open the ArcToolbox.
- Select Extract Subdataset under Data Management Tools > Raster > Raster Processing.
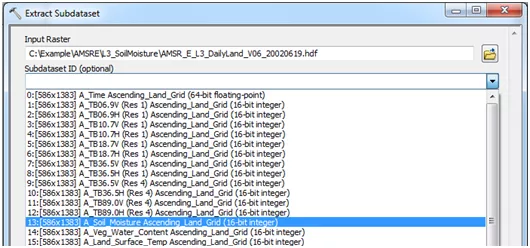
- Select your HDF data file (i.e., AMSR_E_L3_DailyLand_V06_20020619.hdf) as the Input Raster.
- Select the data field of interest to you (i.e., 13:[586x1383] A_Soil Moisture Ascending_Land_Grid) using the Subdataset ID drop-down arrow. The data field you selected will appear as a number (i.e., 13) in the ID box.
- Provide a name, with an extension (i.e., ae_sm.tif), and select a location for your Output Raster. Several raster formats are supported (click Show Help >> for more information).
3. Define the projection of the data to the EASE-Grid Global Projection.
- Select Define Projection in the ArcToolbox, under Data Management Tools > Projections and Transformations.
- Select your output raster from Step 2 (i.e., ae_sm.tif) for your Input Dataset.
- Next, click on the button to the right of the Coordinate System box.
- In the dialogue box that opens, click New > Projected….
- In the new window, enter a custom projection name in the first box.
- Select Cylindrical Equal-Area under the Projection Name drop-down list.
- Modify the projection parameters so that the value of Standard_Parallel_1 is 30.0. Leave all other default values.
- Proceed to the Geographic Coordinate System box and click on New….
- In the new window, enter a custom name. Leave Datum and Spheroid as <custom>.
- Enter 6371228 in the Semimajor Axis and Semiminor Axis boxes.
- Select Degree under the Angular Unit drop-down box.
- Select Greenwich under the Prime Meridian drop-down box.
- Click Finish (twice), then OK (twice). Your raster is now properly projected.
4. Scale the soil moisture data so that the units are in g cm-3.
- Select Times in the ArcToolbox, under Spatial Analyst Tools > Math.
- Select your projected raster (i.e., ae_sm.tif) using the Input raster or constant value 1 drop-down arrow.
- Type 0.001 in the Input raster or constant value 2 box.
- Name (i.e., ae_sm_scaled.tif) and select a location for your Output Raster.
- Click OK. Your output raster, with a new range from -9.999 to 0.5, should now be displayed in the Data Frame.
5. Modify the symbology of your raster in order to optimally display the soil moisture data.
- In the Table of Contents, right-click on the raster you created in Step 4 (i.e., ae_sm_scaled.tif), select Properties, and click on the Symbology tab.
- Select Minimum-Maximum from the drop-down list under Stretch Type.
- Check the box next to Edit High/Low Values and modify your values appropriately (i.e., 0 to 0.5).
- Click OK. Your soil moisture raster should now be optimally displayed in the Data Frame.

