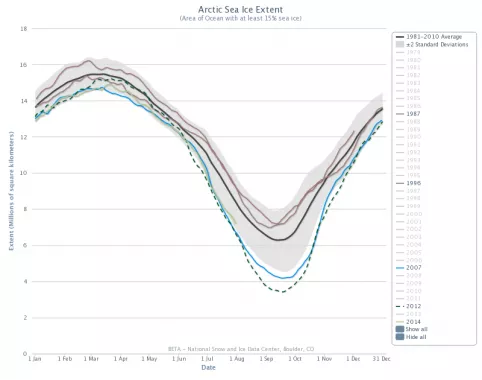
The ability to view data interactively adds convenience to dynamic data analysis. While static graphs and images are informative, interactive tools allow users to view and analyze data on-the-fly. Readers of our Sea Ice Today blog enjoy daily updates on sea ice extent, but some wanted to see data from specific days or years that weren’t provided in the static graphs. Behold Charctic.
Developed at NSIDC with support from NASA, the Charctic Interactive Sea Ice Graph enables users to more easily access and explore NSIDC’s Sea Ice Index data set.
With this tool, you can:
- Visualize sea ice extent data for the Arctic and more recently, the Antarctic.
- View and compare sea ice extent data for any year or any combination of years between 1979 and 2014 (including near-real-time daily data).
- Get daily sea ice extent values by rolling your cursor over a line in the graph.
- See a corresponding daily sea ice concentration image by clicking on a line in the graph.
- Download your customized graph or any of the corresponding daily sea ice concentration images.
If you are interested in tracking sea ice in the Arctic or the Antarctic, try it out.
