By Natasha Vizcarra
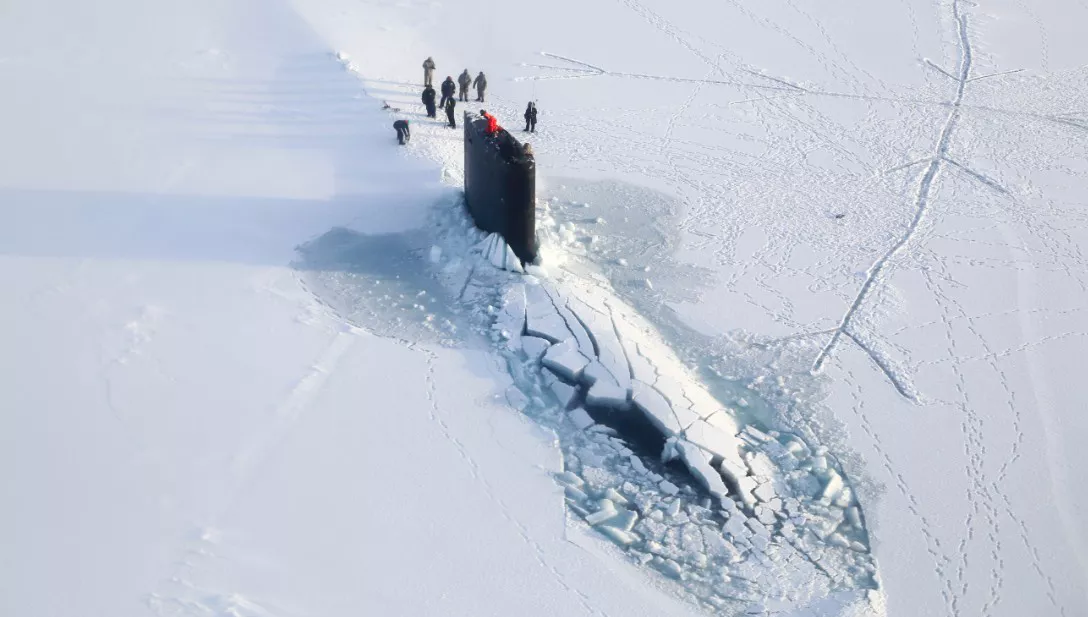
In the waters north of Alaska, ships can go for weeks without seeing another vessel. Fog frequently blankets the region in the spring and summer when the sea ice melts and recedes towards the North Pole. This season of melt has attracted more oil-seeking rigs and vessels over the last five years, taxing the U.S. Coast Guard ships that patrol these waters.
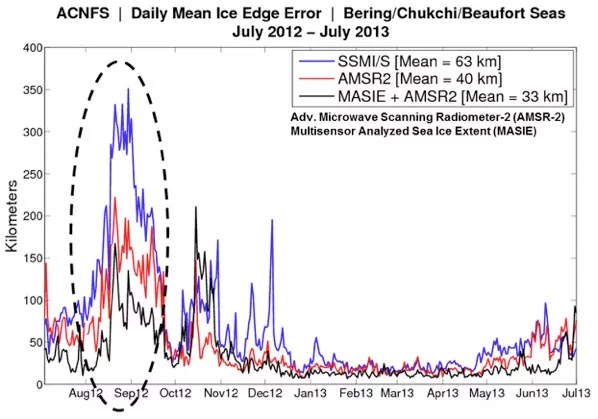
For ships in the Arctic, the ice edge is everything. The mutable edge dictates how much fuel and supplies need to be on the vessel. The closer the edge is to the pole and the farther out ships get, the more dangerous the voyage becomes. Researchers at NSIDC and their colleagues have developed a way to improve sea ice edge forecasts in the Arctic. The new method bumps up the accuracy of the six-hour forecast by almost 40 percent, making forecasts more reliable and navigation in the Arctic safer.
Sea ice measuring one to twelve feet thick covers much of the ocean throughout the year. Its extent waxes and wanes with the seasons. Although frequent harsh weather and sea conditions keep most commercial ships out of the region, some ships are able to navigate near the ice edge where large chunks of sea ice are less likely to gouge their vessels. Since satellites started measuring Arctic sea ice extent in 1979, summer extent has trended downward with a record minimum of 3.39 million square kilometers occurring in September 2012. Scientists foresee that this rapidly changing Arctic environment could spur an increase in Arctic ship traffic over the next decade. This, in turn, demands an increase in U.S. military presence in the Arctic and better sea ice edge forecasts.
High-resolution ice
The Navy currently uses two methods, the Arctic Cap Nowcast/Forecast System (ACNFS) and the Global Ocean Forecast System, to predict ice conditions. The forecasts alert navigators six hours out with a spatial resolution of about 25 kilometers. However, researchers at NSIDC, NASA, and the NOAA National Ice Center (NIC) realized that an ice concentration data product from the Advanced Microwave Scanning Radiometer (AMSR2) on Japan’s GCOM-W1 satellite could be used to improve the ice models that the forecasts are run on. The product has a resolution of ten kilometers.
“Our idea was pretty simple, to combine two types of measurements,” said Florence Fetterer, an NSIDC researcher. With colleagues from NASA, NIC, and the U.S. Naval Research Laboratory (NRL), Fetterer blended data from AMSR2 with a sea ice mask called MASIE (“may-zee,” the Multisensor Analyzed Sea Ice Extent), developed at NSIDC. The MASIE sea ice mask catches ice that the microwave data alone miss, especially in summer, when melt ponds on the surface of the ice appear as ocean to the sensor. Where there is ice, the AMSR2 product supplies an estimate of ice concentration that the forecast model needs. The resulting high-resolution dataset can capture even small patches of sea ice a few miles across. That means better input into forecasts, and more accurate output, too.
“We expect this combined product is going to do a much better job at initializing the Navy’s forecast model,” Fetterer said.
Forecast vs. observation
The Navy used the new technique this summer as part of its support to the U.S. Coast Guard icebreaker Healy, which conducted missions in the Beaufort Sea with a transit to the North Pole to study the biogeochemistry of Arctic waters. The Navy has used the blended product to provide sea ice edge forecasts at a sharper 2-kilometer resolution since July 2015. The researchers compared the new forecasts to actual observations of the sea ice edge and found a 40 percent improvement in accuracy all year round.
“It is really helping us, and it’s providing a better product for the whole community that uses and depends on accurate sea ice information, from forecast modelers to anybody with assets in the Arctic,” said Pablo Clemente-Colón, chief scientist of the NIC, a collaboration of the Navy, NOAA and the U.S. Coast Guard.
“It’s especially important to have accurate forecasts given rapidly changing conditions in the Arctic,” said Pamela Posey, a researcher at the NRL in Mississippi. The scientists detailed the new method in a study published in August 2015 by the journal The Cryosphere. The blended dataset is updated daily and is available from the NSIDC web site.
Reference
Fetterer, F., J. S. Stewart, and W. Meier. 2015, updated daily. MASAM2: Daily 4 km Arctic Sea Ice Concentration, Version 1. Boulder, Colorado USA. NSIDC: National Snow and Ice Data Center. doi: 10.7265/N5ZS2TFT.
Posey, P. G., E. J. Metzger, A. J. Wallcraft, D. A. Hebert, R. A. Allard, O. M. Smedstad, M. W. Phelps, F. Fetterer, J. S. Stewart, W. N. Meier, and S. R. Helfrich. 2015. Improving Arctic sea ice edge forecasts by assimilating high horizontal resolution sea ice concentration data into the US Navy's ice forecast systems, The Cryosphere, 9, 1735-1745, doi:10.5194/tc-9-1735-2015, 2015.

