The Arctic sea ice cover in June 2024 retreated at a below average pace, leading to a larger total sea ice extent for the month than in recent years. Many areas of open water have developed along the Arctic Ocean coast. Sea ice in Hudson Bay continues to track at the lowest levels seen in the satellite data record. In the Antarctic, extent remains above the 2023 record-setting low extent but is still well below all other years in the satellite era.
Overview of conditions
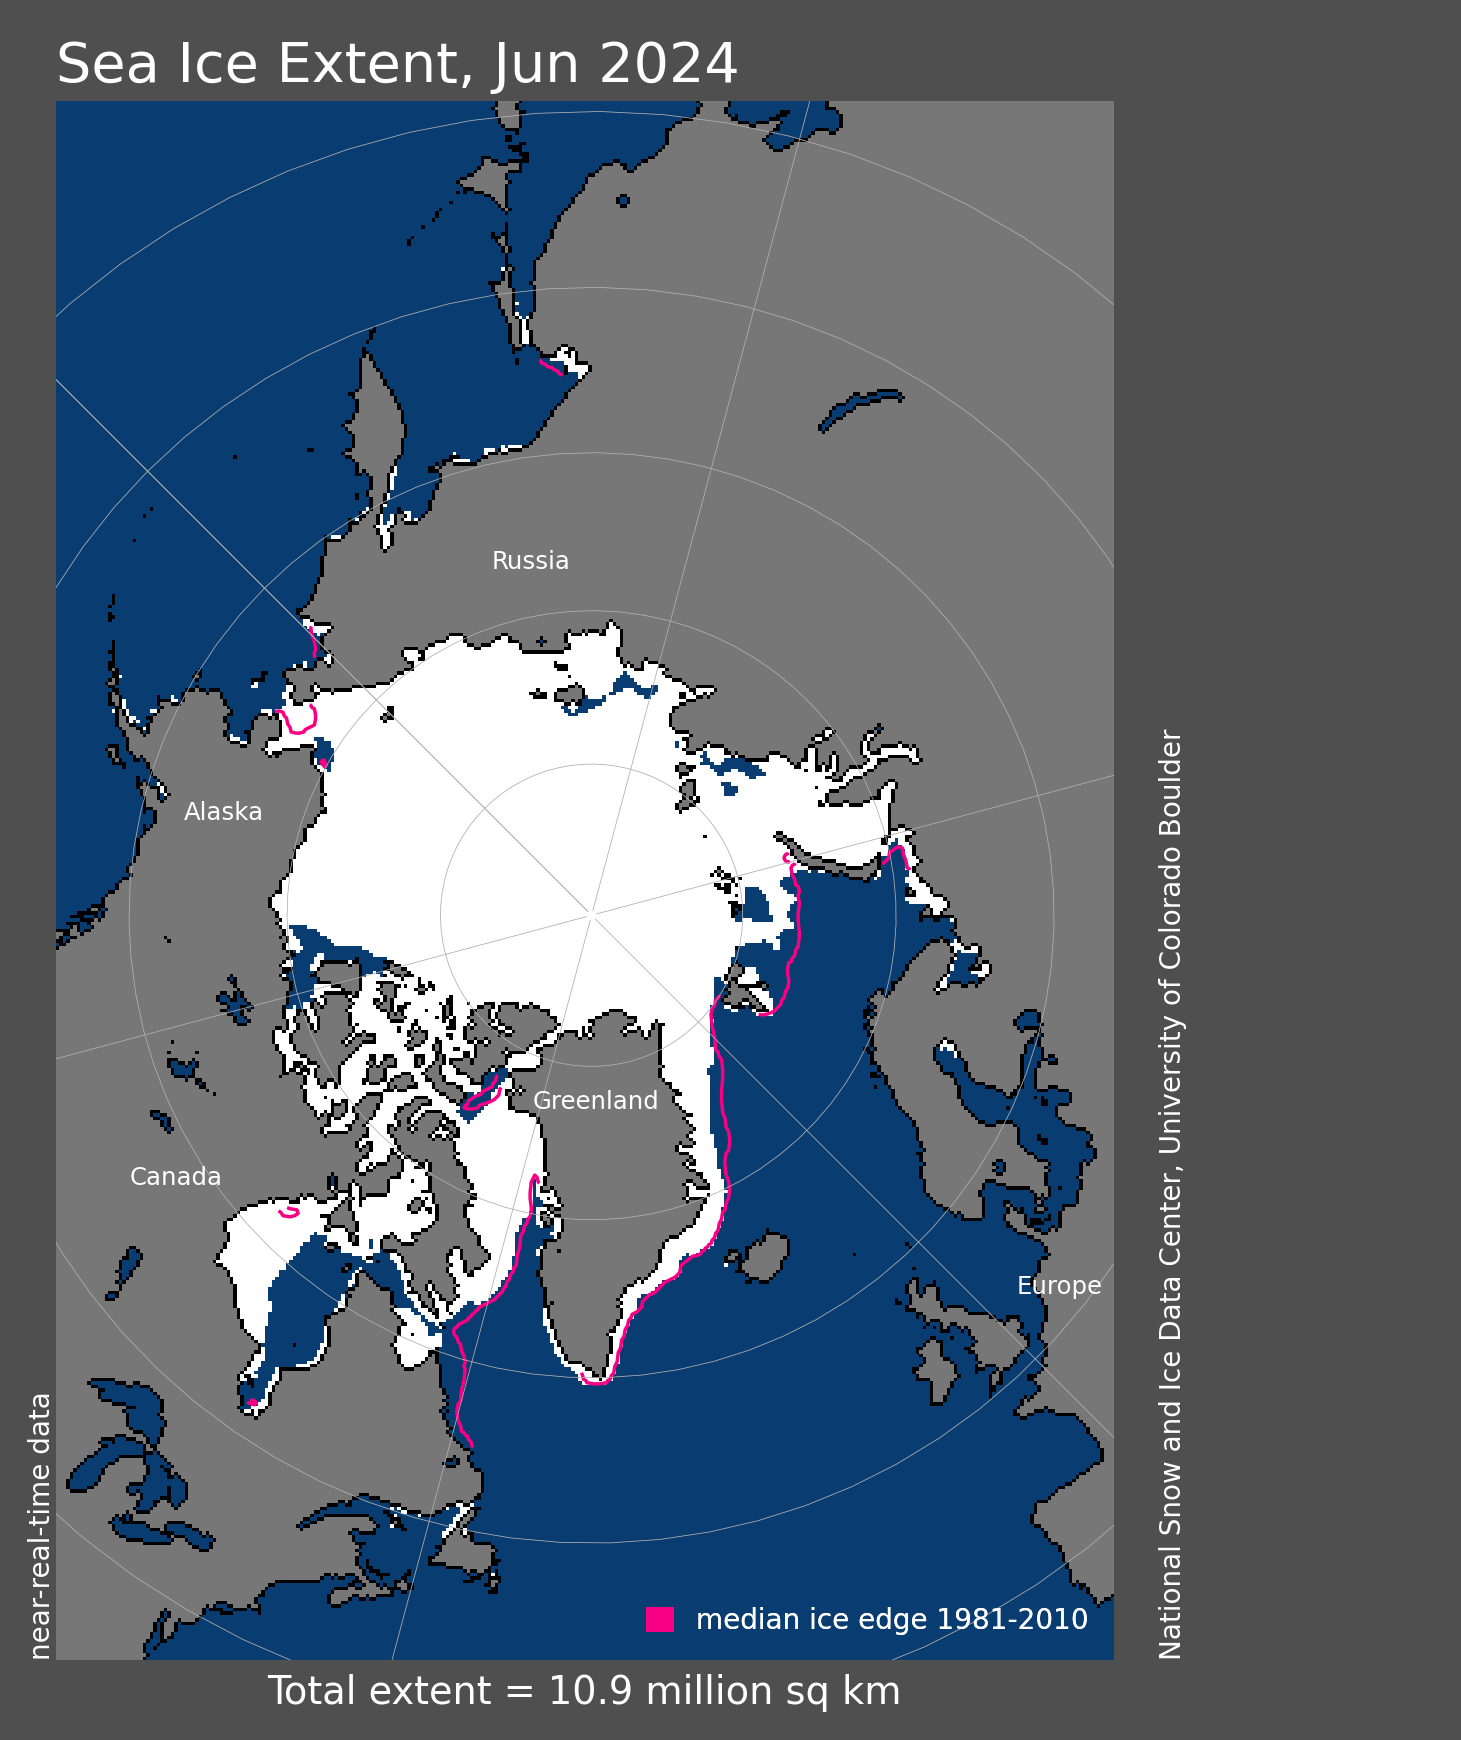
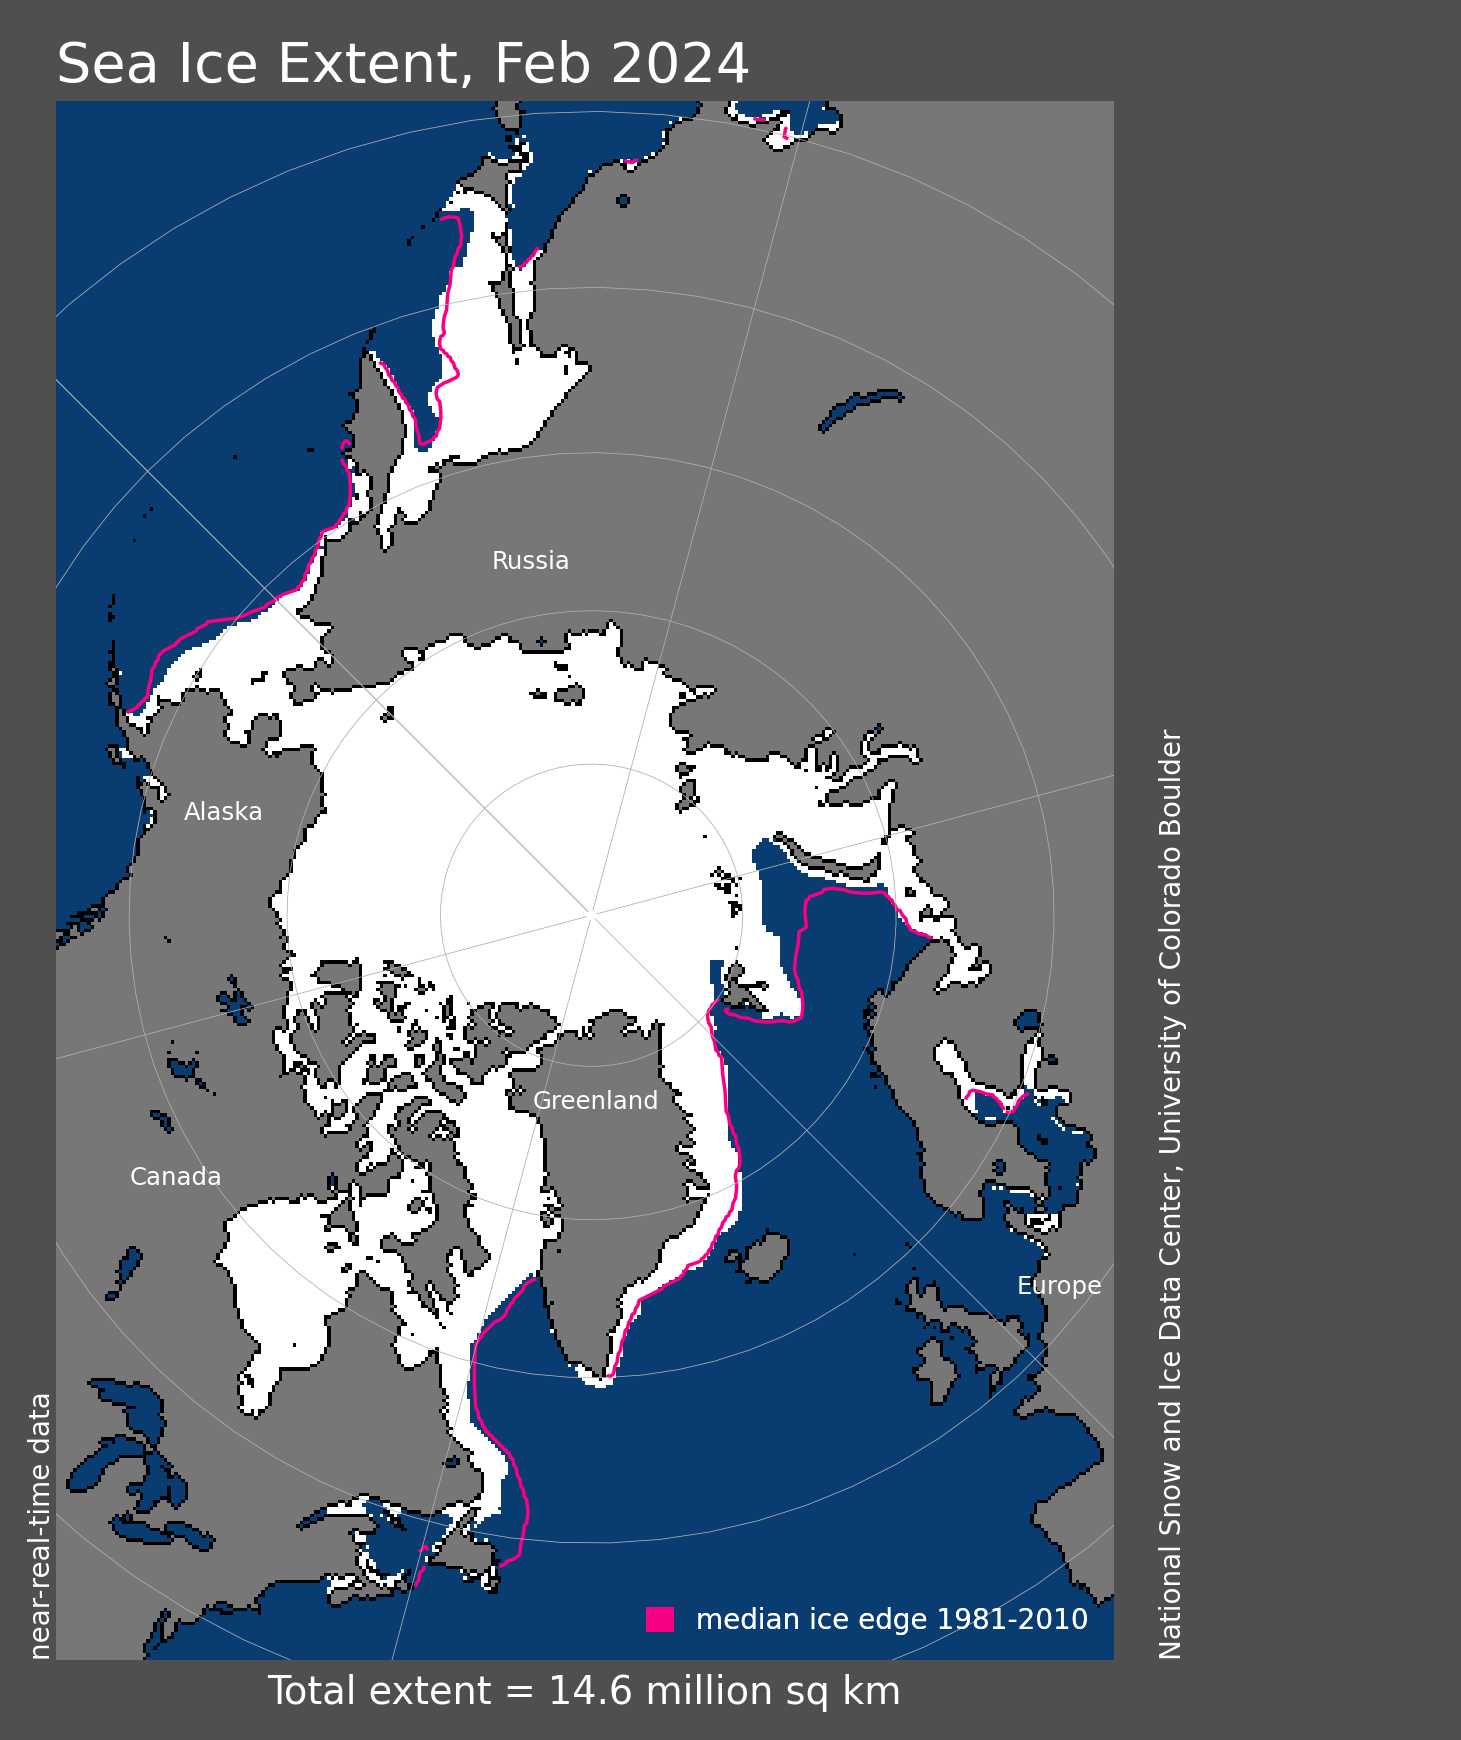
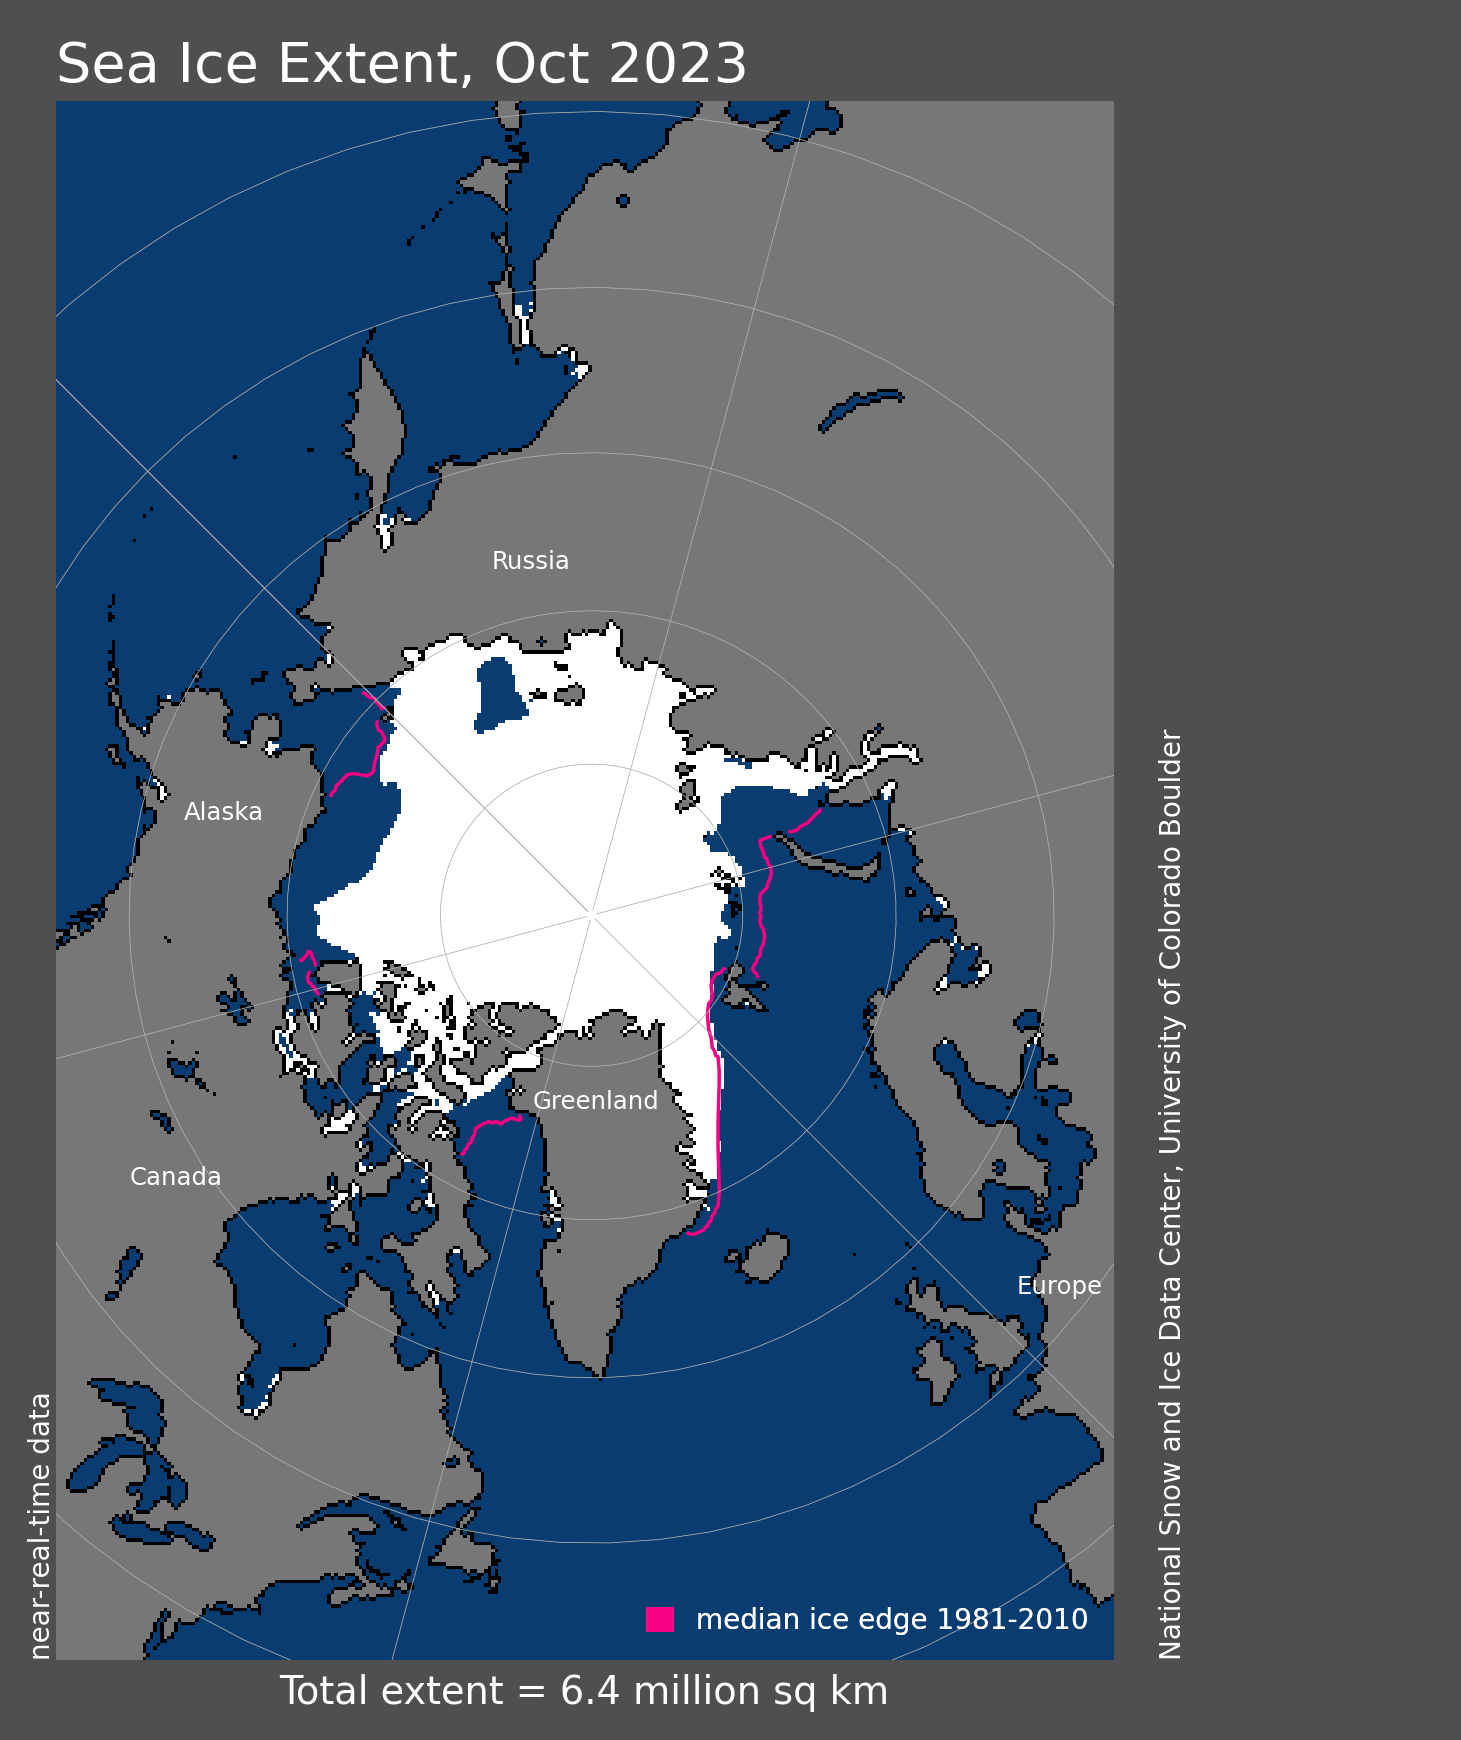
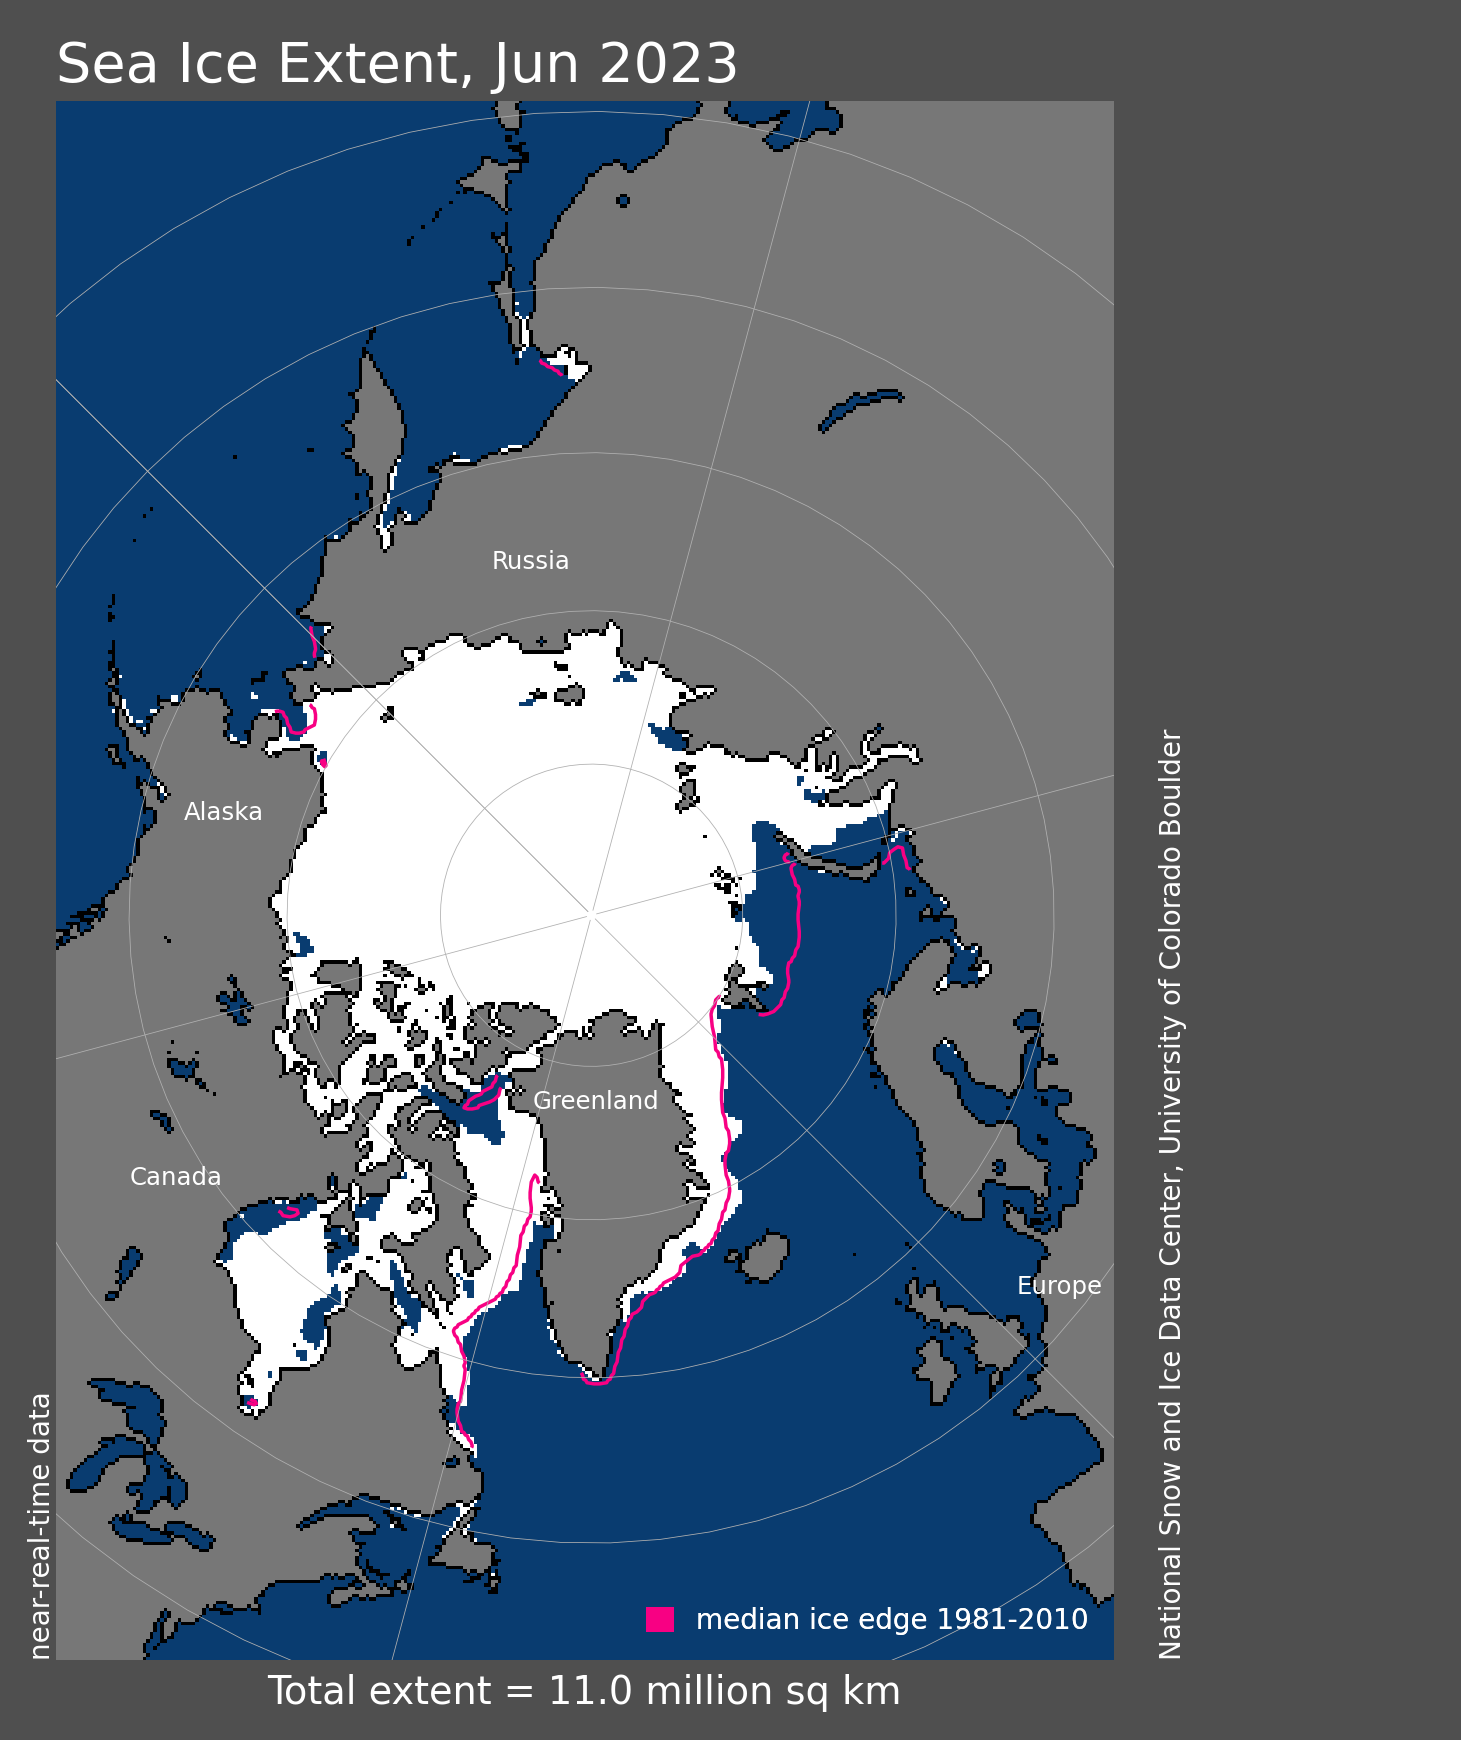
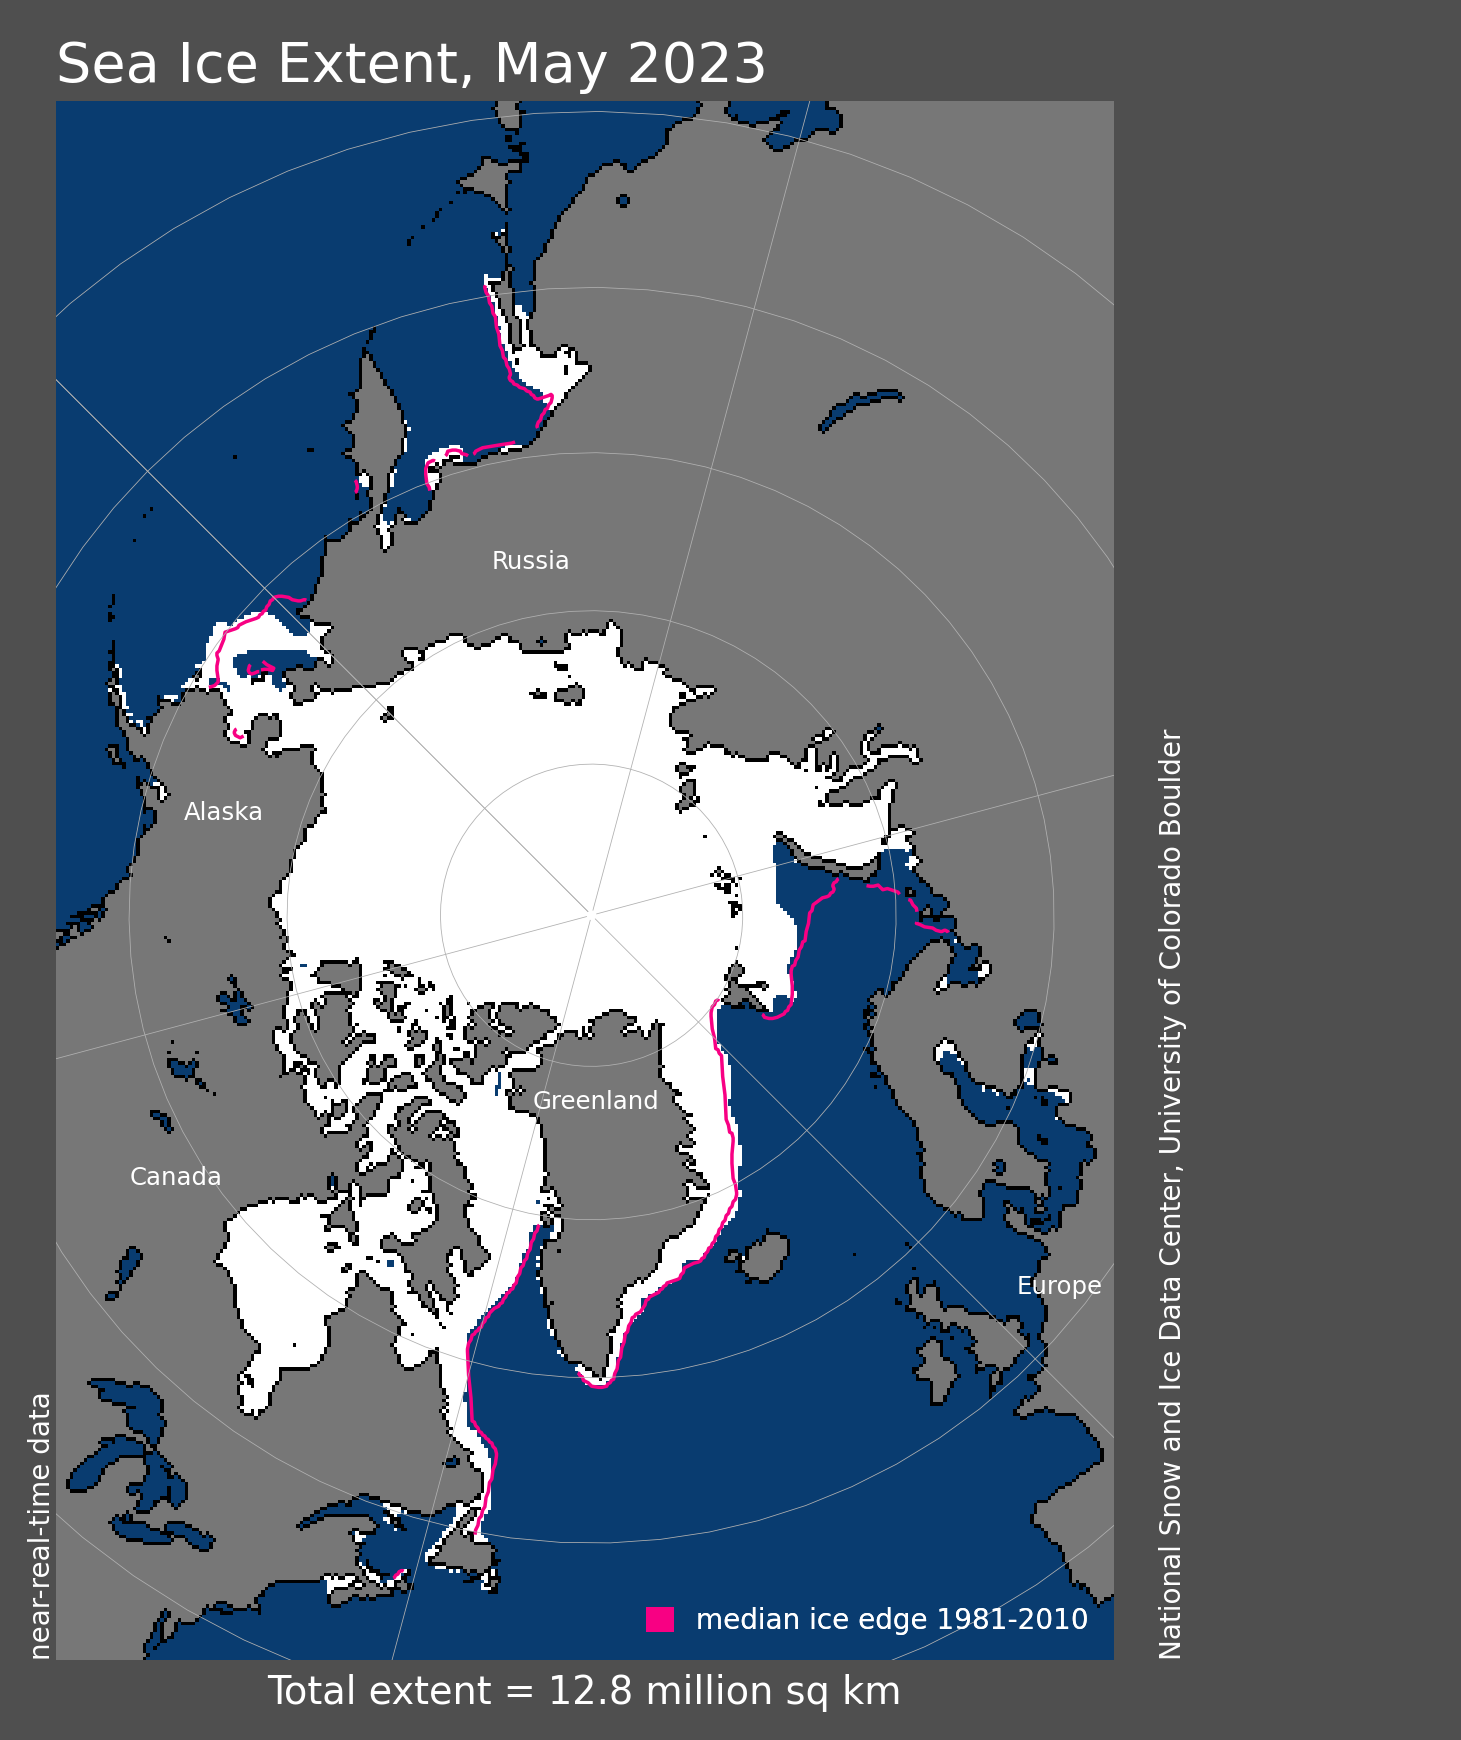
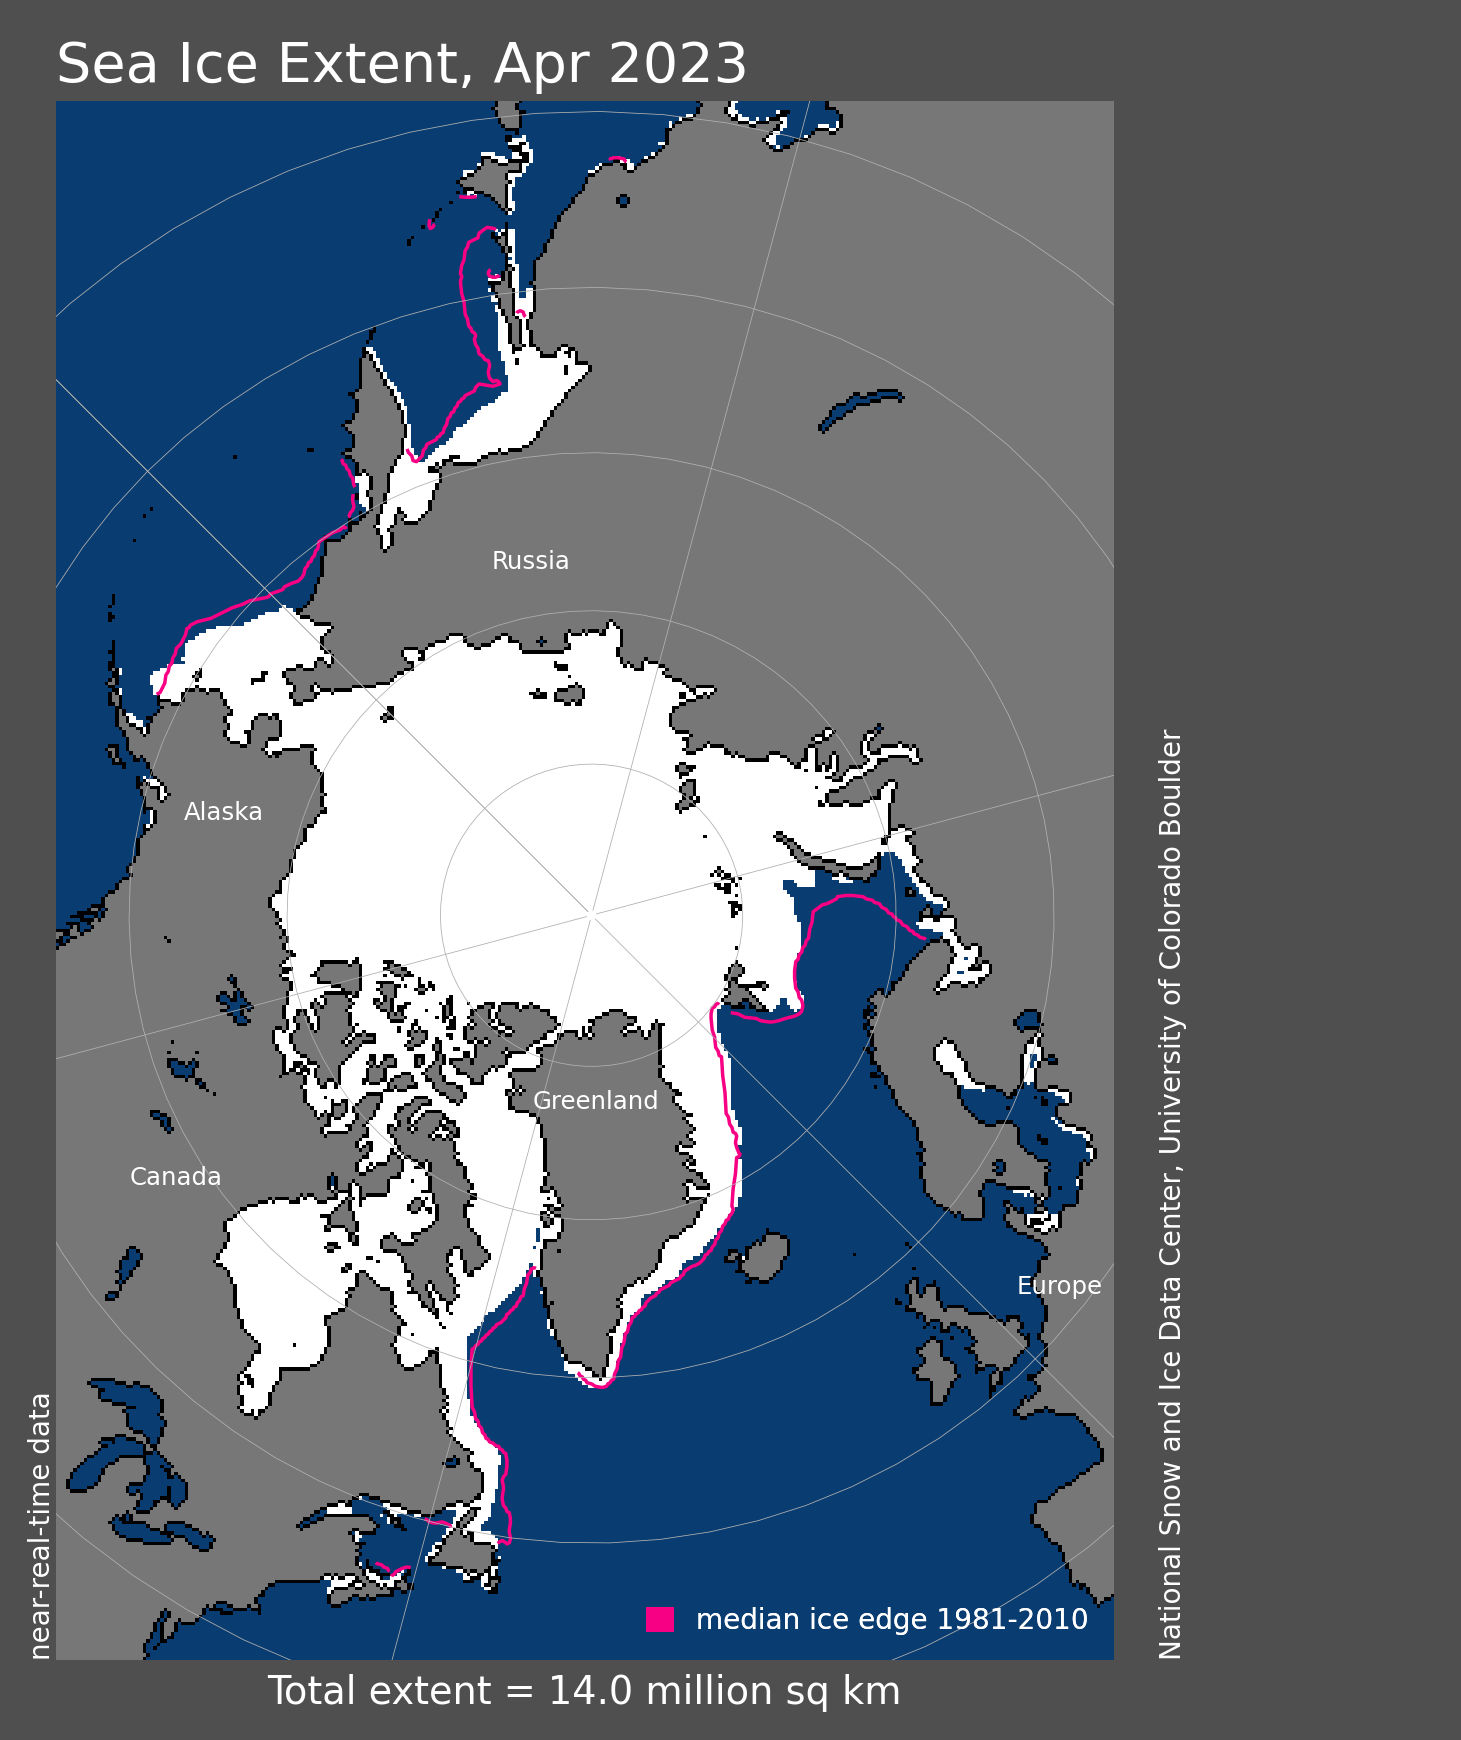
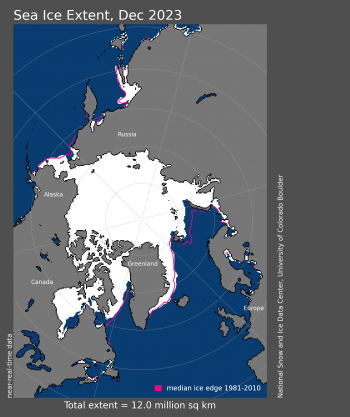
Figure 1a. Arctic sea ice extent for June 2024 was 10.90 million square kilometers (4.21 million square miles). The magenta line shows the 1981 to 2010 average extent for that month. Sea Ice Index data. About the data
Credit: National Snow and Ice Data Center
High-resolution image
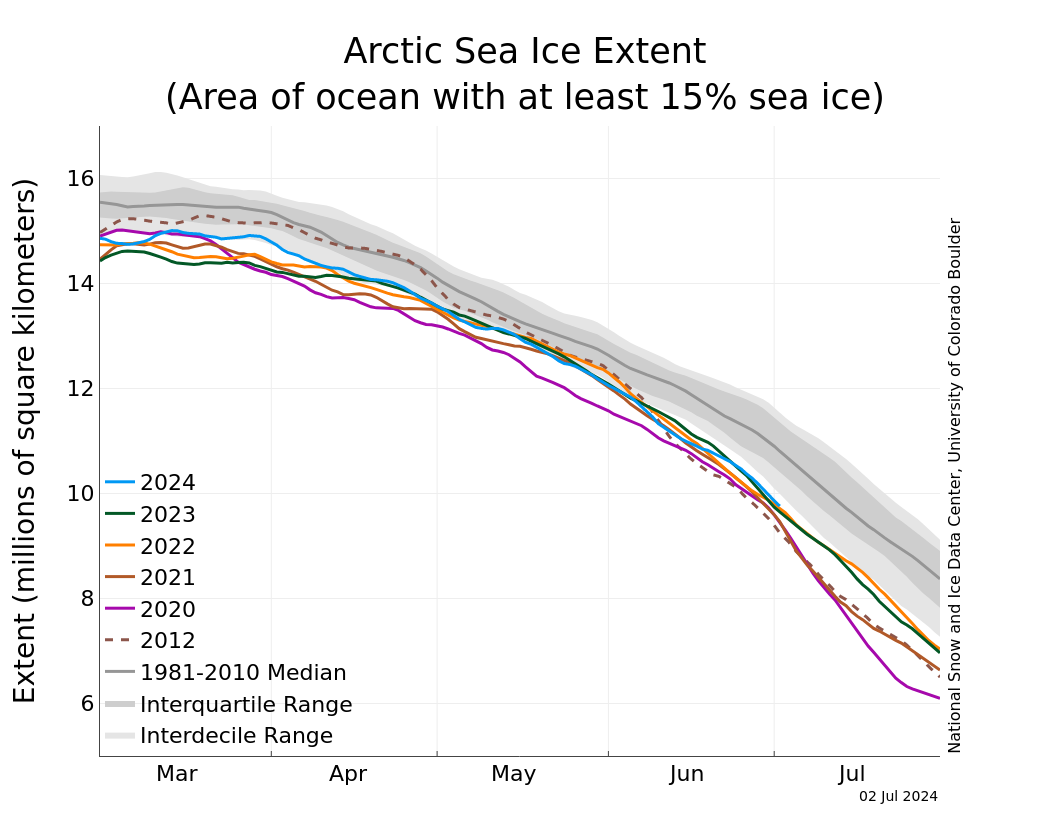
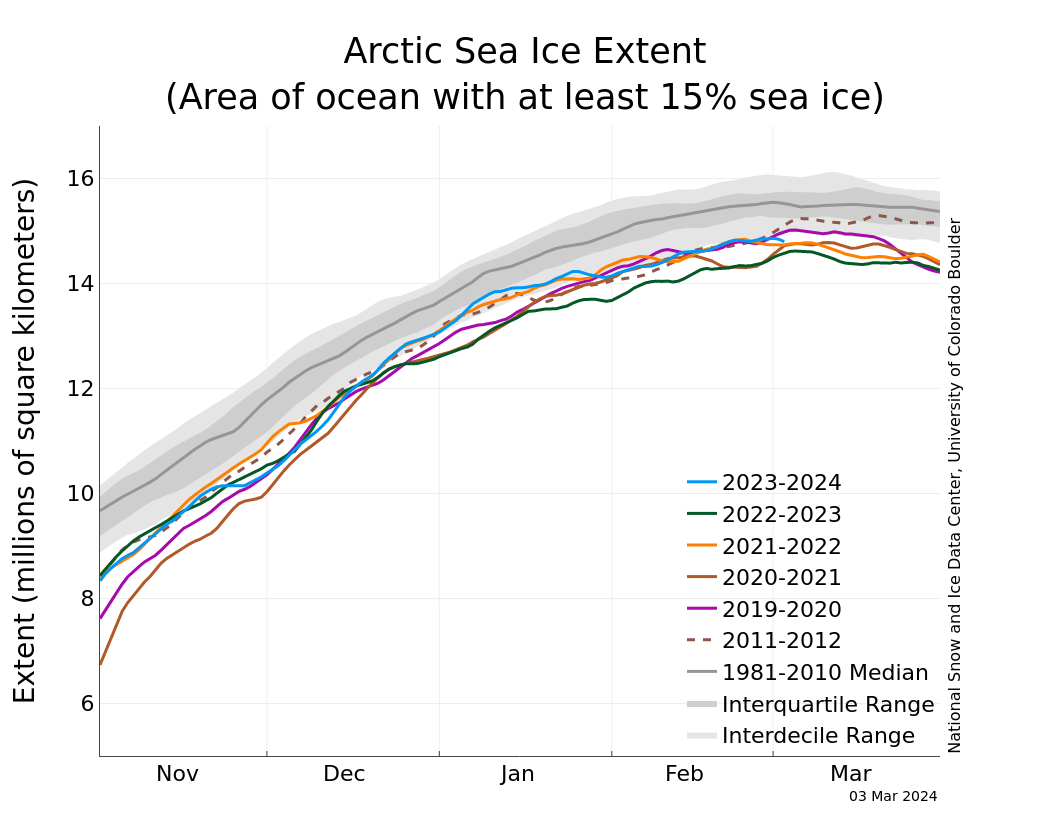
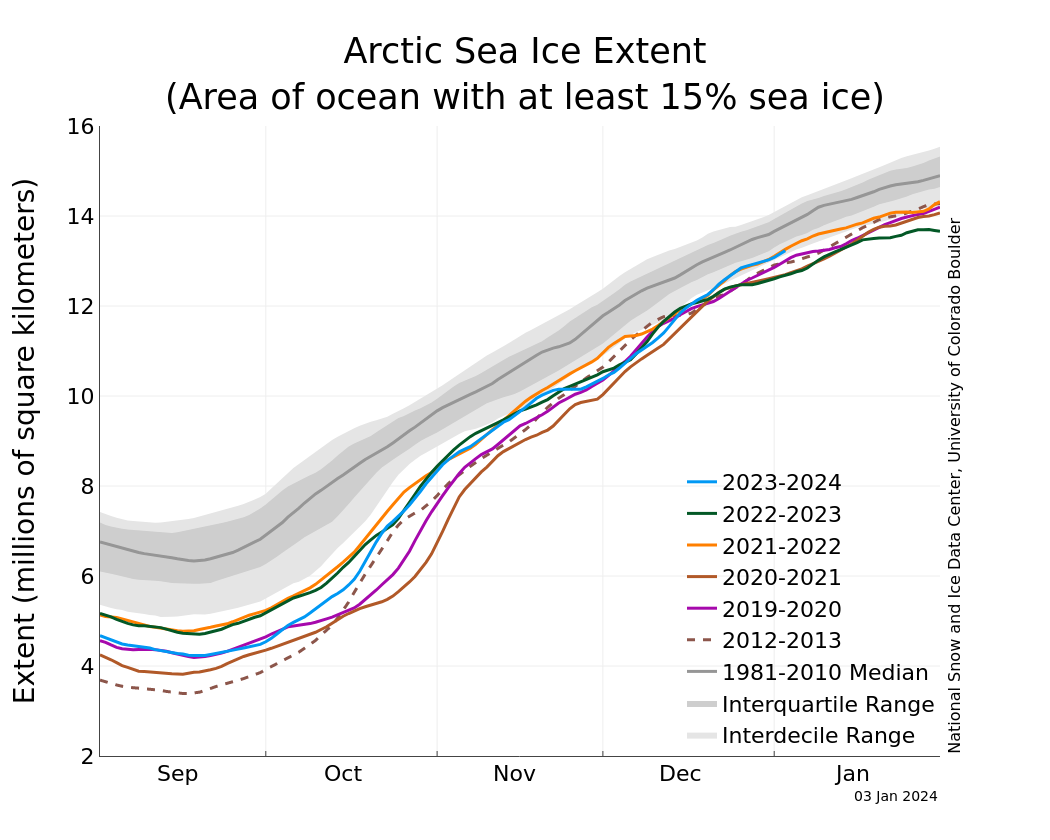
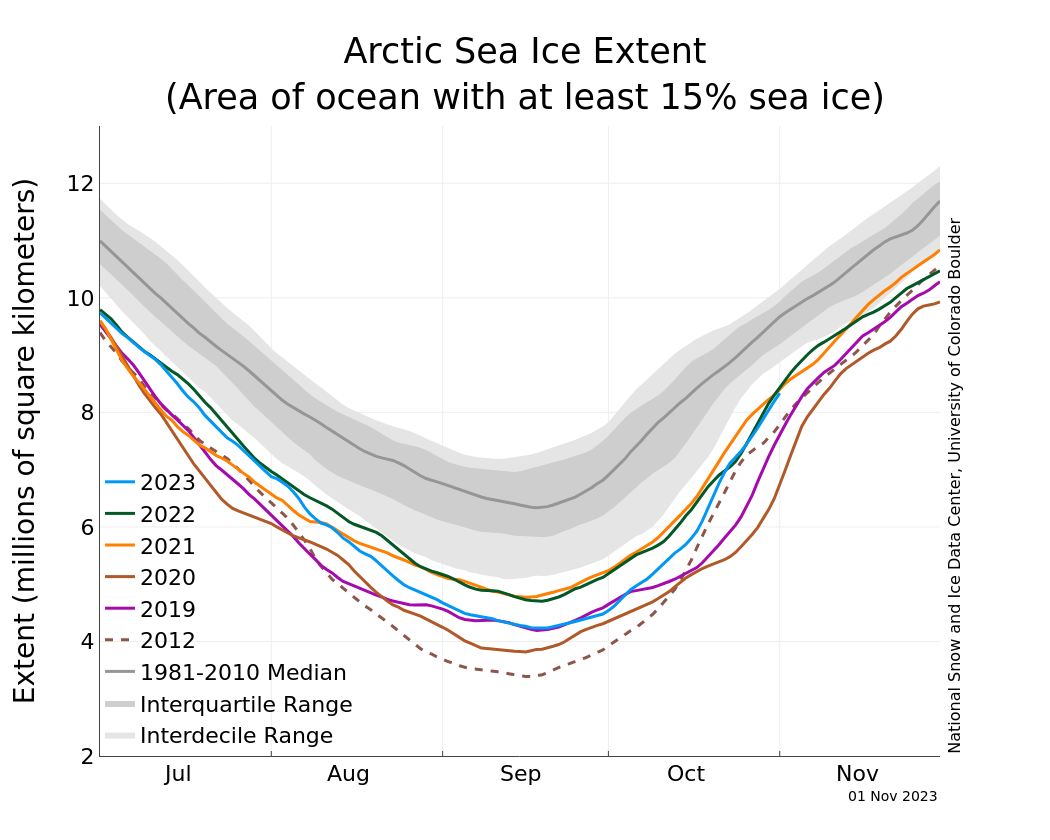
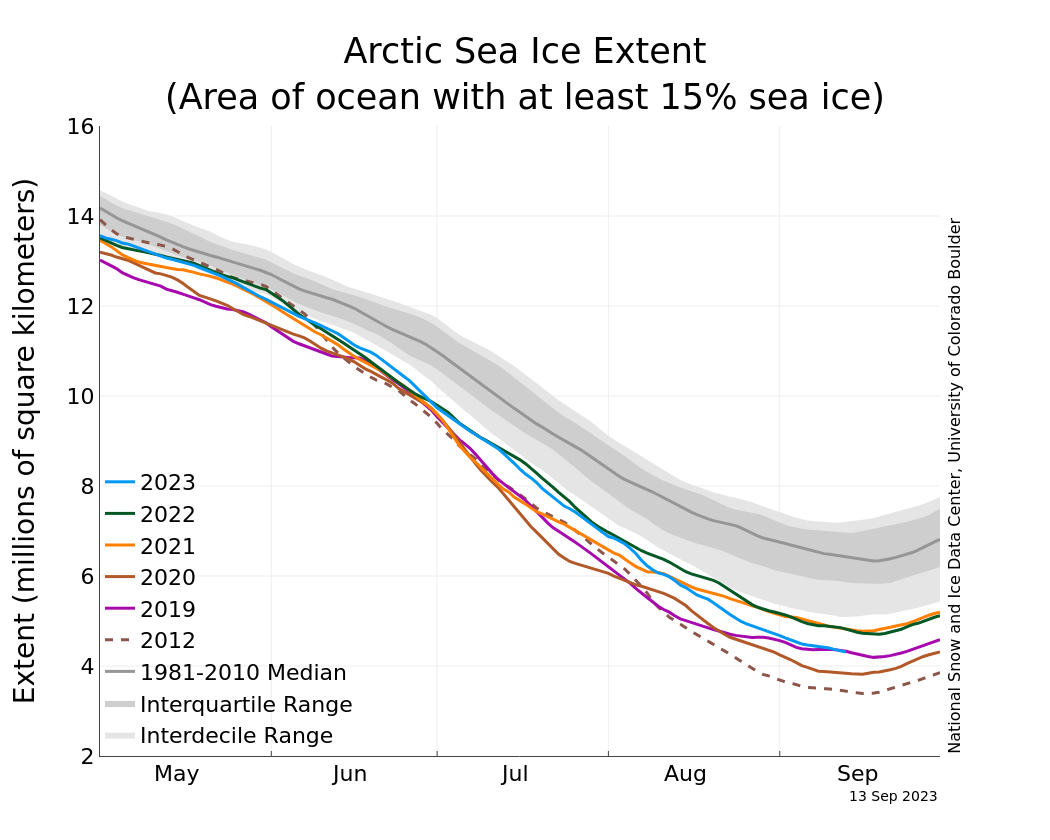
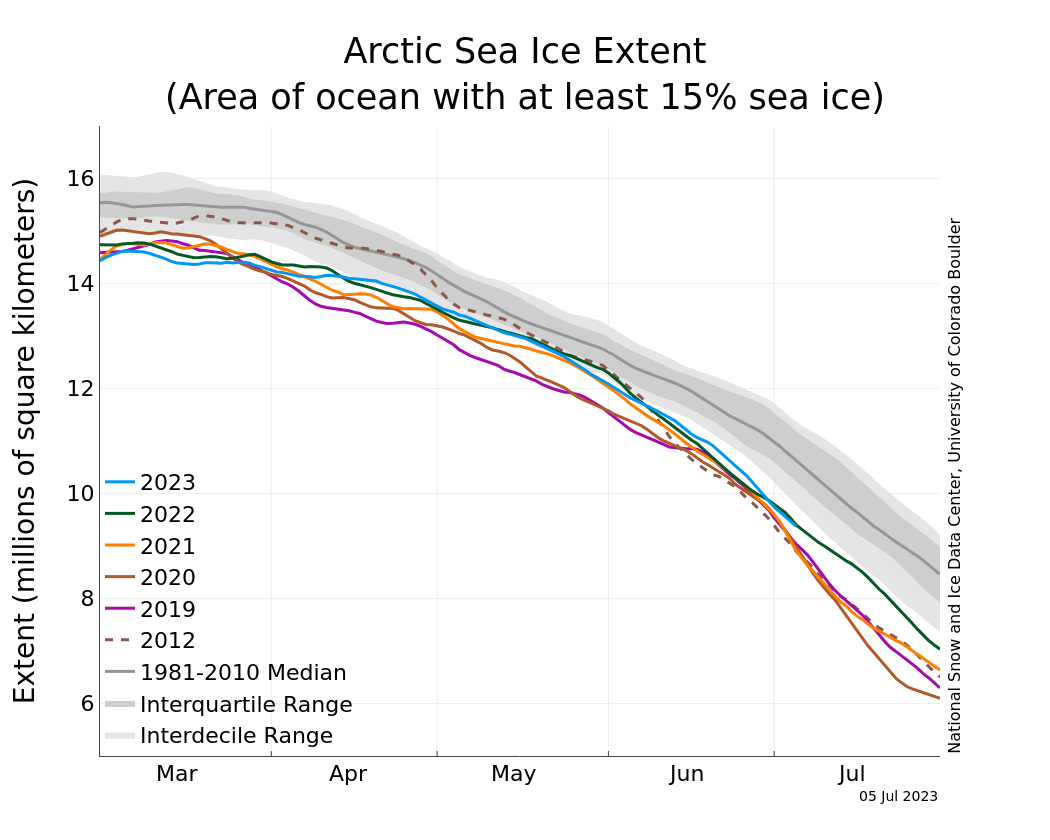
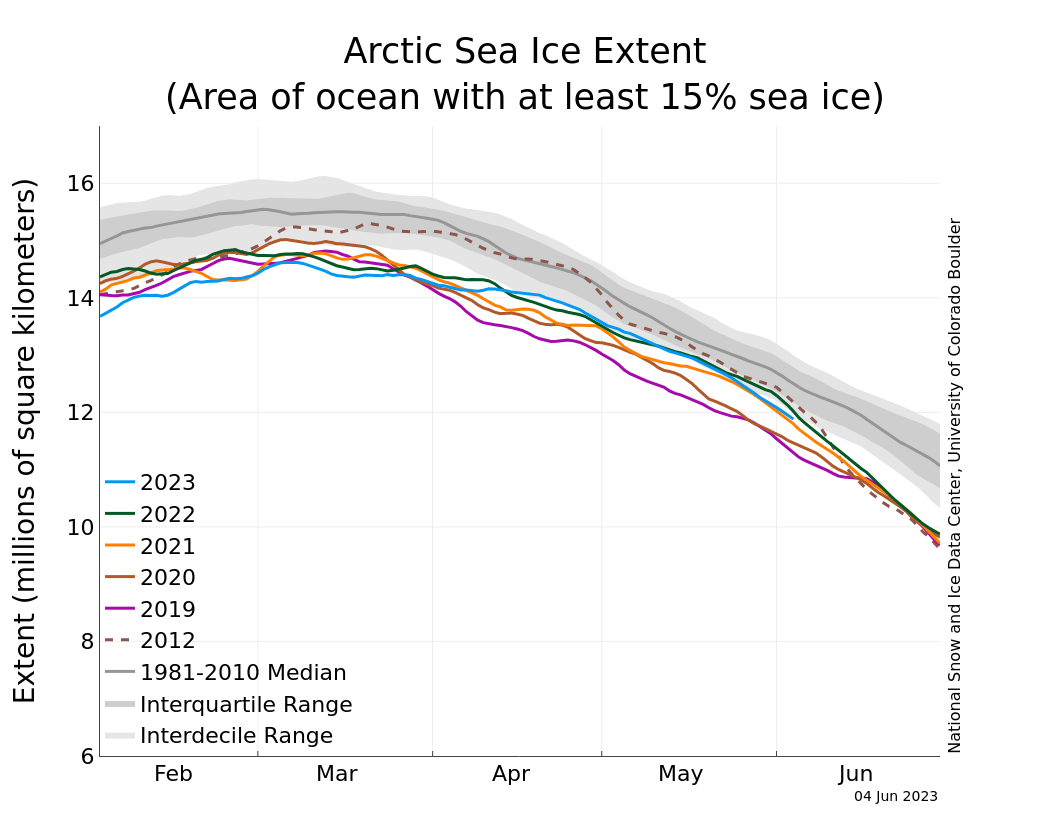
Figure 1b. The graph above shows Arctic sea ice extent as of July 2, 2024, along with daily ice extent data for four previous years and the record low year. 2024 is shown in blue, 2023 in green, 2022 in orange, 2021 in brown, 2020 in magenta, and 2012, the record low year, in dashed brown. The 1981 to 2010 median is in dark gray. The gray areas around the median line show the interquartile and interdecile ranges of the data. Sea Ice Index data.
Credit: National Snow and Ice Data Center
High-resolution image
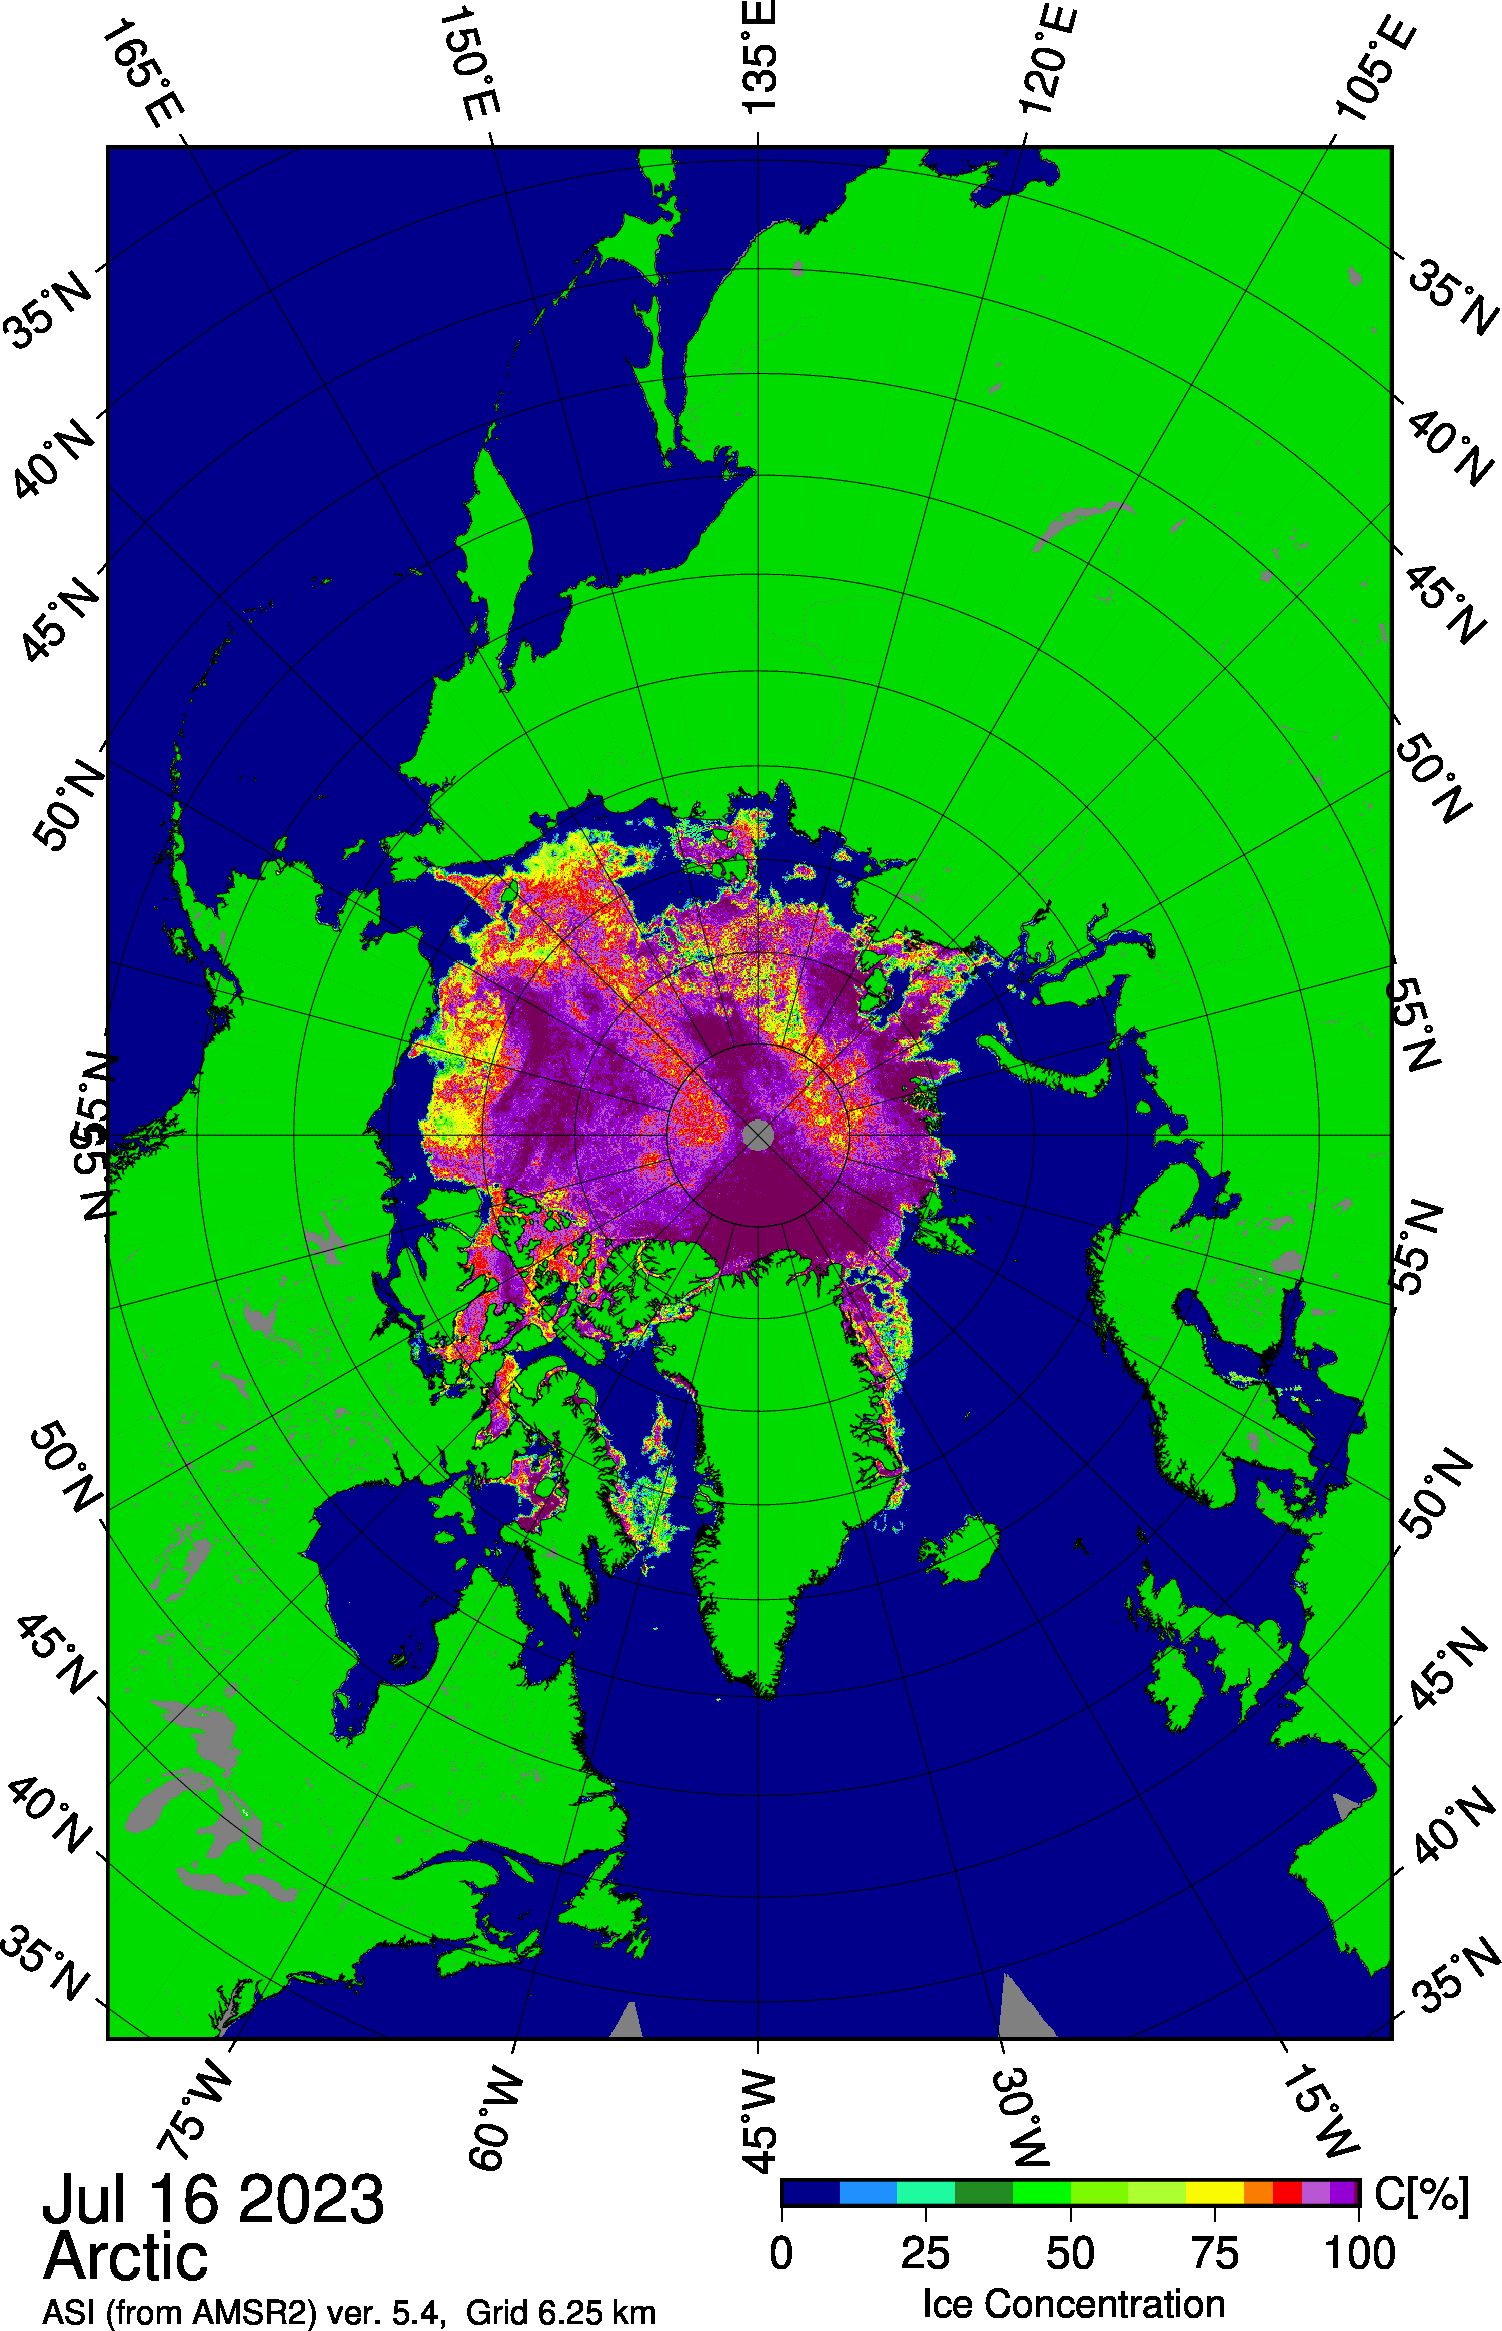
Arctic sea ice extent for June 2024 averaged 10.90 million square kilometers (4.21 million square miles), the twelfth lowest in the 46-year passive microwave satellite record (Figures 1a and 1b). As of the beginning of July, extent is well below average in Hudson Bay and slightly below- to near-average elsewhere. The exception is in the Chukchi Sea where ice is above average for this time of year. Ice retreat in June mostly occurred around the ice edge or along the coast except for the Laptev and Kara Seas, where open water developed in the interior of the ice pack. The Pikialasorsuaq (North Water Polynya) in northern Baffin Bay is also open. At the end of June, the ice extent was tracking above all years since 2012 except for 2013 and 2015.
Conditions in context
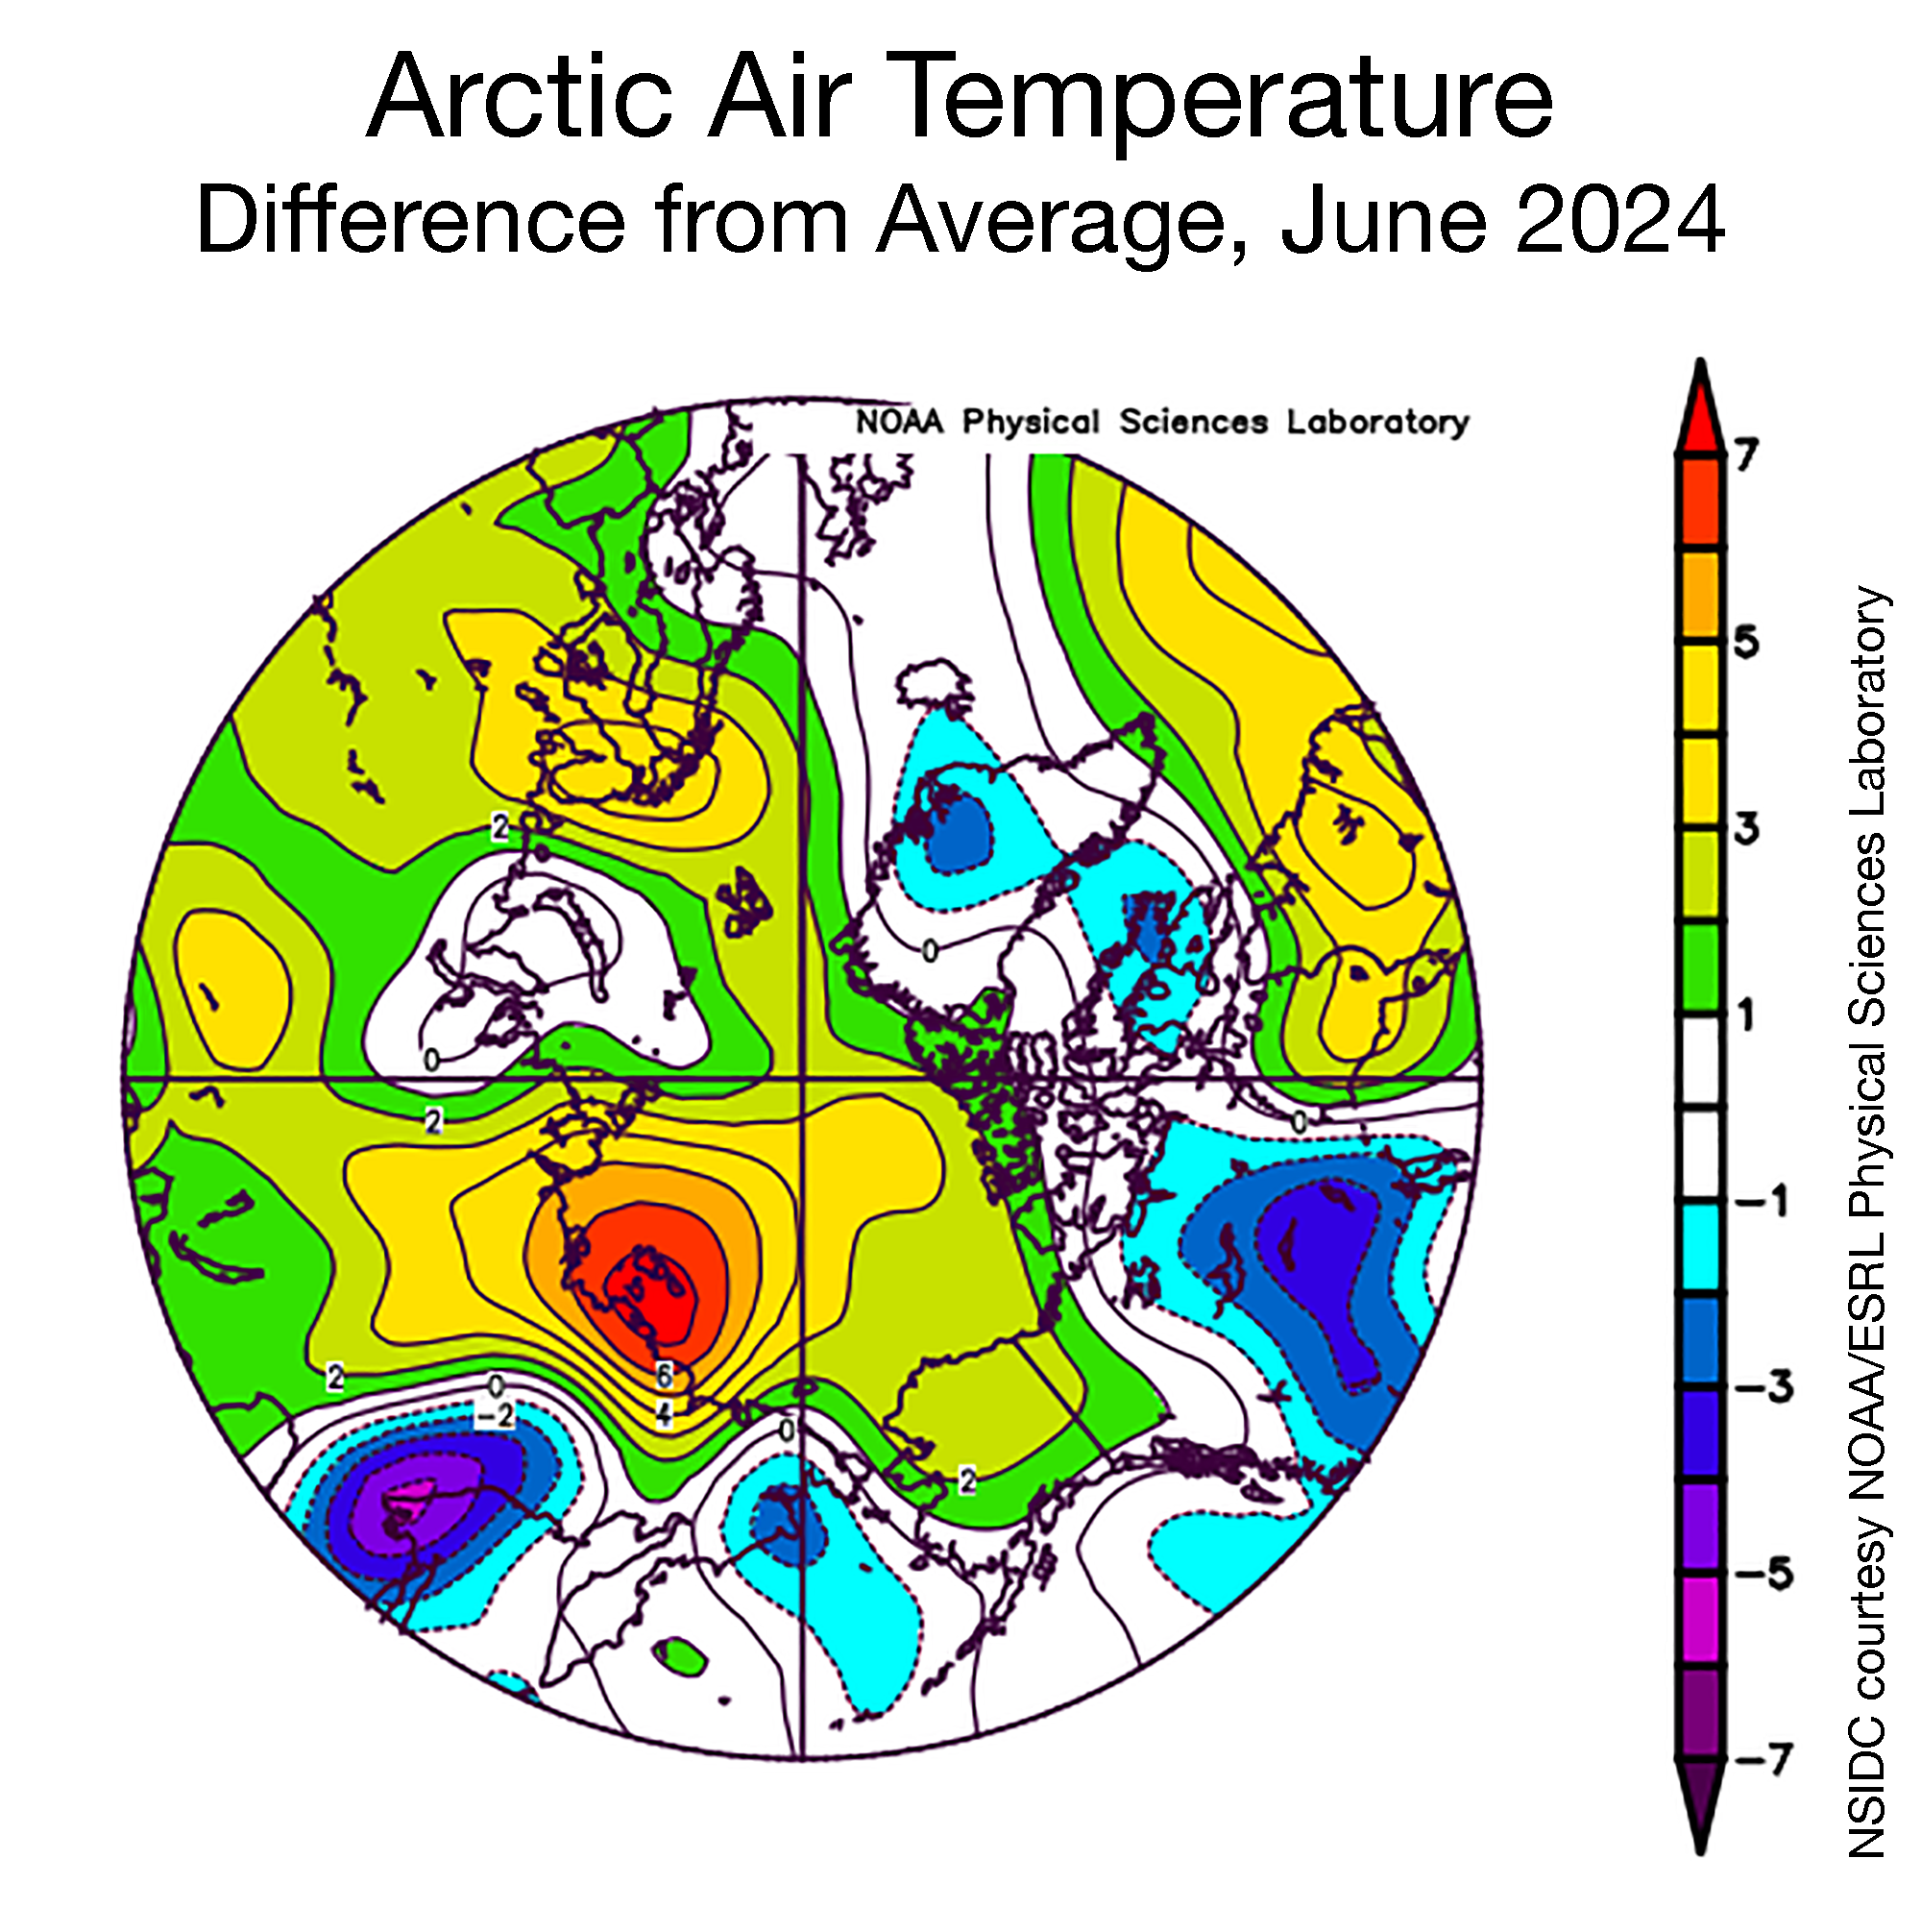
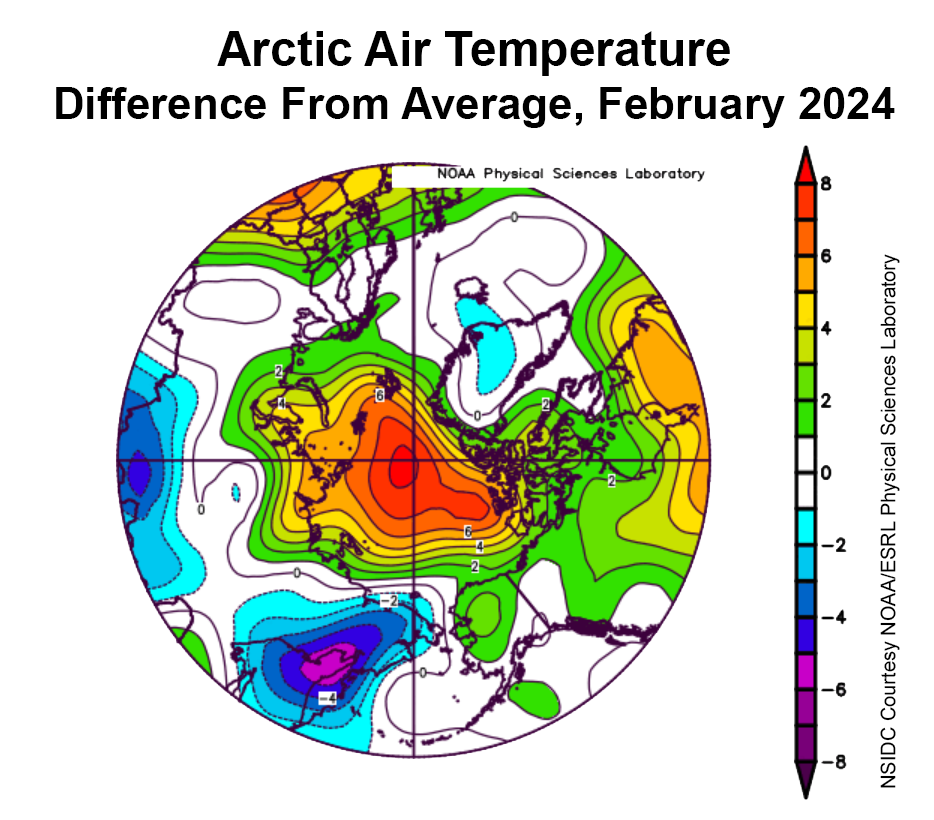
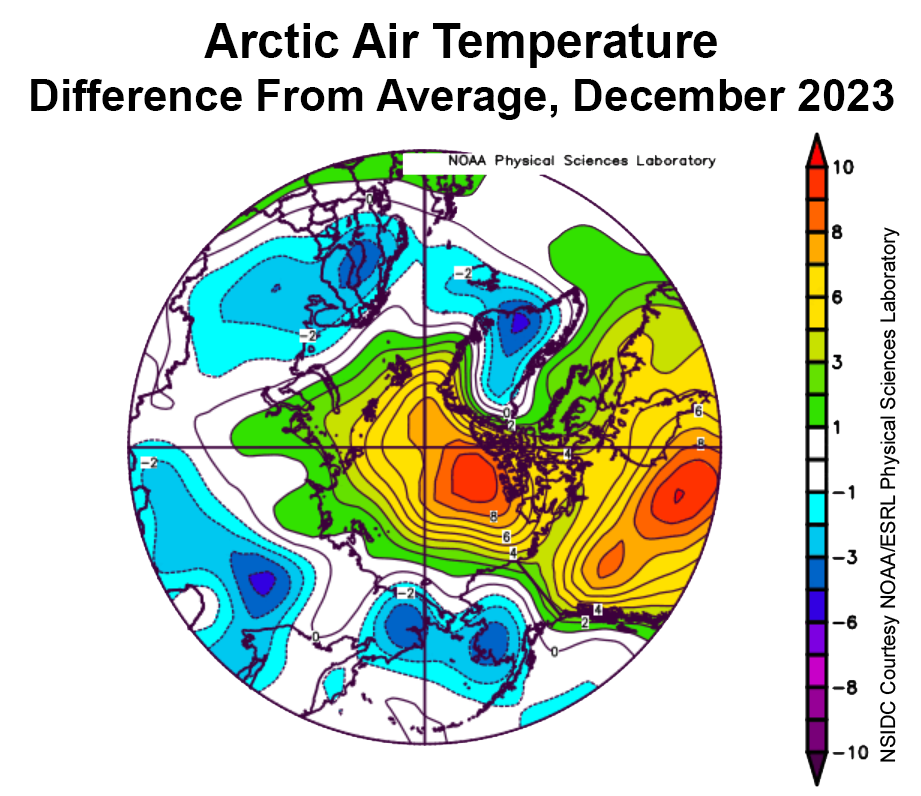
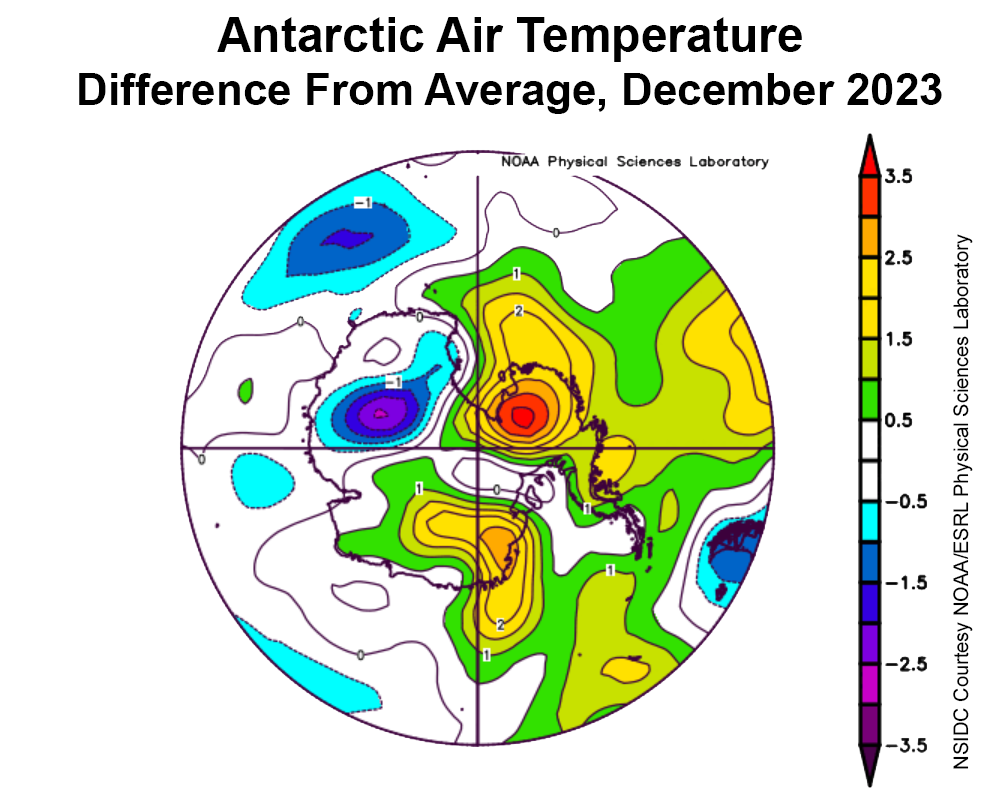
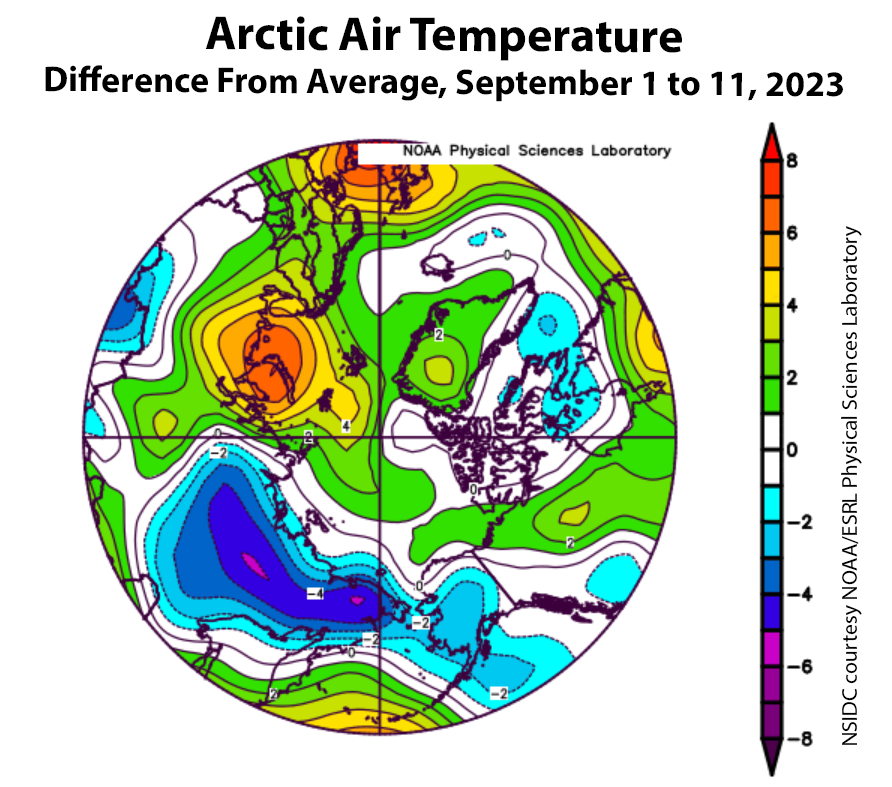
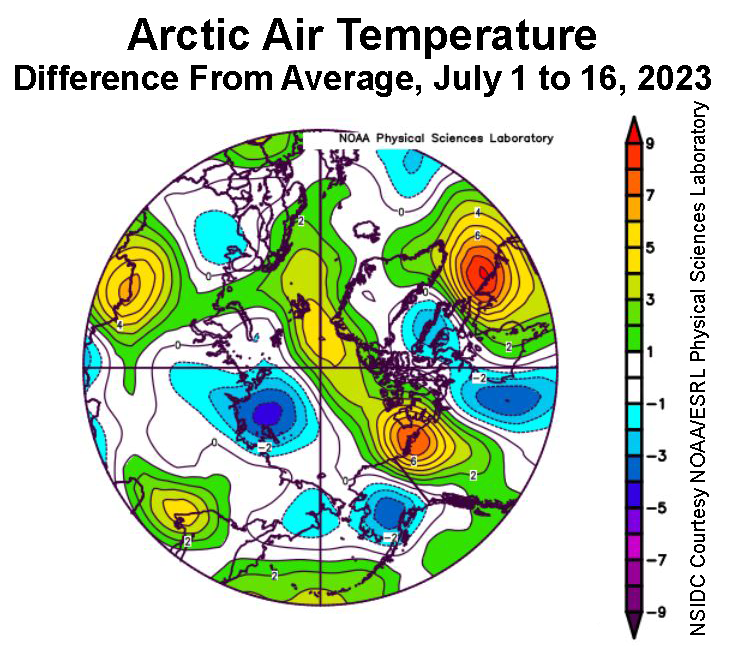
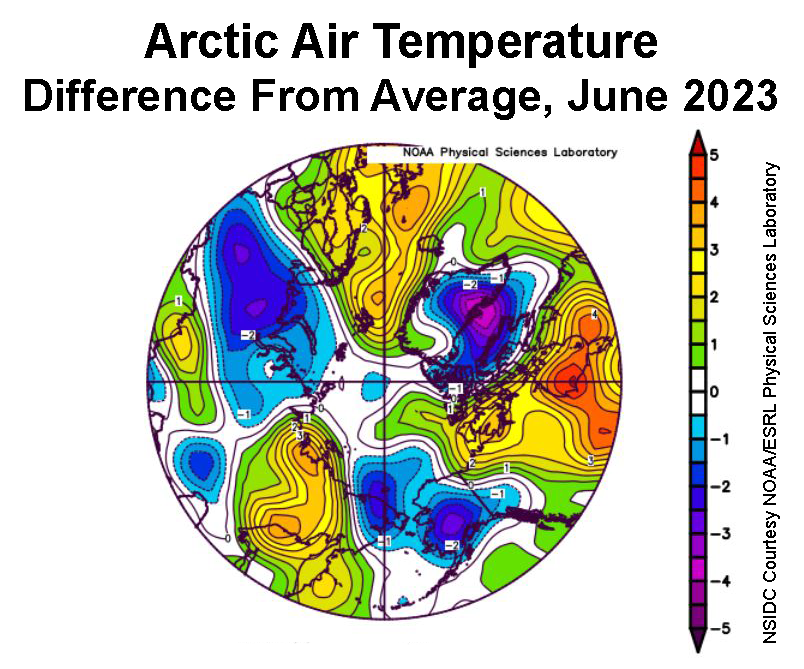
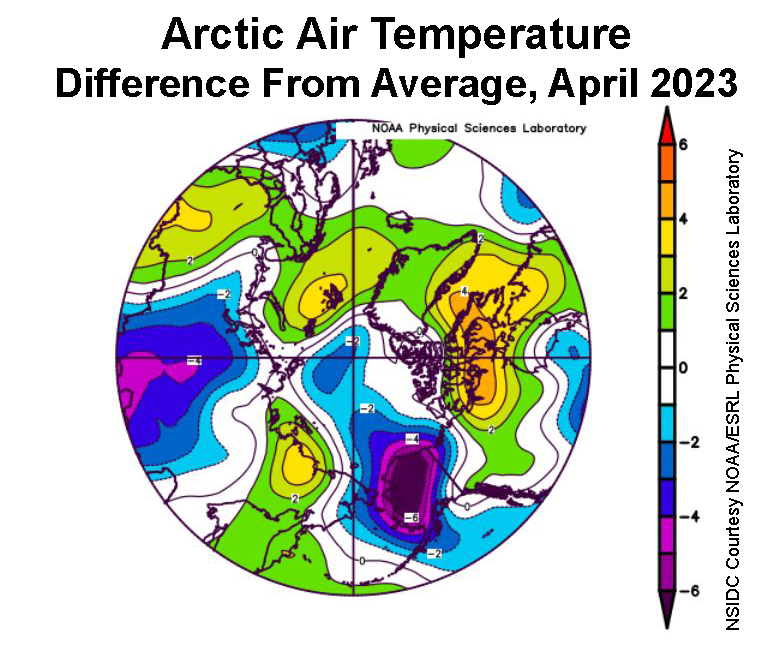
Figure 2a. This plot shows the departure from average air temperature in the Arctic at the 925 hPa level, in degrees Celsius, for June 2024. Yellows and reds indicate above average temperatures; blues and purples indicate below average temperatures.
Credit: NSIDC courtesy NOAA Earth System Research Laboratory Physical Sciences Laboratory
High-resolution image
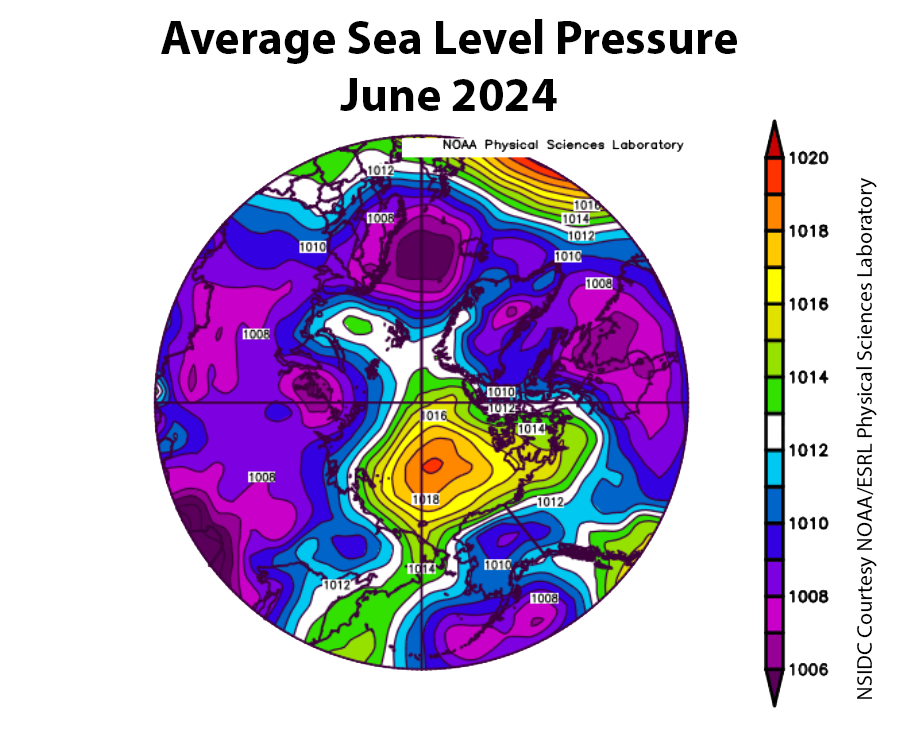
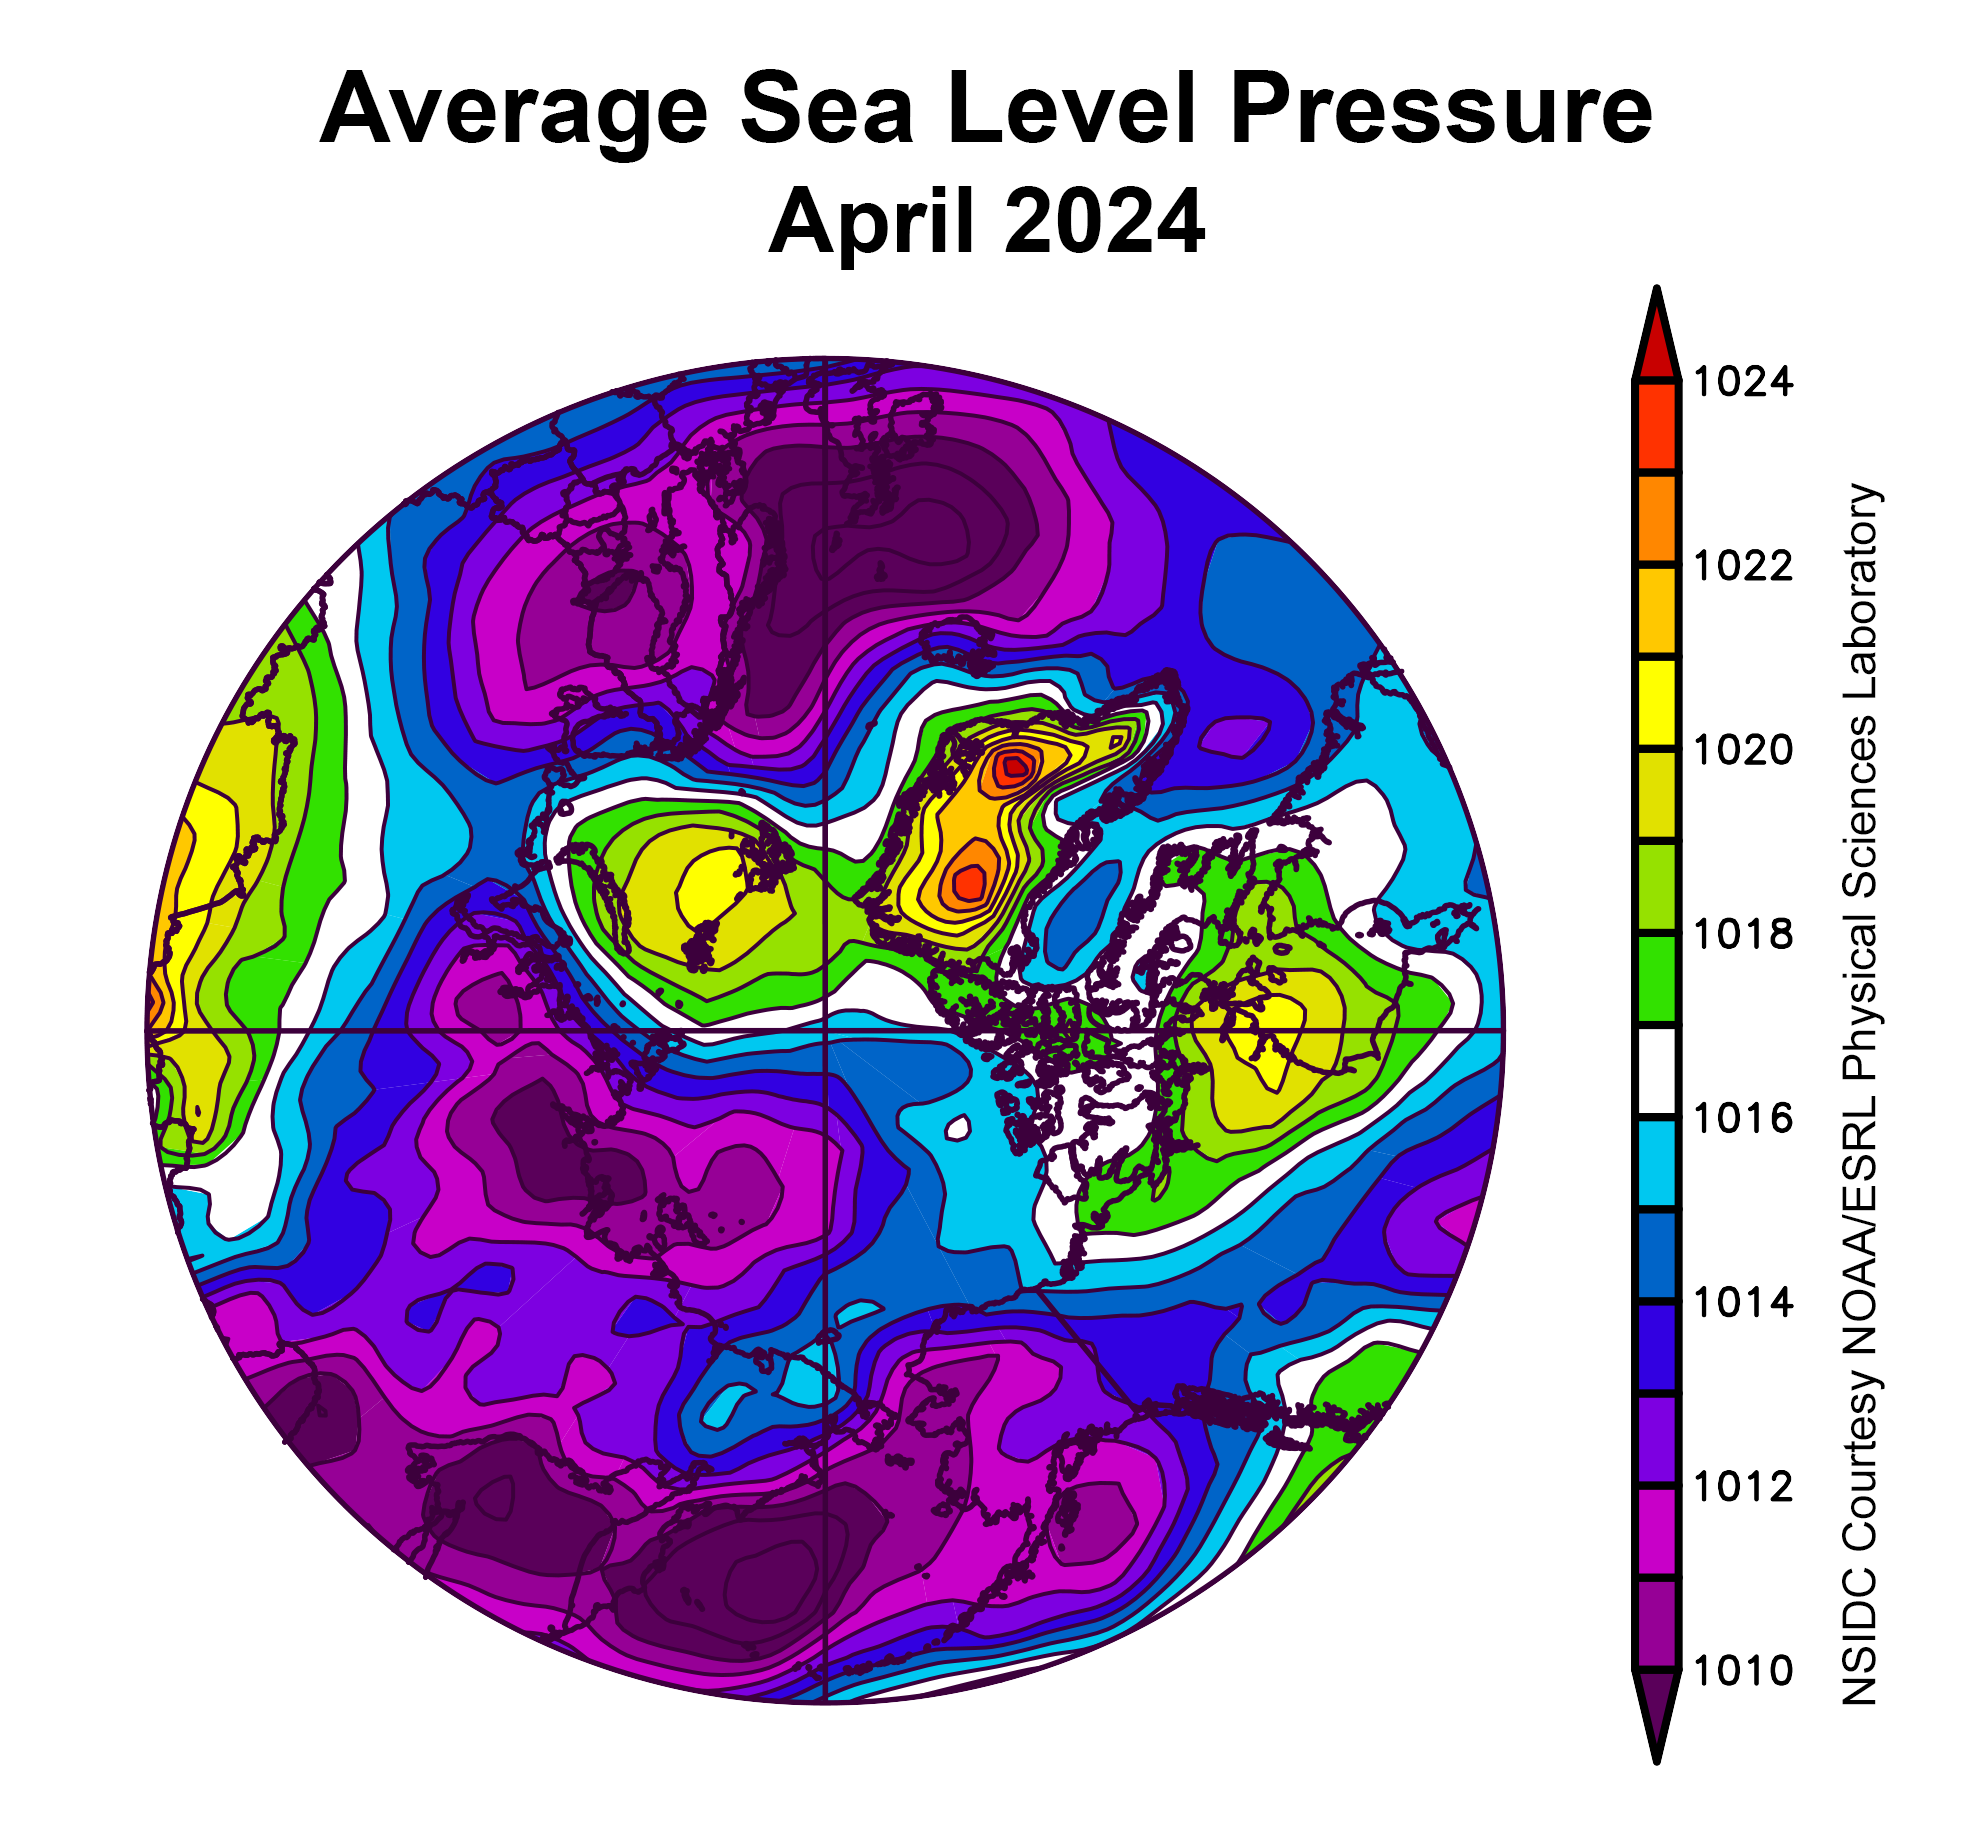
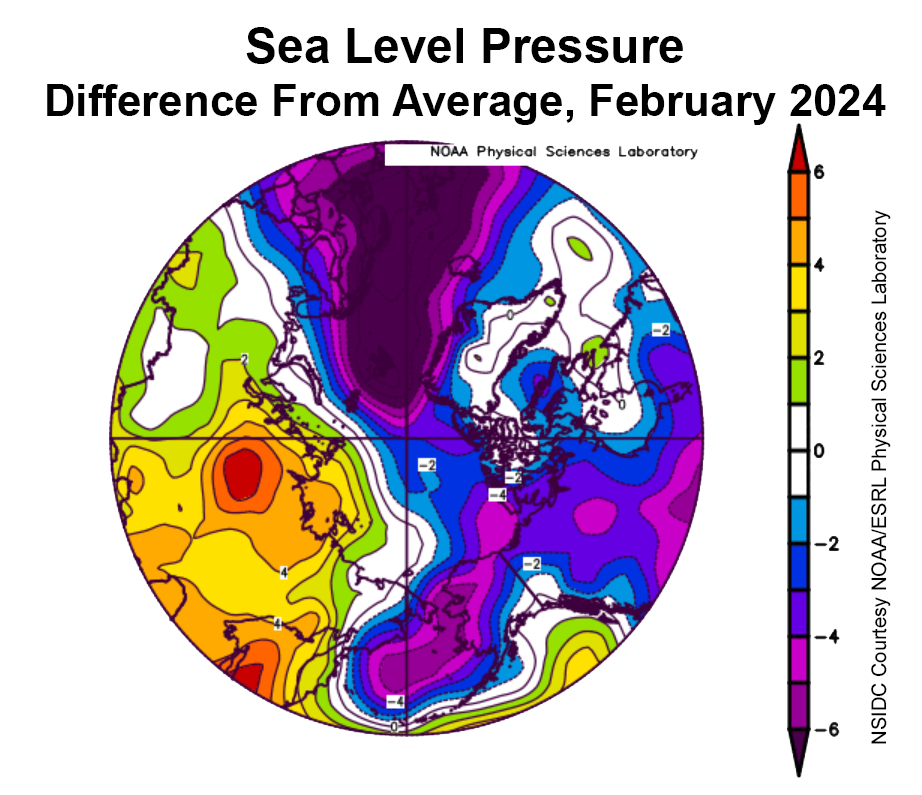
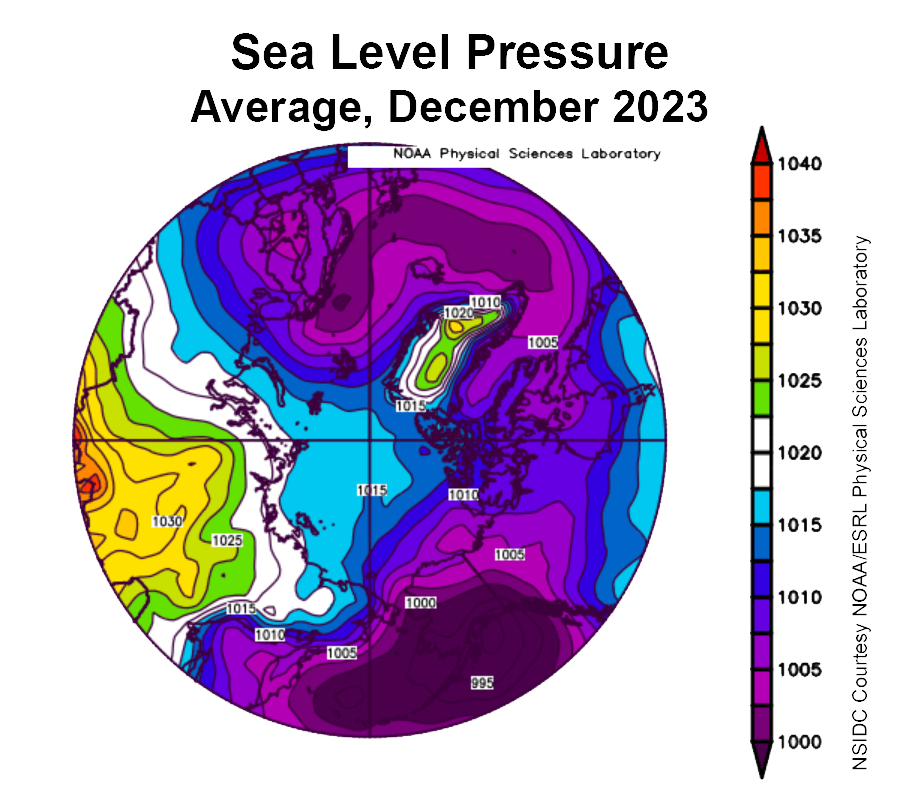
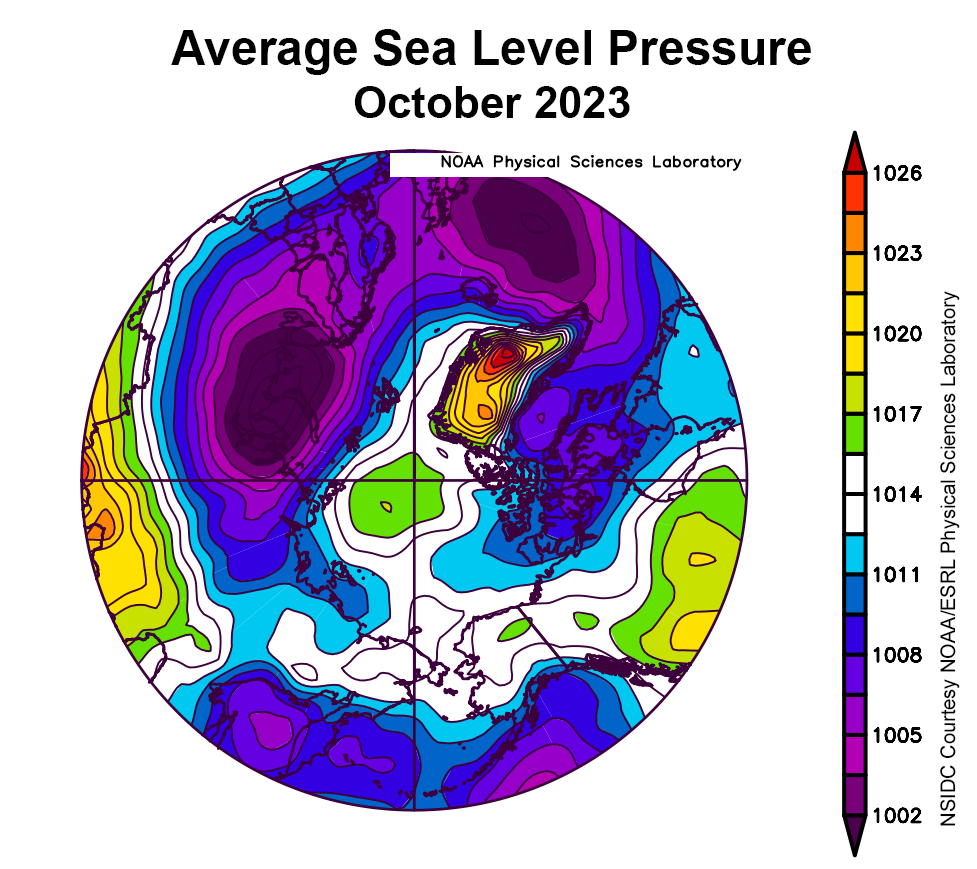
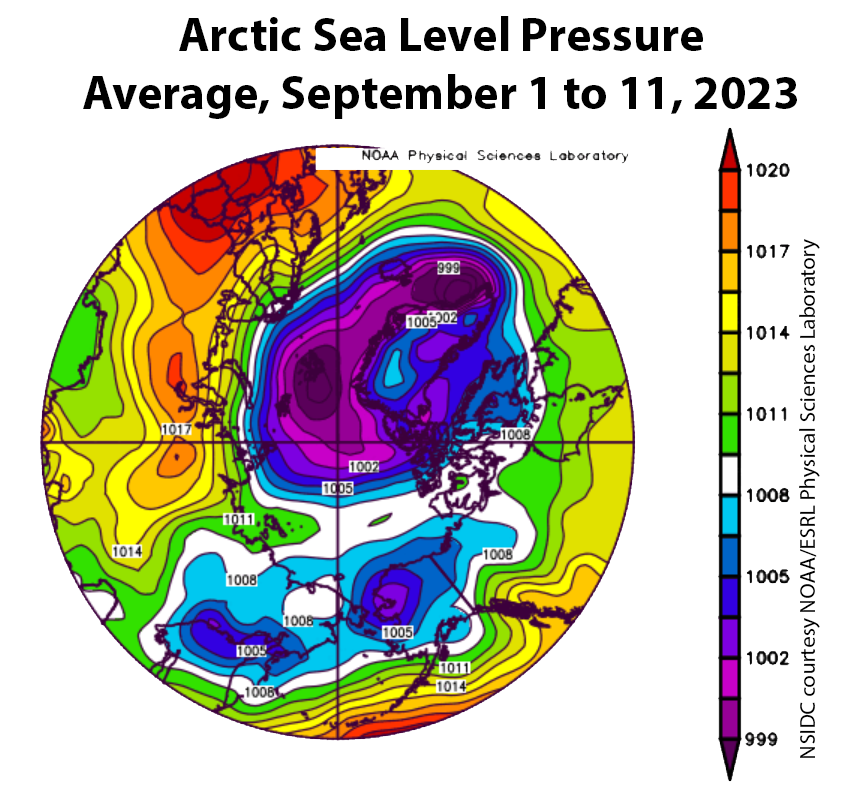
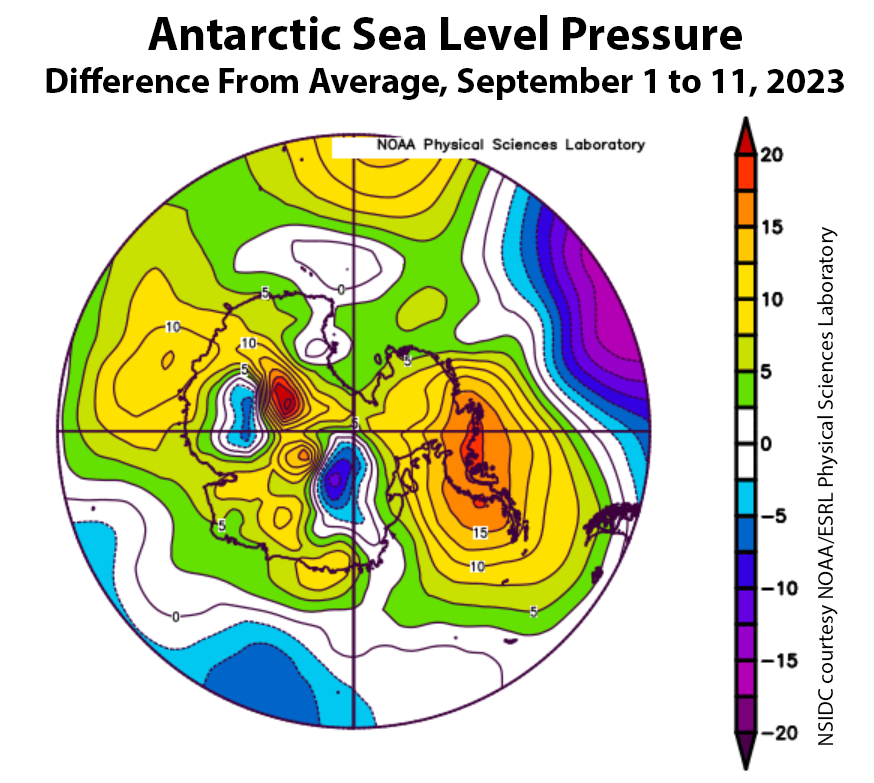
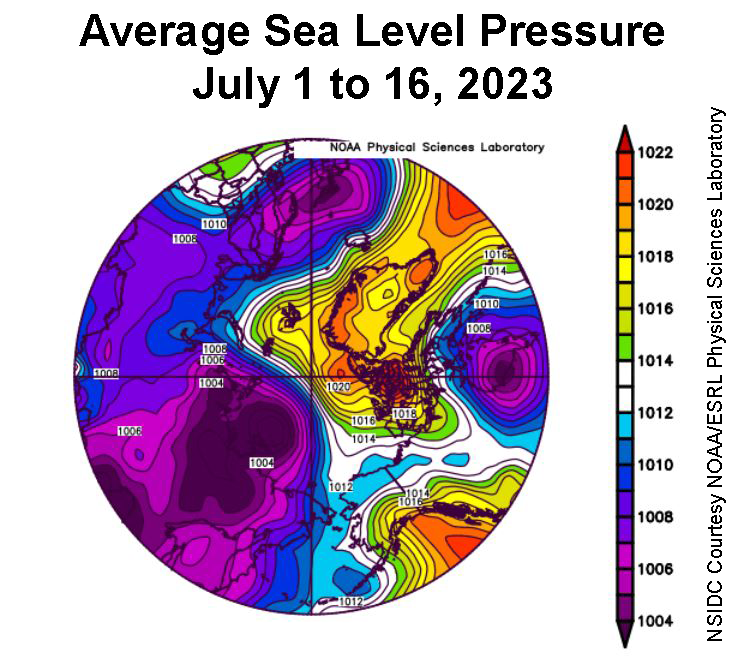
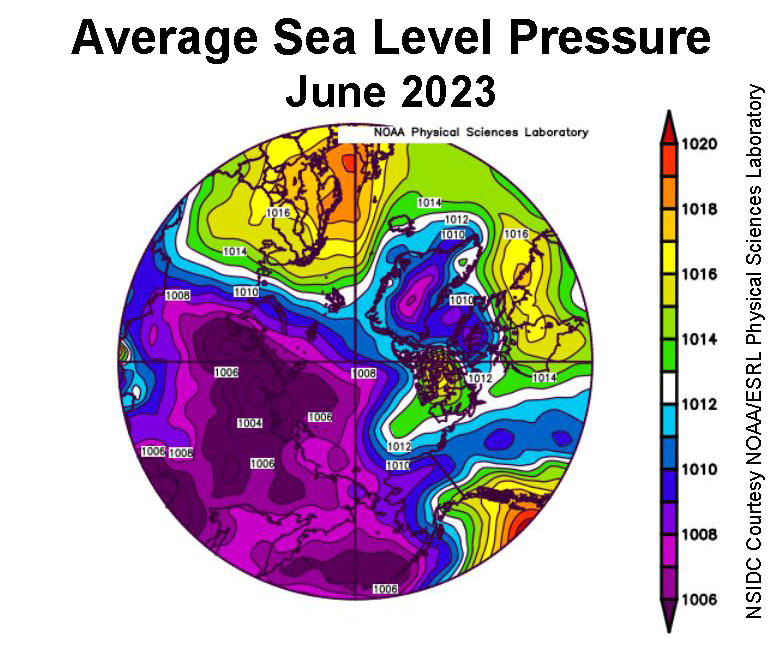
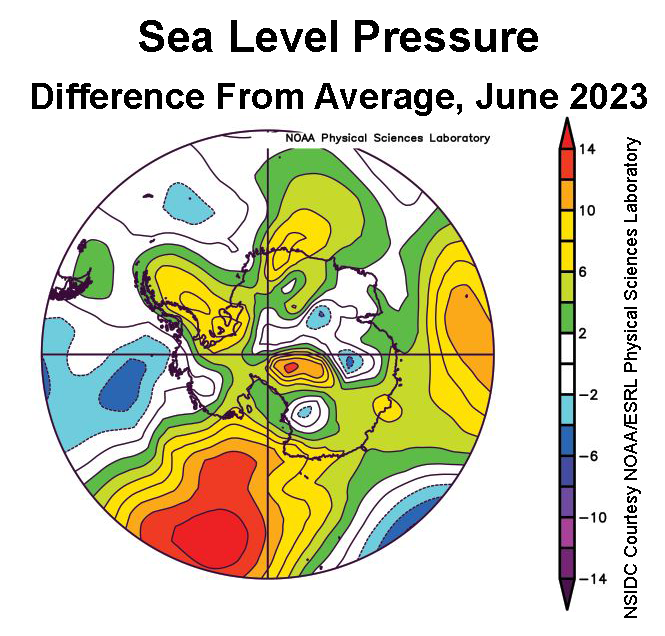
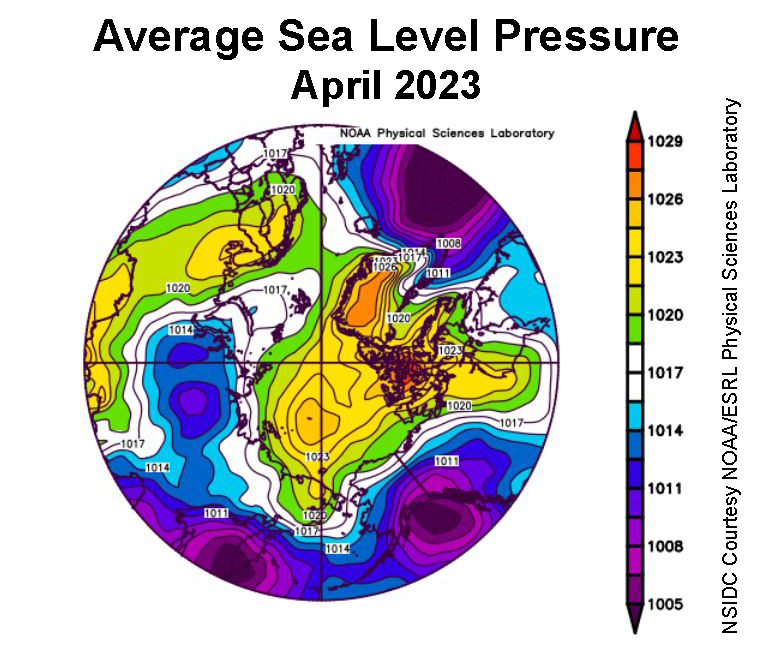
Figure 2b. This plot shows average sea level pressure in the Arctic in millibars for June 2024. Yellows and reds indicate above average air pressures; blues and purples indicate below average air pressures.
Credit: NSIDC courtesy NOAA Earth System Research Laboratory Physical Sciences Laboratory
High-resolution image
Air temperature at the 925 hPa level (about 2,500 feet above the surface) over the Arctic Ocean were mostly 1 to 4 degrees Celsius (2 to 7 degrees Fahrenheit) above average but as much as 7 degrees Celsius (13 degrees Fahrenheit) above average in the Laptev Sea where openings are observed in the sea ice cover (Figure 2a). Near the Bering Sea, along the coast in the Kara Sea, and in the middle of Baffin Bay, temperatures were 1 to 3 degrees Celsius (2 to 5 degrees Fahrenheit) below average.
The sea level pressure pattern for June was characterized by above average high pressure over the central Arctic Ocean, reflecting a robust Beaufort High, and below average pressure in the North Atlantic, with its center located above Iceland (Figure 2b). Typically under a strong Beaufort High, there are clear skies, which during the summer allow the sun’s energy to reach the sea ice surface and initiate melt. A strong Beaufort High also strengthens the clockwise circulation in the Arctic Ocean, resulting in ice being pushed westward towards the Chukchi Sea and southward out of Fram Strait.
June 2024 compared to previous years
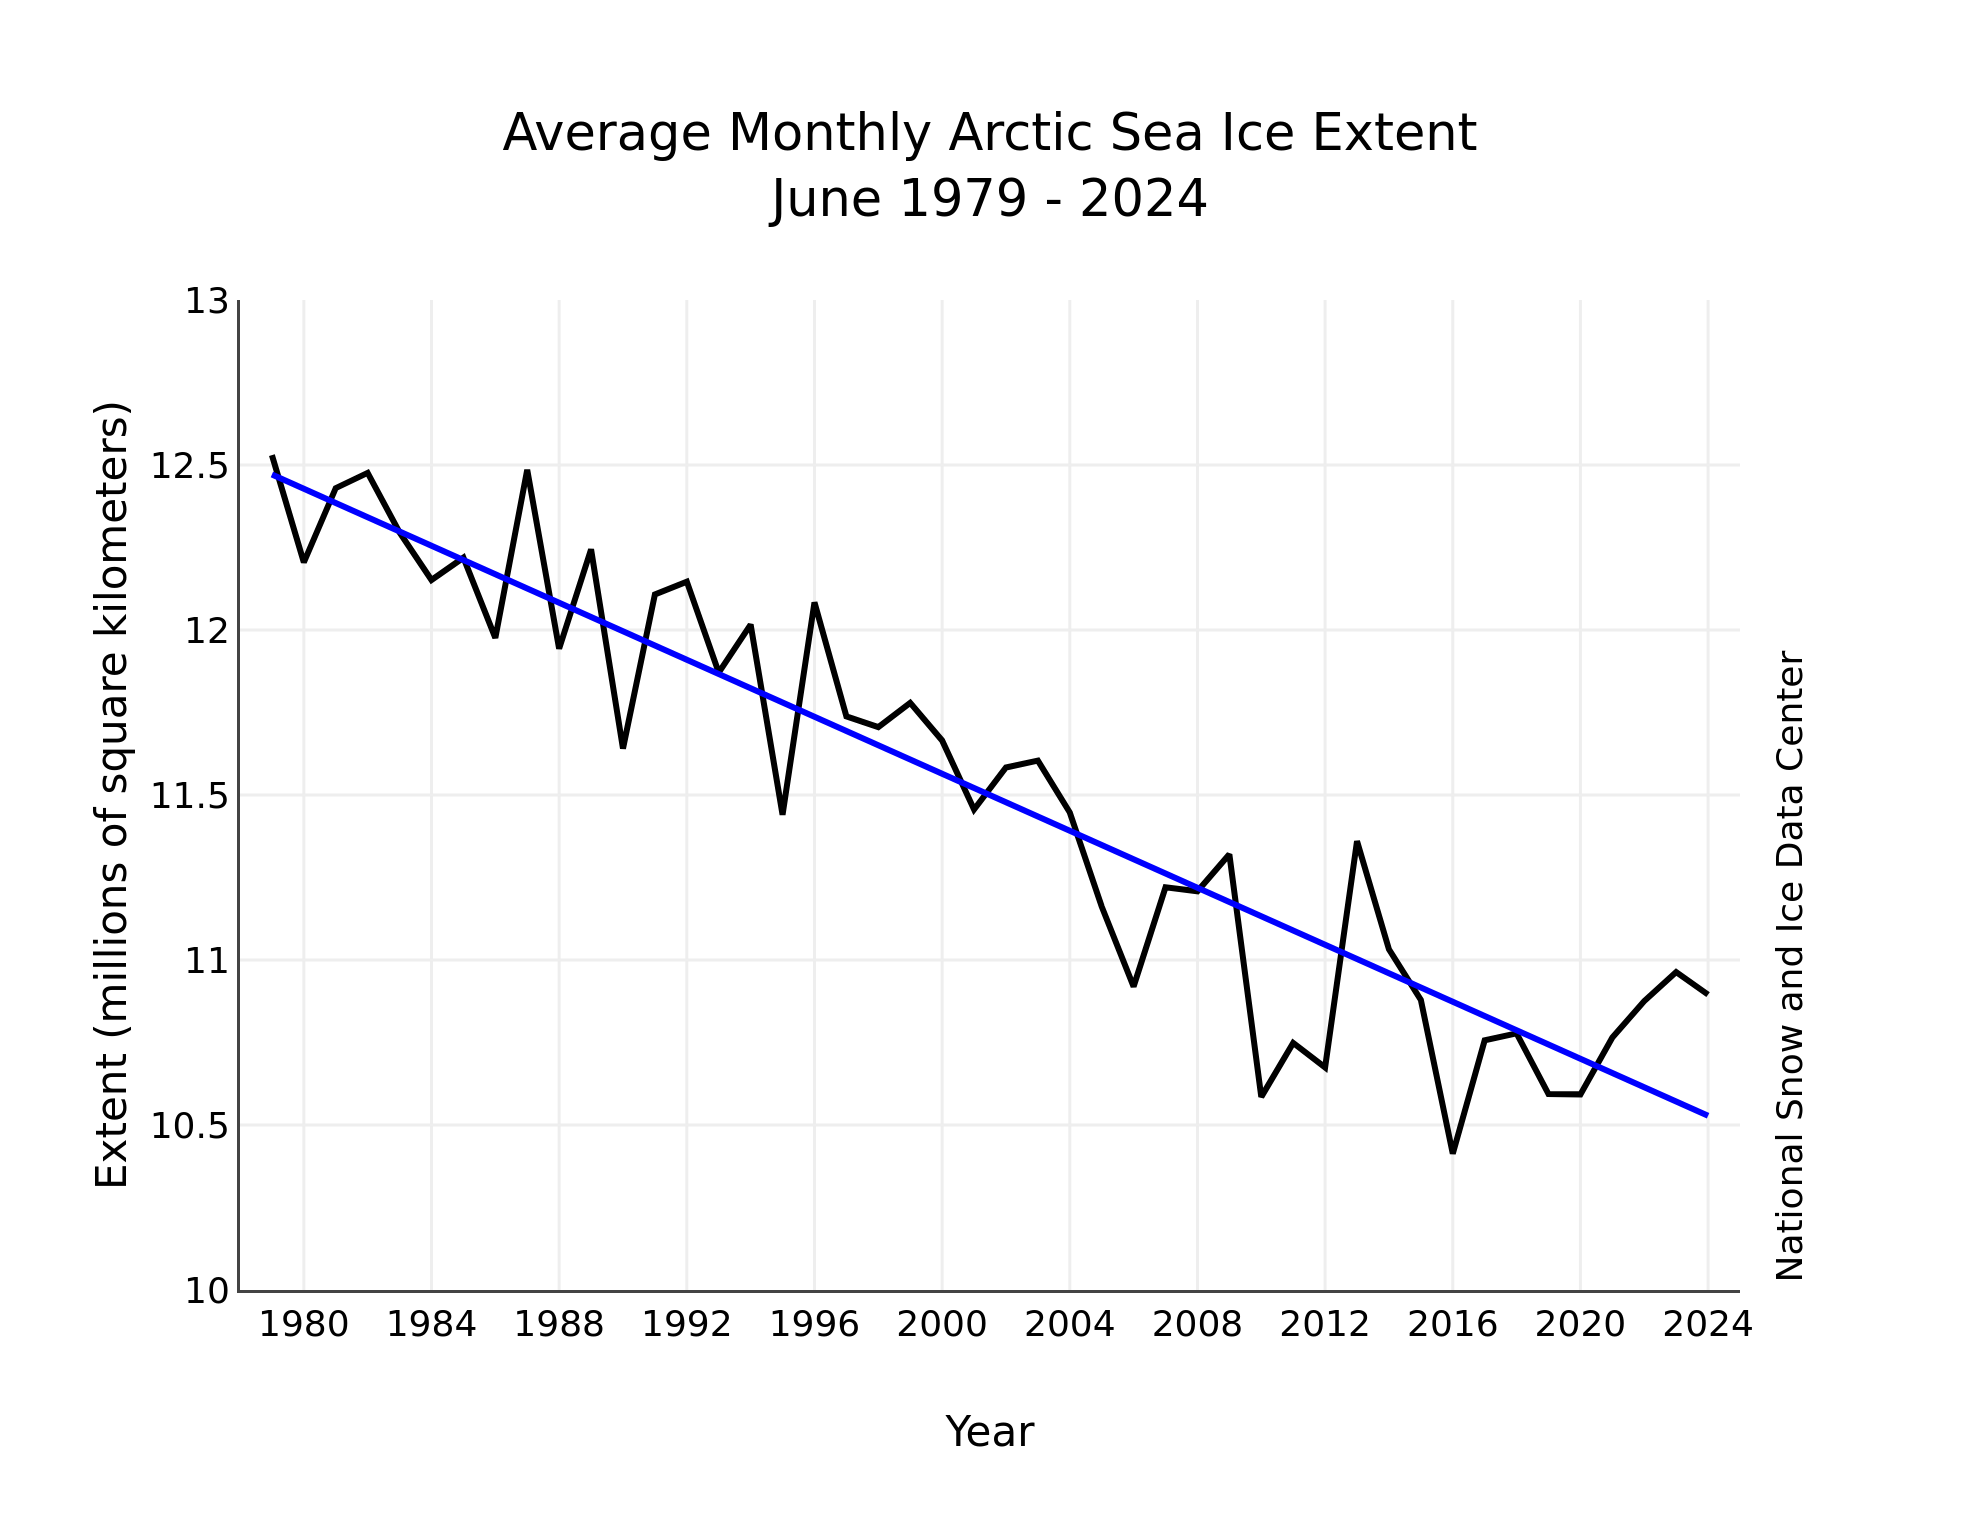
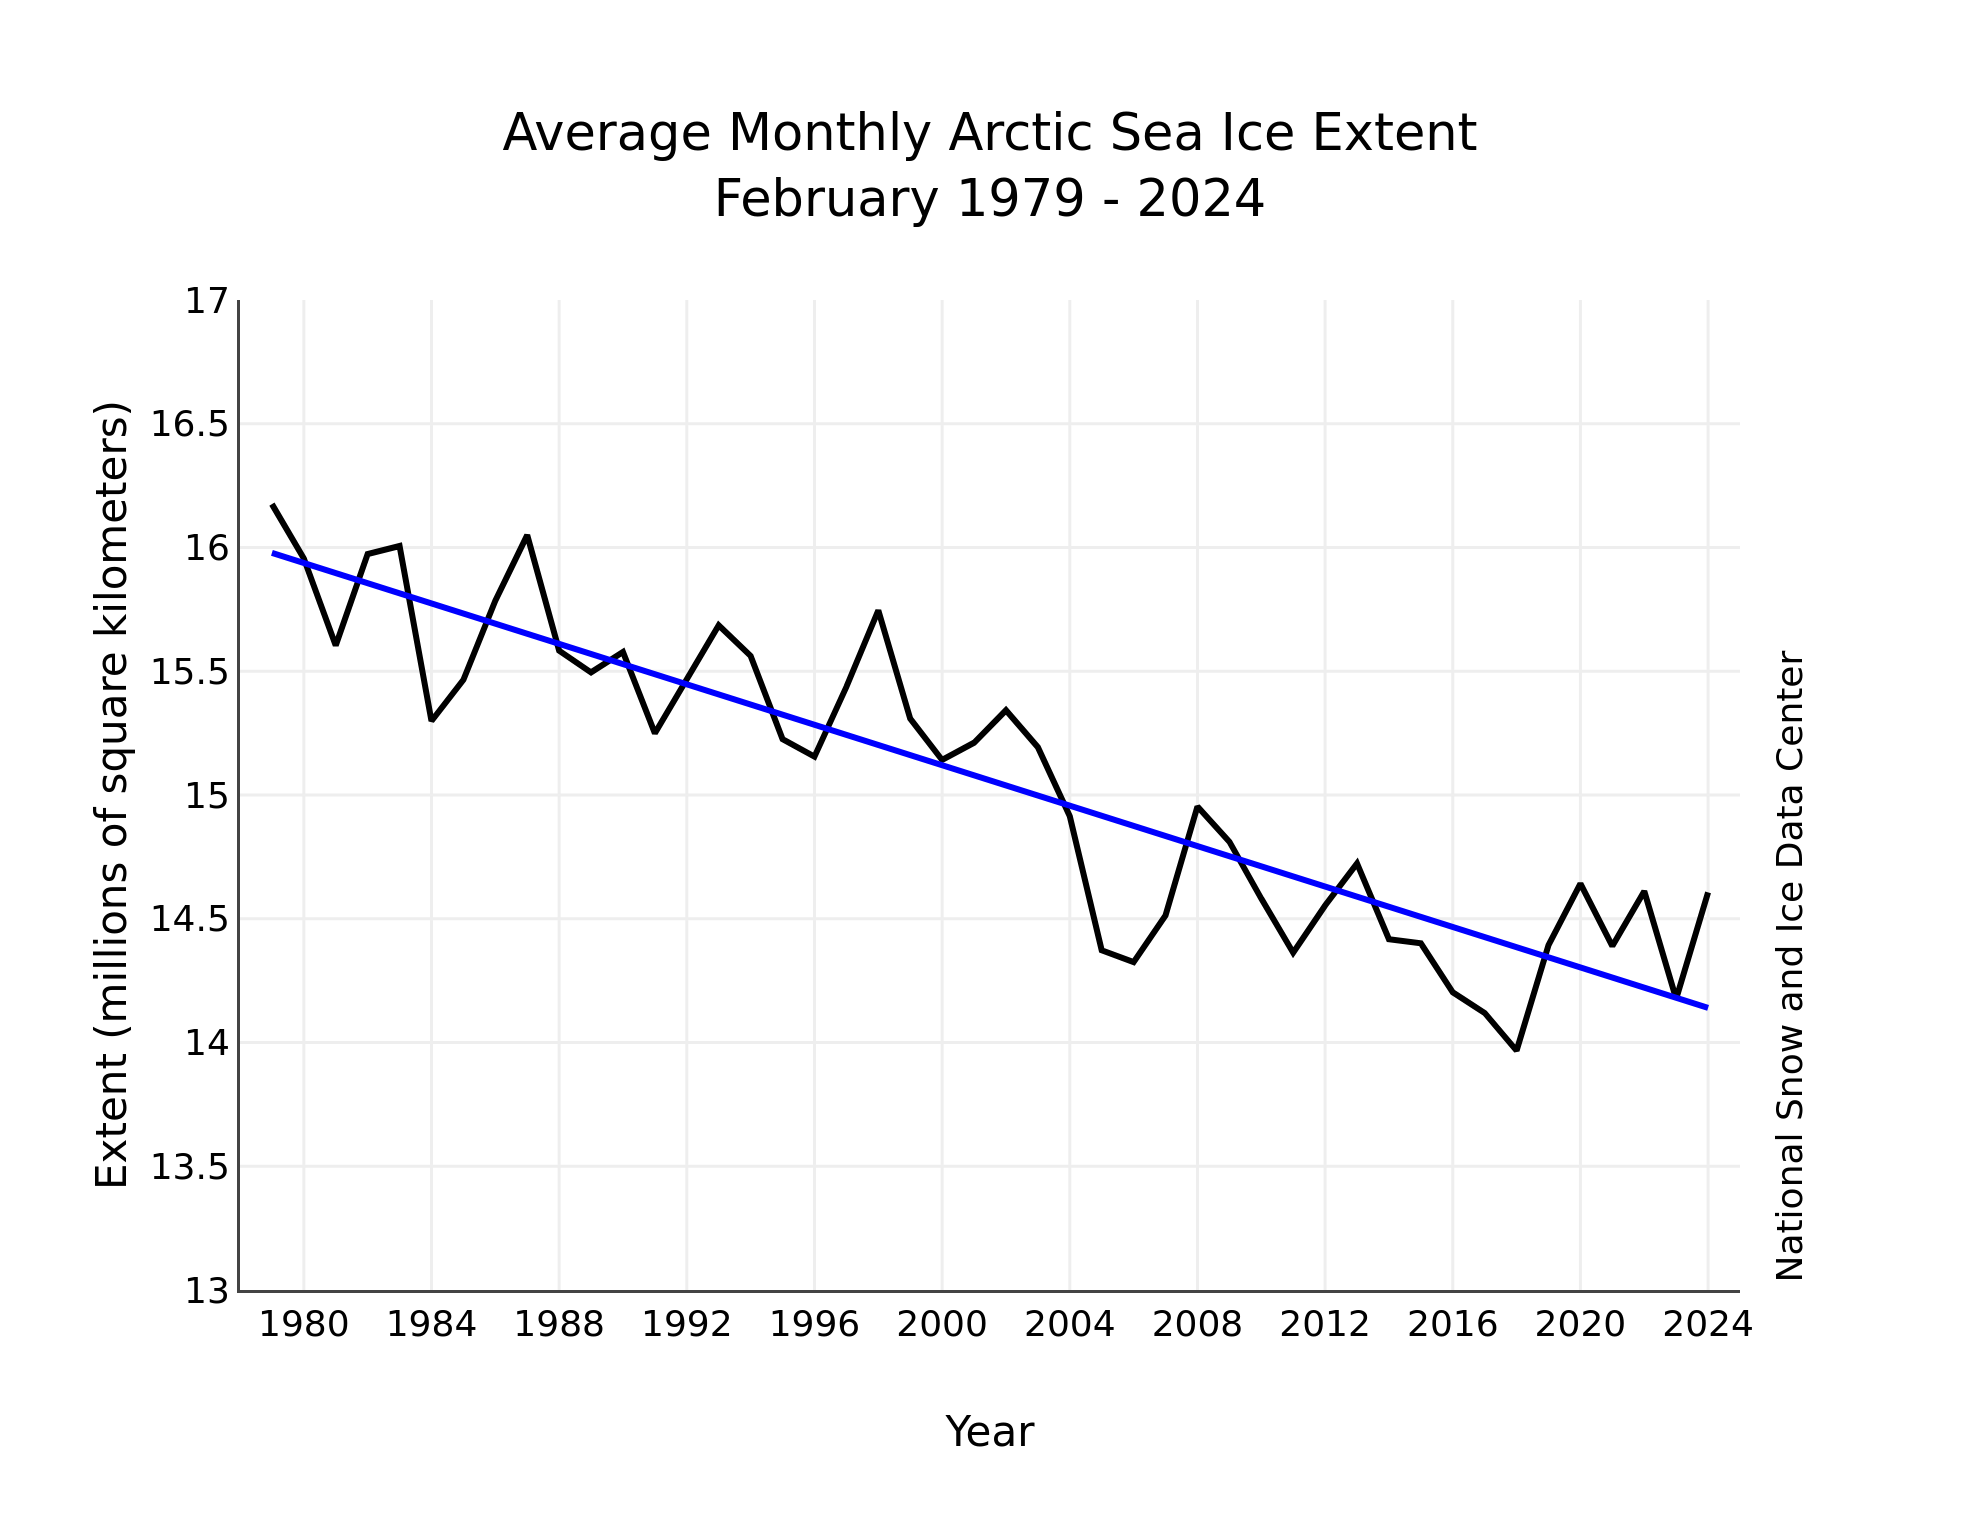
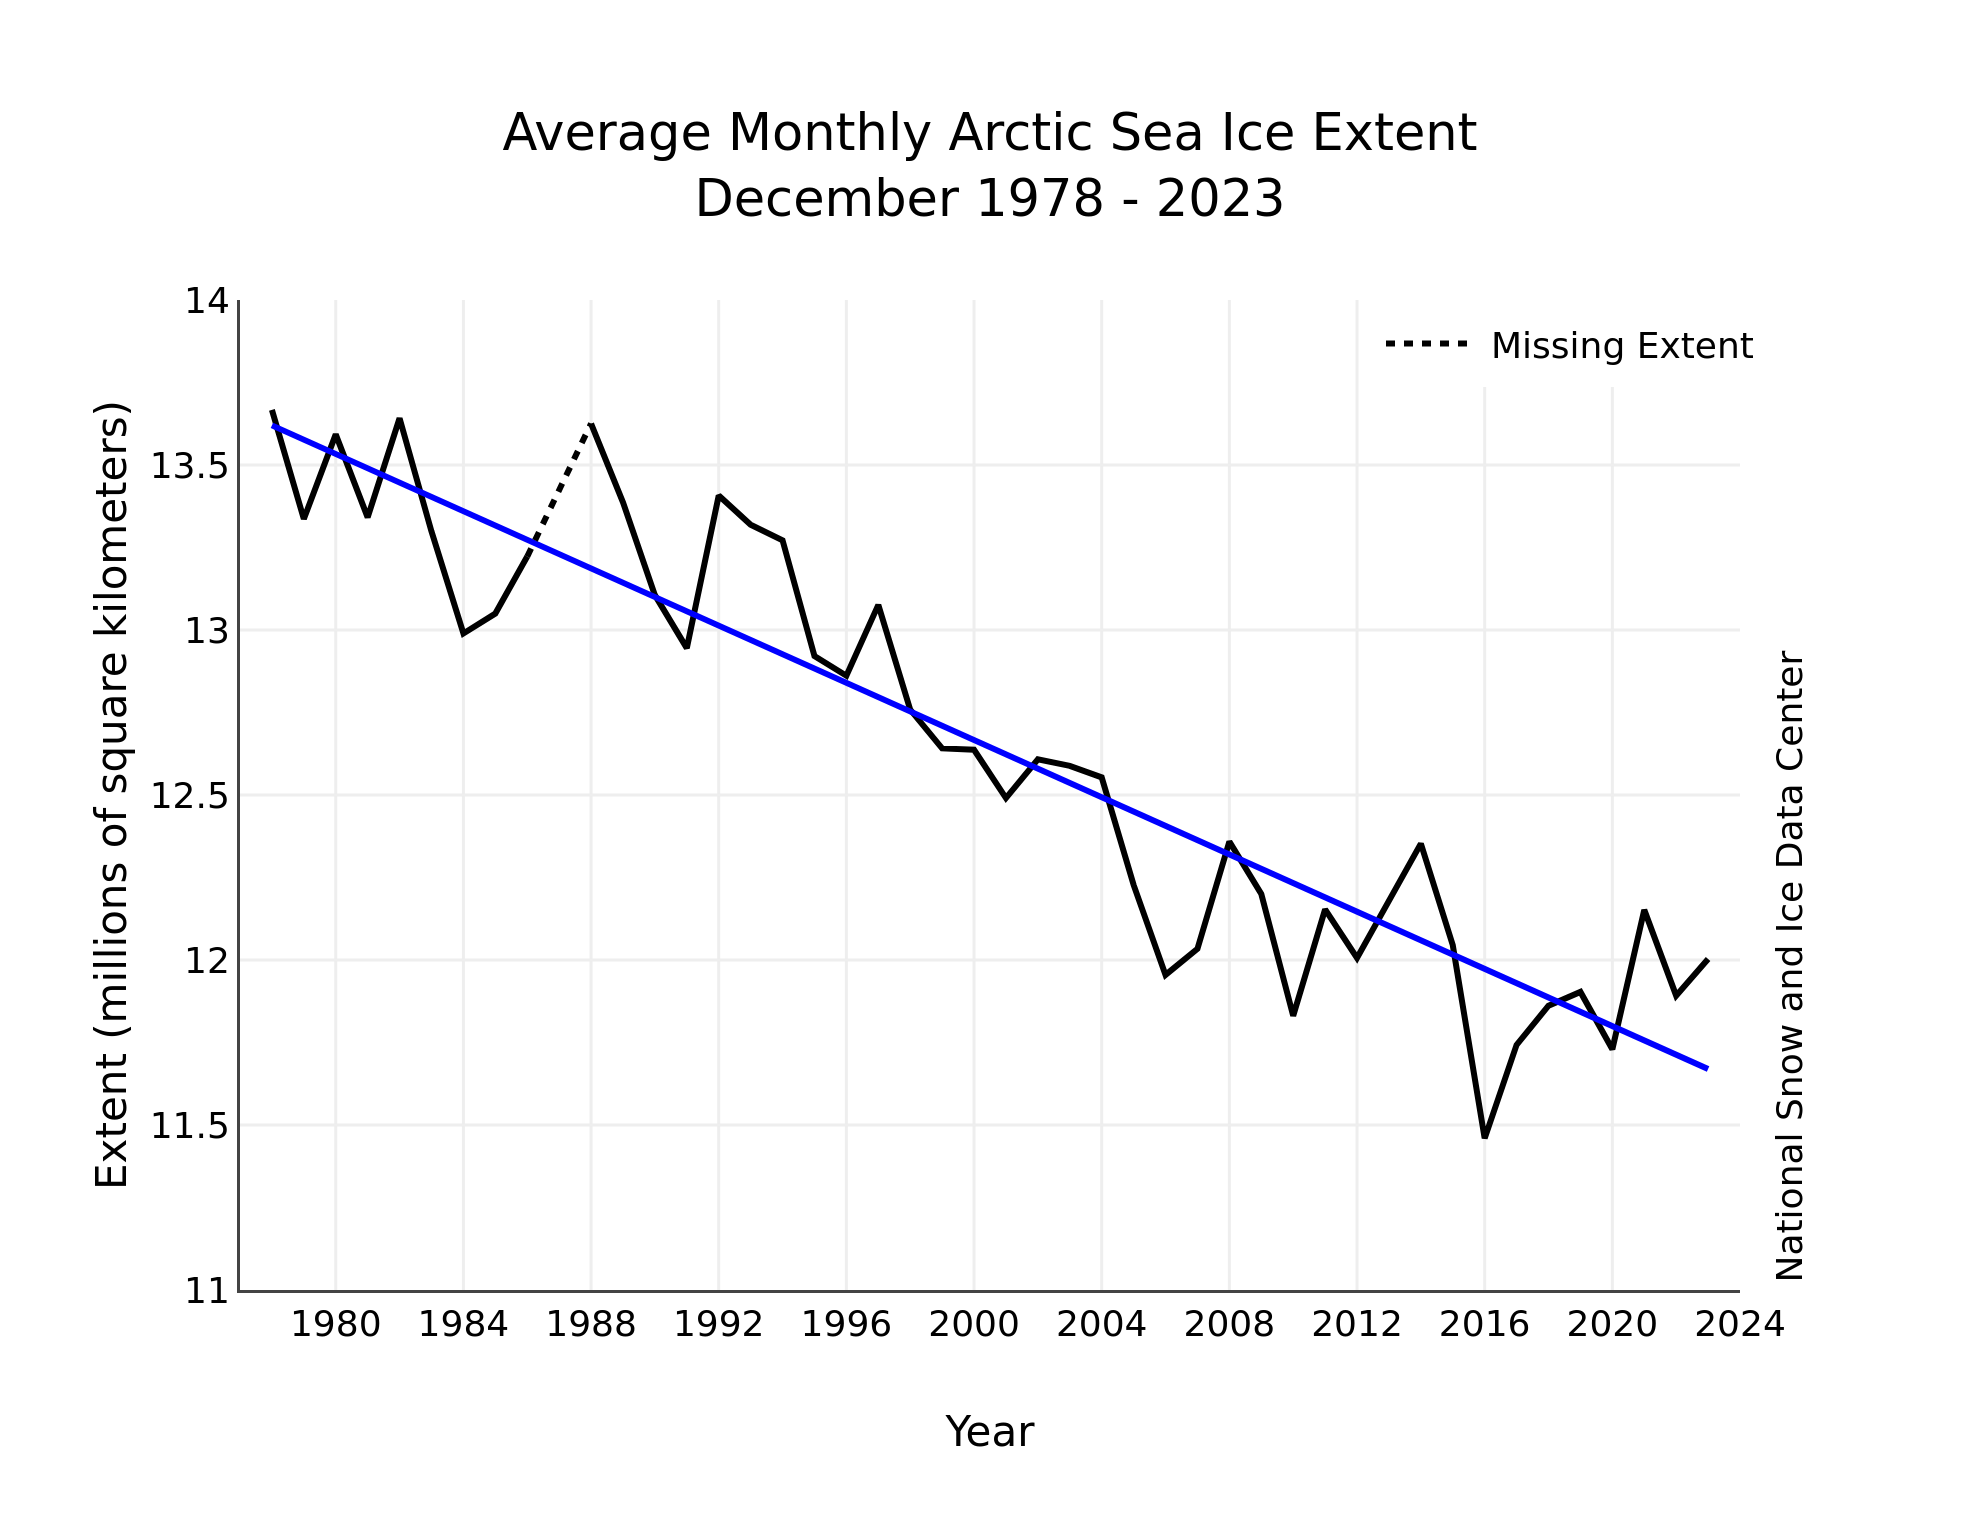
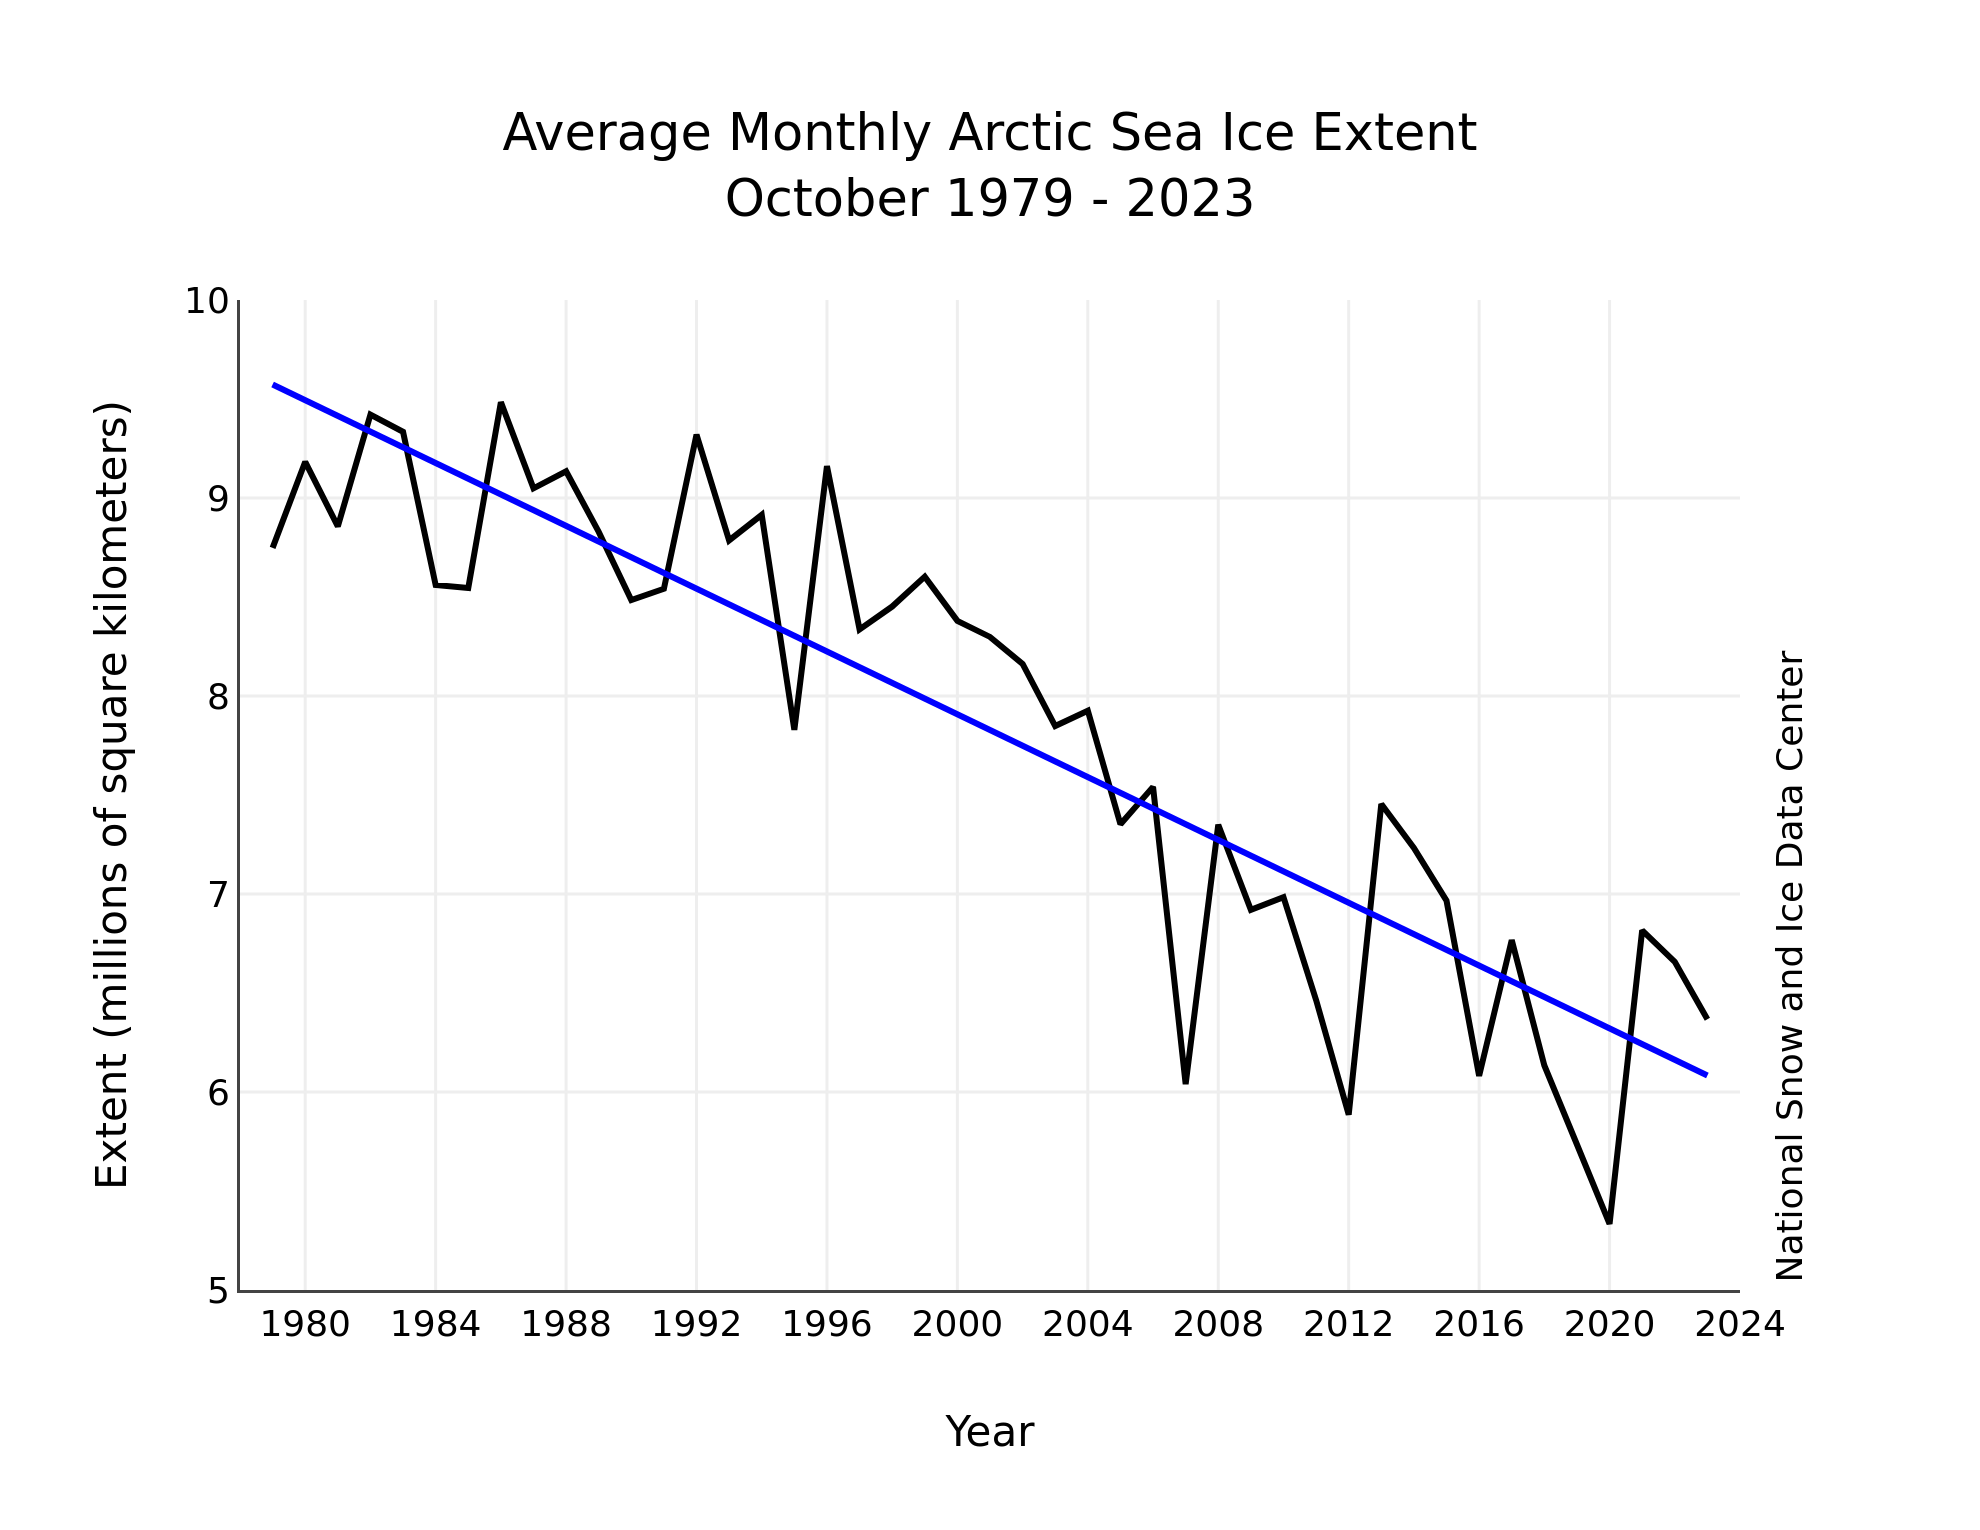
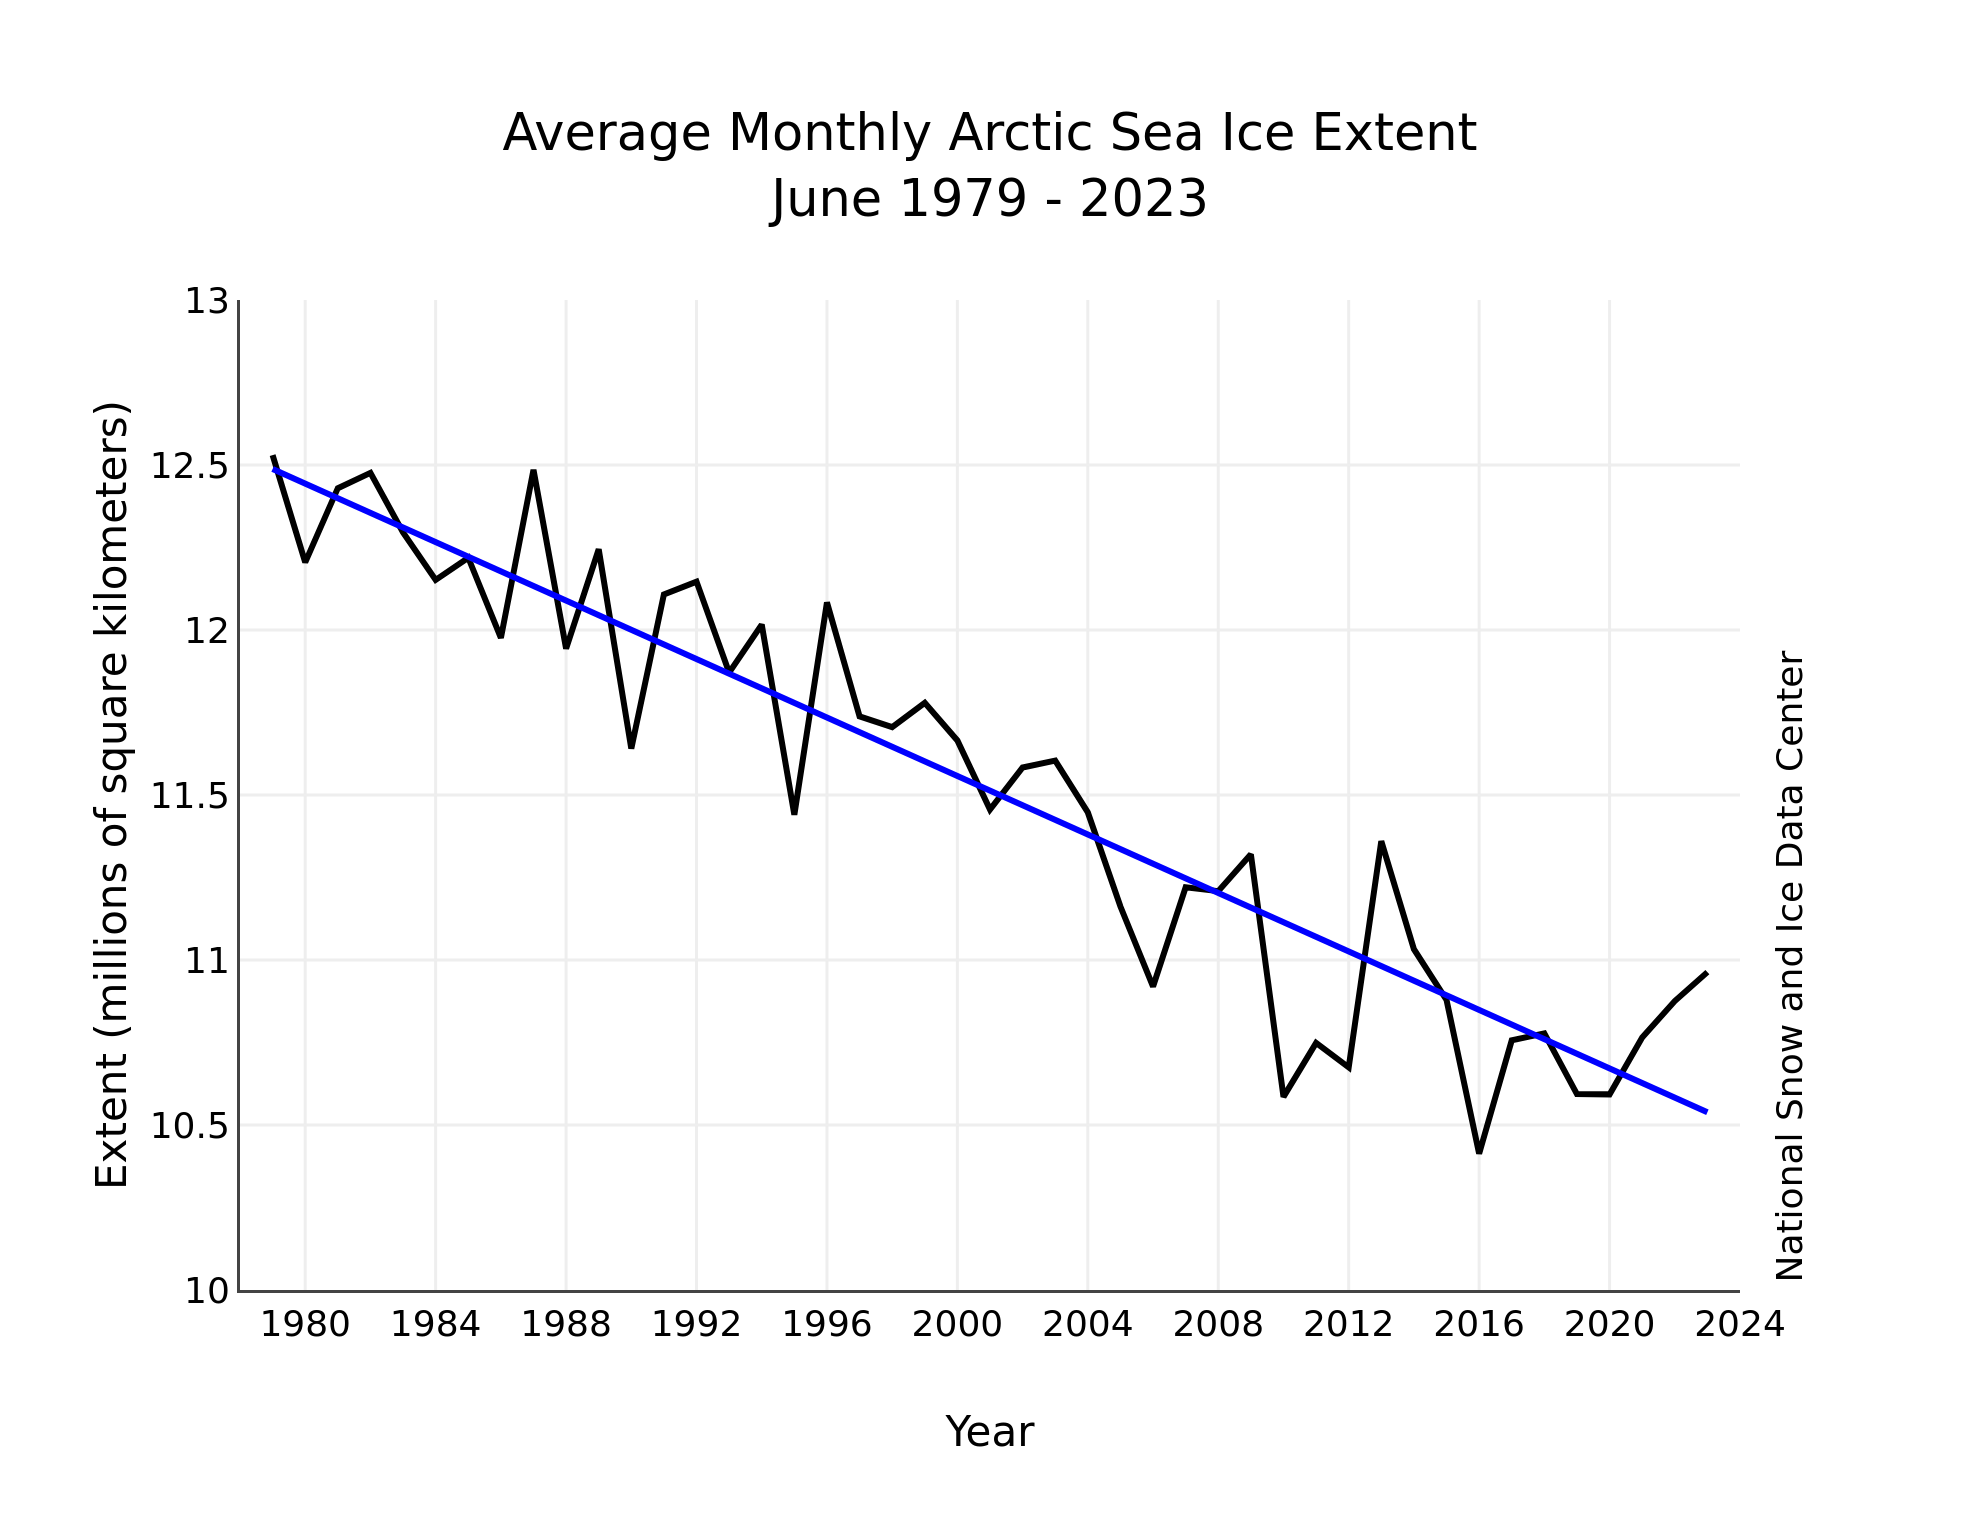
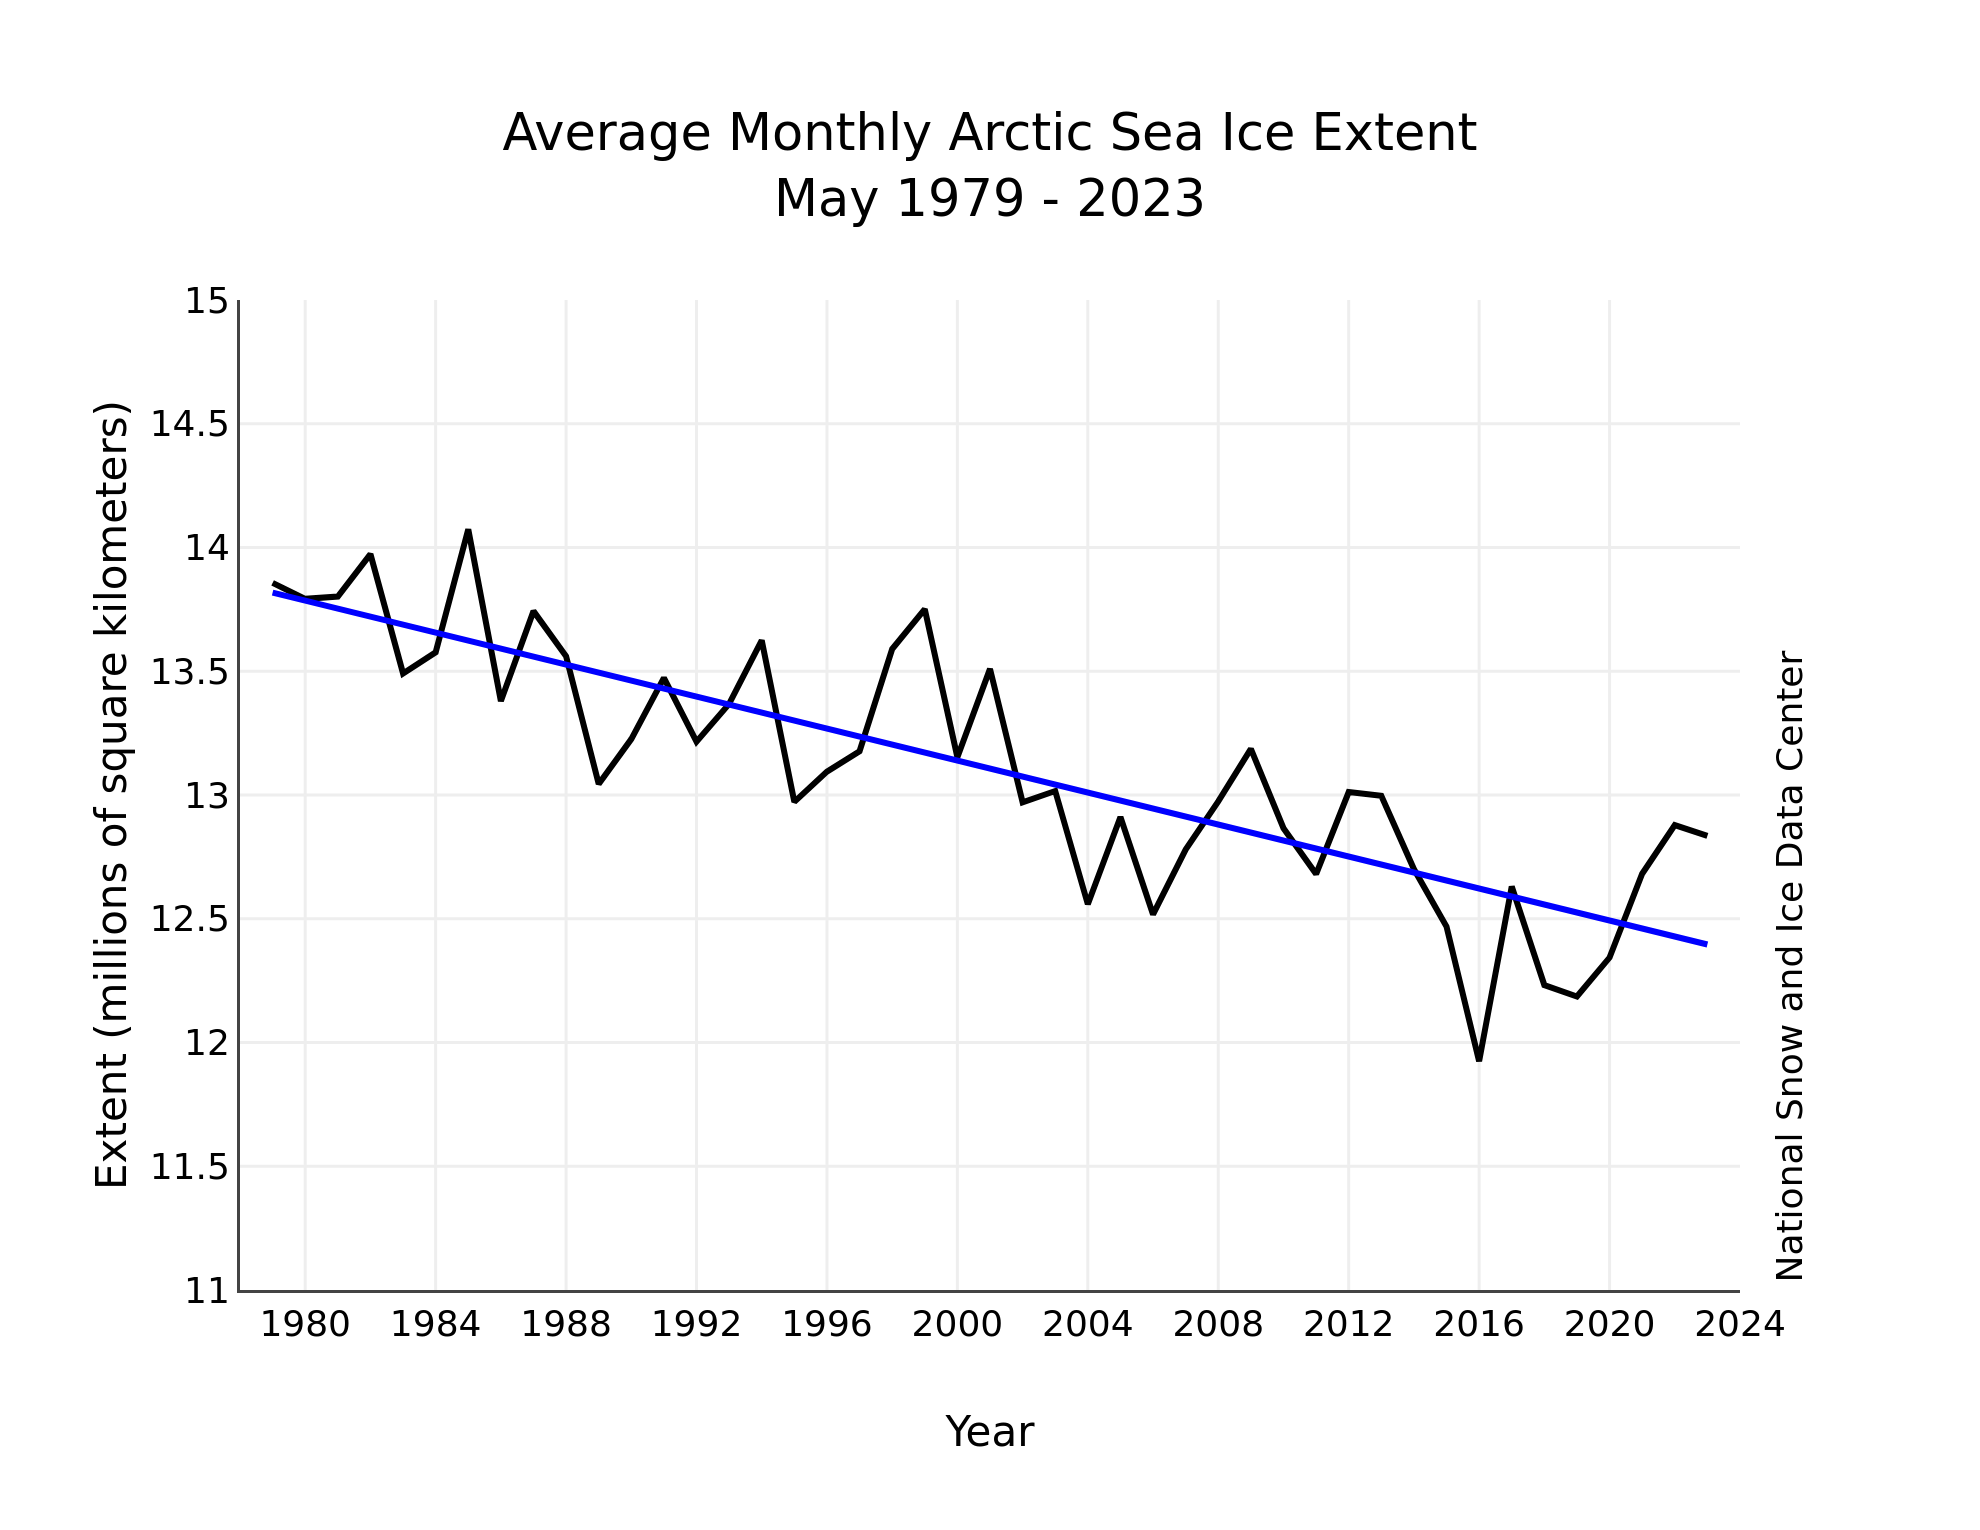
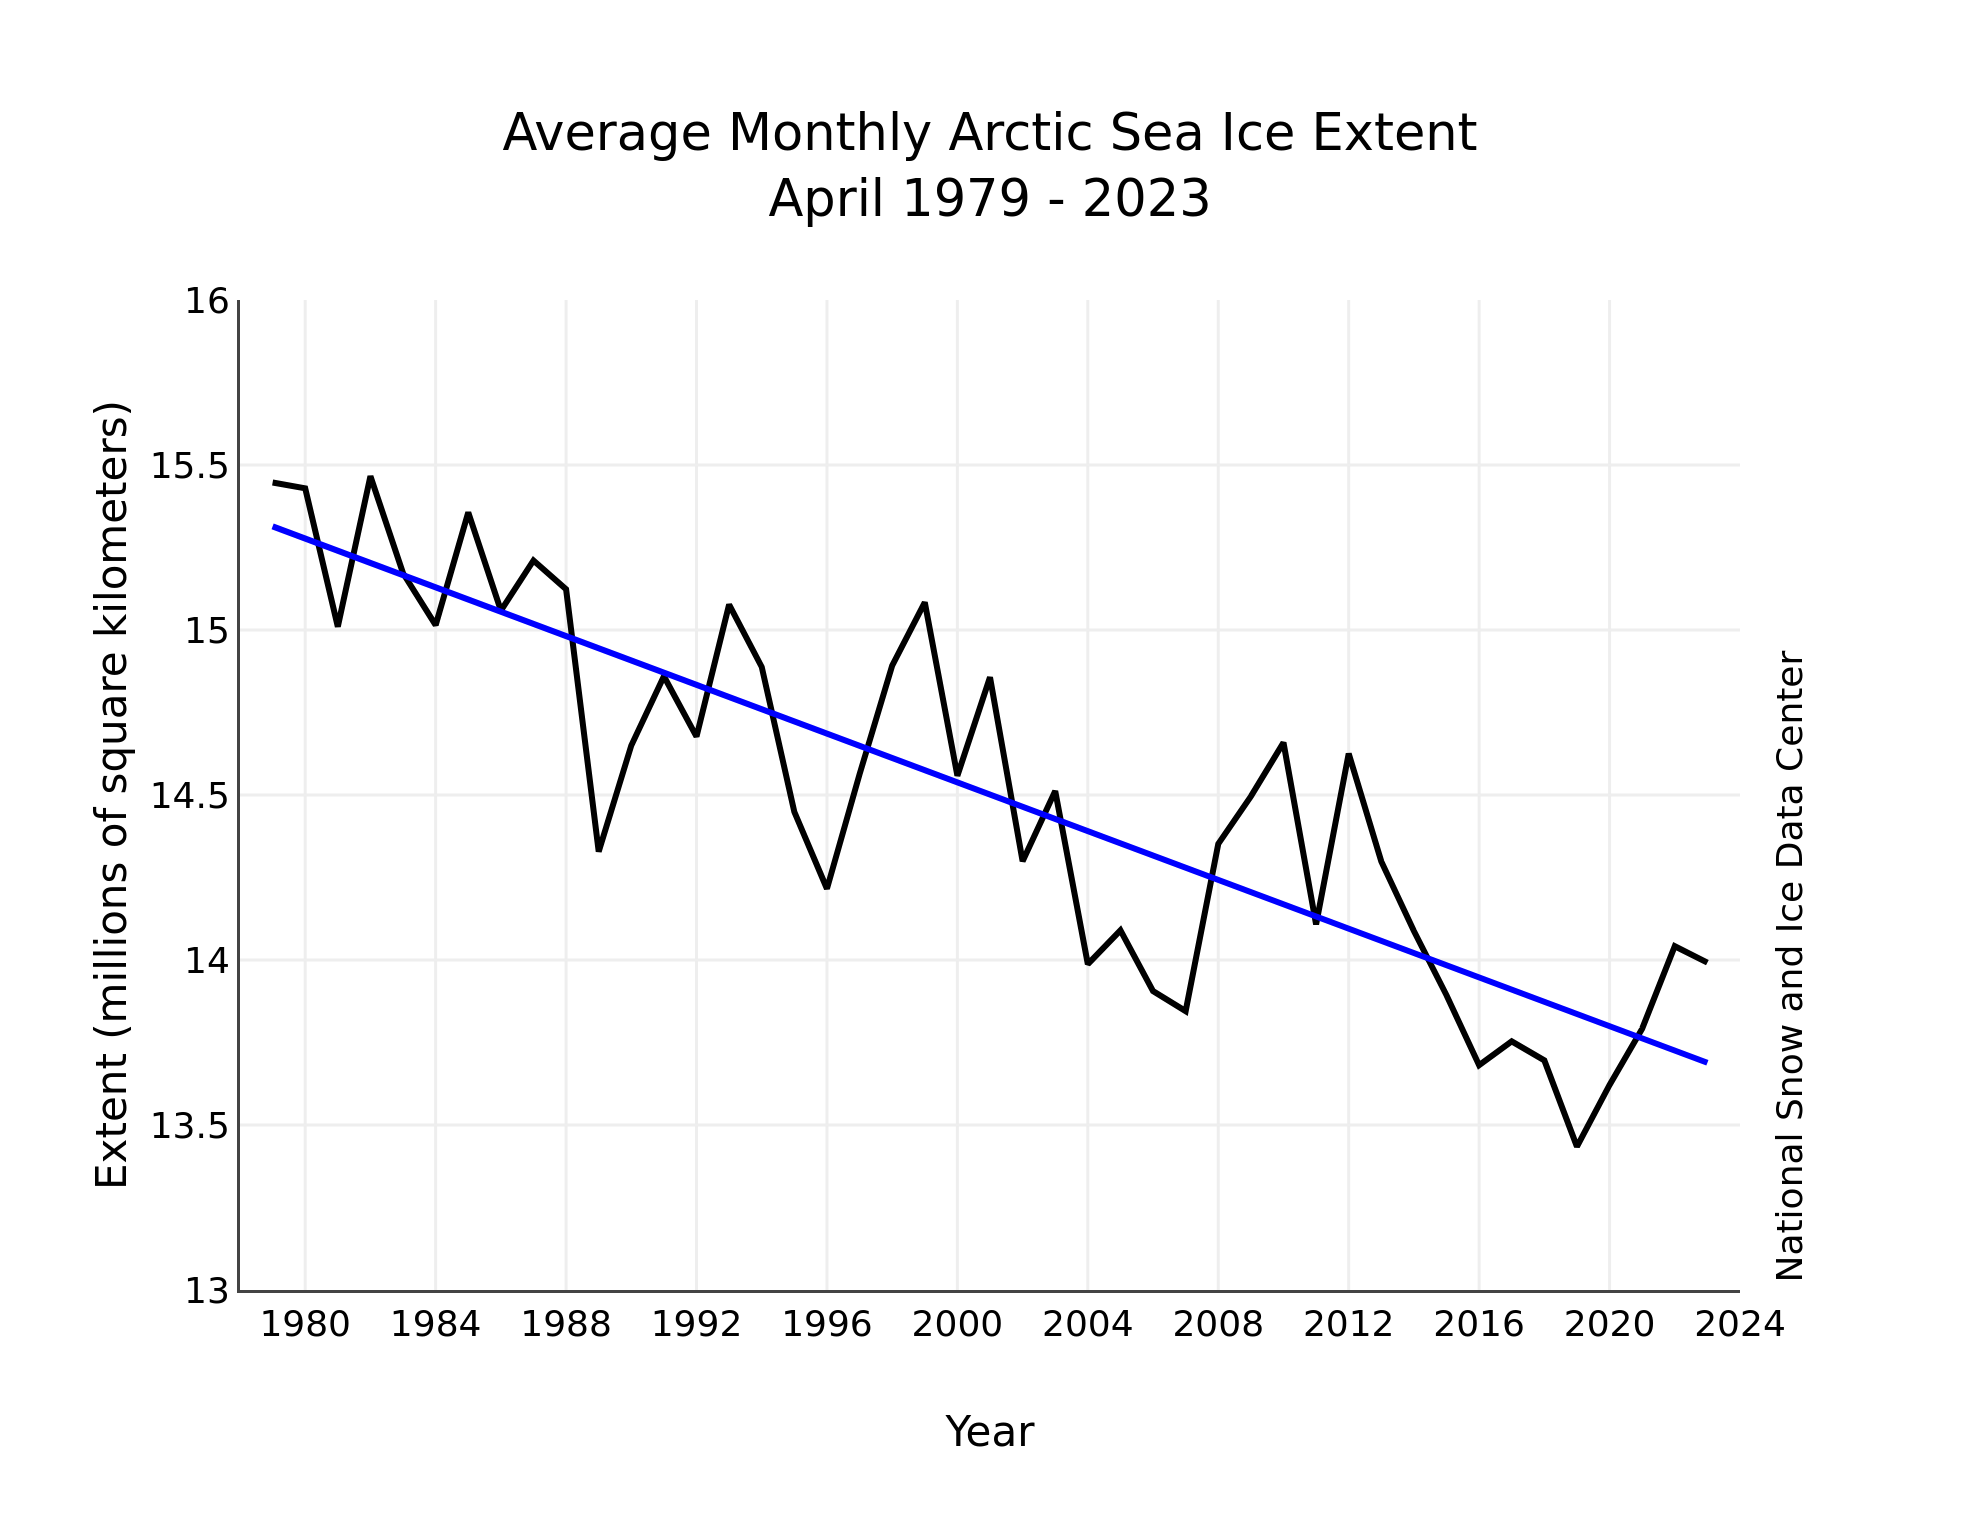
Figure 3. Monthly June ice extent for 1979 to 2024 shows a decline of 3.7 percent per decade.
Credit: National Snow and Ice Data Center
High-resolution image
Including 2024, the downward linear trend in Arctic sea ice extent for June is 43,000 square kilometers (17,000 square miles) per year, or 3.7 percent per decade relative to the 1981 to 2010 average. Based on the linear trend, since 1979, June has lost 1.96 million square kilometers (757,000 square miles) of sea ice, which is roughly equivalent to three times the size of Alaska or 47 times the size of Switzerland.
Low Hudson Bay sea ice cover challenges the polar bear population
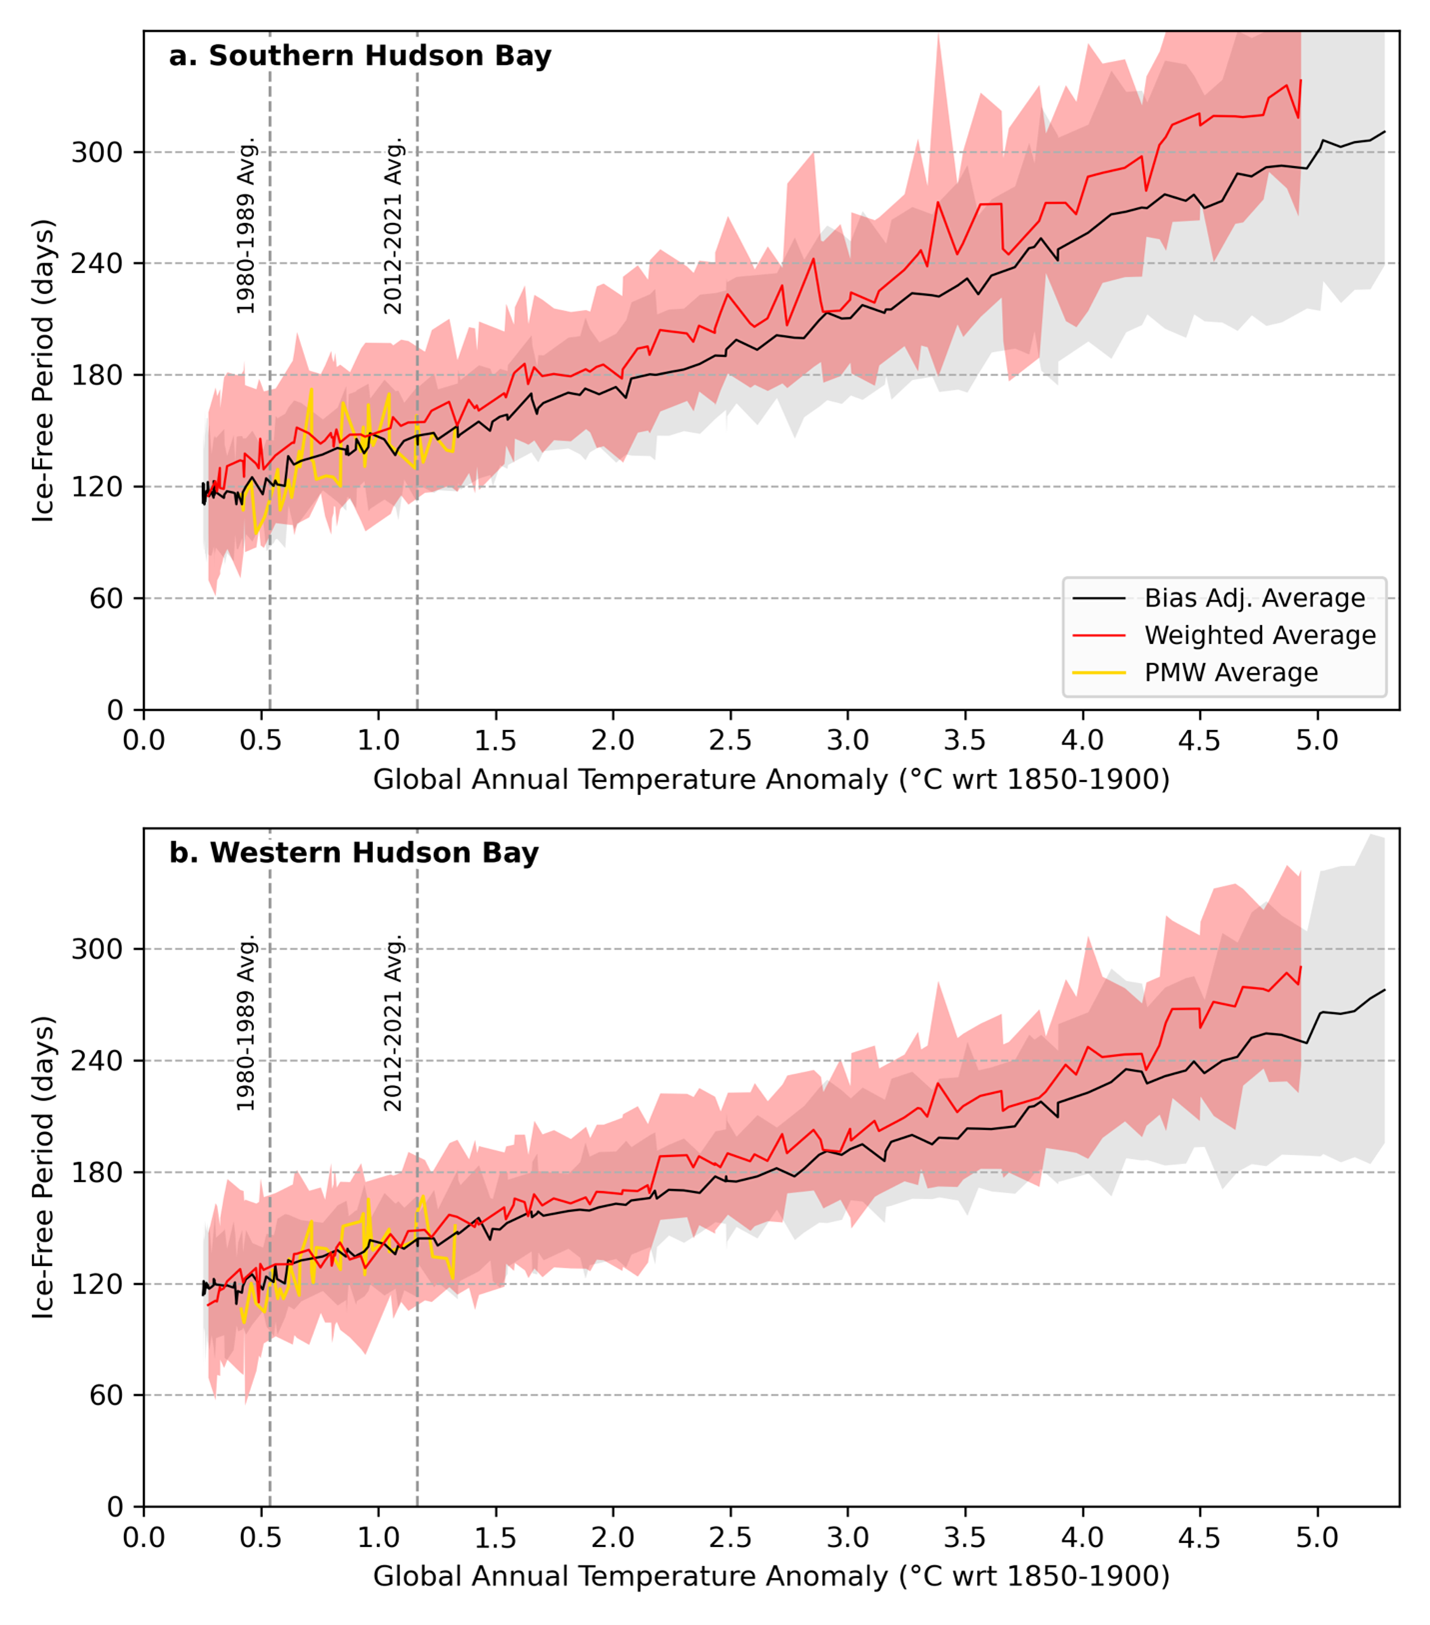
Figure 4. These graphs show estimates for the ice-free season as a function of global warming for southern Hudson Bay (top) and western Hudson Bay (bottom). Two estimates are provided based on different methods to bias-adjust the climate model data to match the observations during the satellite data record.
Credit: Stroeve et al., 2024
High-resolution image
The average date for ice retreat of southern Hudson Bay ranges between mid-June to late-July, so there is typically enough ice available for polar bears to hunt ringed seal pups, a major food source for them. If the ice breaks up too early, as is the case this year, the bears are stranded on land for more of the summer and autumn season, which extends their annual fasting period. Past research shows that healthy adult males can fast for up to 200 days each year before survival rates rapidly decline. However, given deteriorating body conditions caused by years of extended low-ice conditions, that threshold is now likely closer to 171 fasting days. For females and young bears, the threshold is even lower. Earlier ice break up is already having negative impacts on the health of female bears and their offspring, but as the climate continues to warm, the situation will become increasingly dire. Based on the latest round of climate model projections, the lengthening ice-free season implies that bears in southern Hudson Bay are likely to disappear if global warming reaches 2 to 2.5 degrees Celsius (3.6 to 4.5 degrees Fahrenheit), whereas for western Hudson Bay, this warming threshold is between 2.5 and 3 degrees Celsius (4.5 to 5.4 degrees Fahrenheit).
Less sea ice could lead to more forest fires
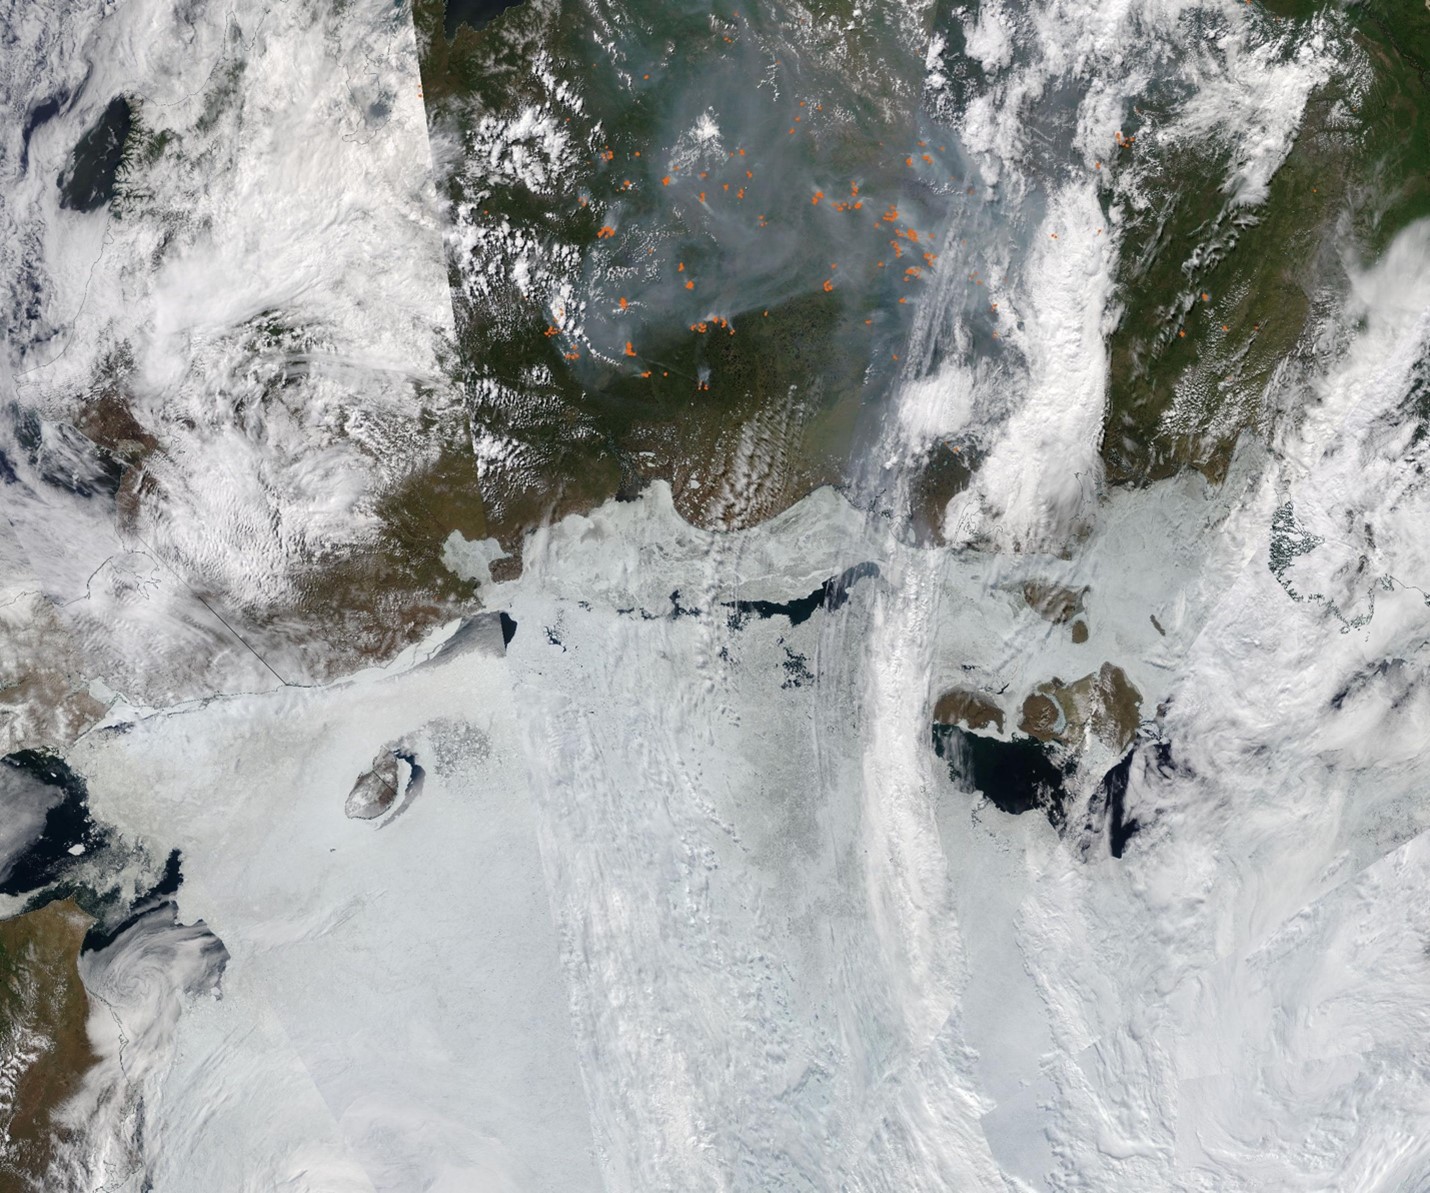
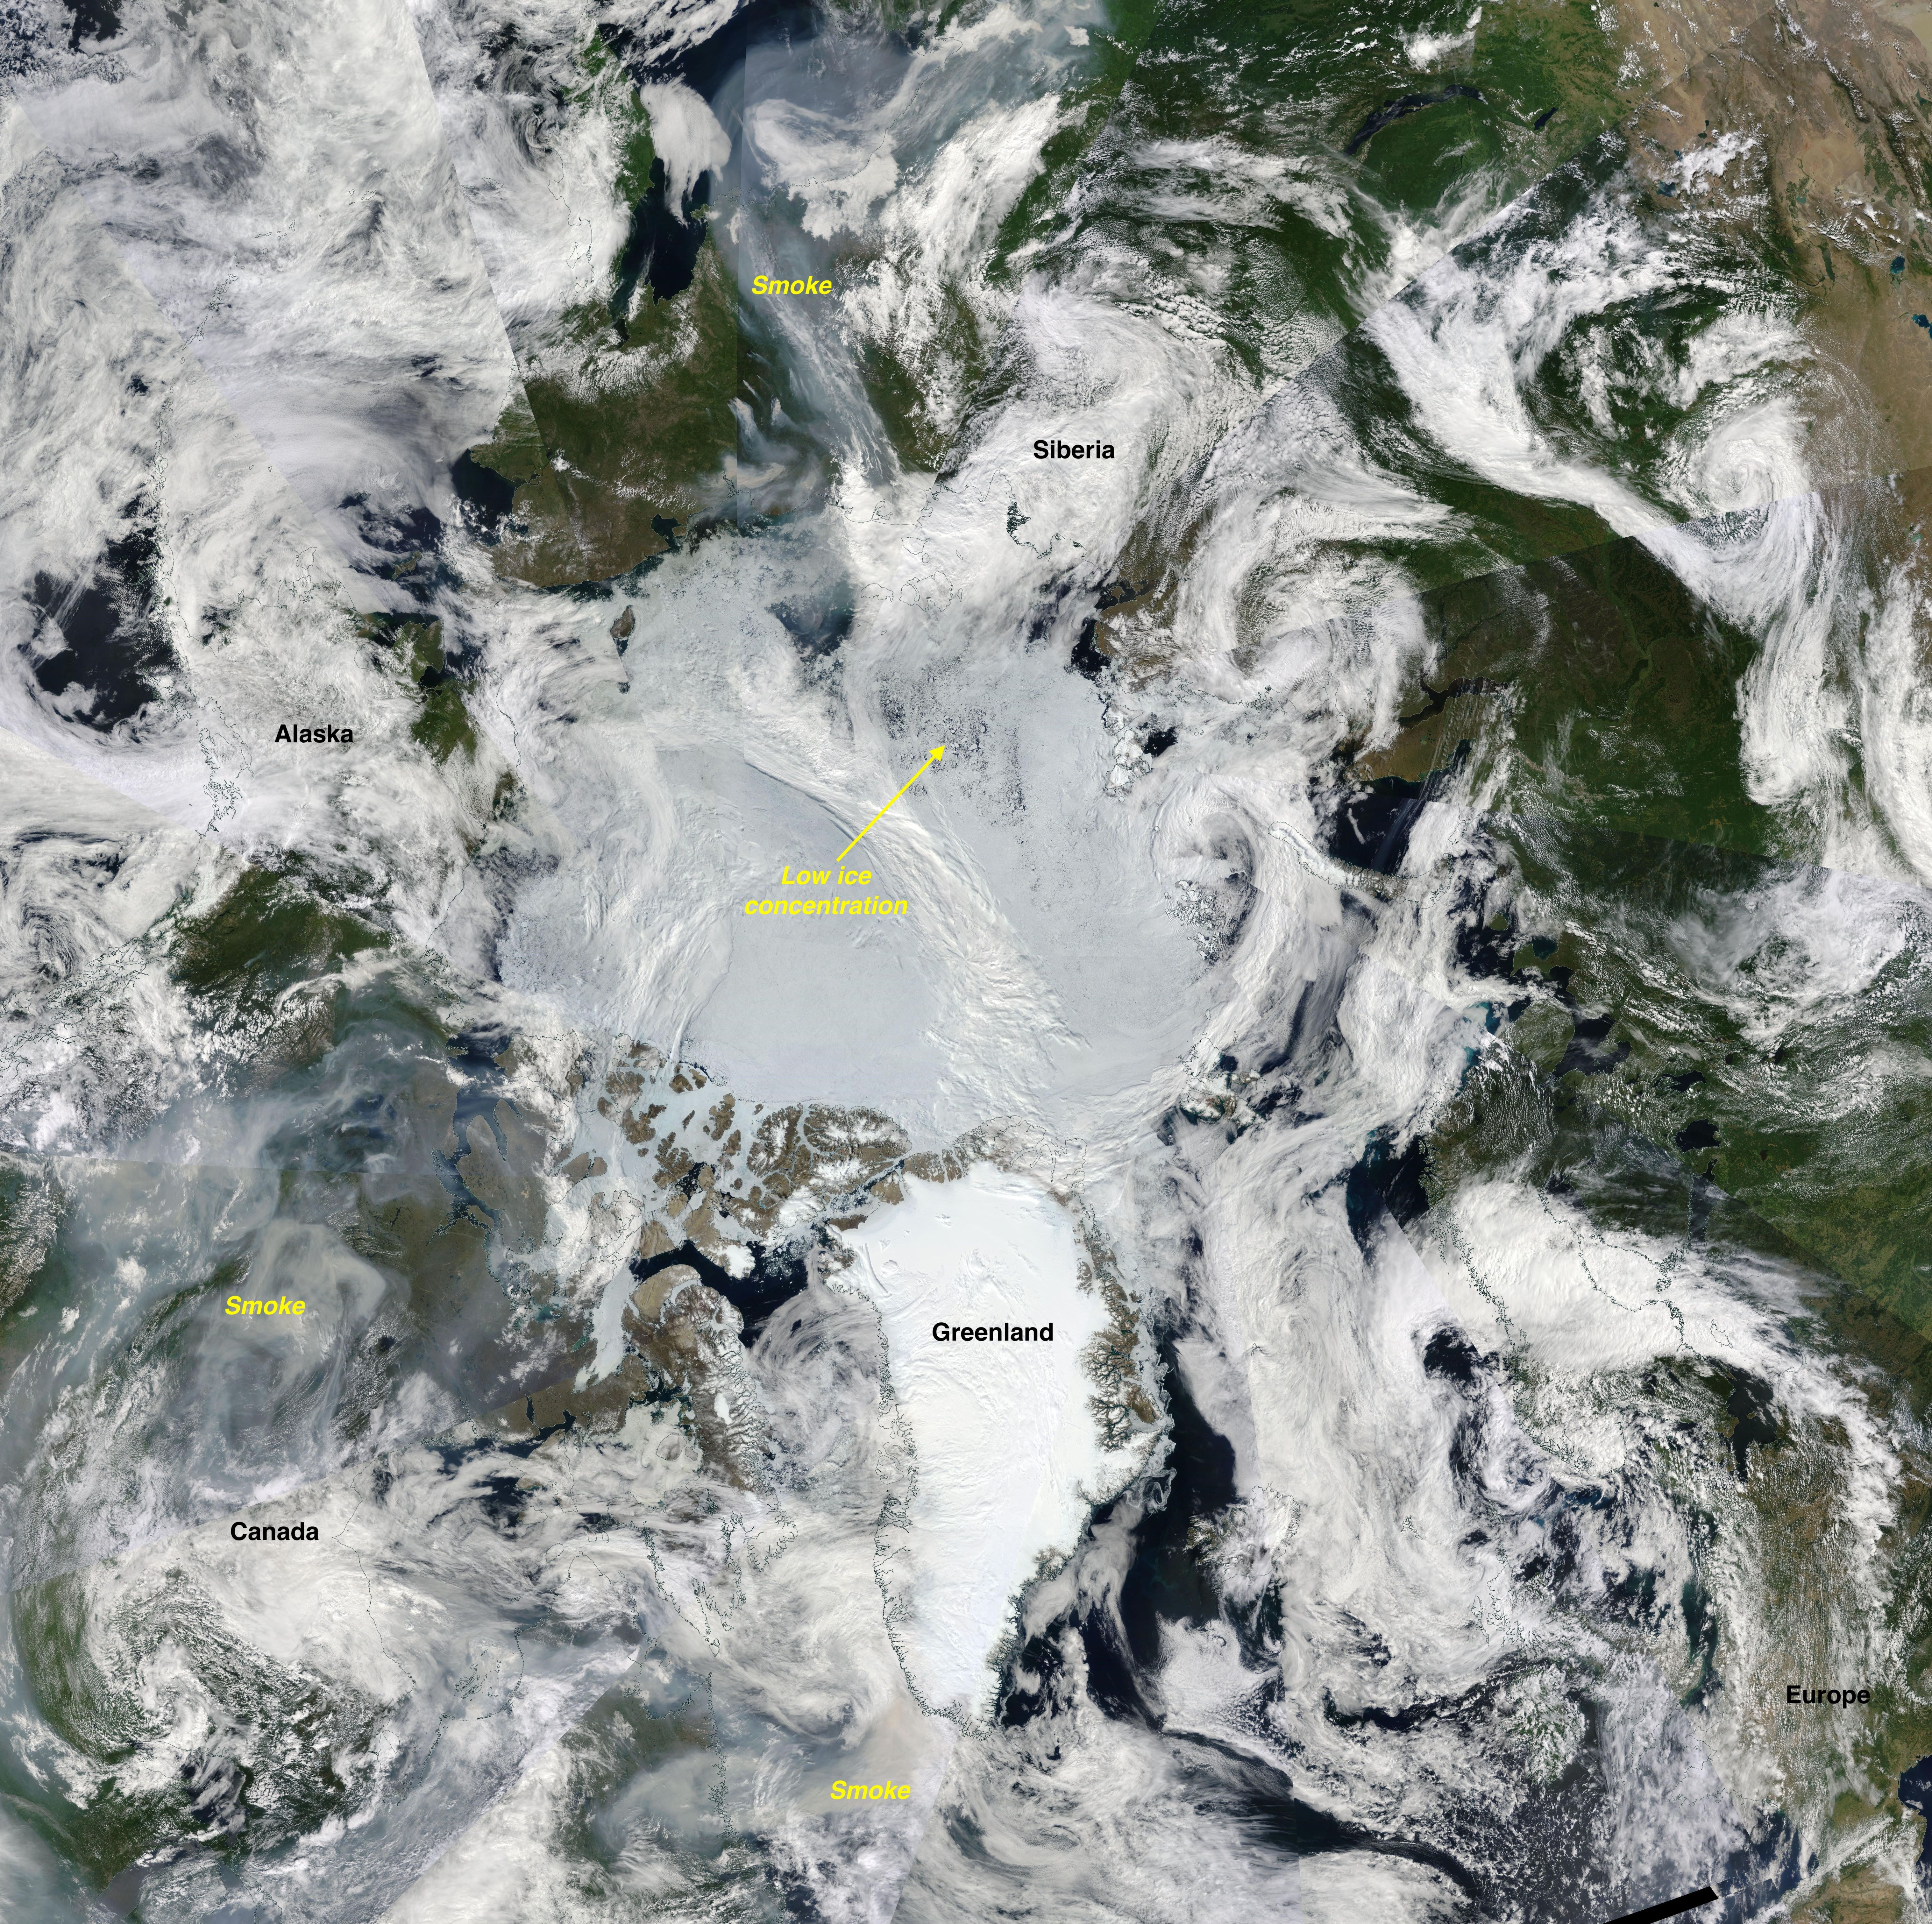
Figure 5. This Moderate Resolution Imaging Spectroradiometer (MODIS) image from June 25, 2024, shows location of fires over Siberia (red) and the smoke plumes.
Credit: NASA
High-resolution image
Wildfires in the Arctic are common in summer and this summer is no exception. Using data from NASA’s Moderate Resolution Imaging Spectroradiometer (MODIS) instruments, the Copernicus Atmosphere Monitoring Service (CAMS) Global Fire Assimilation System (GFAS) shows a number of active wildfires within the Arctic Circle, especially in Siberia, making this June the third highest month of Arctic fire activity since the MODIS data record began in 2000. Overall, fire frequency has increased in Siberia, which a new study (Luo et al., 2024) suggests could in part be a result of less summer sea ice in the Russian sector. The loss of sea ice, and in particular, earlier ice retreat, allows the ocean to absorb the sun’s energy and warm the surface layers of the ocean. This typically leads to enhanced autumn and winter atmospheric warming as the ocean releases heat before winter ice formation. The new study suggests sea ice loss over the Russian Arctic sector has led to enhanced warming over eastern Siberia and a corresponding increase in wildfire activity. If ash from wildfires is deposited on the sea ice, its surface will darken and absorb more solar energy, hastening ice melt.
Thicker spring ice may help preserve some ice this summer
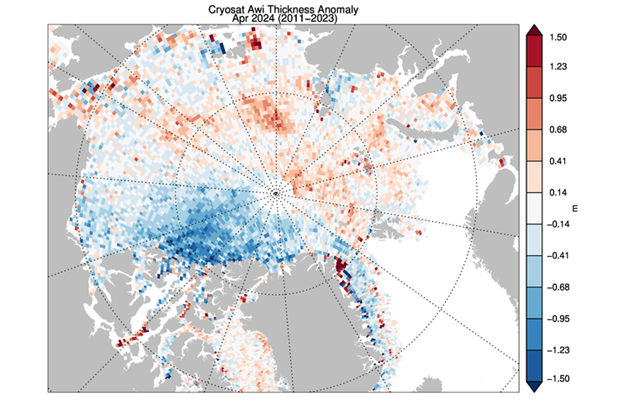
Figure 6a. This plot shows the difference in sea ice thickness between April 2024 and the 2011 to 2023 April average. Red colors indicate regions where ice is thicker than average in April 2024 and blue colors indicate regions where ice is thinner than average.
Credit: Cryosat, European Space Agency
High-resolution image
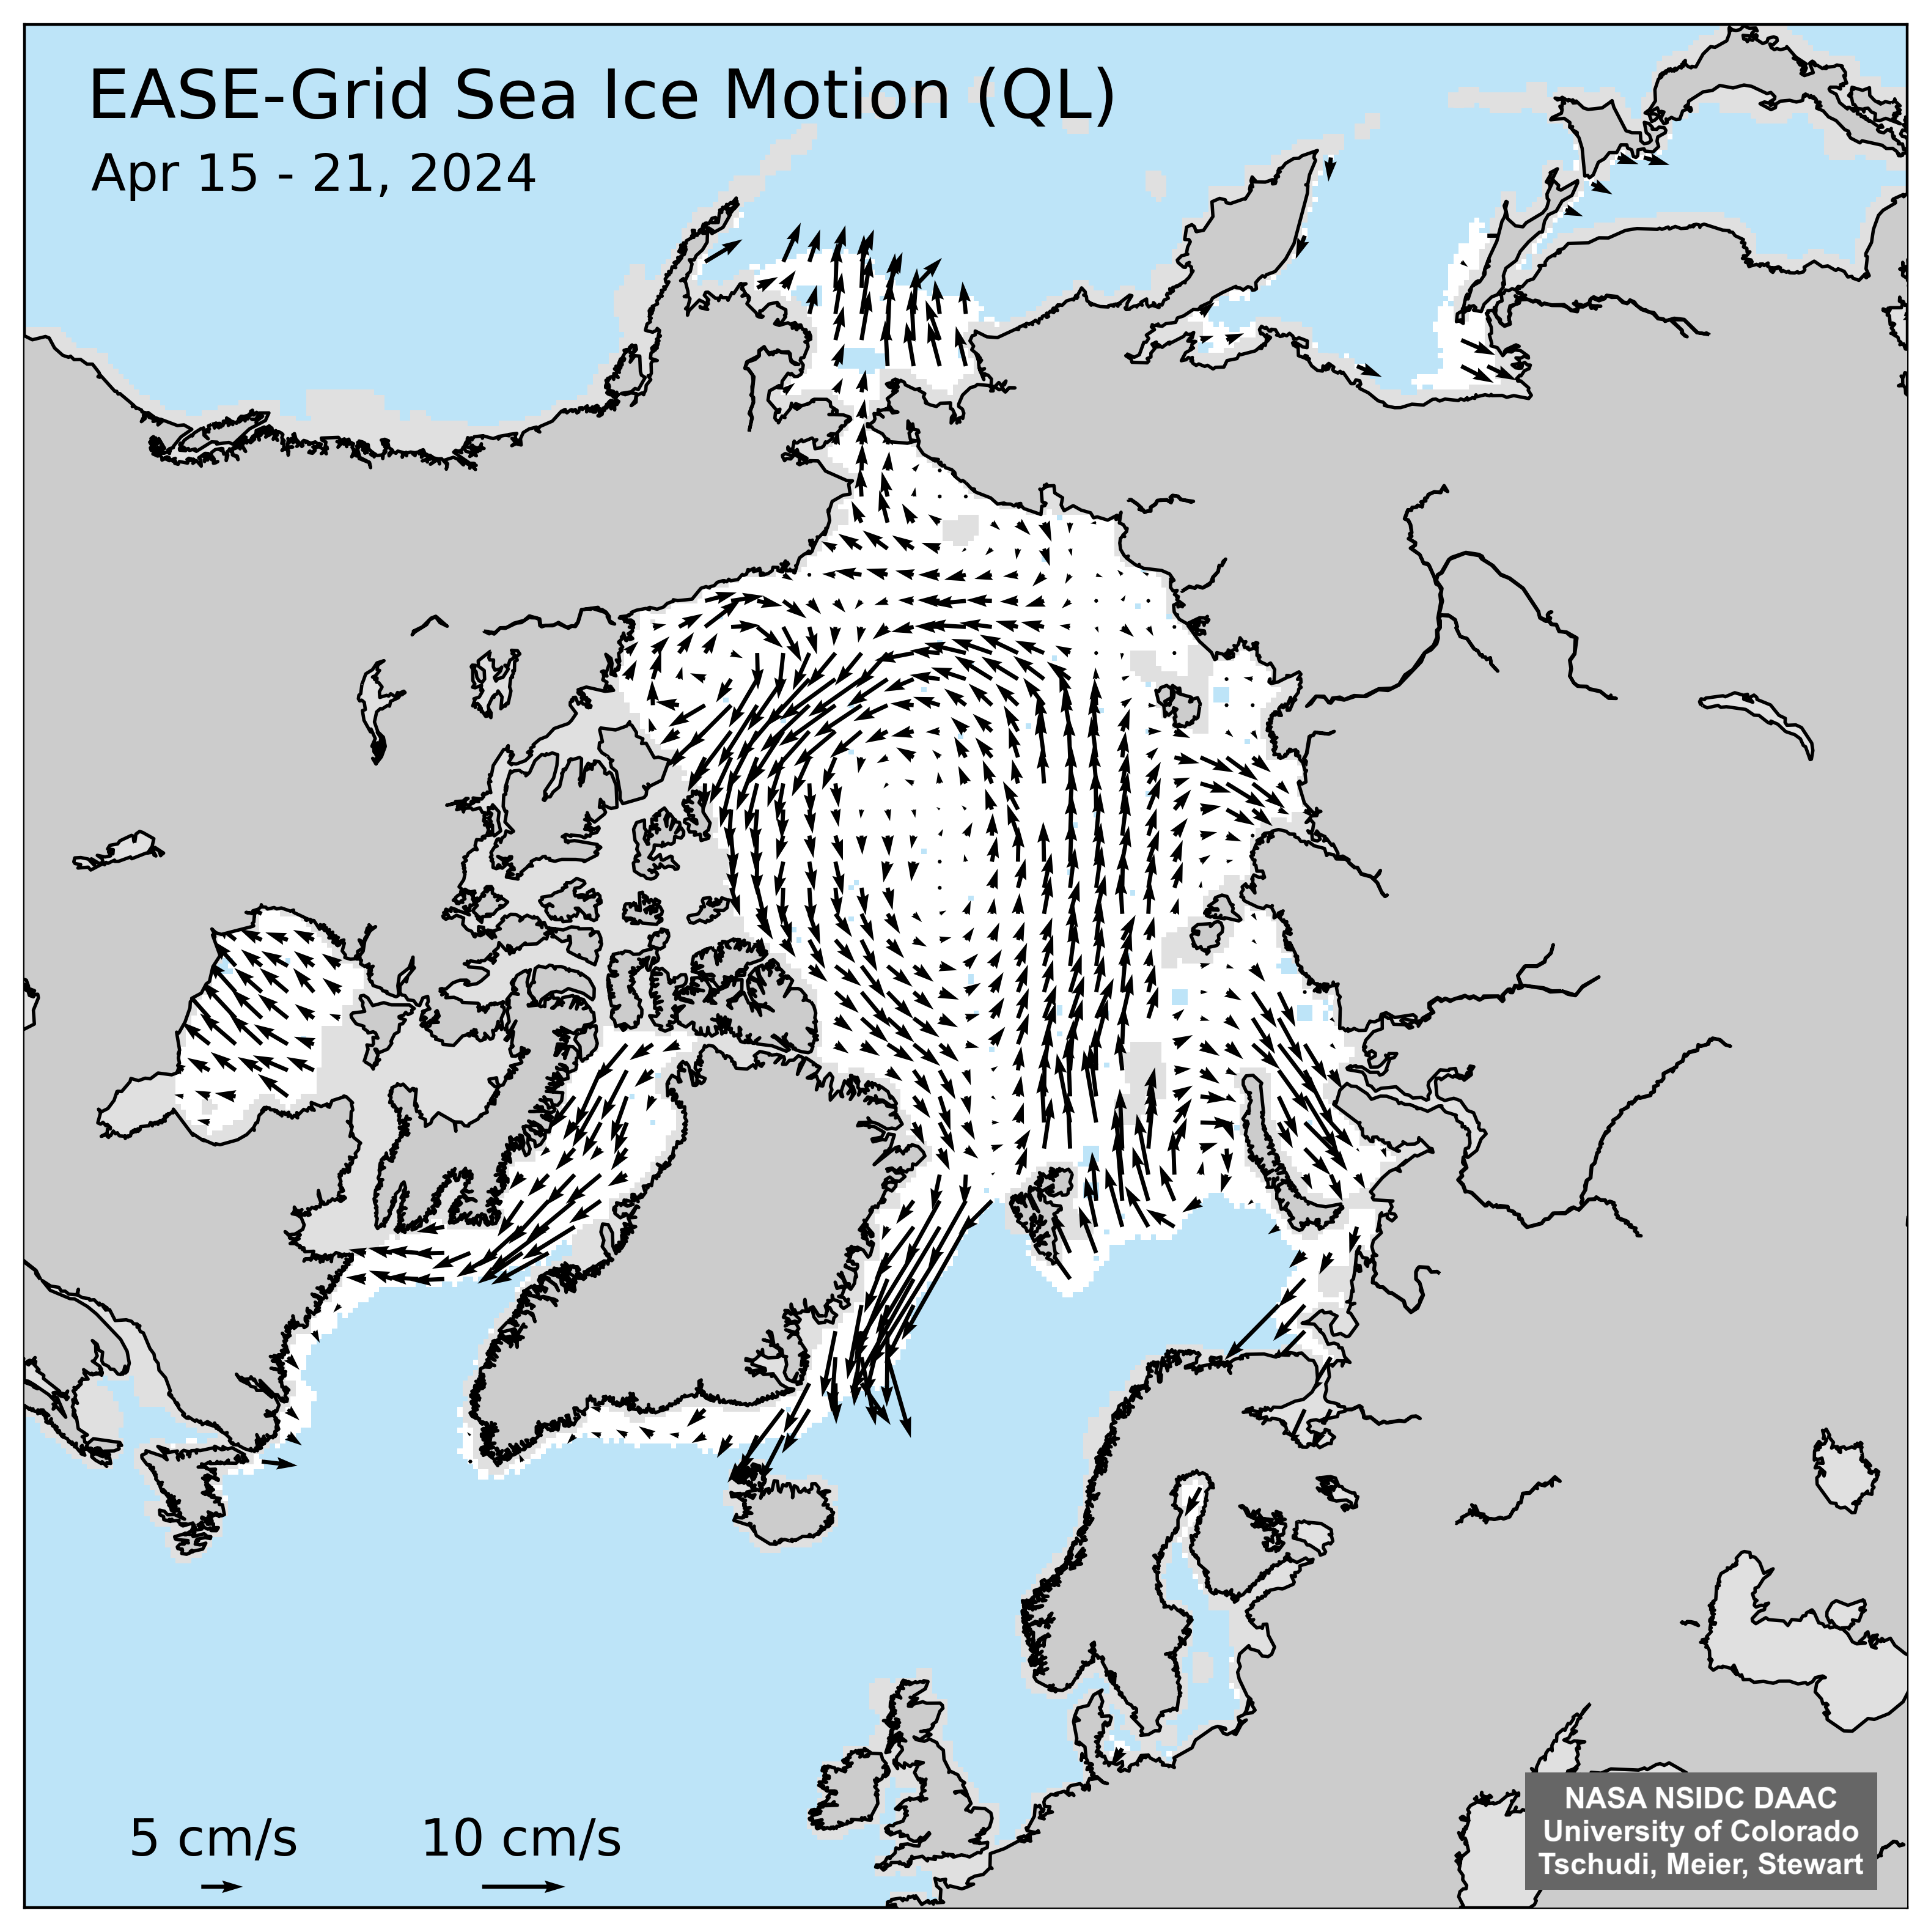
Figure 6b. This plot shows the average Arctic sea ice motion for the week of April 15 to 21, 2024. The motion on the Eurasian side of the Arctic is primarily eastward or southward, which results in ice cover convergence that contributes to the increased thickness in the region seen in Figure 6a.
Credit: National Snow and Ice Data Center
High-resolution image
Data from satellite radar altimetry suggest the ice cover along the eastern side of the Arctic may be thicker this spring relative to the 2011 to 2023 average, but thinner than average in the western Arctic and north of Greenland (Figure 6a). Thick ice in the eastern regions is likely a result of convergence of ice from winds pushing the ice poleward (e.g. Figure 6b). Normally, new ice grows from 1.5 to 2 meters (4.9 to 6.6 feet) thick over one winter season, but changes in ice motion can lead to localized ridging and rafting that further thickens the ice. The thicker ice may take longer than average to melt out this summer and may help to preserve some of the summer ice cover.
Antarctic sea ice experiences a second extremely low summer
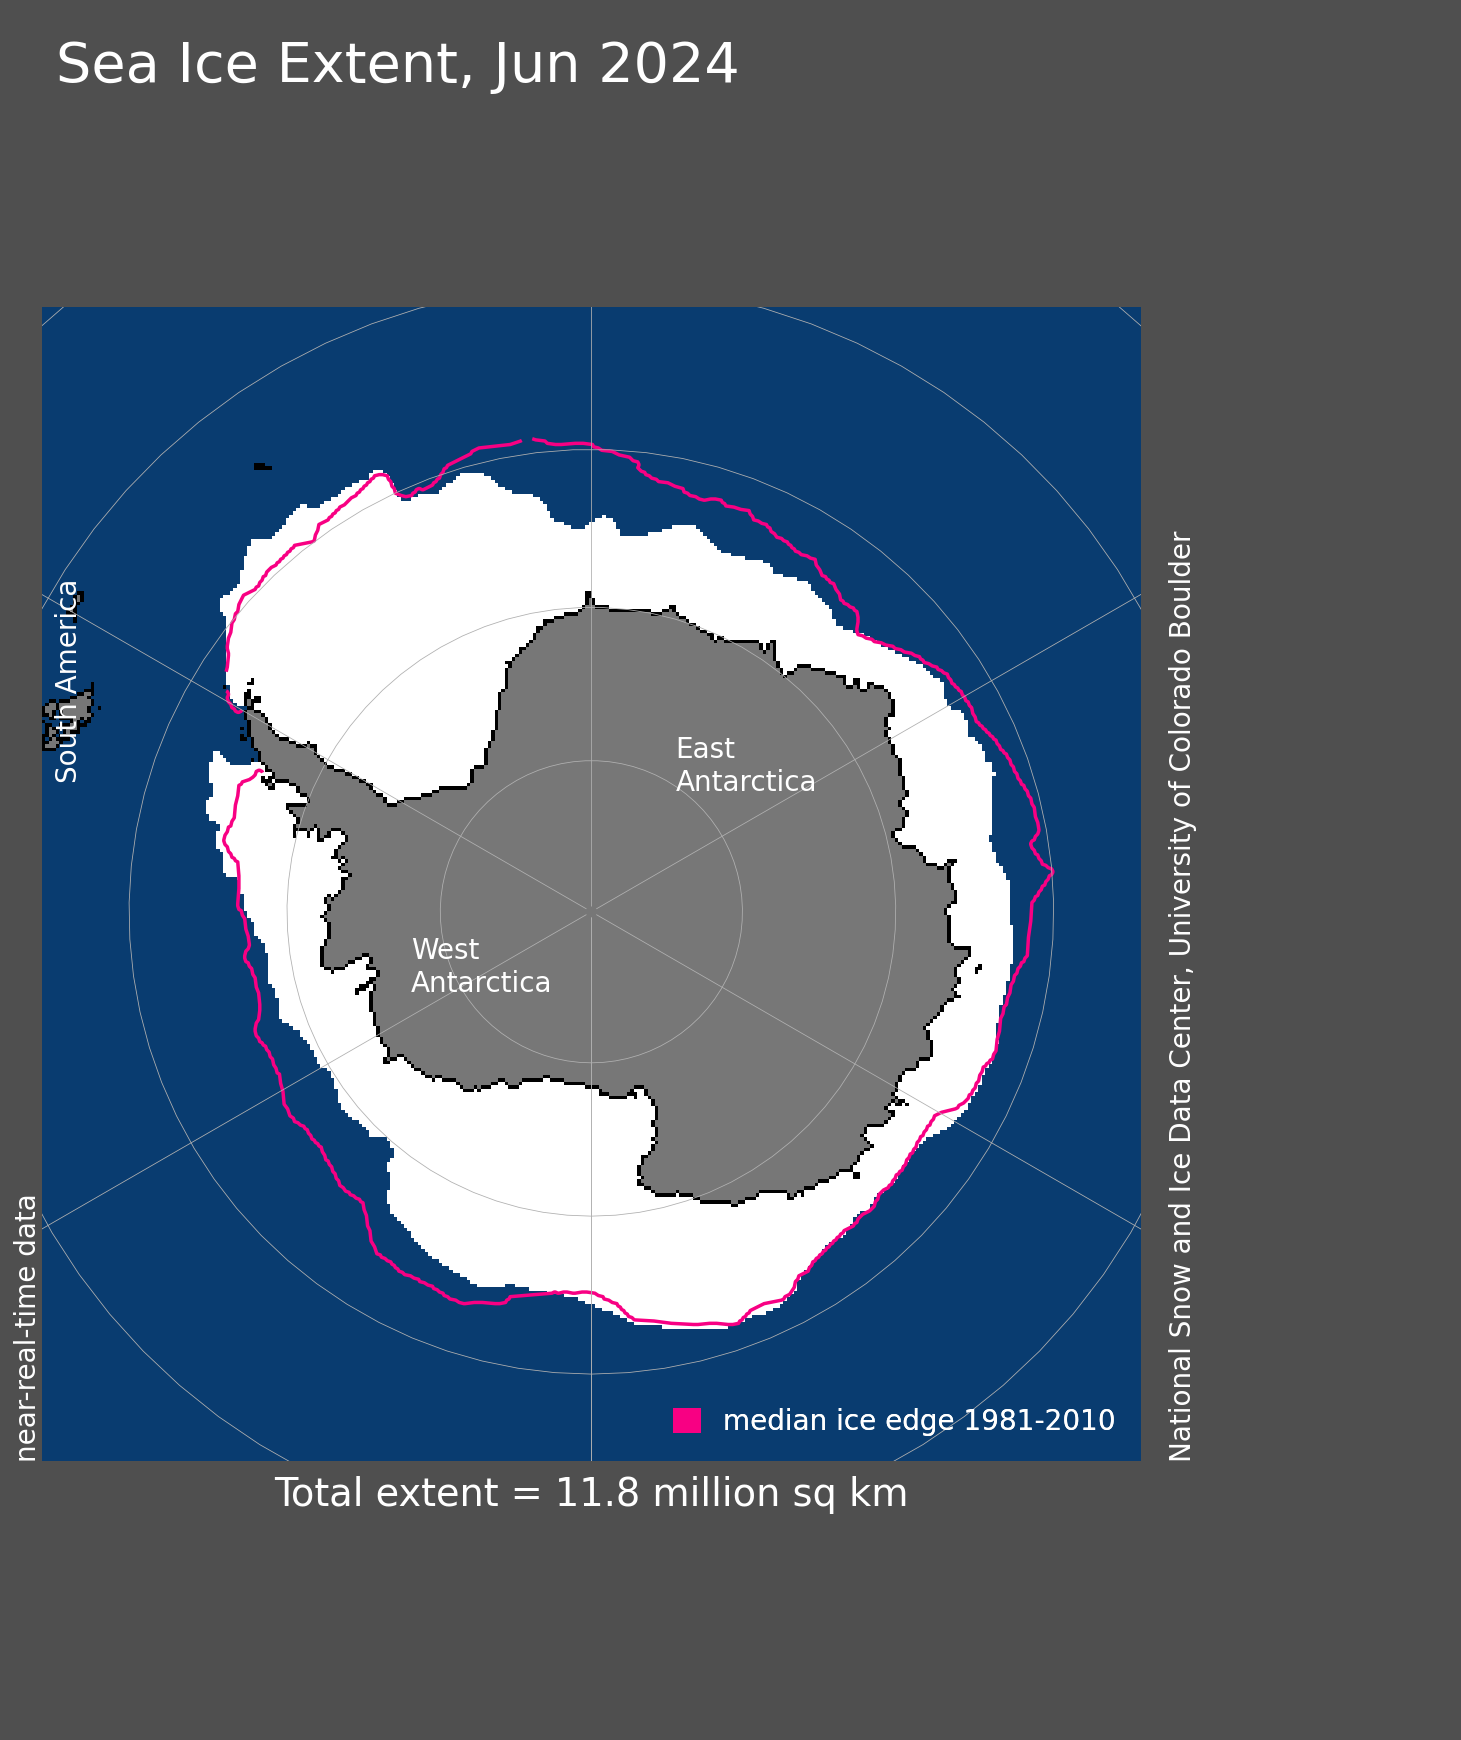
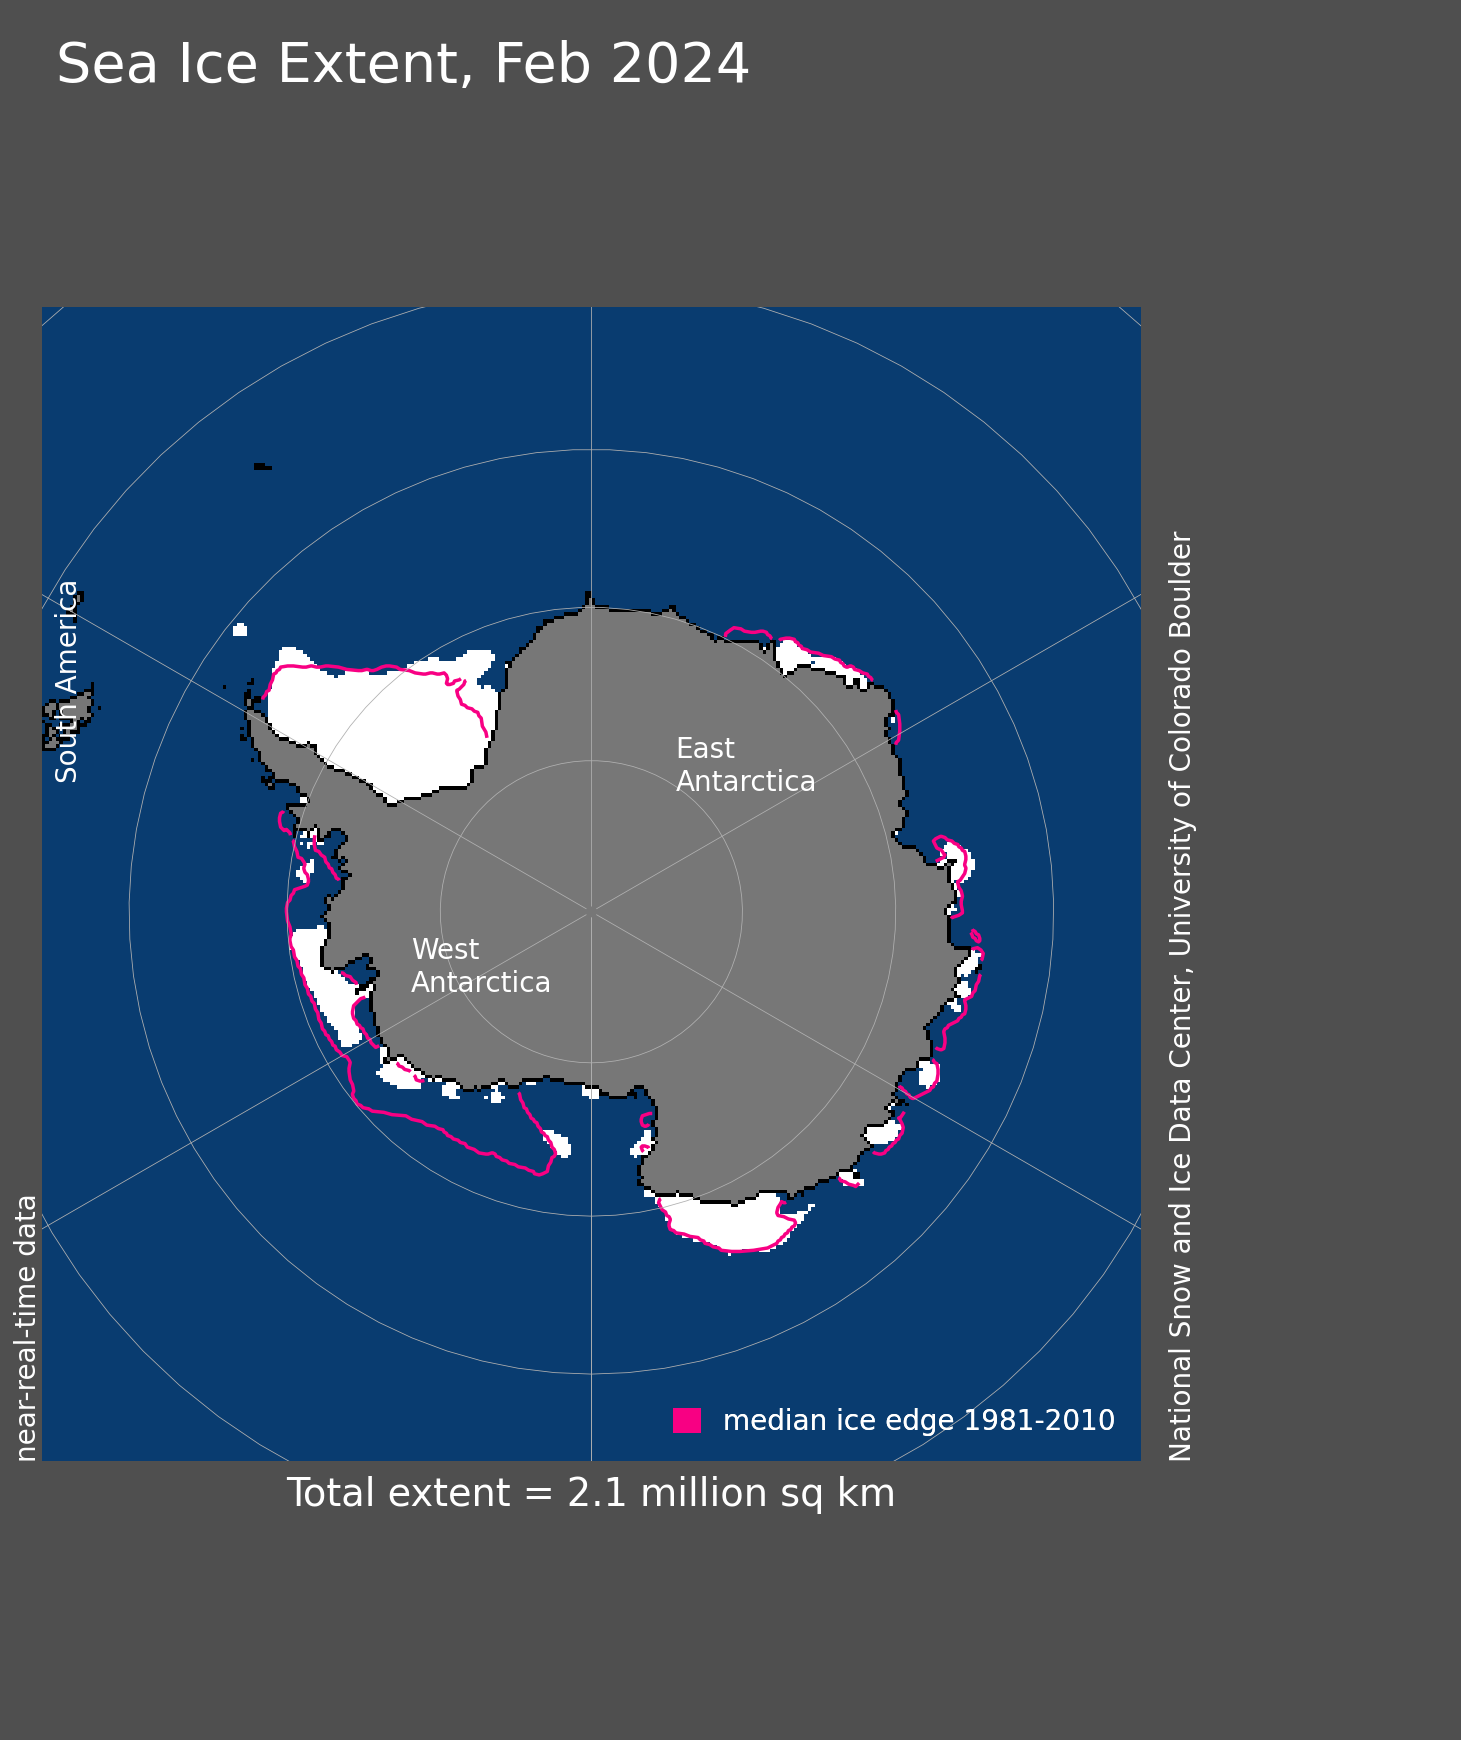
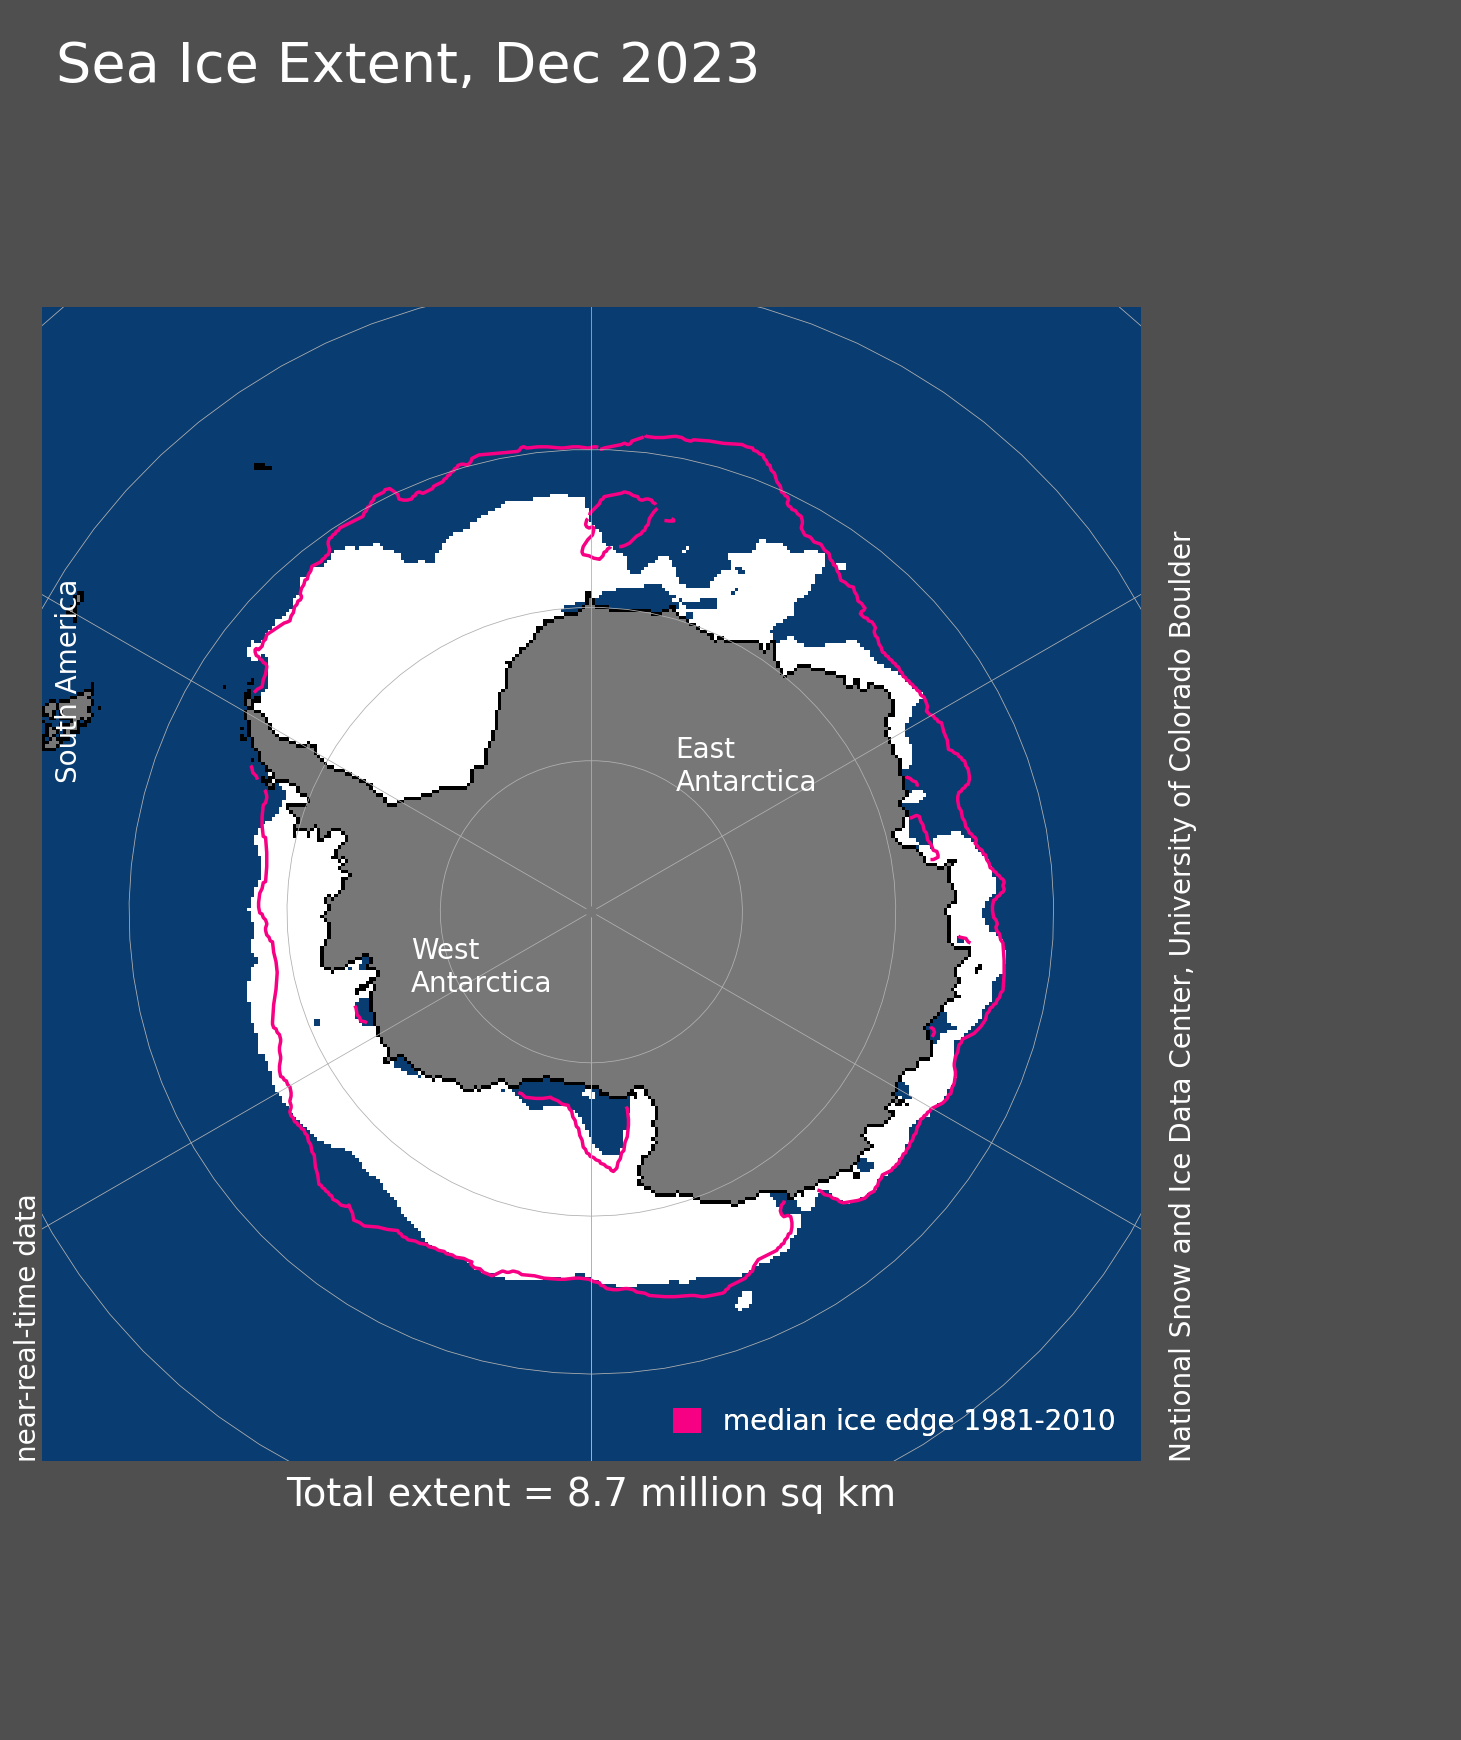
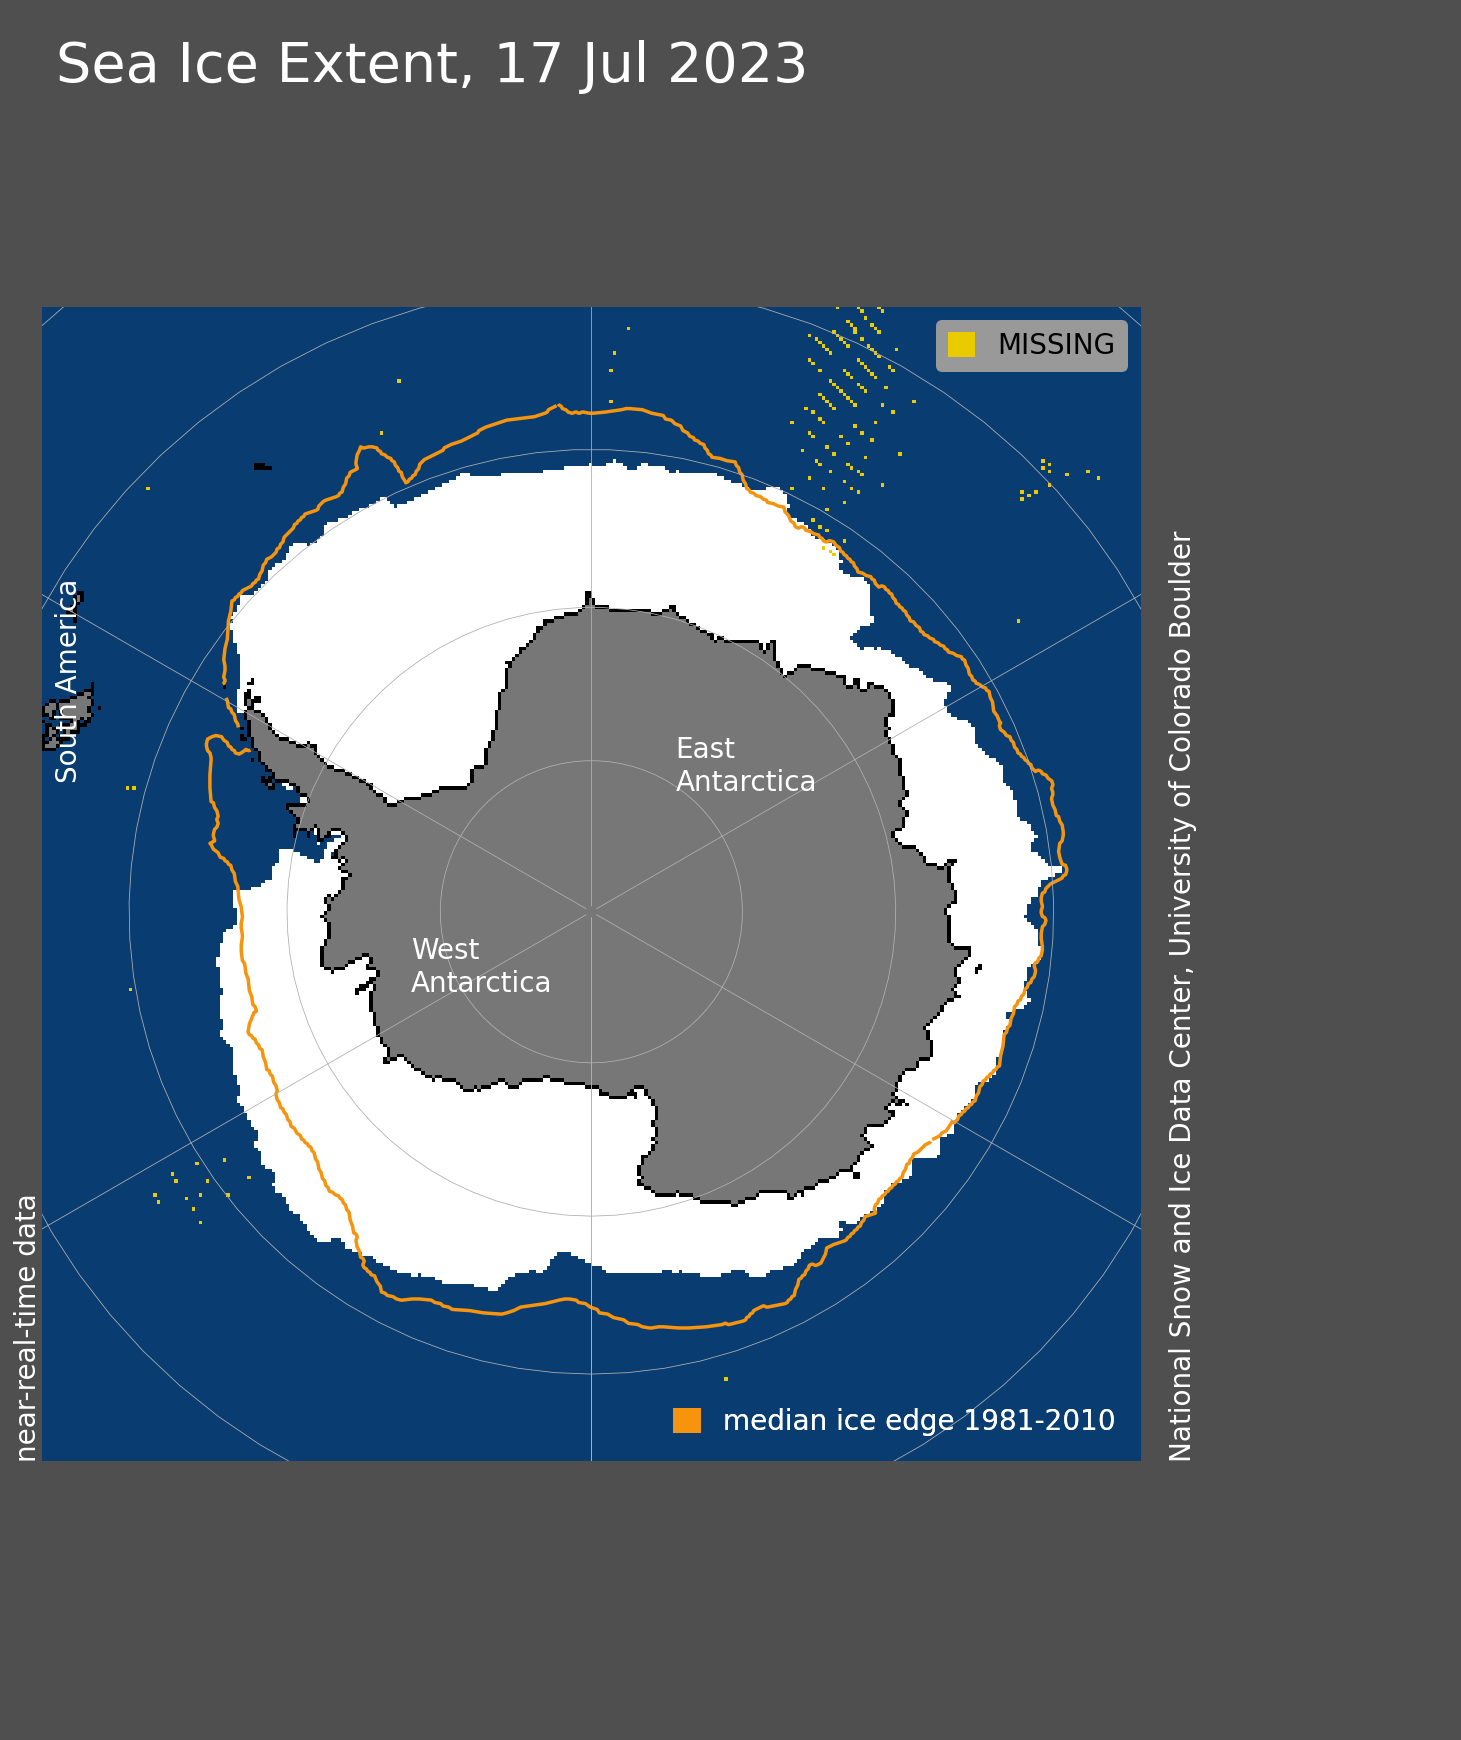
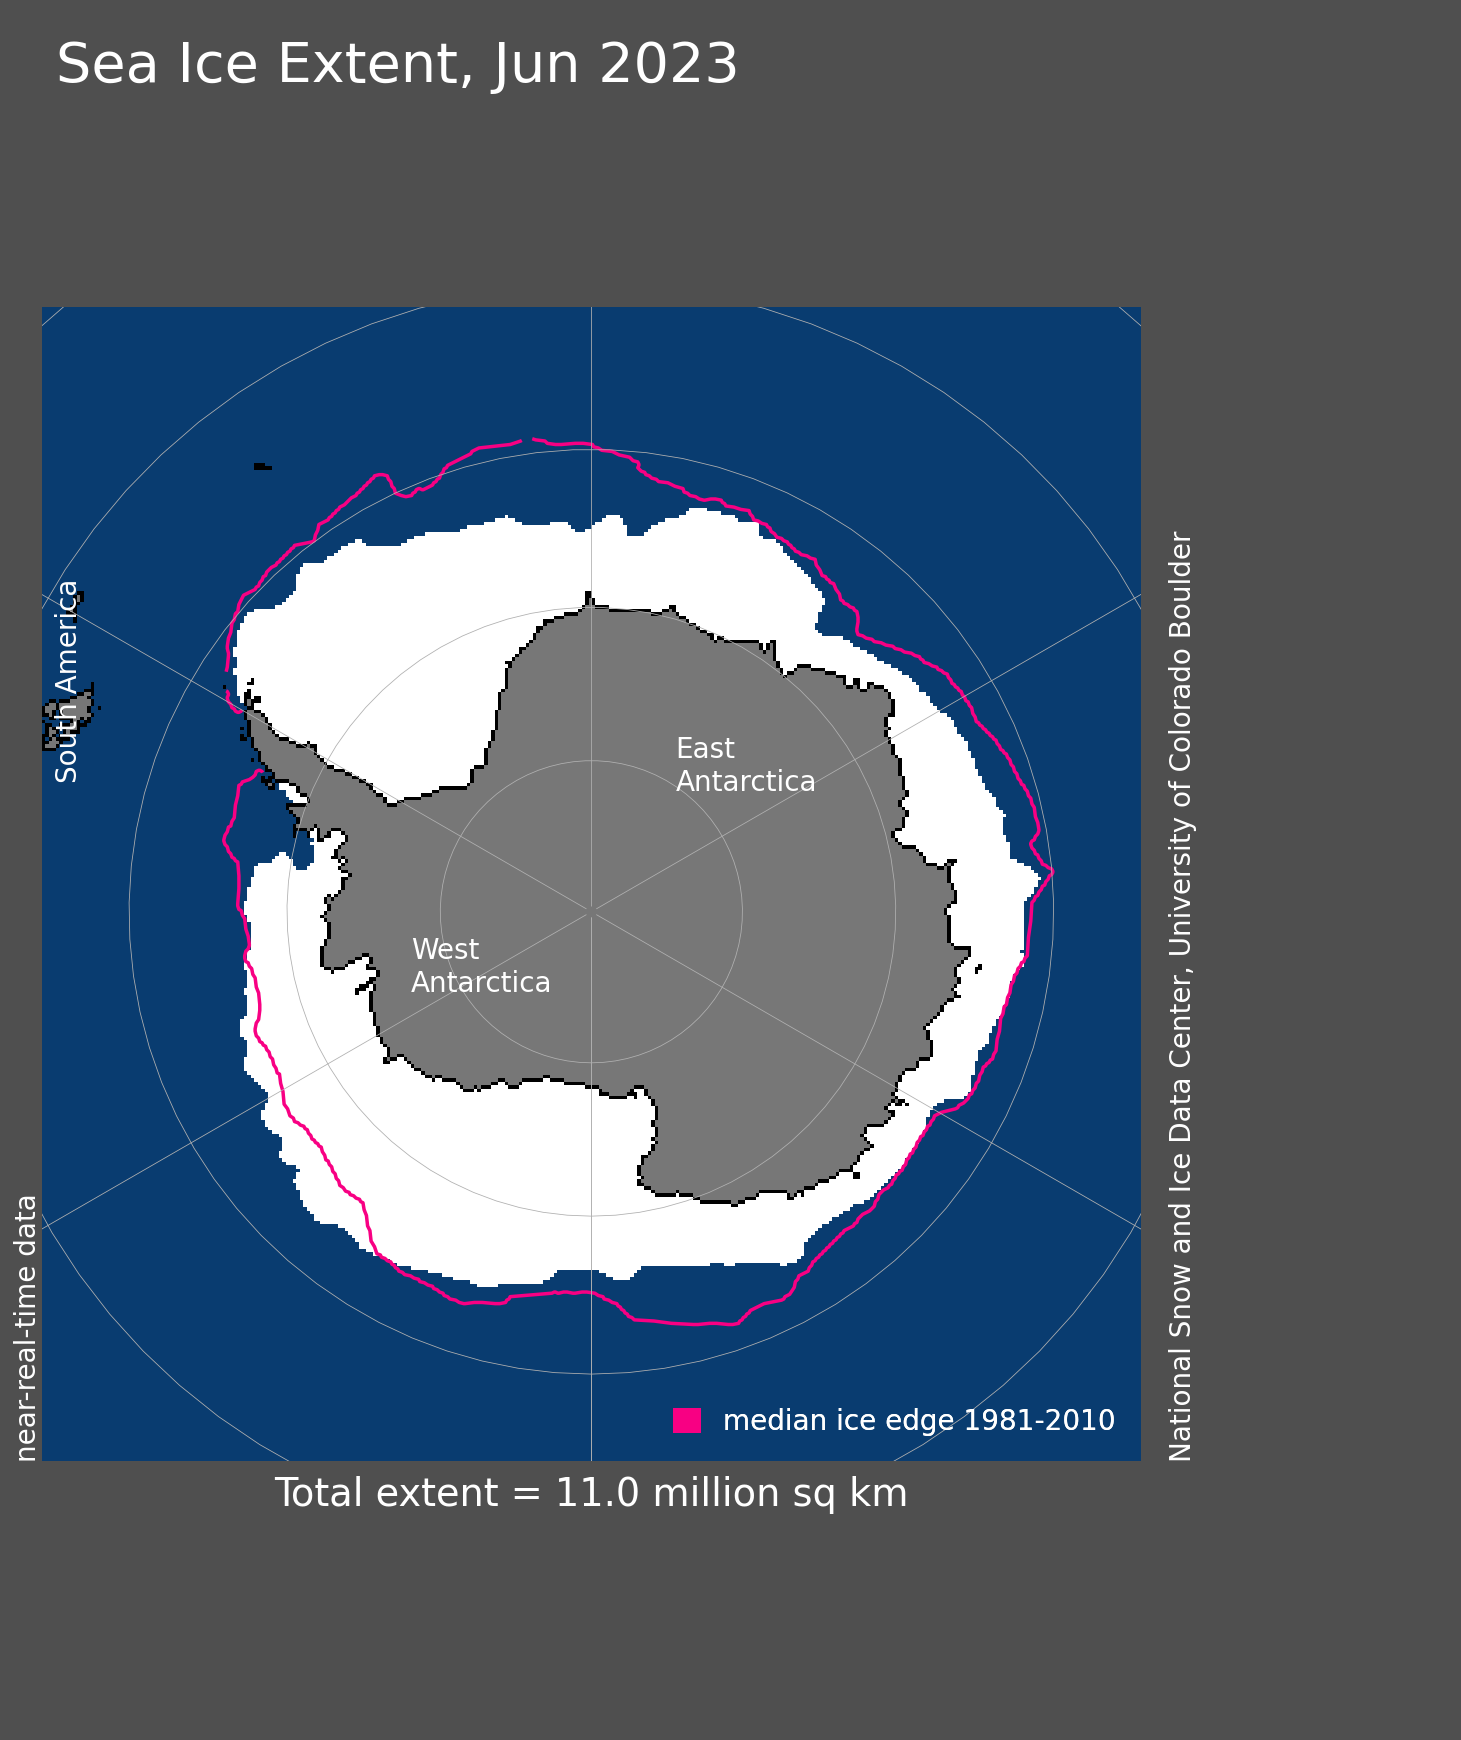
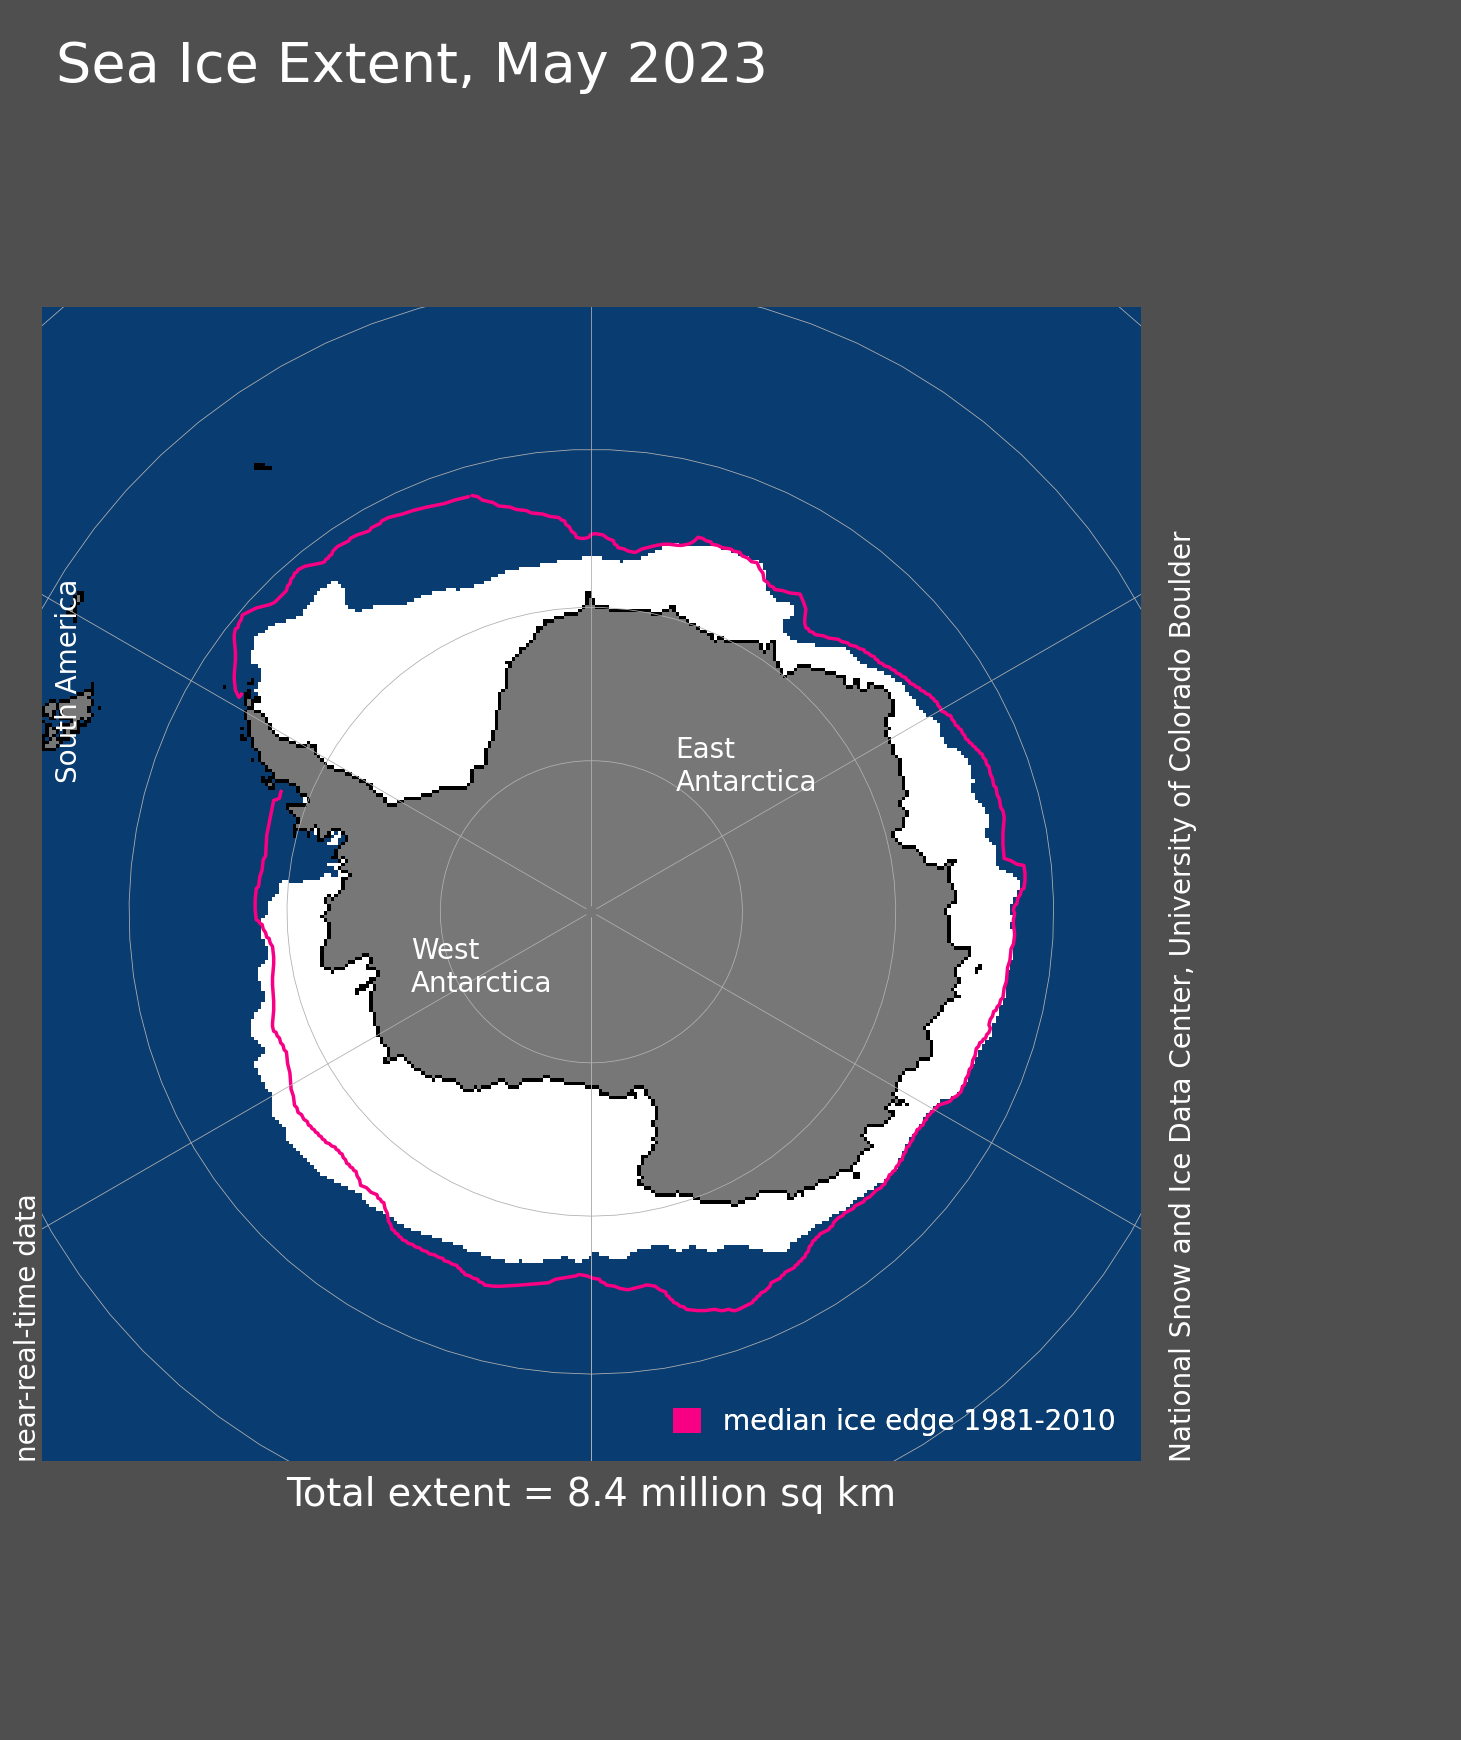
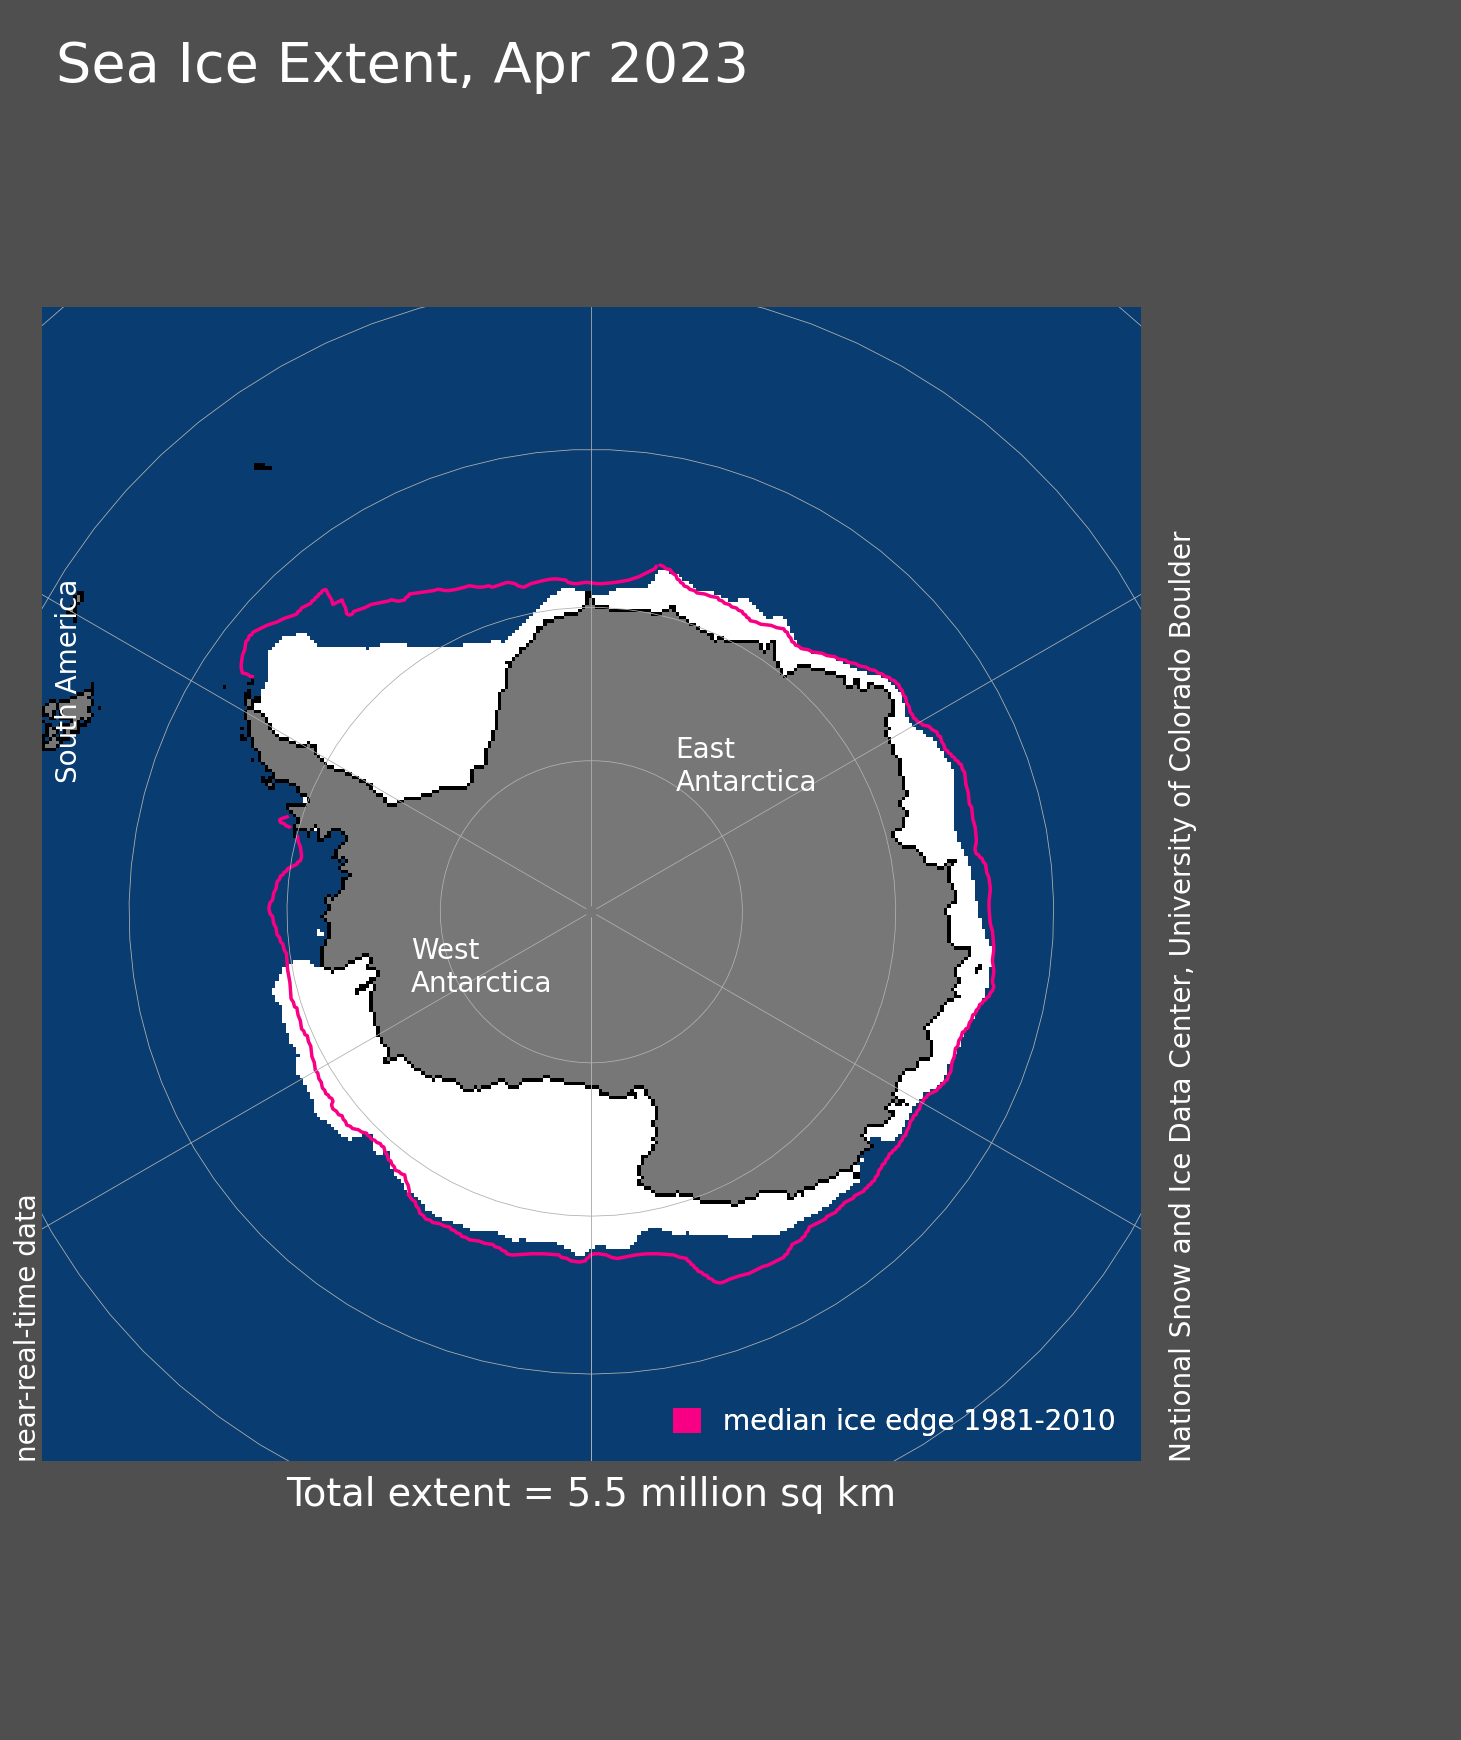
Figure 7a. Antarctic sea ice extent for June 2024 was 11.76 million square kilometers (4.54 million square miles). The magenta line shows the 1981 to 2010 average extent for that month. Sea Ice Index data. About the data
Credit: National Snow and Ice Data Center
High-resolution image
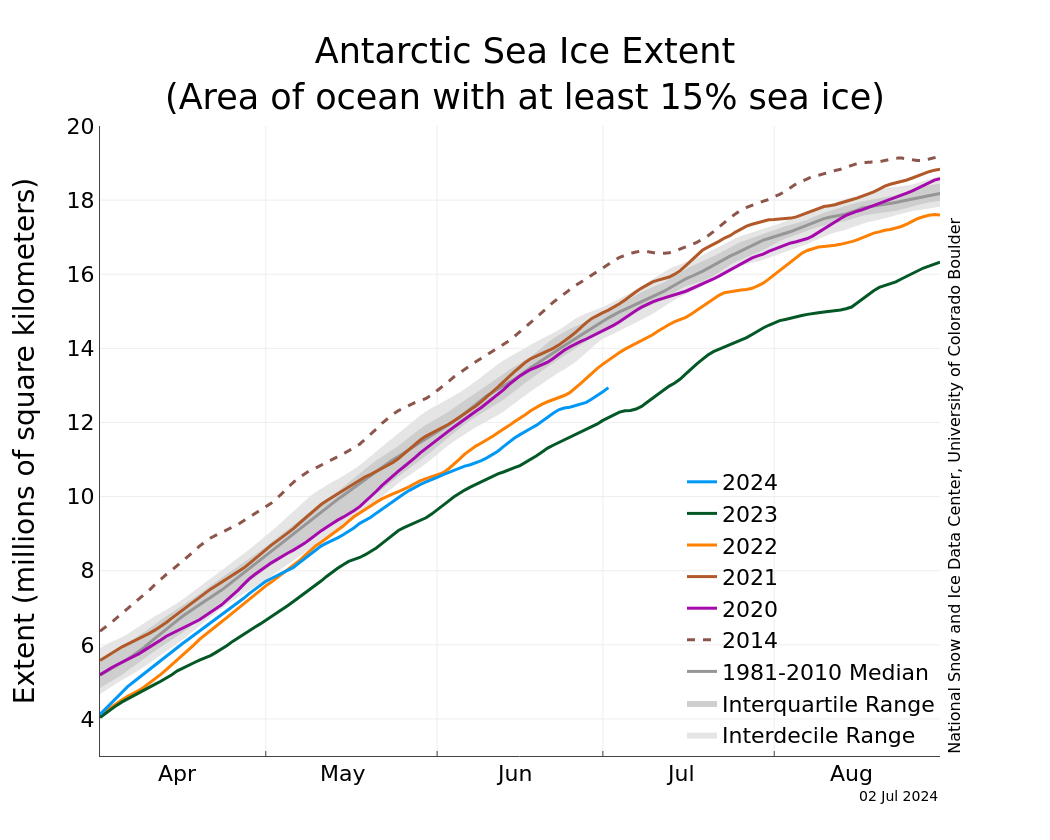
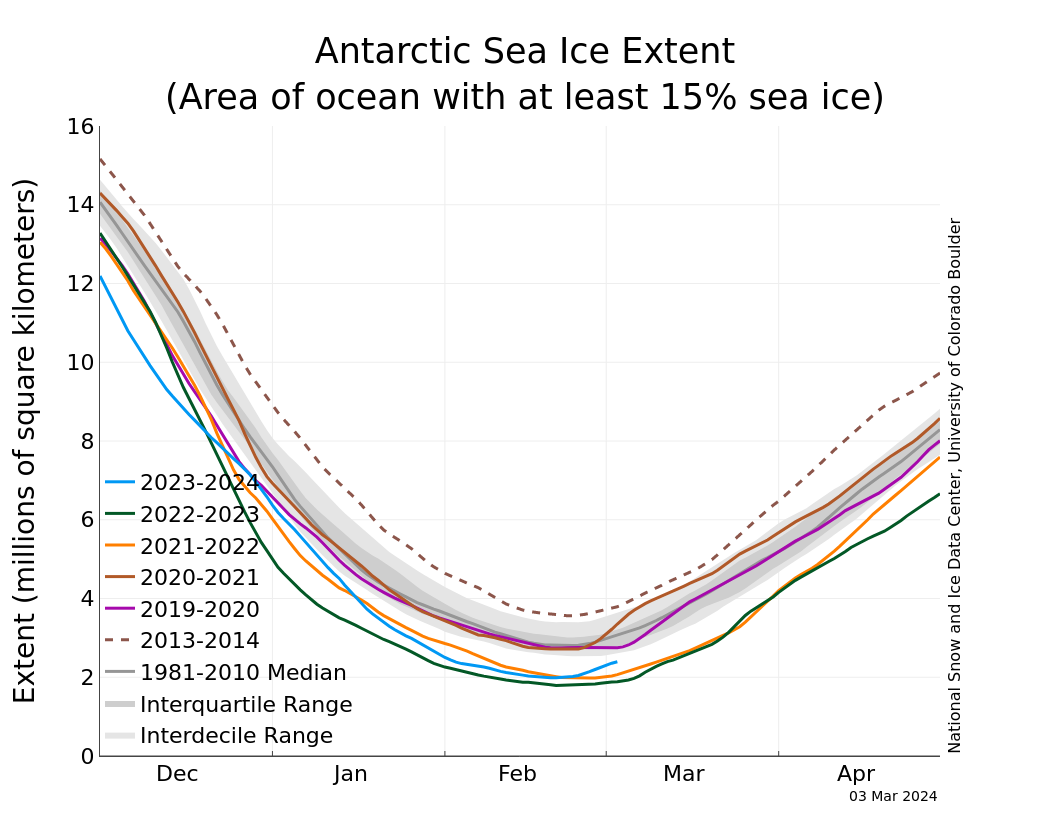
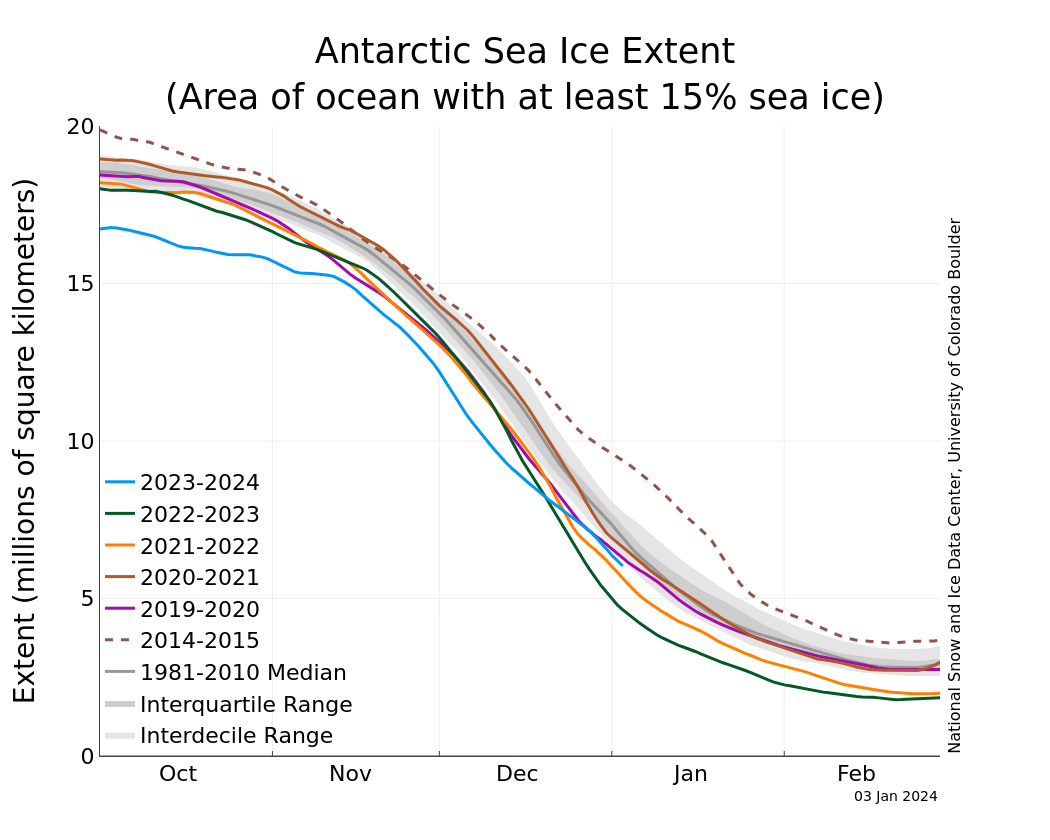
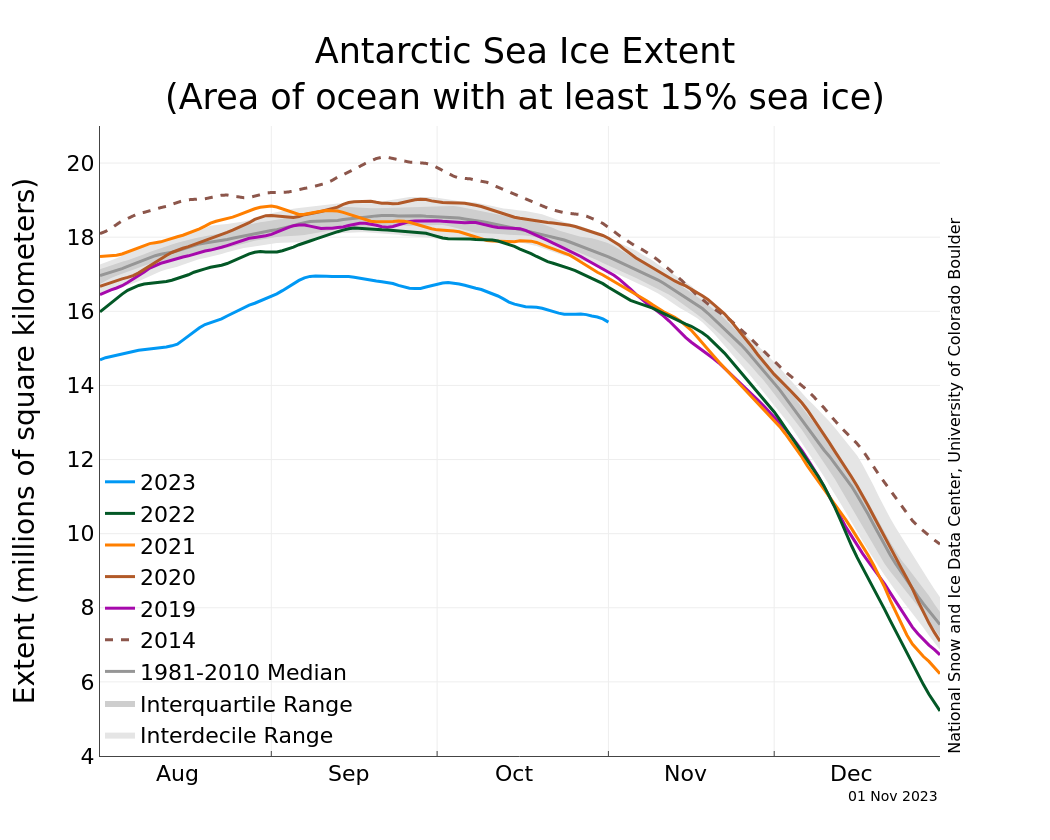
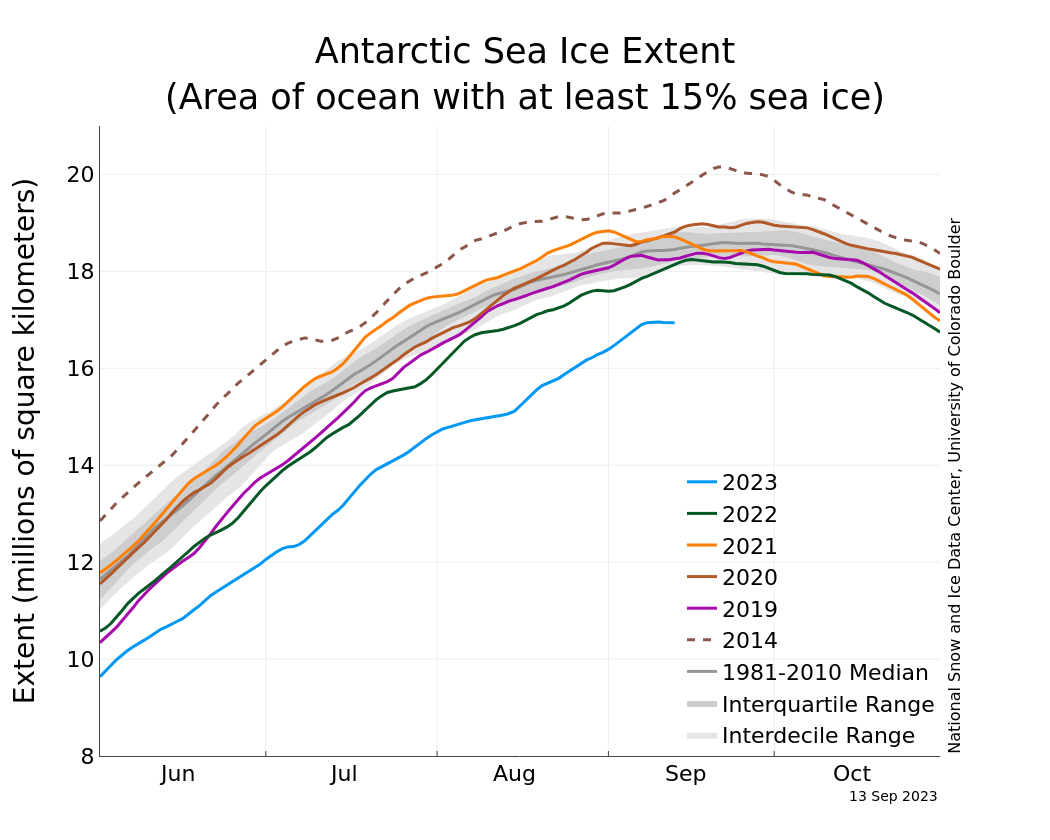
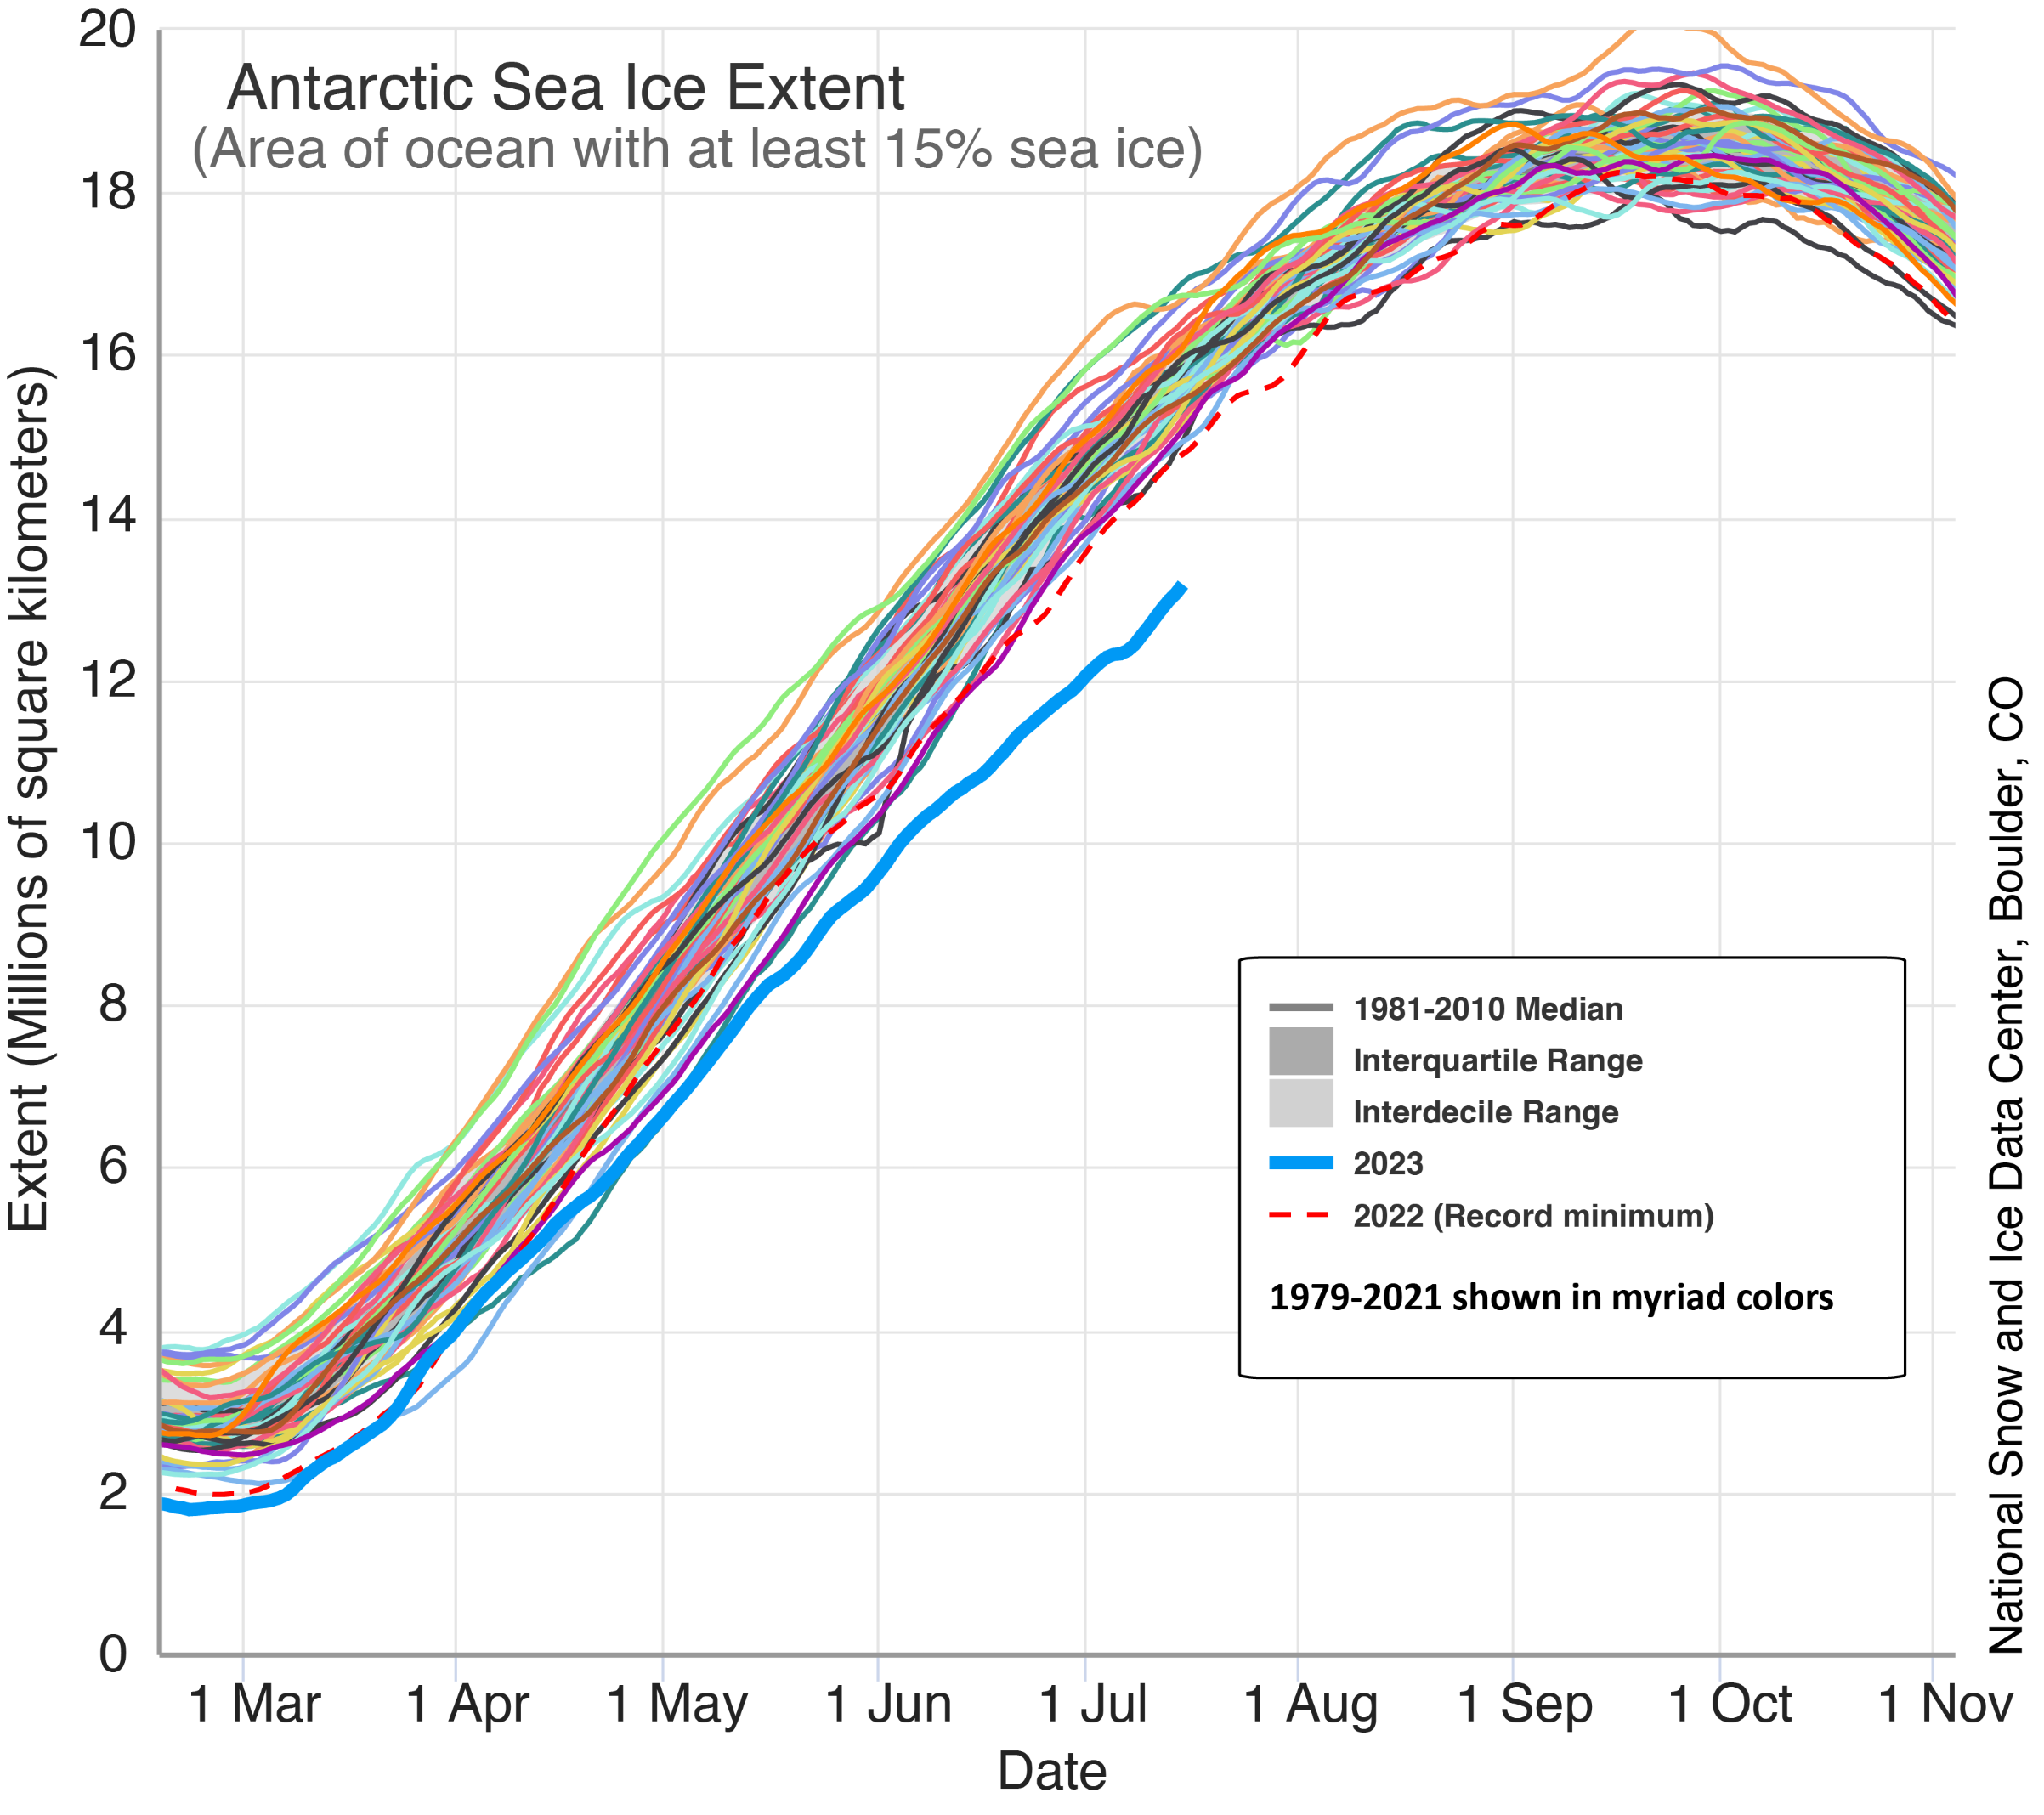
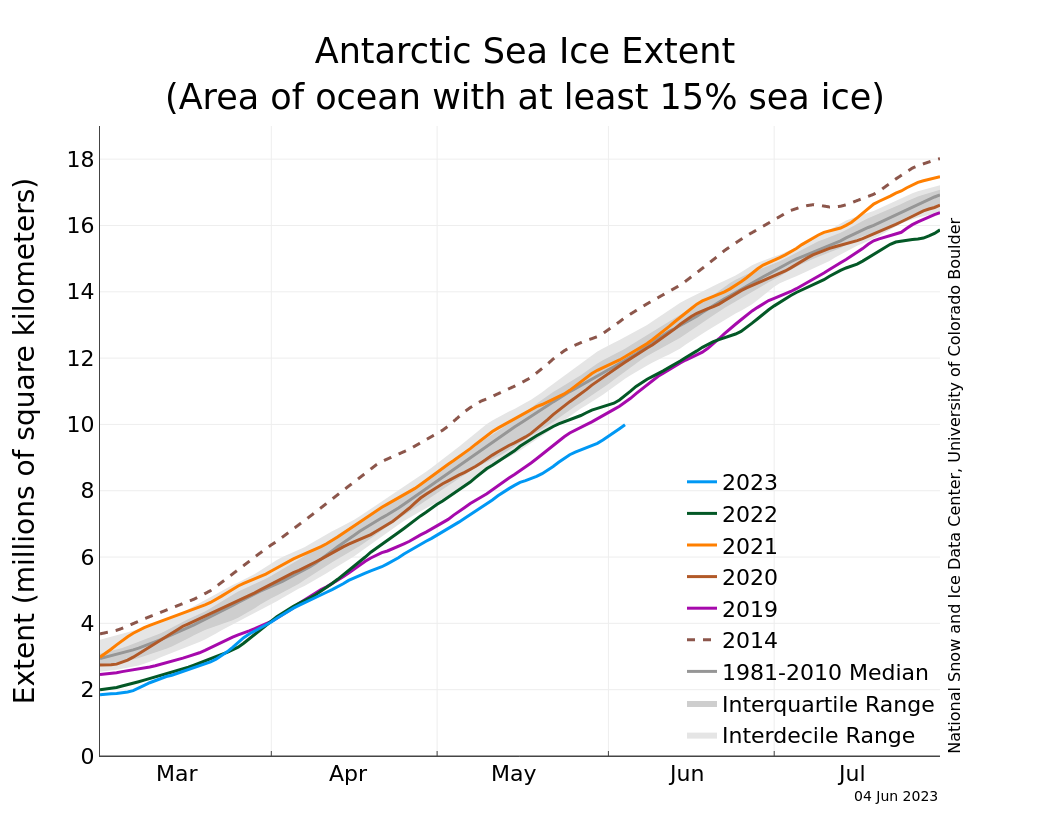
Figure 7b. The graph above shows Antarctic sea ice extent as of July 2, 2024, along with daily ice extent data for four previous years and the record high year. 2024 is shown in blue, 2023 in green, 2022 in orange, 2021 in brown, 2020 in magenta, and 2014, the record high year, in dashed brown. The 1981 to 2010 median is in dark gray. The gray areas around the median line show the interquartile and interdecile ranges of the data. Sea Ice Index data.
Credit: National Snow and Ice Data Center
High-resolution image
Antarctic sea ice extent continues to track well below all previous years except for 2023, the year of the lowest ice extent in the satellite data record. At month’s end, sea ice was more than 2 million square kilometers (772,000 square miles) below the 1981 to 2010 average, but still 500,000 square kilometers (193,000 square miles) above the exceptionally low 2023 extent (Figures 7a and 7b). The ice cover this year is particularly low in the Amundsen Sea, as well as in the Indian Ocean sector. Extent is near average in the Pacific Ocean sector and the Ross Sea, whereas in the western Weddell Sea and Bellingshausen Seas, the ice is above average. Unusually low sea ice extent in the Indian Ocean sector was also a prominent feature of the 2023 sea ice season.
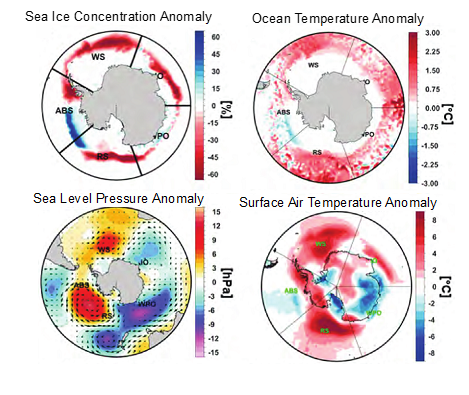
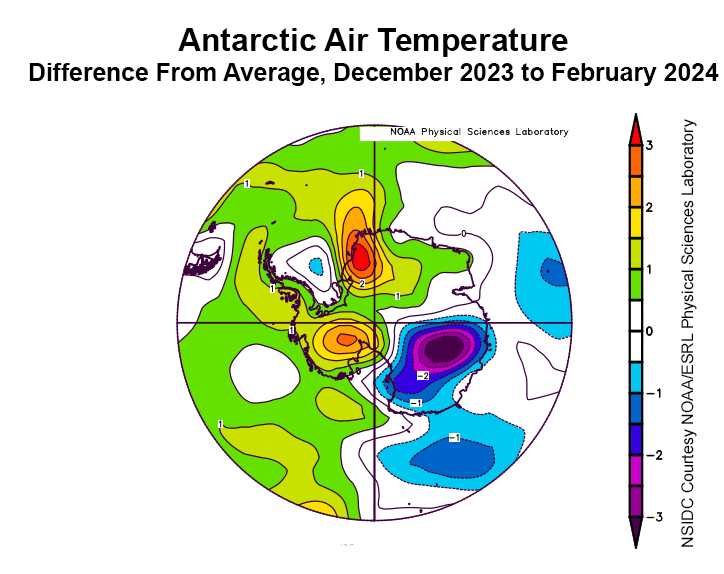
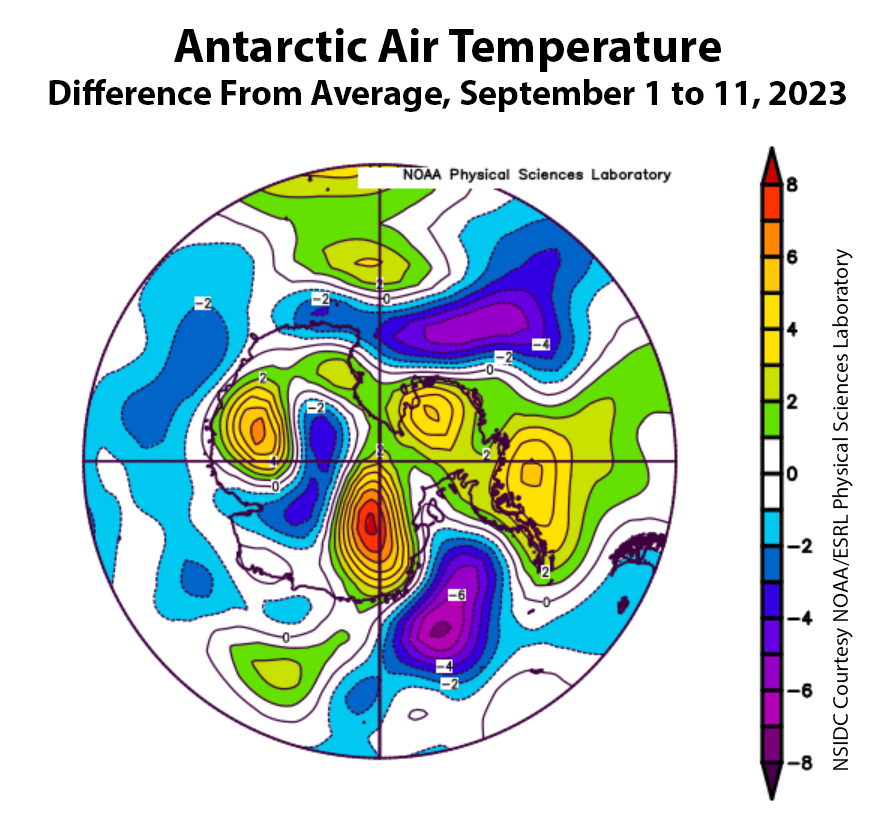
June temperatures at the 925 hPa level were mostly below average over the Ross and Weddell Seas as a result of cold air moving from the continent over the ocean. In the Amundsen Sea and Indian Ocean, the winds came from the north, bringing in relatively warmer air.
Erratum
On July 9, 2024, a reader notified the ASINA team of inaccuracies in Figure 2a. The figure has been updated as well as the text corresponding to the figure.
Further reading
Luo, B., D. Luo, A. Dai, et al. 2024. Rapid summer Russian Arctic sea-ice loss enhances the risk of recent Eastern Siberian wildfires. Nature Communications. doi:10.1038/s41467-024-49677-0.
Pilfold, N. W, D. Hedman, I. Stirling, A. E. Derocher, N. J. Lunn, and E. Richardson. 2016. Mass loss rates of fasting polar bears. PubMed Physiological and Biochemical Zoology. doi:10.1086/687988.
Stroeve, J., A. Crawford, S. Ferguson, et al. 2024. Ice-free period too long for Southern and Western Hudson Bay polar bear populations if global warming exceeds 1.6 to 2.6°C. Nature Communications Earth & Environment. doi:10.1038/s43247-024-01430-7.


