As the long Arctic winter sets in, sea ice extent has increased at a faster than average pace. By the end of October, the ice cover had reached the Siberian coast, while open water persisted along the coasts of the Beaufort and Chukchi Seas. In the Antarctic, the spring decline in extent has been quite slow, but extent at the end of October remains at record low levels for this time of year.
Overview of conditions
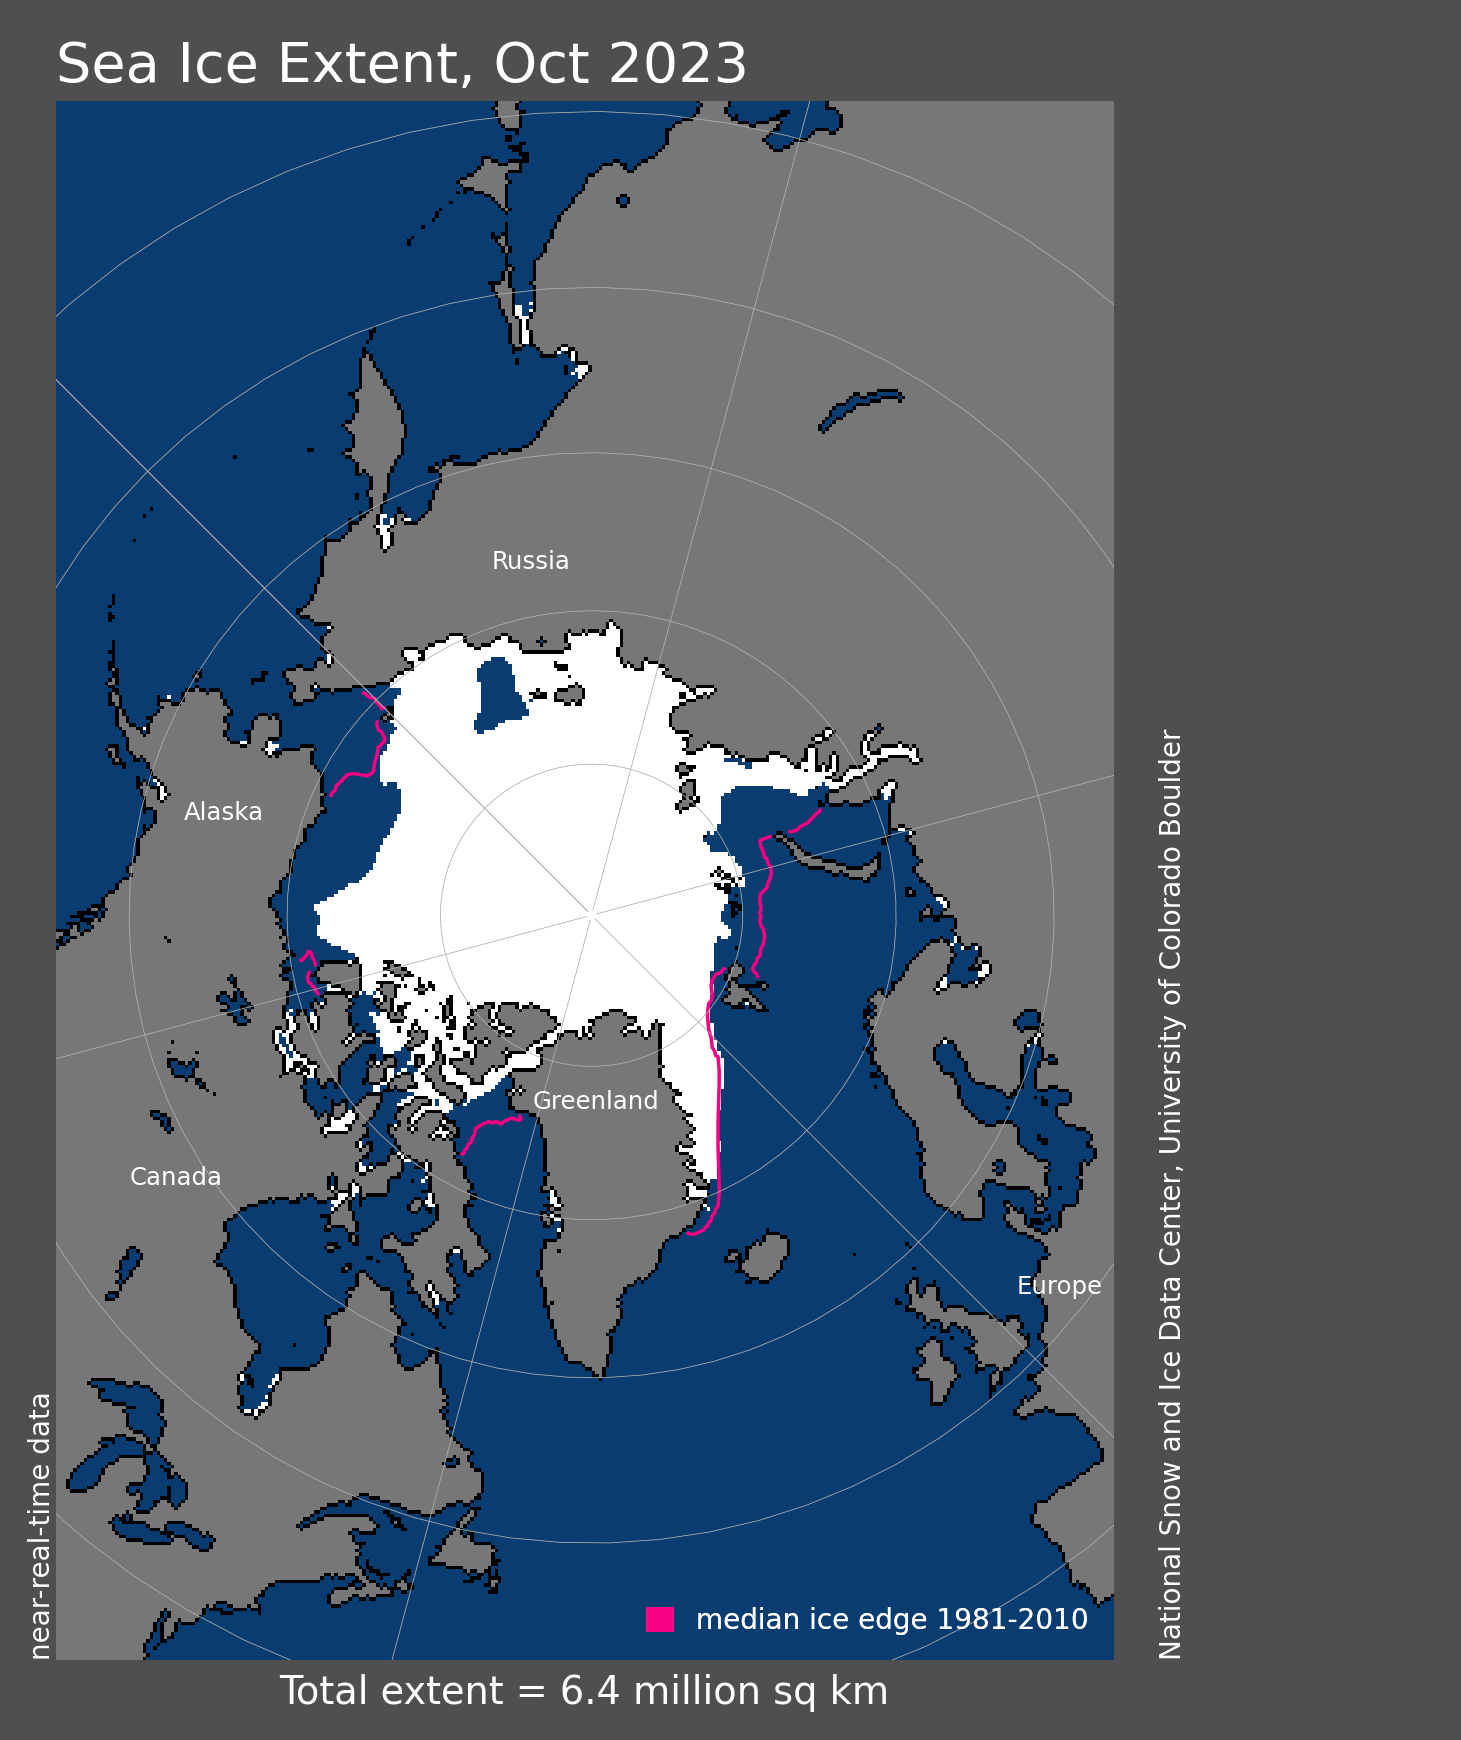
Figure 1a. Arctic sea ice extent for October 2023 was 6.37 million square kilometers (2.46 million square miles). The magenta line shows the 1981 to 2010 average extent for that month. Sea Ice Index data. About the data
Credit: National Snow and Ice Data Center
High-resolution image
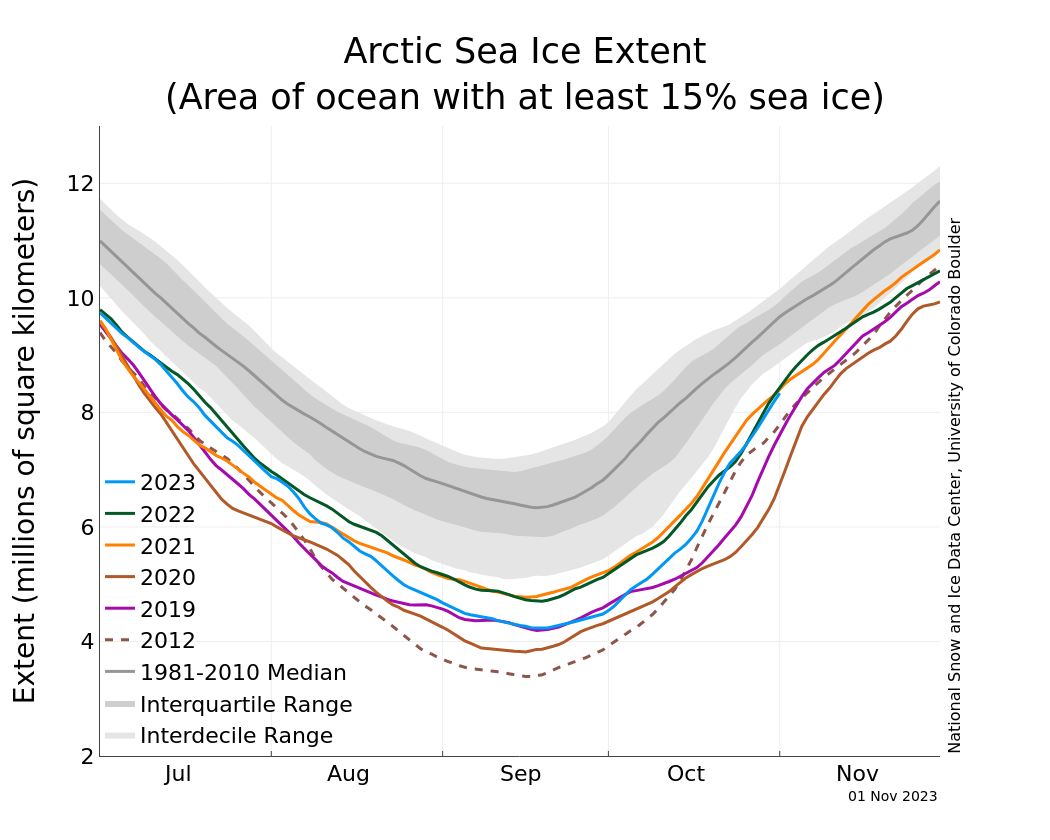
Figure 1b. The graph above shows Arctic sea ice extent as of November 1, 2023, along with daily ice extent data for four previous years and the record low year. 2023 is shown in blue, 2022 in green, 2021 in orange, 2020 in brown, 2019 in magenta, and 2012 in dashed brown. The 1981 to 2010 median is in dark gray. The gray areas around the median line show the interquartile and interdecile ranges of the data. Sea Ice Index data.
Credit: National Snow and Ice Data Center
High-resolution image
Average Arctic sea ice extent for October 2023 was 6.37 million square kilometers (2.46 million square miles), seventh lowest in the 45-year satellite record (Figure 1a). Overall, during October sea ice extent increased by 119,800 thousand square kilometers (46,300 square miles) per day, which is faster than the 1981 to 2010 average of 89,200 square kilometers (34,400 square miles) per day (Figure 1b). The freeze up was particularly rapid along the Siberian Seas where the ice cover expanded to the coast by the end of the month. Open water remained in the Beaufort and Chukchi Seas at the end of October. Ice growth within the channels of the Canadian Archipelago closed off the Northwest Passage.
Conditions in context

Figure 2a. This plot shows the departure from average air temperature in the Arctic at the 925 hPa level, in degrees Celsius, for October 2023. Yellows and reds indicate above average temperatures; blues and purples indicate below average temperatures.
Credit: NSIDC courtesy NOAA Earth System Research Laboratory Physical Sciences Laboratory
High-resolution image
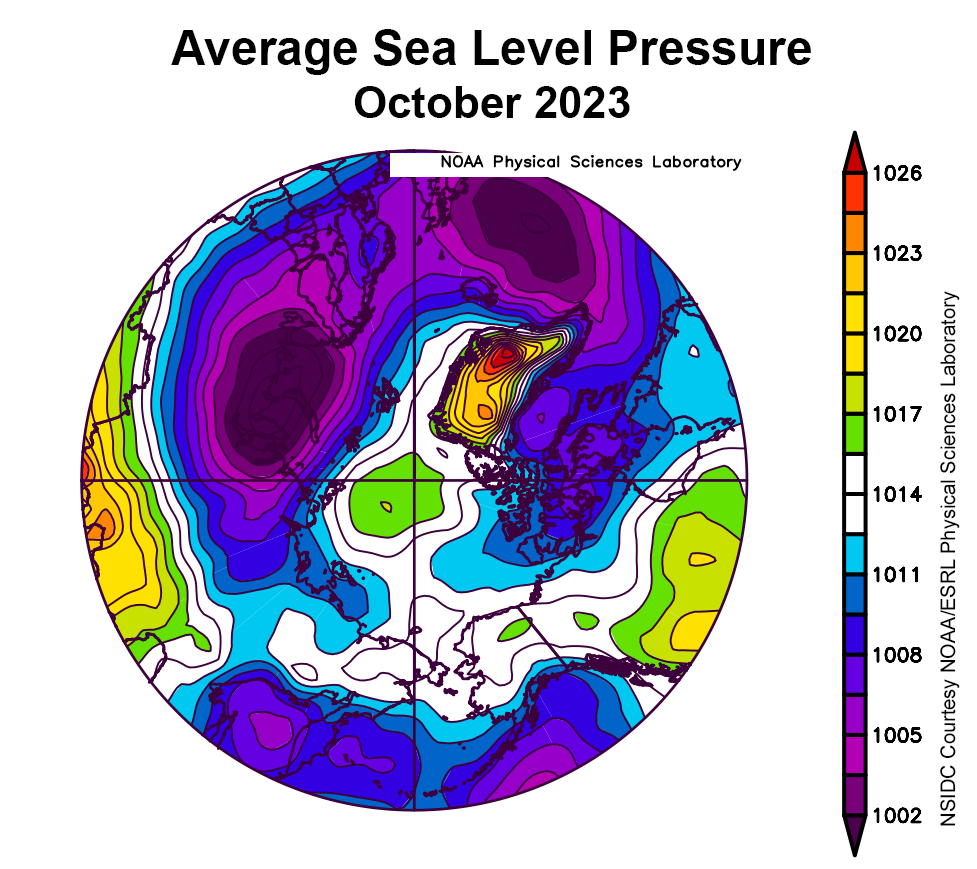
Figure 2b. This plot shows average sea level pressure in the Arctic in millibars for October 2023. Yellows and reds indicate above average air pressures; blues and purples indicate below average air pressures.
Credit: NSIDC courtesy NOAA Earth System Research Laboratory Physical Sciences Laboratory
High-resolution image
Air temperatures over the Arctic Ocean at the 925 millibar level (about 2,500 feet above the surface) were mostly above average during October, particularly in and around the Canadian Archipelago, which saw temperatures of 4 to 5 degrees Celsius (7 to 9 degrees Fahrenheit) above average (Figure 2a). Temperatures were modestly above average across the pole and over the Laptev and Kara Seas. The Chukchi and East Siberian Seas experienced near-average temperatures while temperatures were below average over the Bering Strait and the Barents and Norwegian Seas.
The atmospheric circulation featured weak high sea level pressure centered over the North Pole and fairly strong low pressure centered on the Norwegian Sea and north-central Siberia (Figure 2b). This pattern created strong winds along the Russian Arctic coast.
October 2023 compared to previous years
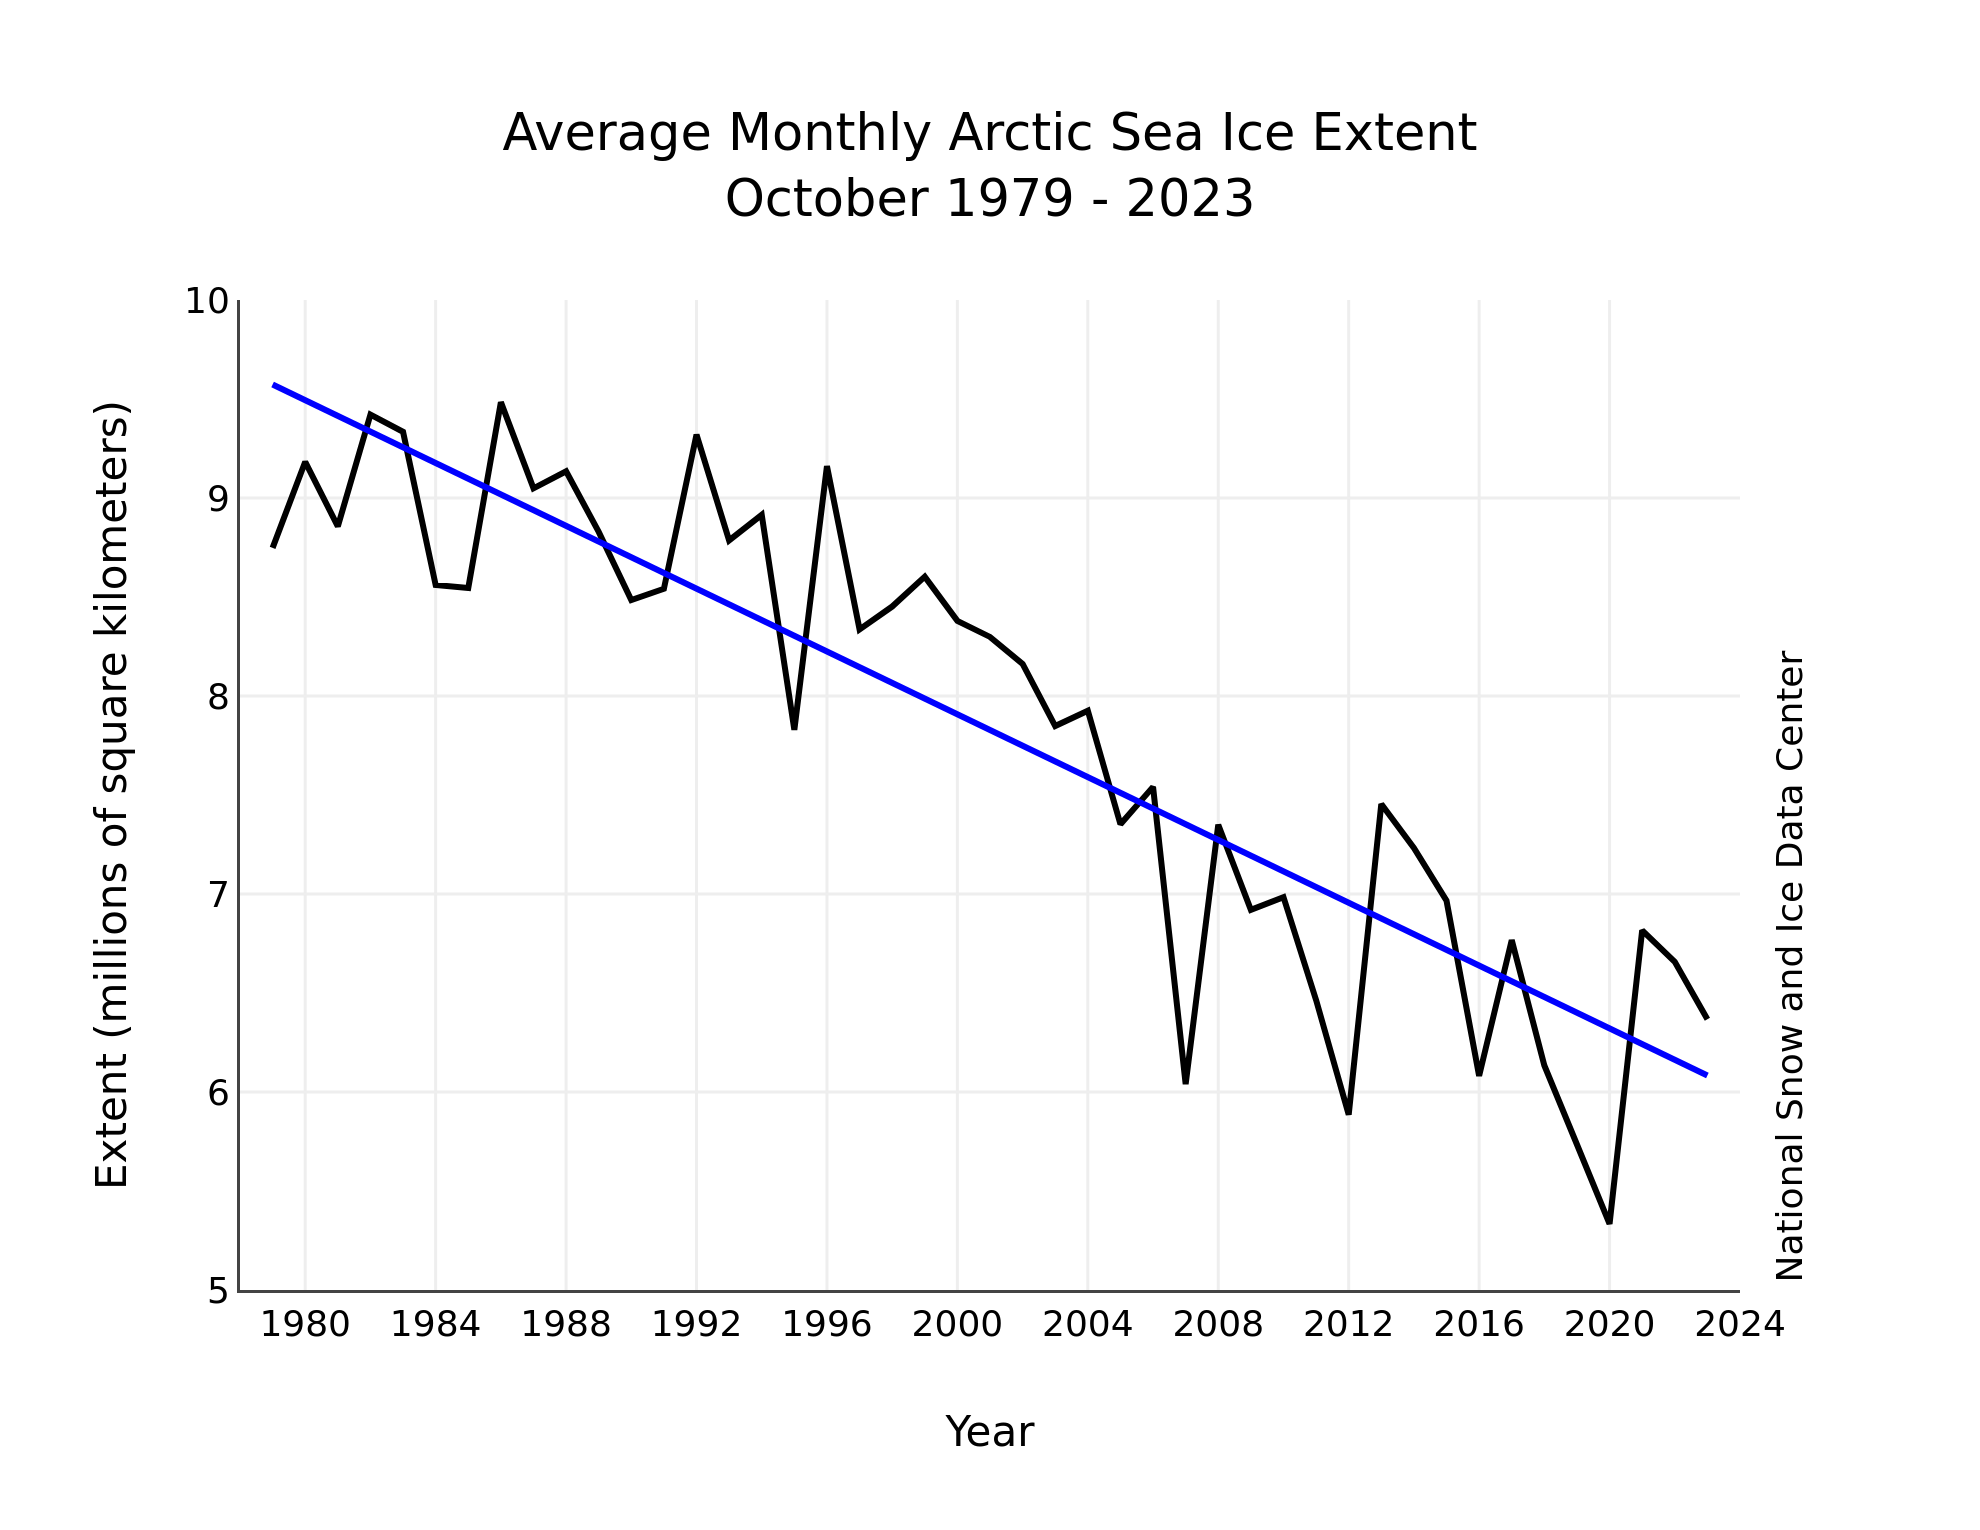
Figure 3. Monthly October ice extent for 1979 to 2023 shows a decline of 9.5 percent per decade.
Credit: National Snow and Ice Data Center
High-resolution image
The downward linear trend in Arctic sea ice extent for October over the 45-year satellite record is 79,300 square kilometers (30,600 square miles) per year, or 9.5 percent per decade relative to the 1981 to 2010 average (Figure 3). Based on the linear trend, October has lost 3.49 million square kilometers (1.35 million square miles) of ice since 1979. This is equivalent to twice the size of Alaska.
Spring breaks slowly in the south
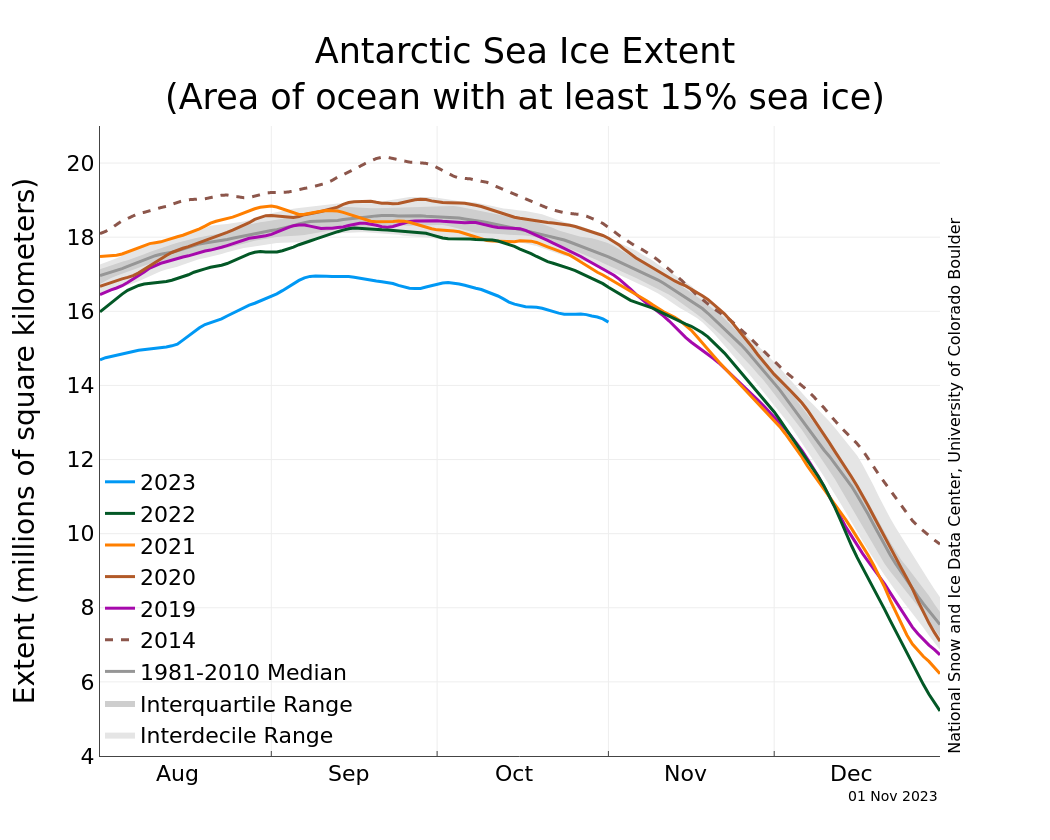
Figure 4. The graph above shows Antarctic sea ice extent as of November 1, 2023, along with daily ice extent data for four previous years and the record high year. 2023 is shown in blue, 2022 in green, 2021 in orange, 2020 in brown, 2019 in magenta, and 2014 in dashed brown. The 1981 to 2010 median is in dark gray. The gray areas around the median line show the interquartile and interdecile ranges of the data. Sea Ice Index data.
Credit: National Snow and Ice Data Center
High-resolution image
As the Antarctic heads toward summer following the record low maximum sea ice extent in September (winter), the rate of ice loss has been a bit slower than average. During October, the 2023 rate of decline was 29,100 square kilometers (11,200 square miles) per day, compared to the average rate of decline of 31,800 square kilometers (12,300 square miles) per day (Figure 4). The total decline in sea ice extent through October was 903,000 square kilometers (349,000 square miles), compared to the October average of 985,000 square kilometers (380,000 square miles).
Nonetheless, extent at the end of October remained at record low levels. The October 31, 2023, extent of 15.79 million square kilometers (6.10 million square miles) is 750,000 square kilometers (290,000 square miles) below the previous October 31 record low, which occurred in 1986. Extent is below average in the Ross Sea region and to the east of the Weddell Sea, as has been the case through most of austral winter. Extent is above average in the Amundsen and Bellingshausen Seas and near-average elsewhere.

