The end of 2023 had above average sea ice growth, bringing the daily extent within the interdecile range, the range spanning 90 percent of past sea ice extents for the date. Rapid expansion of ice in the Chukchi and Bering Seas and across Hudson Bay was responsible. The Antarctic summer sea ice decline slowed, moving the daily ice extent values above previous record low levels. For the year as a whole, however, low Antarctic sea ice was the dominant feature.
Overview of conditions

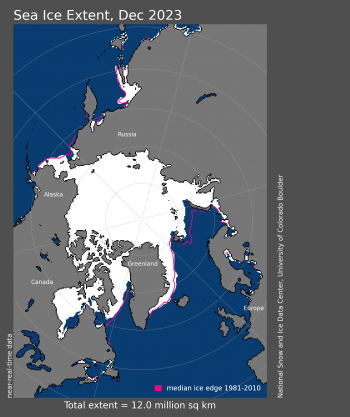
Figure 1a. Arctic sea ice extent for December 2023 was 12.00 million square kilometers (4.63 million square miles). The magenta line shows the 1981 to 2010 average extent for that month. Sea Ice Index data. About the data
Credit: National Snow and Ice Data Center
High-resolution image
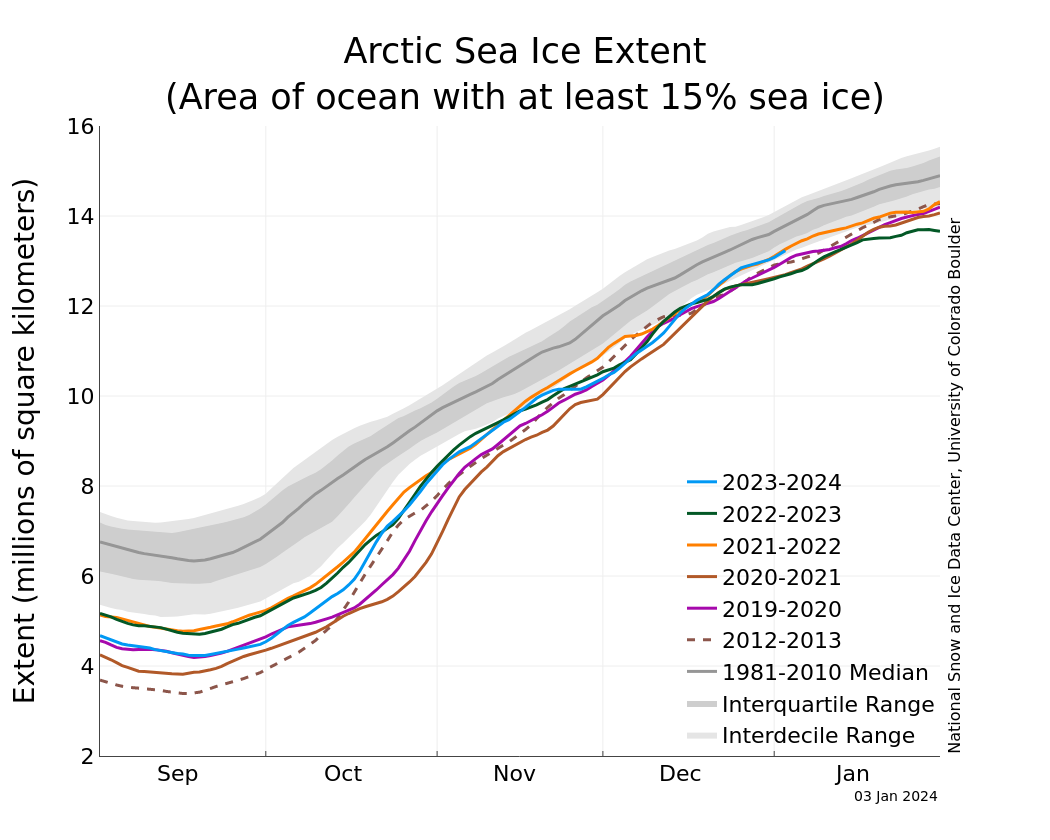
Figure 1b. The graph above shows Arctic sea ice extent as of January 3, 2024, along with daily ice extent data for four previous years and the record low year. 2023 to 2024 is shown in blue, 2022 to 2023 in green, 2021 to 2022 in orange, 2020 to 2021 in brown, 2019 to 2020 in magenta, and 2012 to 2013 in dashed brown. The 1981 to 2010 median is in dark gray. The gray areas around the median line show the interquartile and interdecile ranges of the data. Sea Ice Index data.
Credit: National Snow and Ice Data Center
High-resolution image
Average Arctic sea ice extent for December 2023 was 12.00 million square kilometers (4.63 million square miles), ninth lowest in the 45-year satellite record (Figure 1a). Sea ice extent increased by an average of 87,400 square kilometers (33,700 thousand square miles) per day, markedly faster than the 1981 to 2010 average of 64,100 square kilometers (24,700 square miles) per day (Figure 1b). After a delayed start to the freeze-up in Hudson Bay, sea ice formed quickly from west to east across the bay, leaving only a small area of open ocean near the Belcher Islands at month’s end. In the northern Atlantic, sea ice extent remained below average extent, as has been typical for the past decade.
For December overall, 2023 had the third highest monthly gain in the 45-year record at 2.71 million square kilometers (1.05 square miles), behind 2006 at 2.85 million square kilometers (1.10 million square miles) and 2016 at 2.78 million square kilometers (1.07 million square miles).
Conditions in context
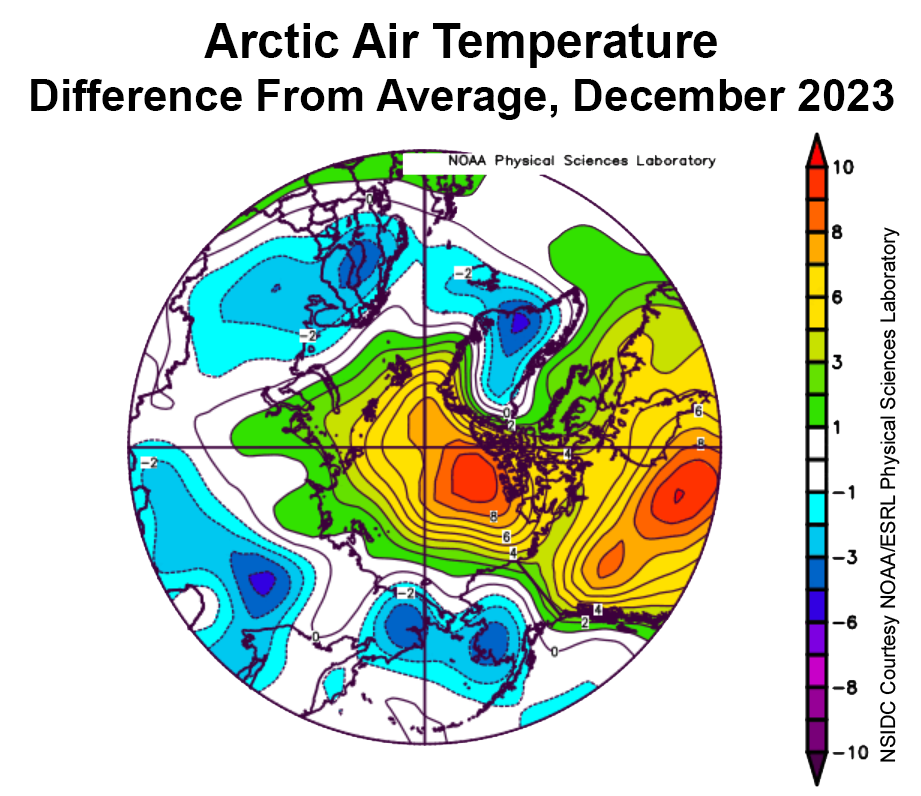
Figure 2a. This plot shows the departure from average air temperature in the Arctic at the 925 hPa level, in degrees Celsius, for December 2023. Yellows and reds indicate above average temperatures; blues and purples indicate below average temperatures.
Credit: NSIDC courtesy NOAA Earth System Research Laboratory Physical Sciences Laboratory
High-resolution image
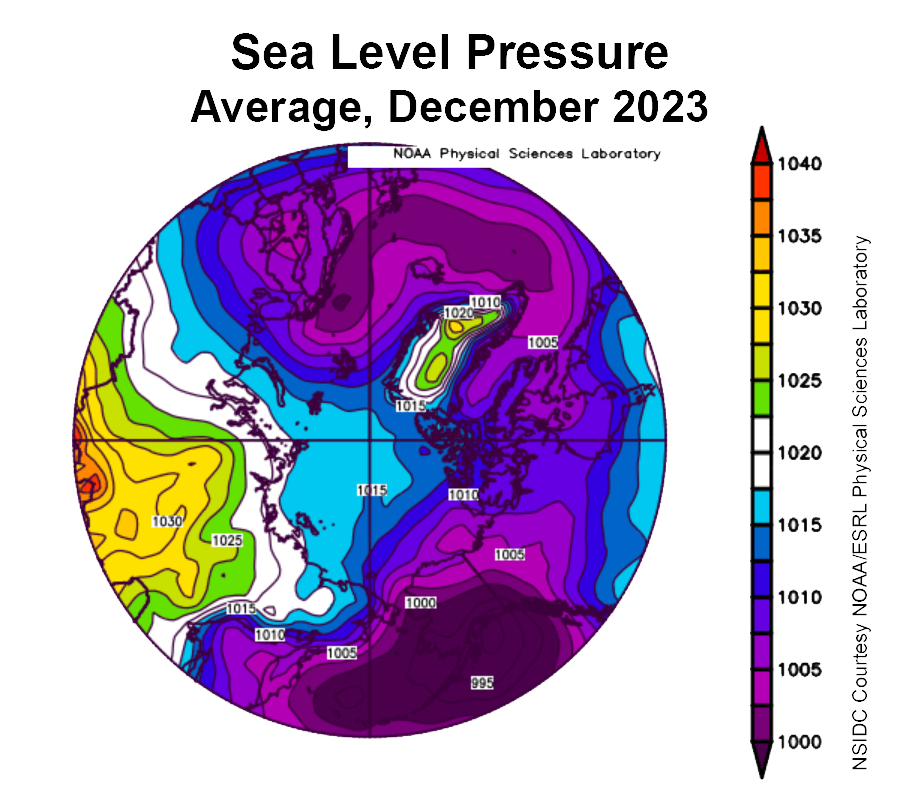
Figure 2b. This plot shows average sea level pressure in the Arctic in millibars for December 2023. Yellows and reds indicate above average air pressures; blues and purples indicate below average air pressures.
Credit: NSIDC courtesy NOAA Earth System Research Laboratory Physical Sciences Laboratory
High-resolution image
Warm conditions prevailed over the central Arctic Ocean and Beaufort Sea regions, as well as over Hudson Bay and much of northern Canada, with air temperatures at the 925 millibar level (around 2,500 feet above sea level) 8 to 9 degrees Celsius (14 to 16 degrees Fahrenheit) above the 1991 to 2020 average (Figure 2a). Elsewhere, relatively cool conditions prevailed, with air temperatures 2 to 4 degrees Celsius (4 to 7 degrees Fahrenheit) below average in southwestern Alaska, easternmost Russia, Scandinavia, and southeast Greenland. Cool conditions in the Bering and southern Chukchi Seas explain the rapid ice growth there. By contrast, the warm conditions over Hudson Bay, continuing since November, explain its delayed start of ice formation there.
The atmospheric circulation pattern for December was marked by low sea level pressure over the Gulf of Alaska and northern Europe and high sea level pressure over central Russia (Figure 2b). This pattern led to cold Arctic air flowing across the Chukchi Sea and into the Bering Sea as well as advection of relatively warm air across Canada into the Beaufort Sea.
December 2023 compared to previous years
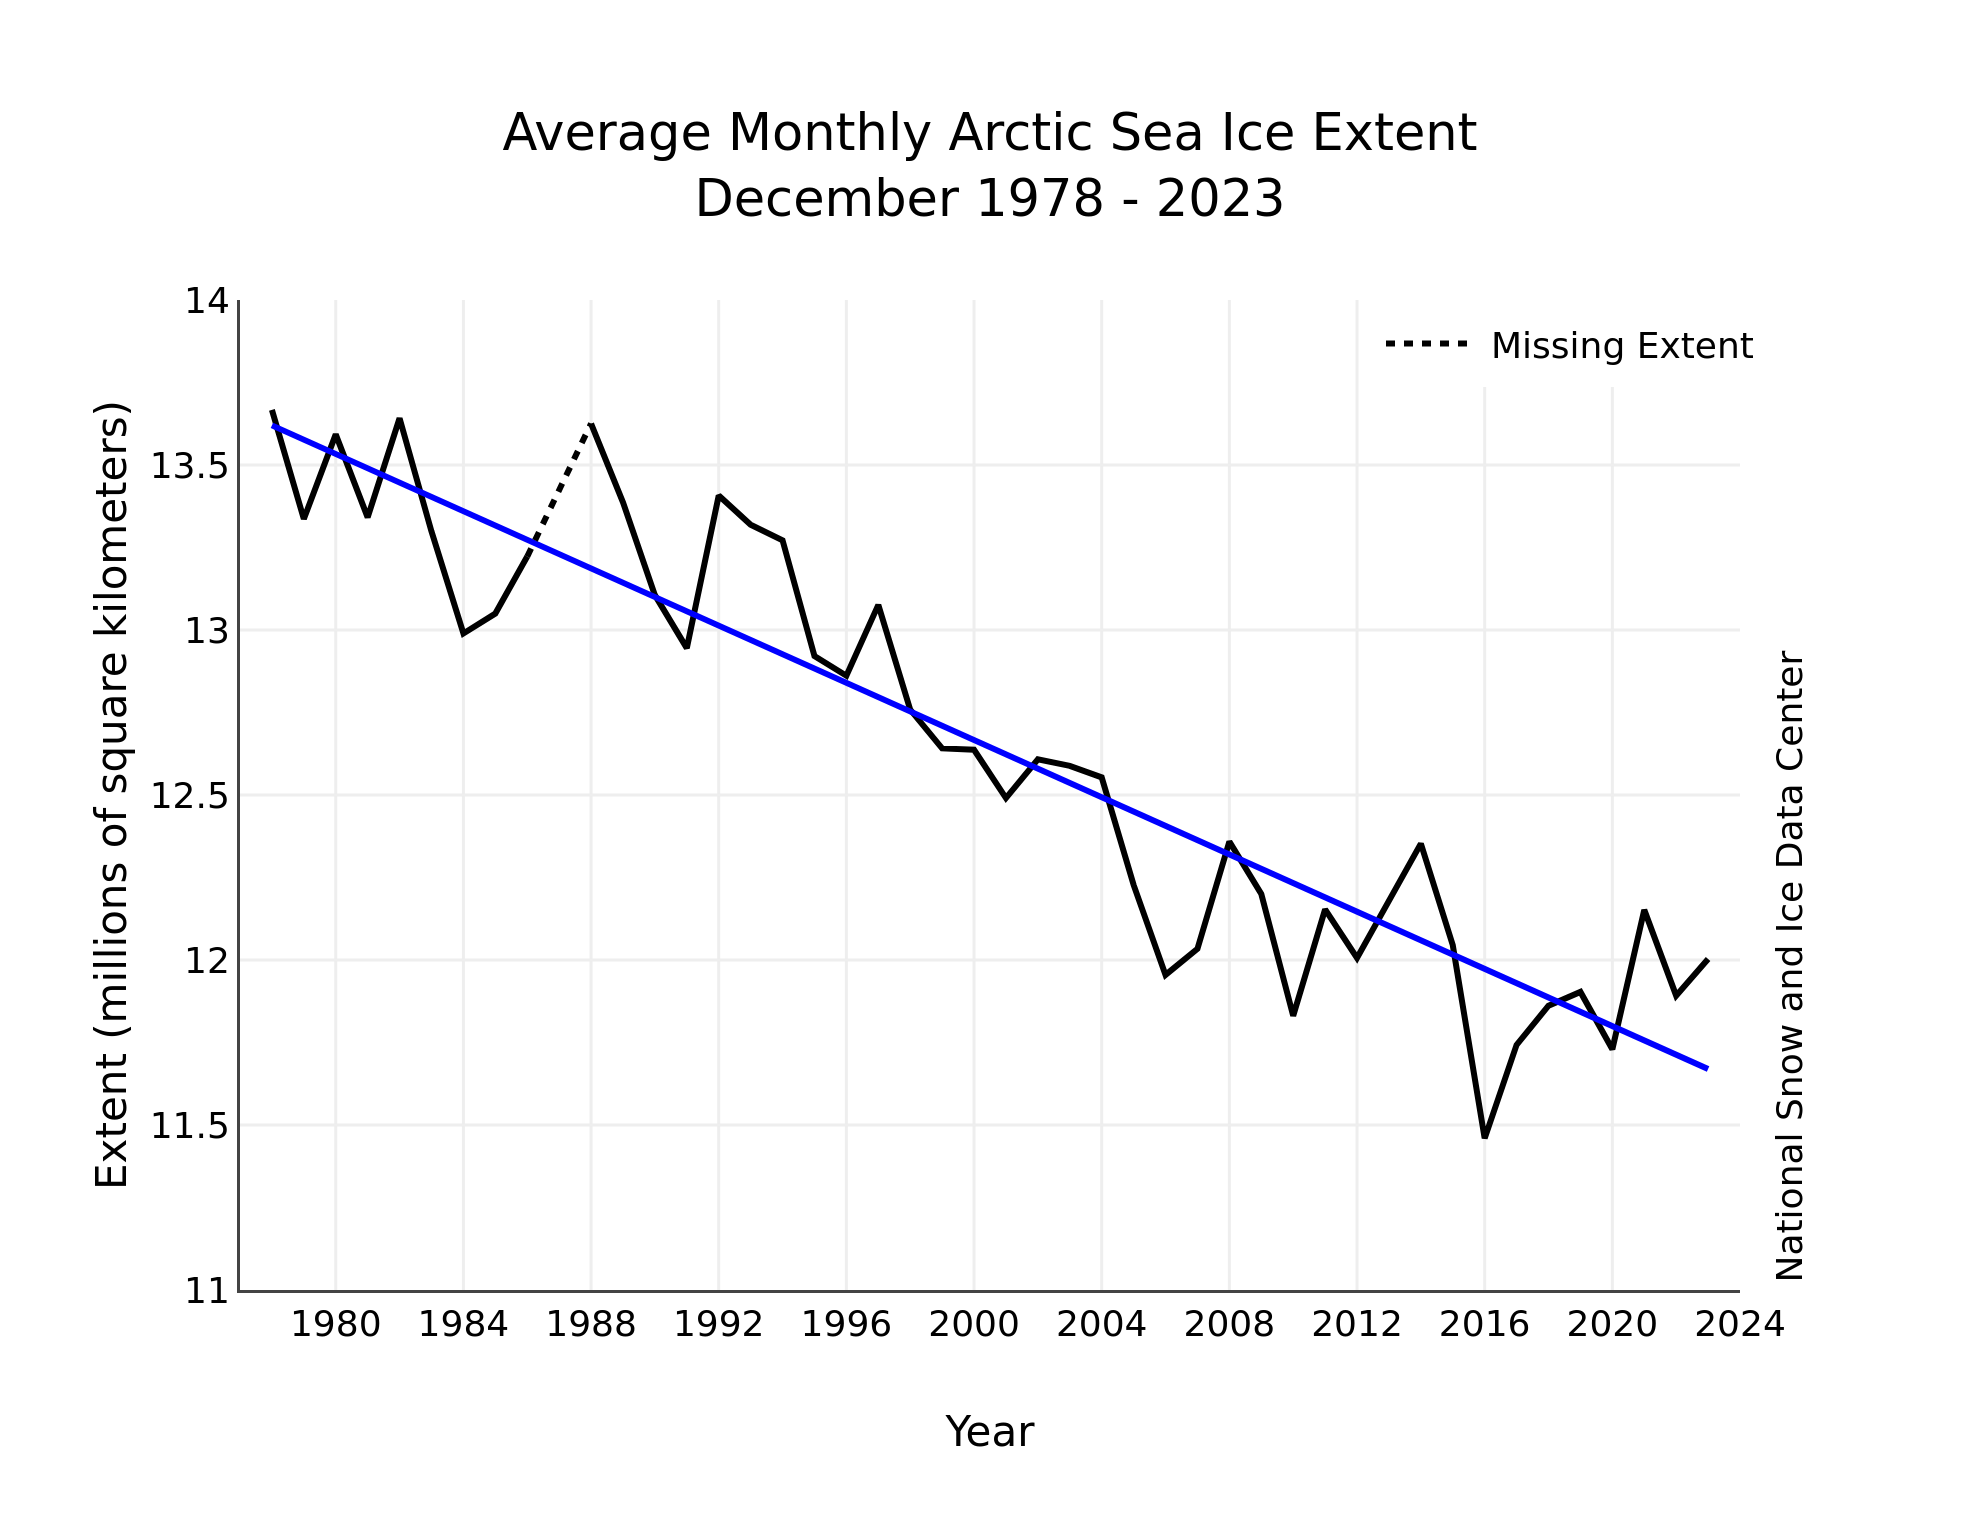
Figure 3. Monthly December ice extent for 1979 to 2023 shows a decline of 3.4 percent per decade.
Credit: National Snow and Ice Data Center
High-resolution image
The downward linear trend in Arctic sea ice extent for December over the 45-year satellite record is 43,400 square kilometers (16,800 square miles) per year, or 3.4 percent per decade relative to the 1981 to 2010 average (Figure 3). Based on the linear trend, December has lost 1.97 million square kilometers (761,000 million square miles) of ice since 1979. This is equivalent to three times the size of Texas.
Fast growth of ice cover over Hudson Bay
Figure 4. This animation shows the rapid expansion of sea ice cover in November to December 2023 for Hudson Bay (click to animate).
Credit: Zachary Labe, Princeton University
High-resolution image
As noted above, sea ice formation in Hudson Bay was unusually late, but the ice cover expanded quickly from west to east in mid-December. This is approximately 10 to 20 days later than usual, a result of warm water conditions over the bay extending into late fall. As of early January 2024, a small region of open water persisted near the Belcher Islands, roughly three weeks after freeze-up normally occurs.
Antarctic sea ice: slower decline
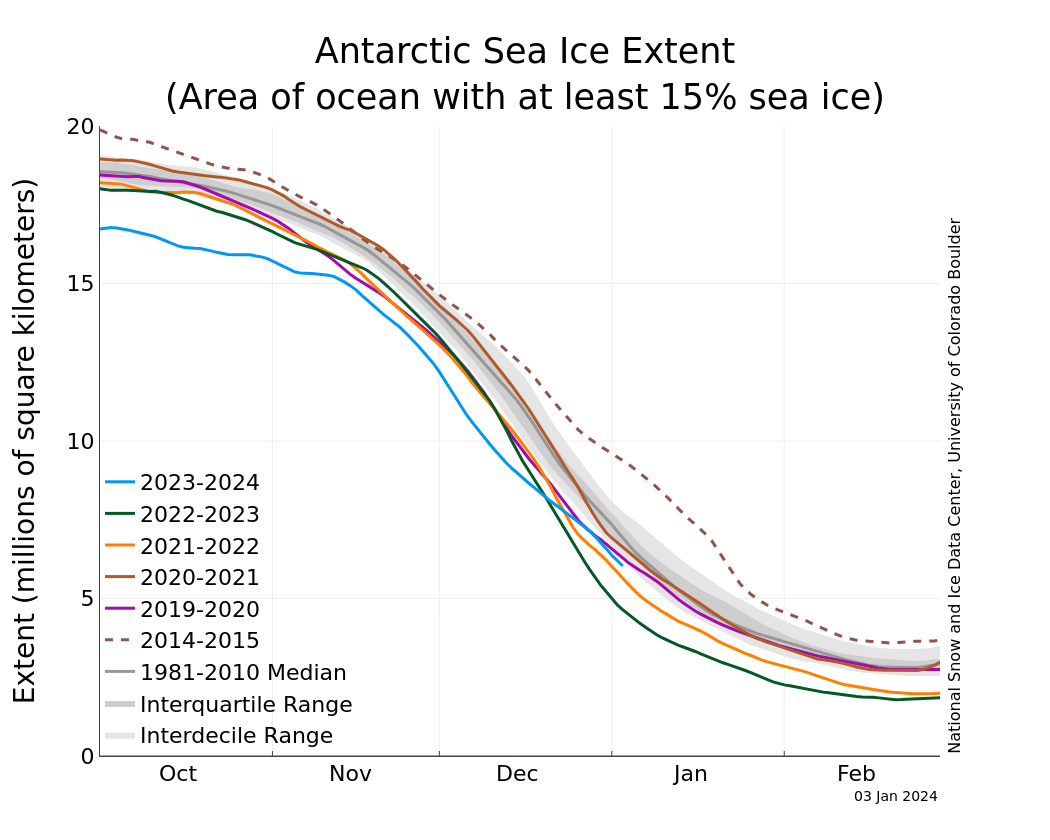
Figure 5a. The graph above shows Antarctic sea ice extent as of January 3, 2024, along with daily ice extent data for four previous years and the record high year. 2023 to 2024 is shown in blue, 2022 to 2023 in green, 2021 to 2022 in orange, 2020 to 2021 in brown, 2019 to 2020 in magenta, and 2014 in dashed brown. The 1981 to 2010 median is in dark gray. The gray areas around the median line show the interquartile and interdecile ranges of the data. Sea Ice Index data.
Credit: National Snow and Ice Data Center
High-resolution image
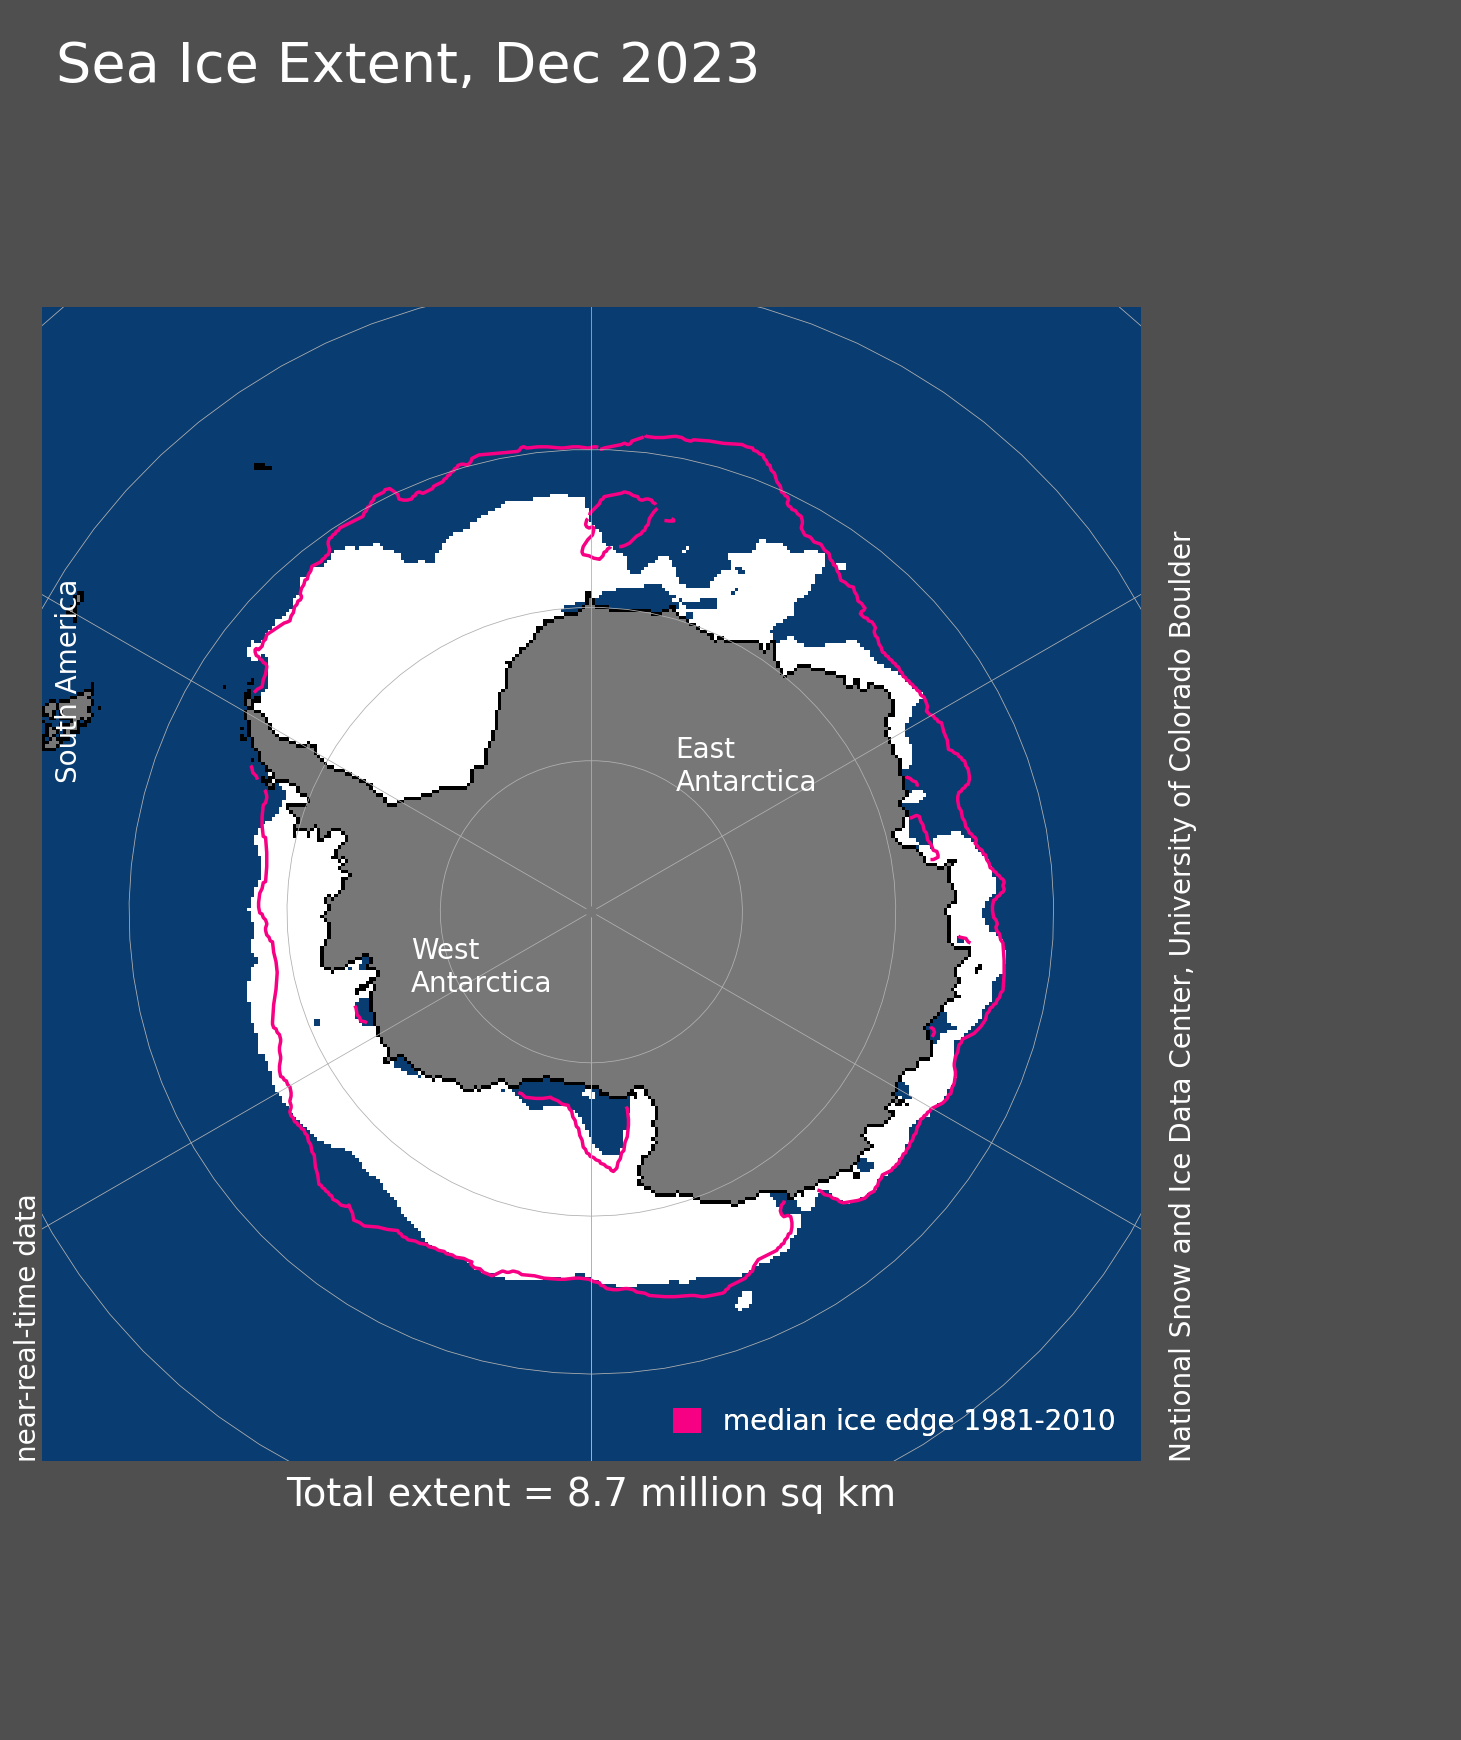
Figure 5b. Antarctic sea ice extent for December 2023 was 8.67 million square kilometers (3.35 million square miles). The magenta line shows the 1981 to 2010 average extent for that month. Sea Ice Index data. About the data
Credit: National Snow and Ice Data Center
High-resolution image
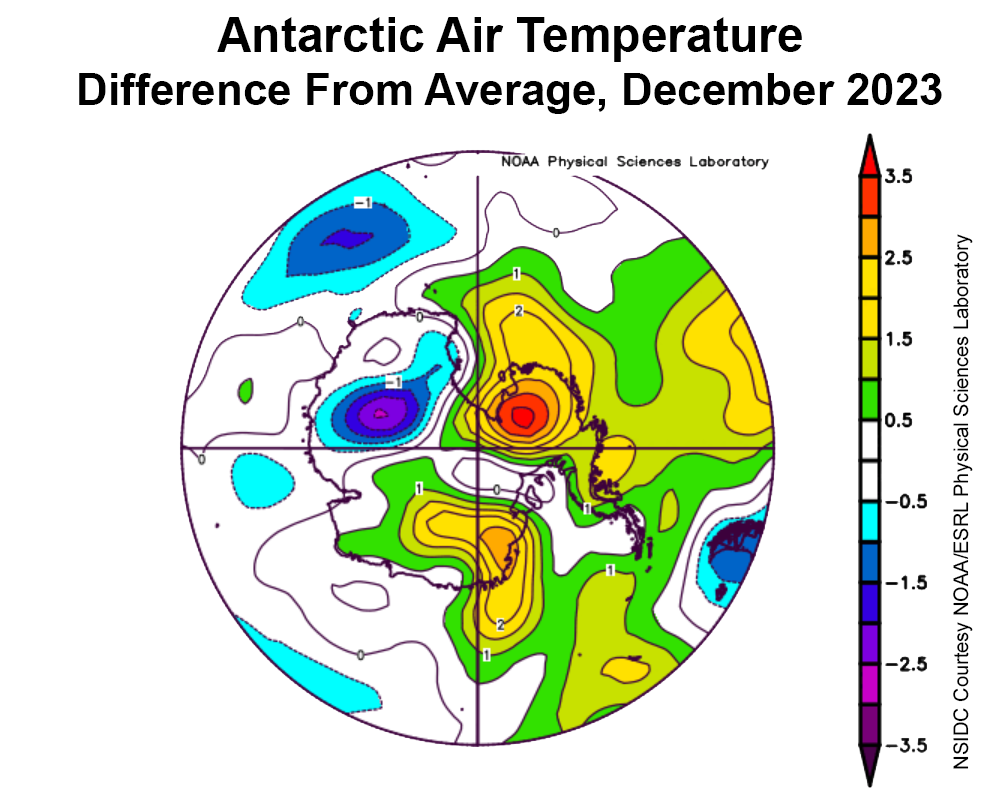
Figure 5c. This plot shows the departure from average air temperature in the Arctic at the 925 hPa level, in degrees Celsius, for December 2023. Yellows and reds indicate above average temperatures; blues and purples indicate below average temperatures.
Credit: NSIDC courtesy NOAA Earth System Research Laboratory Physical Sciences Laboratory
High-resolution image
At the beginning of December, ice extents were at record low levels. However, the seasonal decline in Antarctic ice extent subsequently slowed. As a result, by the beginning of the new year, extent was only sixth lowest (Figure 5a). Despite the slow ice loss, few areas of the Southern Ocean have above average sea ice extent, and extent is still well below the average for 1981 to 2010 in the Weddell Sea, along the coast of Dronning Maud Land, and in the western Ross Sea (Figure 5b). Typical for this time of year, a large polynya has opened up in front of the Ross and Sulzberger Ice Shelves. Low sea ice concentrations in the Ross Sea and western Amundsen Sea portend upcoming ice extent declines in these areas. Air temperatures were above average over West Antarctica and the Ross Sea by 1 to 3 degrees Celsius (2 to 5 degrees Fahrenheit) for the month, and over the Bellingshausen Sea by 1 to 2 degrees Celsius (2 to 4 degrees Celsius) (Figure 5c). Dronning Maud Land was above average by up to 2.5 degrees Celsius (4.5 degrees Fahrenheit). Below average conditions prevailed over Wilkes Land, at 1 to 2 degrees Celsius (2 to 4 degrees Fahrenheit) below the 1991 to 2020 reference period.
Looking back at 2023
The extremely low Antarctic sea ice extent for most of the year was the most noteworthy characteristic of either polar region for 2023. At one point in mid-August, southern hemisphere sea ice was more than 1.80 million square kilometers (695,000 square miles) below the previous record low years (2022, 2002, or 1986 depending on the day of year), and more than 2.6 million square kilometers (1.00 million square miles) below the 1981 to 2010 average extent. The difference between 2023 daily extent and the 1981 to 2010 average was greater than 1 million square kilometers (386,000 square kilometers) for nearly the entire year. Several studies have argued that low sea ice extents in recent years for the Southern Ocean represent a response to unusually high temperatures in the upper ocean layer.
In the Arctic, sea ice extent followed a pattern typical of the past decade, with persistently below-average extent in the northernmost Atlantic (Barents and Norwegian Seas) and large summer retreat along the eastern Siberian coast. However, the pace of sea ice decline (e.g. summer minimums or monthly average extents) has slowed since 2012, and the 2012 record low summer minimum has not been surpassed. While explanations have been offered to account for this “hiatus,” notably involving variations on ocean heat transport to the Arctic Ocean, questions remain.
Further reading
Polyakov, I. V., et al. 2023. Fluctuating Atlantic inflows modulate Arctic atlantification. Science. doi: 10.1126/science.adh51

