Both Arctic and Antarctic sea ice appear to be heading toward their respective seasonal limits, reaching the lowest extent at the end of summer in the north, and the highest extent as winter ends in the south. In the Antarctic, high variability typically characterizes the period around the maximum, but at present the sea ice extent is more than 1 million square kilometers (386,000 square miles) below the previous record low maximum set in 1986.
Overview of conditions
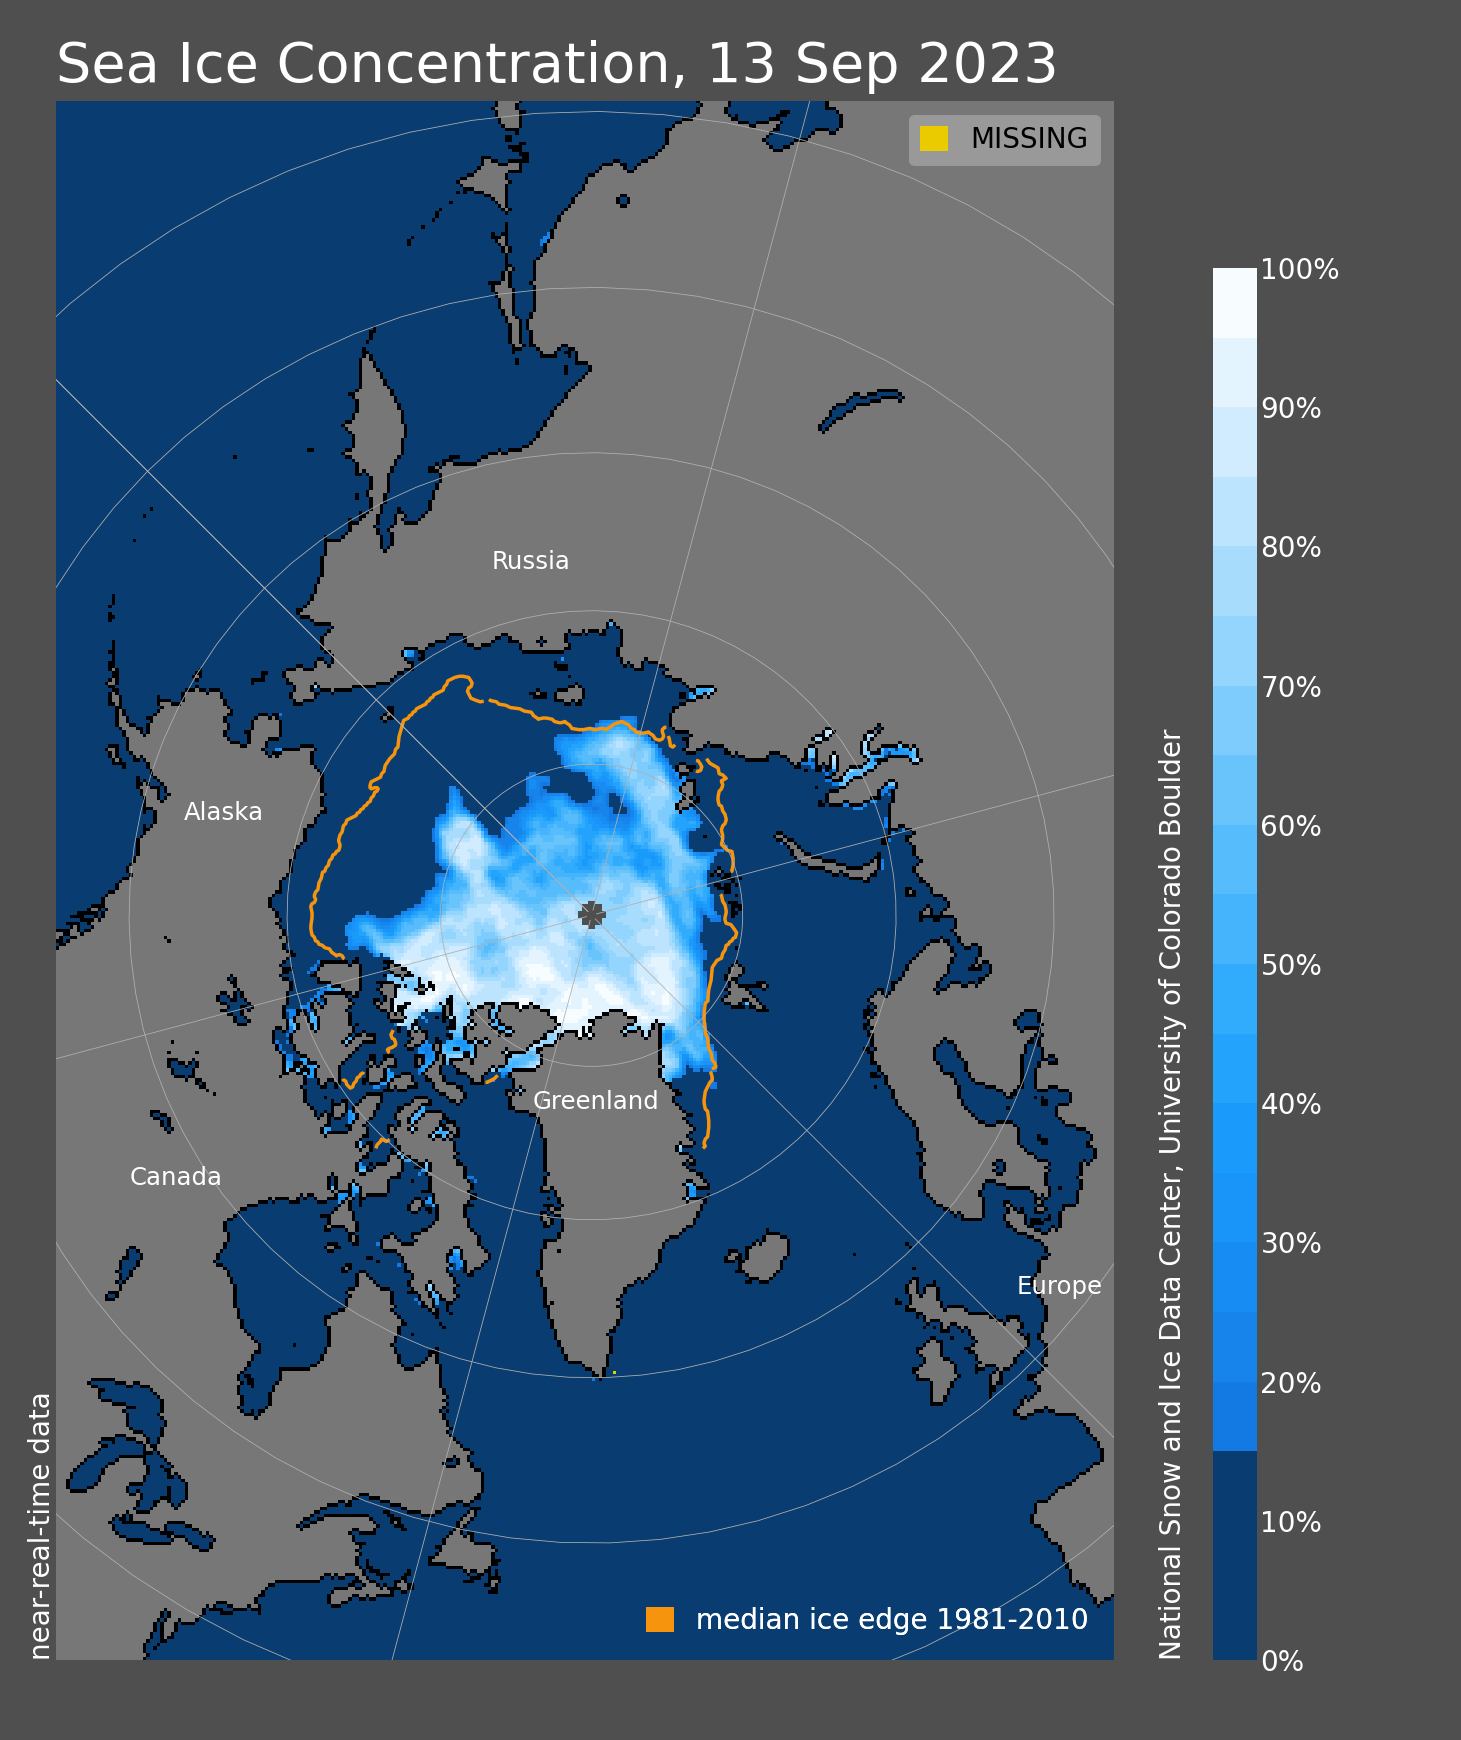
Figure 1a. This figure shows Arctic sea ice concentration for September 13. The orange line shows the 1981 to 2010 average extent for that day. Sea Ice Index data. About the data
Credit: National Snow and Ice Data Center
High-resolution image
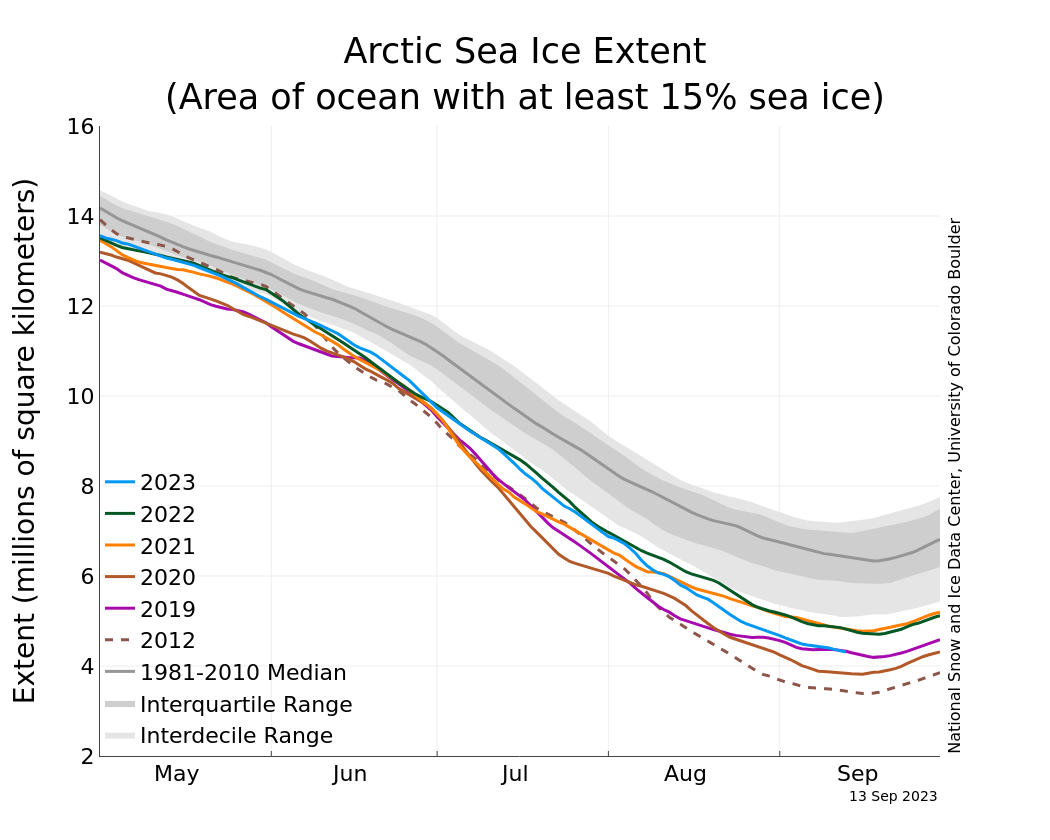
Figure 1b. The graph above shows Arctic sea ice extent as of September 13, 2023, along with daily ice extent data for four previous years and the record low year. 2023 is shown in blue, 2022 in green, 2021 in orange, 2020 in brown, 2019 in magenta, and 2012 in dashed brown. The 1981 to 2010 median is in dark gray. The gray areas around the median line show the interquartile and interdecile ranges of the data. Sea Ice Index data.
Credit: National Snow and Ice Data Center
High-resolution image
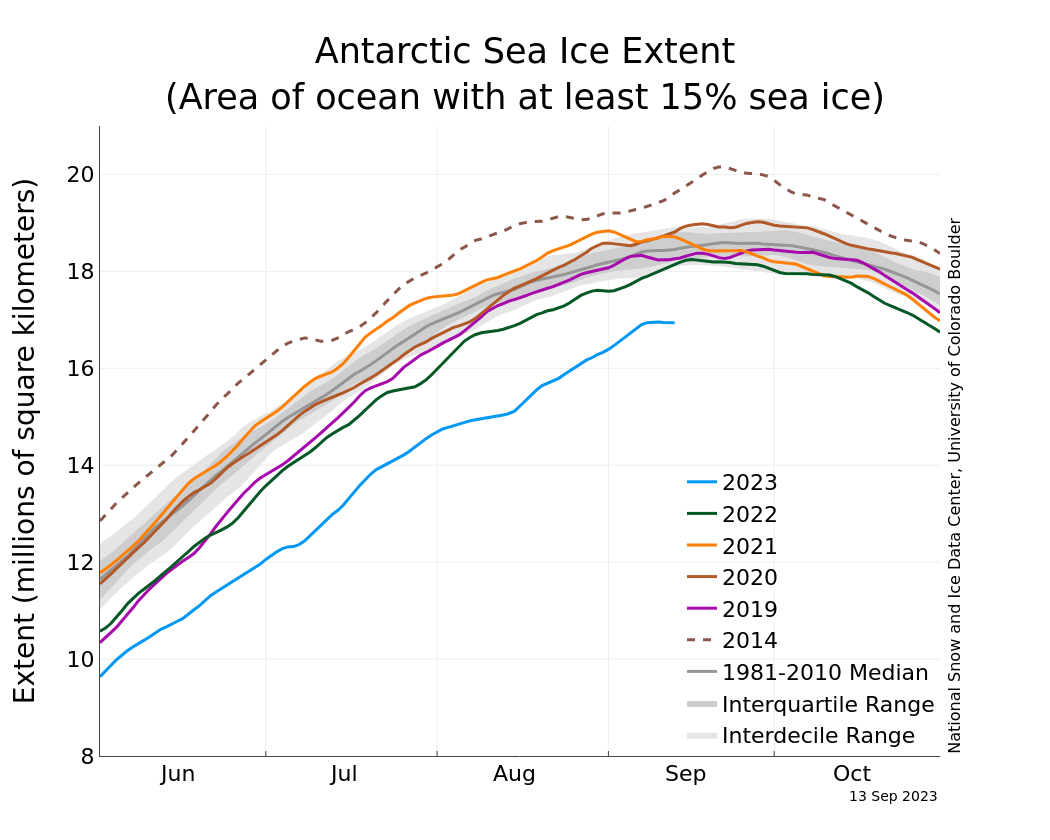
Figure 1c. The graph above shows Antarctic sea ice extent as of September 13, 2023, along with daily ice extent data for four previous years and the record high year. 2023 is shown in blue, 2022 in green, 2021 in orange, 2020 in brown, 2019 in magenta, and 2014 in dashed brown. The 1981 to 2010 median is in dark gray. The gray areas around the median line show the interquartile and interdecile ranges of the data. Sea Ice Index data.
Credit: National Snow and Ice Data Center
High-resolution image
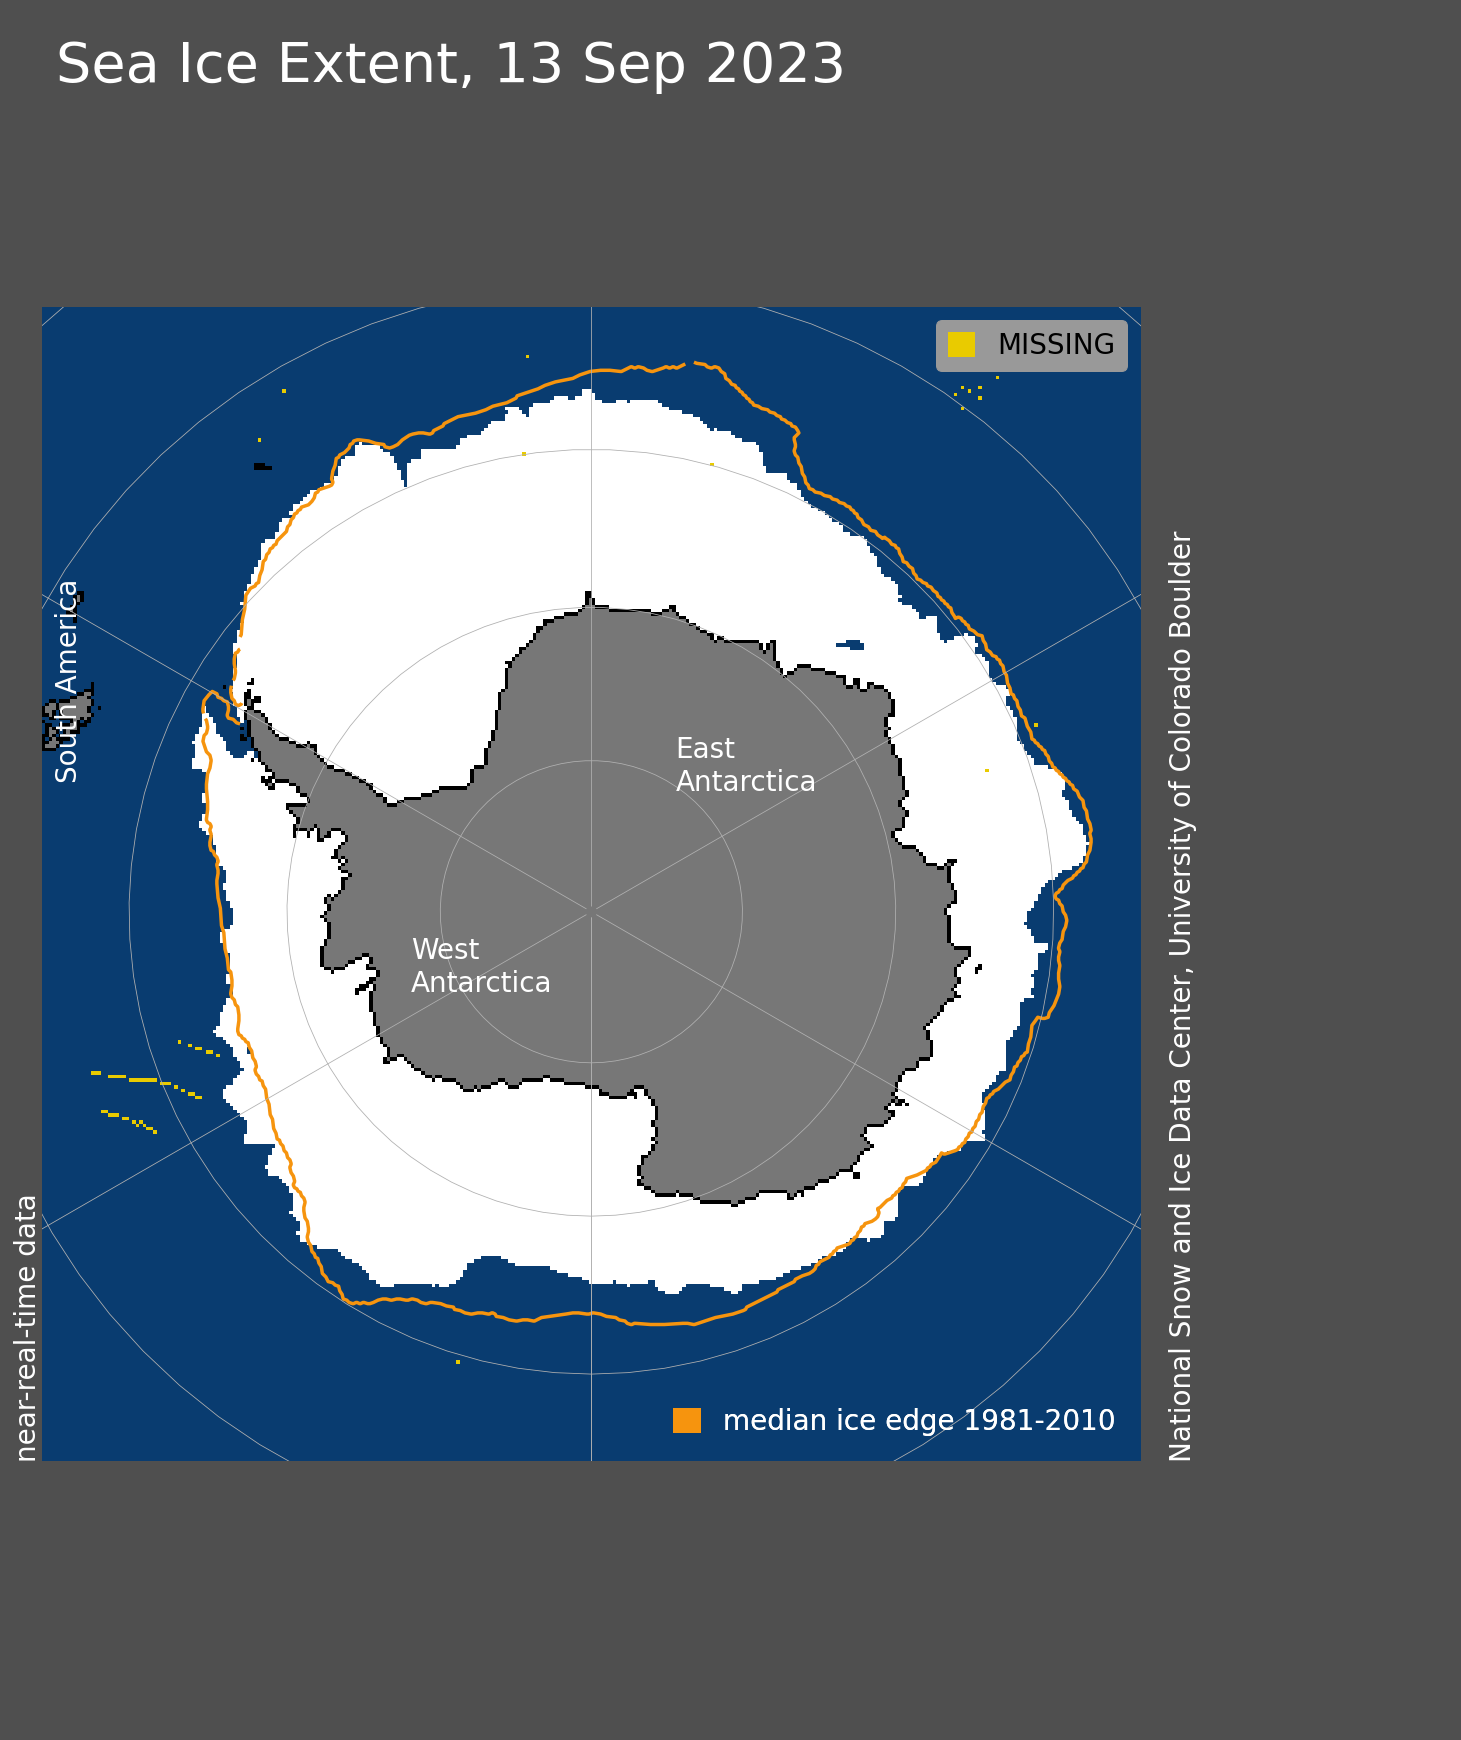
Figure 1d. Antarctic sea ice extent for September 13, 2023 was 16.94 million square kilometers (6.54 million square miles). The orange line shows the 1981 to 2010 average extent for that day. Sea Ice Index data. About the data
Credit: National Snow and Ice Data Center
High-resolution image
Retreat of Arctic sea ice cover has been primarily in the central Arctic region north of the Laptev and East Siberian Seas in an area of low sea ice concentration (Figure 1a). A few large areas of open water are present between several areas of higher-concentration sea ice. On the Pacific side, the Beaufort and Chukchi Seas have very little sea ice remaining; on the Atlantic side, both the Svalbard archipelago and Franz Josef Land are largely ice free (Figure 1a). Both passages of the Northwest Passage are largely clear of ice at the resolution of passive microwave satellite data, but likely have patchy ice remaining. Ice blocks the western end of the Parry Channel near M’Clure Strait, but the ice edge has pulled away from the coast in recent days and it appears that there is a narrow ice-free region along the northwest coast of Banks Island.
Antarctic sea ice grew at a much faster-than-average pace through the first eight days of September, increasing at 65,000 square kilometers (25,000 square miles) per day relative to the 1981 to 2010 average rate of 25,000 square kilometers (9,700 square miles) per day (Figure 1c). Much of this expansion occurred in the northeastern Ross Sea and along the Weddell Sea ice front (Figure 1d). However, growth slowed after September 8. If no further net growth occurs, the sea ice maximum will be below 17 million square kilometers (6.56 million square miles) for the first time in the satellite record, and about one million square kilometers (386,000 square miles) below the previous record low maximum of 1986. The five low maximum sea ice extents for Antarctica include 1986, 2002, 2017, 1989, and 2022. High variability is typical of the sea ice maximum period, and further growth is likely from storms or high winds along the vast circumpolar sea ice edge.
Conditions in context
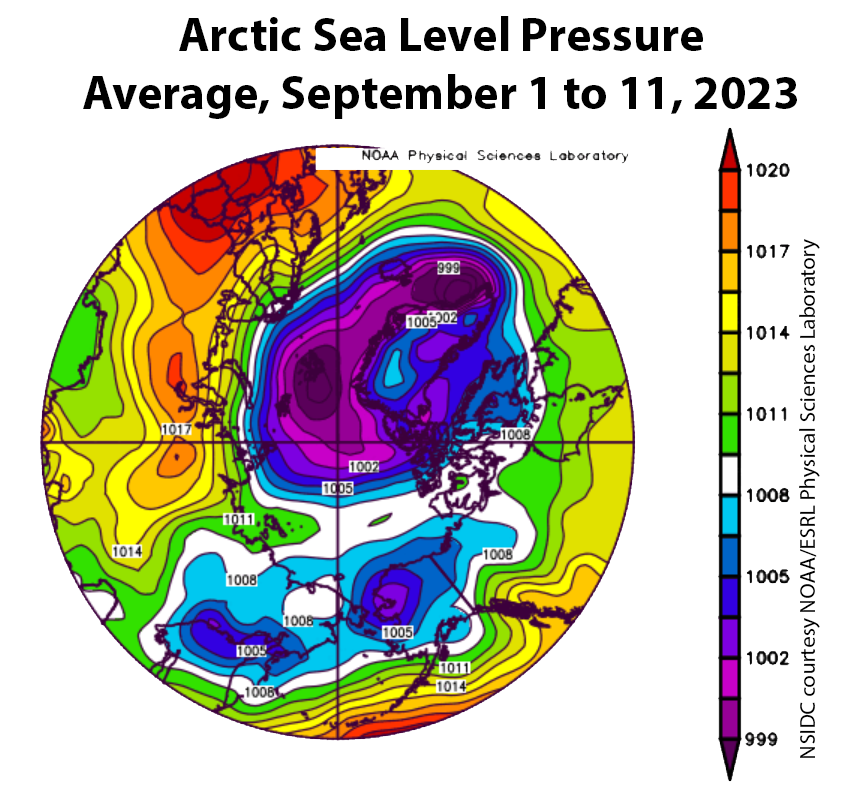
Figure 2a. This plot shows average sea level pressure in the Arctic in millibars for September 1 to 11, 2023. Yellows and reds indicate above average air pressure; blues and purples indicate below average pressure.
Credit: NSIDC courtesy NOAA Earth System Research Laboratory Physical Sciences Laboratory
High-resolution image
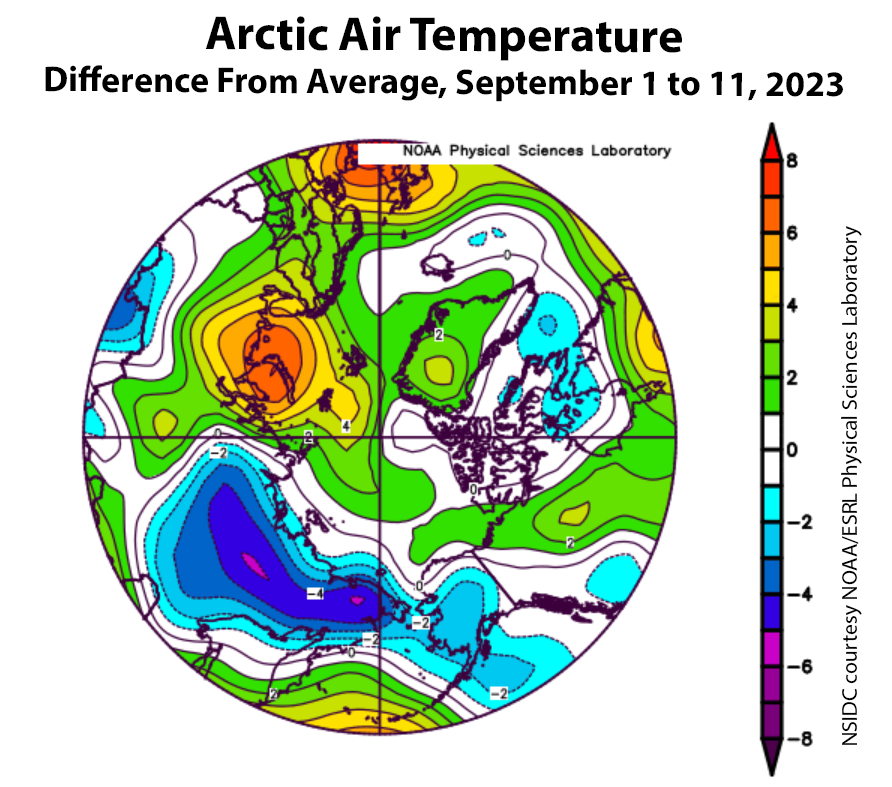
Figure 2b. This plot shows the departure from average air temperature in the Arctic at the 925 hPa level, in degrees Celsius, for September 1 to 11, 2023. Yellows and reds indicate higher than average temperatures; blues and purples indicate lower than average temperatures.
Credit: NSIDC courtesy NOAA Earth System Research Laboratory Physical Sciences Laboratory
High-resolution image
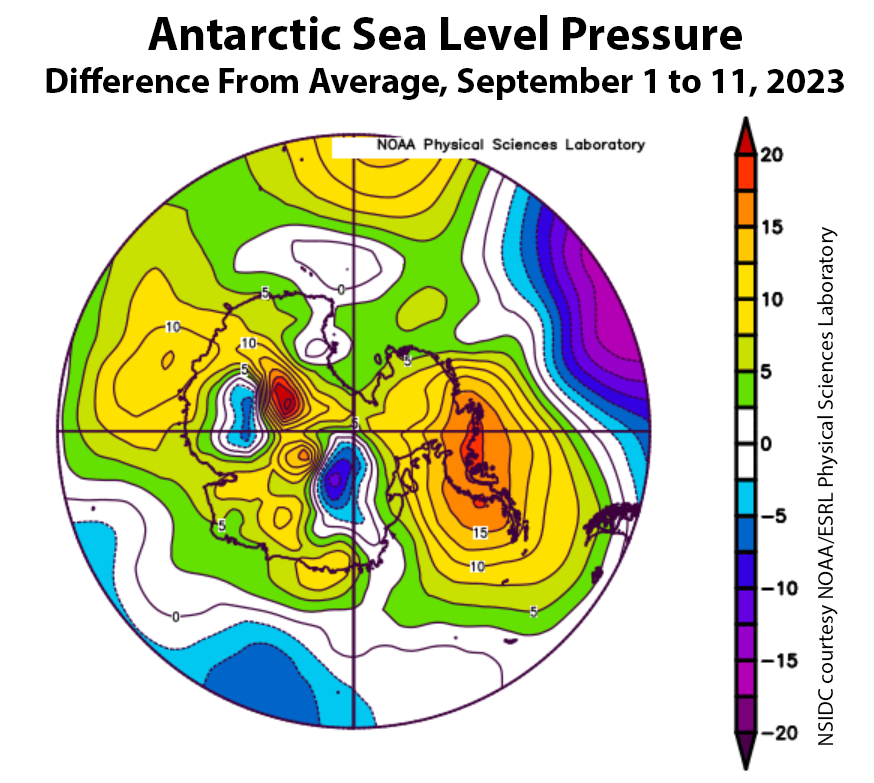
Figure 2c. This plot shows the departure from average sea level pressure in the Antarctic in millibars for September 1 to 11, 2023. Yellows and reds indicate high air pressure; blues and purples indicate low pressure.
Credit: NSIDC courtesy NOAA Earth System Research Laboratory Physical Sciences Laboratory
High-resolution image
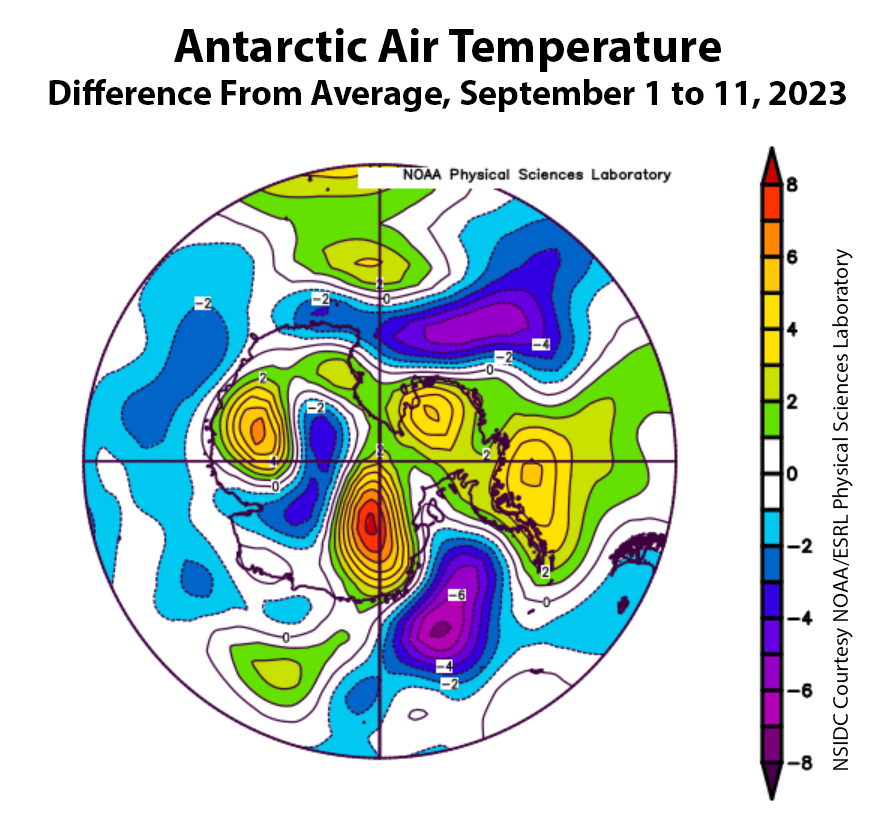
Figure 2d. This plot shows the departure from average air temperature in the Antarctic at the 925 hPa level, in degrees Celsius, for September 1 to 11, 2023. Yellows and reds indicate higher than average temperatures; blues and purples indicate lower than average temperatures.
Credit: NSIDC courtesy NOAA Earth System Research Laboratory Physical Sciences Laboratory
High-resolution image
For the first two weeks of September, high air pressure prevailed over northern Siberia, with low pressure over Greenland, which created significant winds along the Eurasian coast (Figure 2a). Air temperatures were generally above average in Western Europe and Scandinavia, and below average in eastern Siberia (Figure 2b). The outlook for a few more days is for continued warm conditions and airflow that may cause further contraction of the low-concentration sea ice.
In Antarctica, a strong high-pressure area over the Peninsula region with counterclockwise airflow helped push sea ice outward along the northwestern Weddell Sea, where the air temperature was quite low (Figure 2c). Low air pressure and below average temperatures in the central and western Ross Sea helped push sea ice outward in the eastern Ross Sea (Figure 2d). Storms will very likely cause the sea ice edge to fluctuate.

