Stepping through the HDFView User Guide with GLAS HDF5 Data
HDFView
https://support.hdfgroup.org/products/java/hdfview/
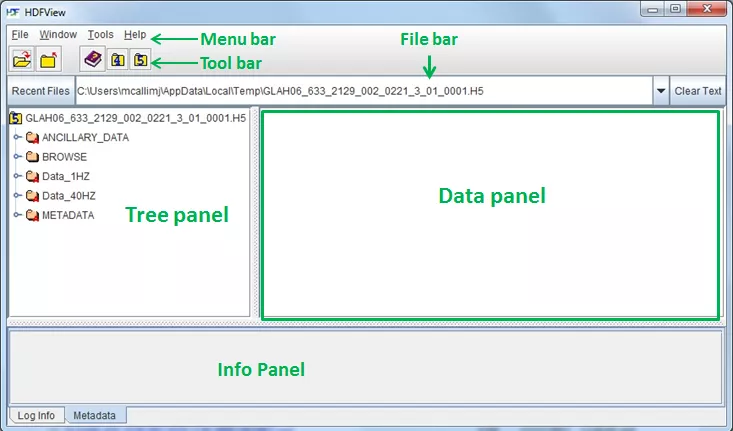
When you first open HDFView, the HDFView window appears with an empty tree and data panel.
The main window consists of six different components: Menu bar, Tool bar, File bar, Tree panel, Data Panel, Info panel. For further description of these items see the HDFView User's Guide.
Open a file
Select the "Open" command from file menu or click the "Open" icon in the tool bar to invoke the local file manager, and select a file to open from the local file manager. Selecting "Open Read-Only" opens a file with read-only permission, which means that editing functions are disabled , and changes are not allowed.
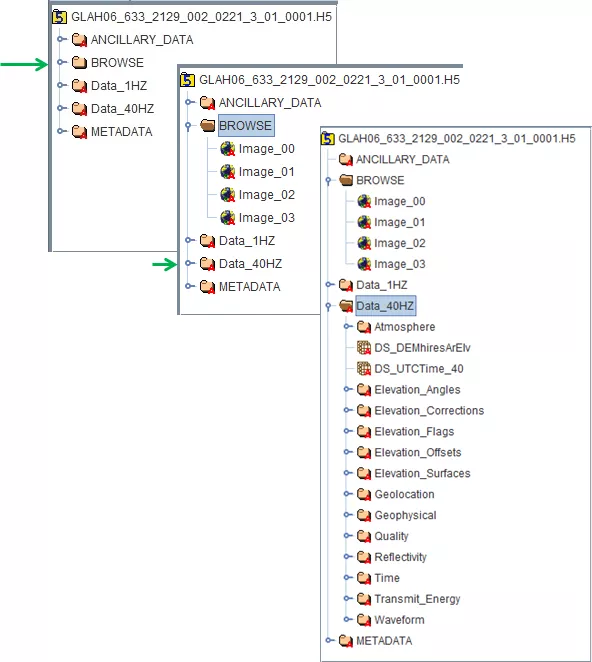
Example tree view of file hierarchy for GLAH06 data
After you open an HDF file, the structure of the file is displayed in the Tree panel. The content of a data object is displayed in the Data panel by opening the data object. To view a 'group', click on the circle to the left of the folder.
--- HDF5 file
--- Collapsed group folder
--- Expanded group folder
--- HDF5 scalar dataset
--- HDF5 image
--- HDF5 compound dataset
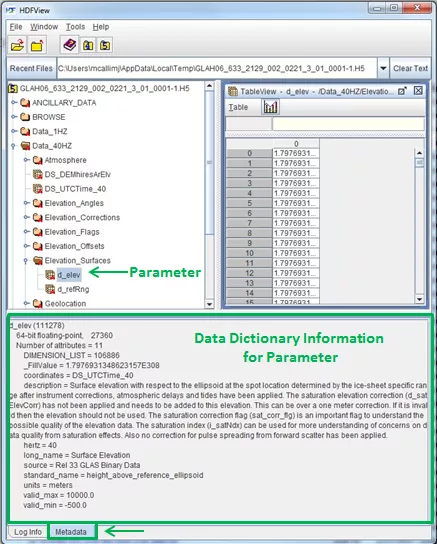
Example of Info panel > Metadata tab contents
The Metadata tab in the Info panel will contain the Data Dictionary information for the highlighted parameter.
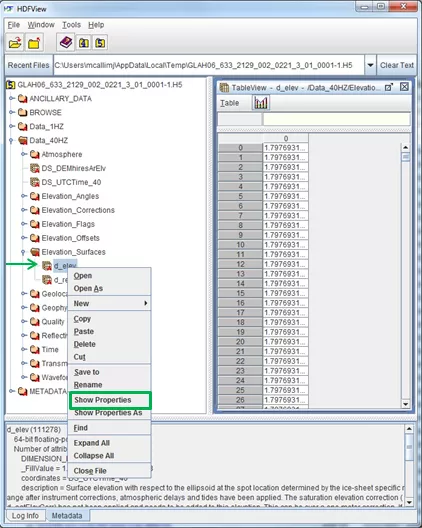
View metadata of an HDF5 object
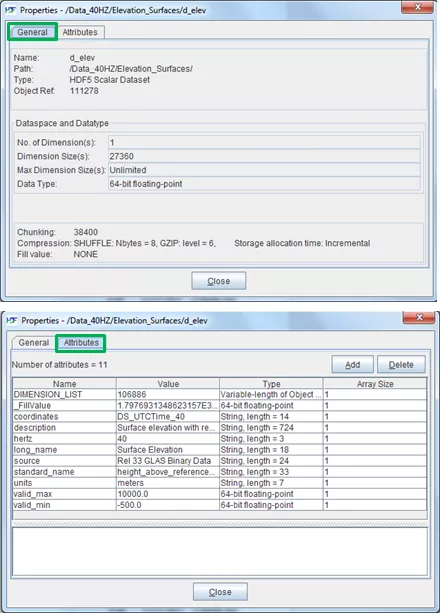
To view the metadata of a data object, Right click on the object and then select 'Show Properties'. A window will open and display metadata information such as name, type, attributes, data type, and data space.
GLAS data, in this case GLA06, contains the following groups
- Ancillary Data:
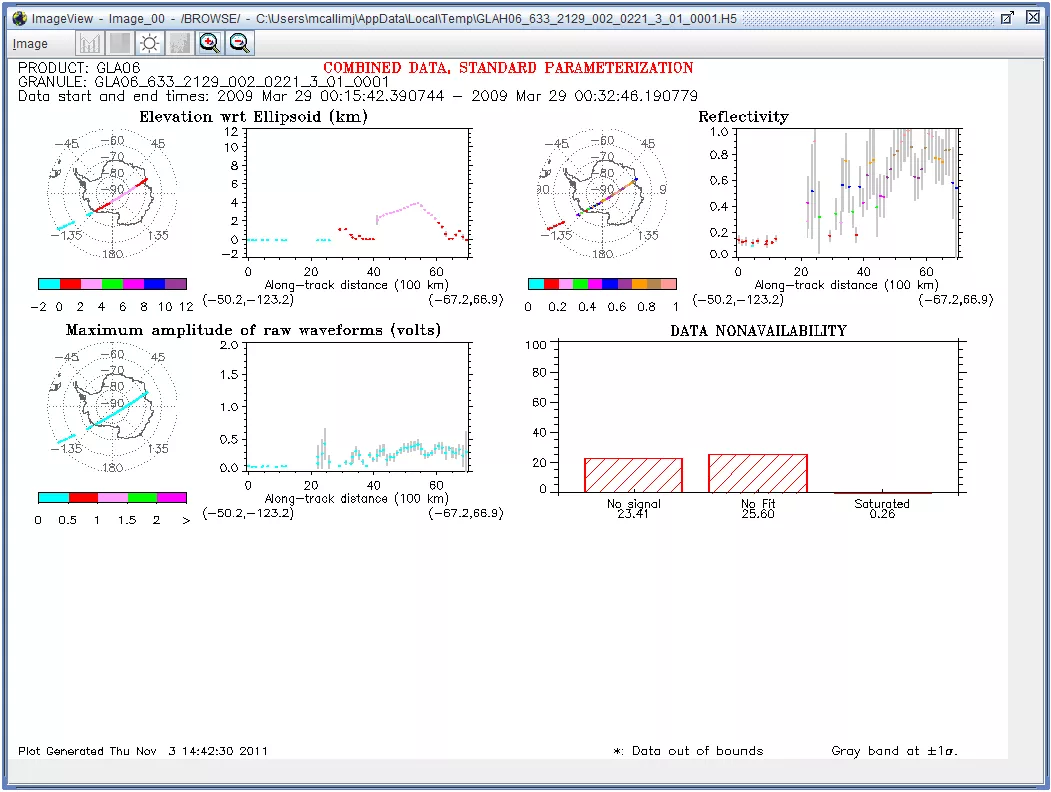
- Browse: This group contains image plots of key parameters and statistics that can quickly be viewed to determine the general quality of the data. An example browse image is shown below.
- Data_1HZ: This group contains data with a rate of 1HZ. 1Hz data may be indexed to the 40HZ data using the i_rec_ndx parameter in each respective time group. See the GLAH06 Data Dictionary for a description of the attributes.
- Data_40HZ: This group contains data with a rate of 40HZ. 40Hz data may be indexed to the 1HZ data using the i_rec_ndx parameter in each respective time group. See the GLAH06 Data Dictionary for a description of the attributes.
- Metadata: This group contains structured, computer-parseable ECHO-style collection and inventory-level metadata. See the GLAH06 Data Dictionary for a description of the metadata.
View data content
You can open a data object in the tree by a double-mouse-click or selecting the "Open" command from the menu bar or the popup menu. By default, data content is displayed as an image, a table or text based on its datatype.
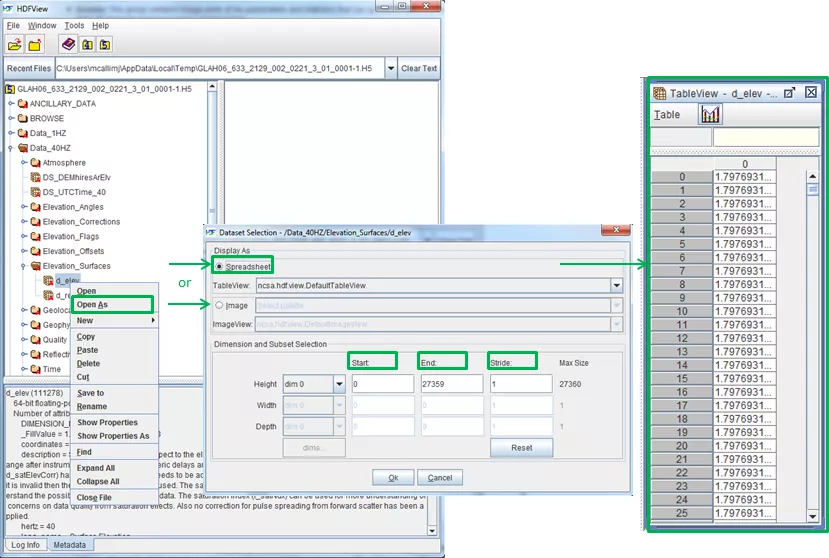
HDFView displays numerical datasets in a “spreadsheet”, which shows the data values in a grid. A one-dimensional dataset is displayed as a single column and a number of rows of dimension size. A two-dimensional dataset is displayed as a number of columns of the first dimension size and a number of rows of the second dimension size, i.e. dim[0]=height and dim[1]=width by default. You can change the order of the dimensions using the “Open As” command.
Using "Open As", you can select a subset of the dataset to display or change the default display options. For example, you can display the data values of an image in a spreadsheet.
The "Start" field(s) determines the starting coordinate of the selected area.
The "End" field(s) determines the ending coordinate of the selected area.
The "Stride" field(s) chooses array locations from the dataspace with each value in the stride array determining how many elements to move in each dimension. Setting a value in the stride array to 1 moves to each element in that dimension of the dataspace; setting a value of 2 in the stride array moves to every other element in that dimension of the dataspace. In other words, the stride determines the number of elements to move from the start location in each dimension. Stride values of 0 are not allowed. If the stride parameter is NULL, a contiguous hyperslab is selected (as if each value in the stride array was set to all 1's).
Subset and dimension selection
Opening an entire large dataset may cause an ‘Out Of Memory Error’ because the Java Virtual Machine cannot create the required objects. HDFView provides options to select a subset of a dataset for display. You can also select dimensions and the order of dimensions to display, e.g., to switch the columns and rows. To make a selection, select a dataset from the tree and choose the “Open As” command from the Object menu or the popup menu. The selection dialog box appears. You can make a selection by dragging the mouse on the preview image or entering the values of start, end, and stride. For more information on displaying a subset see the HDFView User Guide Section 5.2 Subset and Dimension Selection
Export data
Writing table data into an ASCII file is nearly transparent. Select "Export data to Text File" from the "Table" menu, and the Save Current Data to Text File dialog box pops up for you to enter the name of the file. The data values of the current table will be written to the file. The data values are separated by the data delimiter specified by the user options. The text file does not contain any datatype and dataspace information..
Last Updated April 2020
