Read and plot SMAP/Sentinel-1 data with Matlab
This articles provides an example MATLAB snippet to read and plot SMAP/Sentinel-1 L2 Radiometer/Radar 30-Second Scene 3 km EASE-Grid Soil Moisture HDF5 soil moisture and brightness temperature data, as well as the related surface and quality flags. These flags are useful for determining the overall quality and surface conditions present when the data were collected by the satellite.
%Comment Assign filename to the local variable
>>L2_SM_SP_fname = 'SMAP_L2_SM_SP_1BIWDV_20170908T132624_20170909T003903_102W47N_D17000_001.h5';
%Read 3 km row number could be used for geo-registration
>>Ezr3km = h5read(L2_SM_SP_fname, '/Soil_Moisture_Retrieval_Data_3km/EASE_row_index_3km');
>>Ezr1km = Ezr1km';
>>Ezr1km(Ezr1km == -9999) = NaN;
>>Ezr1km = double(Ezr1km);
%Read 3 km column number could be used for geo-registration
>>Ezc1km = h5read(L2_SM_SP_fname, '/Soil_Moisture_Retrieval_Data_1km/EASE_column_index_1km');
>>Ezc1km = Ezc1km';
>>Ezc1km(Ezc1km == -9999) = NaN;
>>Ezc1km = double(Ezc1km);
%Read latitude data at 3 km for grid cell center, could be used for geo-registration
>>lat3km = h5read(L2_SM_SP_fname, '/Soil_Moisture_Retrieval_Data_3km/latitude_3km');
>>lat3km = lat3km';
>>lat3km(lat3km == -9999) = NaN;
>>lat3km = double(lat3km);
%Read longitude data at 3 km for grid cell center, could be used for geo-registration
>>lon3km = h5read(L2_SM_SP_fname, '/Soil_Moisture_Retrieval_Data_3km/longitude_3km');
>>lon3km = lon3km';
>>lon3km(lon3km == -9999) = NaN;
>>lon3km = double(lon3km);
%Read disaggregated brightness temperature at 3 km
>>TB3km = h5read(L2_SM_SP_fname, '/Soil_Moisture_Retrieval_Data_3km/tb_v_disaggregated_3km');
>>TB3km = TB3km';
>>TB3km(TB1km == -9999) = NaN;
%Read soil moisture retrievals at 3 km
>>SM3km = h5read(L2_SM_SP_fname, '/Soil_Moisture_Retrieval_Data_3km/soil_moisture_3km');
>>SM3km = SM3km';
>>SM3km(SM3km == -9999) = NaN;
%Read soil moisture retrievals at 3 km
>>SF3km = h5read(L2_SM_SP_fname, '/Soil_Moisture_Retrieval_Data_3km/surface_flag_3km');
>>SF3km = SF3km';
>>SF3km(SF3km == -9999) = NaN;
%Read soil moisture retrievals quality flag at 3 km
>>RF3km = h5read(L2_SM_SP_fname, '/Soil_Moisture_Retrieval_Data_3km/retrieval_qual_flag_3km');
>>RF3km = RF3km';
>>RF3km(RF3km == -9999) = NaN;
%Read disaggregated TB quality flag at 3 km
>>TBQF3km = h5read(L2_SM_SP_fname, '/Soil_Moisture_Retrieval_Data_3km/disaggregated_tb_v_qual_flag_3km');
>>TBQF3km = TBQF3km';
>>TBQF3km(TBQF3km == -9999) = NaN;
%Plot Soil Moisture data
>>imagesc(SM3km)
>>caxis([0 0.3])
>>colorbar
>>axis off
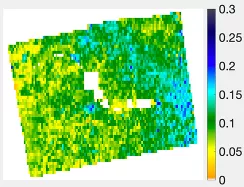
Soil Moisture map at 3 km [m3/m3]
%%%%%%%%%%%%%%%%%%%%%%%%%%%%%%%%%%%%%%%%%%%%%%%%%%%%%%%%%%%
%Plot Surface Flag
>>imagesc(SF3km)
>>colorbar
>>axis off
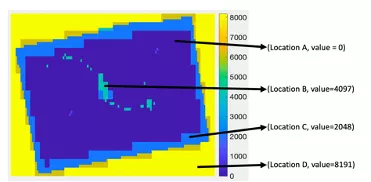
For example, the surface flag from the above plot at 3 km resolution can range from 0 to 8191. The value of 0 means (such as Location A) all the bits are cleared. A value of 8191 (yellow color, Location D) is when all the bit are raised and it is outside the granule. The blue color bit value on the edge of the granule is 2048 (Location C). To unpack the integer into bits in Matlab:
>> de2bi(2048)
ans =
0 0 0 0 0 0 0 0 0 0 0 1 0
Bit pos. 0 1 2 3 4 5 6 7 8 9 10 11 12
It is clear from above for the ans variable, the 11th bit position is raised to 1 i.e., the edge flag according to Table 2. So, the value of 2048 is unique and is only possible when the edge flag bit is raised.
Similarly, in location B, the value is 4097, unpacking into bits,
>> de2bi(4097)
ans =
1 0 0 0 0 0 0 0 0 0 0 0 1
Bit pos. 0 1 2 3 4 5 6 7 8 9 10 11 12
Reveals that the static water body flag bit is raised (in bit position 0, Table 2), as well as the 12th bit flag (anomalous S0 flag, Table 2) is raised because the S0 value is beyond +/- 2.5 std within the coarse radiometer footprint.
%%%%%%%%%%%%%%%%%%%%%%%%%%%%%%%%%%%%%%%%%%%%%%%%%%%%%%%%%%%
Interested users of high resolution disaggregated brightness temperature can also evaluate the TB quality flag.
%Plot Disaggregated Brightness Temperature Quality Flag
>>imagesc(TBQF3km)
>>colorbar
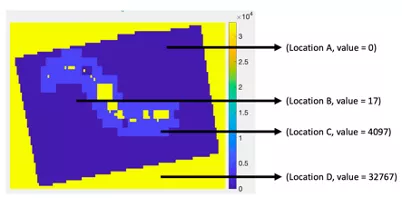
For example, the surface flag from the above plot at 3 km resolution can range from 0 to 32767. The value of 0 means (such as Location A) all the bits are cleared and the disaggregated brightness temperature is of good quality for the am part. However, for the apm part, the user has to look into the bit position of 0 to assess the quality because the overall flag value may not be 0. In the case of apm the bit 13 may be raised to 1 if the ascending brightness temperature is used this leads to a value greater than 0. A value of 17 for the flag (Location B from the above plot) informs us of the presence of RFI (Table 3, bit position 4).
>> de2bi(17)
ans =
1 0 0 0 1 0 0 0 0 0 0 0 0 0 0
Bit pos. 0 1 2 3 4 5 6 7 8 9 10 11 12 13 14
A value of 4097 for the flag (Location C from above plot) informs us about the waterbody correction is used in the input TB at 33 km (Table 3, bit position 12).
>> de2bi(4097)
ans =
1 0 0 0 0 0 0 0 0 0 0 0 1 0 0
Bit pos. 0 1 2 3 4 5 6 7 8 9 10 11 12 13 14
Similarly, for the Location D in the above plot, the value of 32767, and unpacking shows all the bits are raised, and this indicates that the location is outside the granule observation domain.
>> de2bi(32676)
ans =
1 1 1 1 1 1 1 1 1 1 1 1 1 1 1
Bit pos. 0 1 2 3 4 5 6 7 8 9 10 11 12 13 14
%%%%%%%%%%%%%%%%%%%%%%%%%%%%%%%%%%%%%%%%%%%%%%%%%%%%%%%%%%%
%Plot Soil Moisture Retrieval Quality Flag
>>imagesc(RFQF3km)
>> colorbar
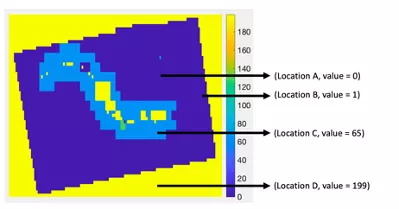
The above figure shows a typical plot of soil moisture retrieval quality flags. Location A in the above plot indicates that the soil moisture retrieval is clean because the value of the quality flag is 0. For Location B, the value of the retrieval flag is 1 that means the soil moisture quality is compromised. If the user wants to know more about why the value is 1, then the user should unpack the corresponding surface flag to understand what is triggering the value of soil moisture retrieval quality flag to become 1, in this case, it is the VWC bit of the surface flag that is set to 1 because the VWC is greater than 3 kg/m2. For Location C, the value is 65, unpacking it into bits reveals:
>> de2bi(65)
ans =
1 0 0 0 0 0 1 0
Bit pos. 0 1 2 3 4 5 6 7
The 6th bit position is raised to 1, and this implies that the disaggregated brightness temperature is not of good quality (Table 4). If the user refers to the disaggregated quality TB flag it will become obvious that the same location is flagged because waterbody correction is conducted on the input TB at 33 km. Location D is 199 and unpacking shows all the bits are raised, and this indicates that the location is outside the granule observation domain.
>> de2bi(199)
ans =
1 1 1 1 1 1 1 1
Bit pos. 0 1 2 3 4 5 6 7


