April sea ice loss in the Arctic proceeded at a near-average rate overall, with the majority of ice losses in the Bering Sea and Sea of Okhotsk. In the Antarctic, sea ice grew faster than average, roughly evenly around the entire continent. Both hemispheres are well below the 1981 to 2010 reference period average, but neither are near record-low extents.
Overview of conditions

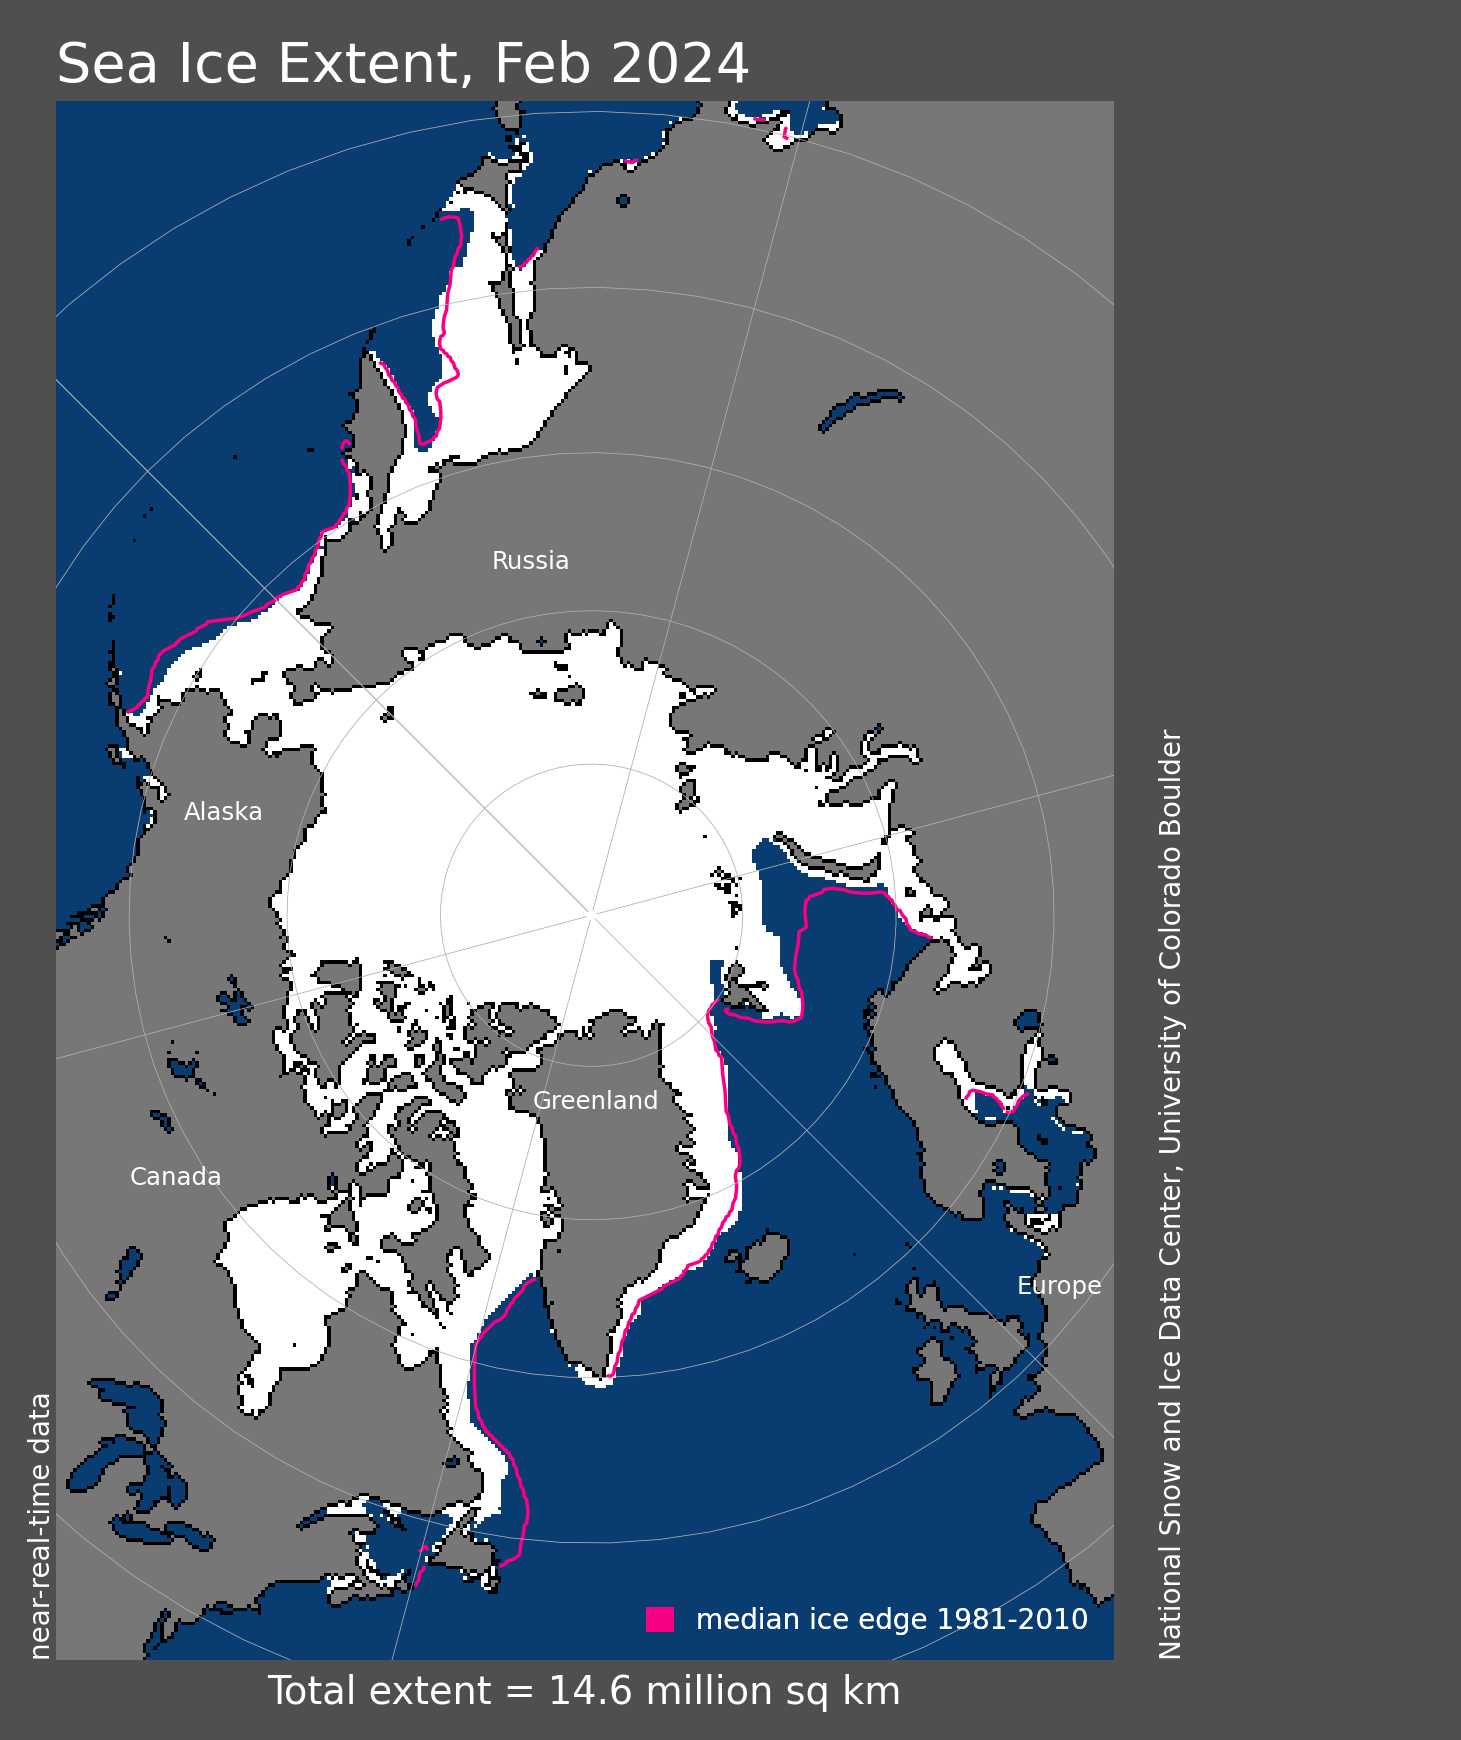
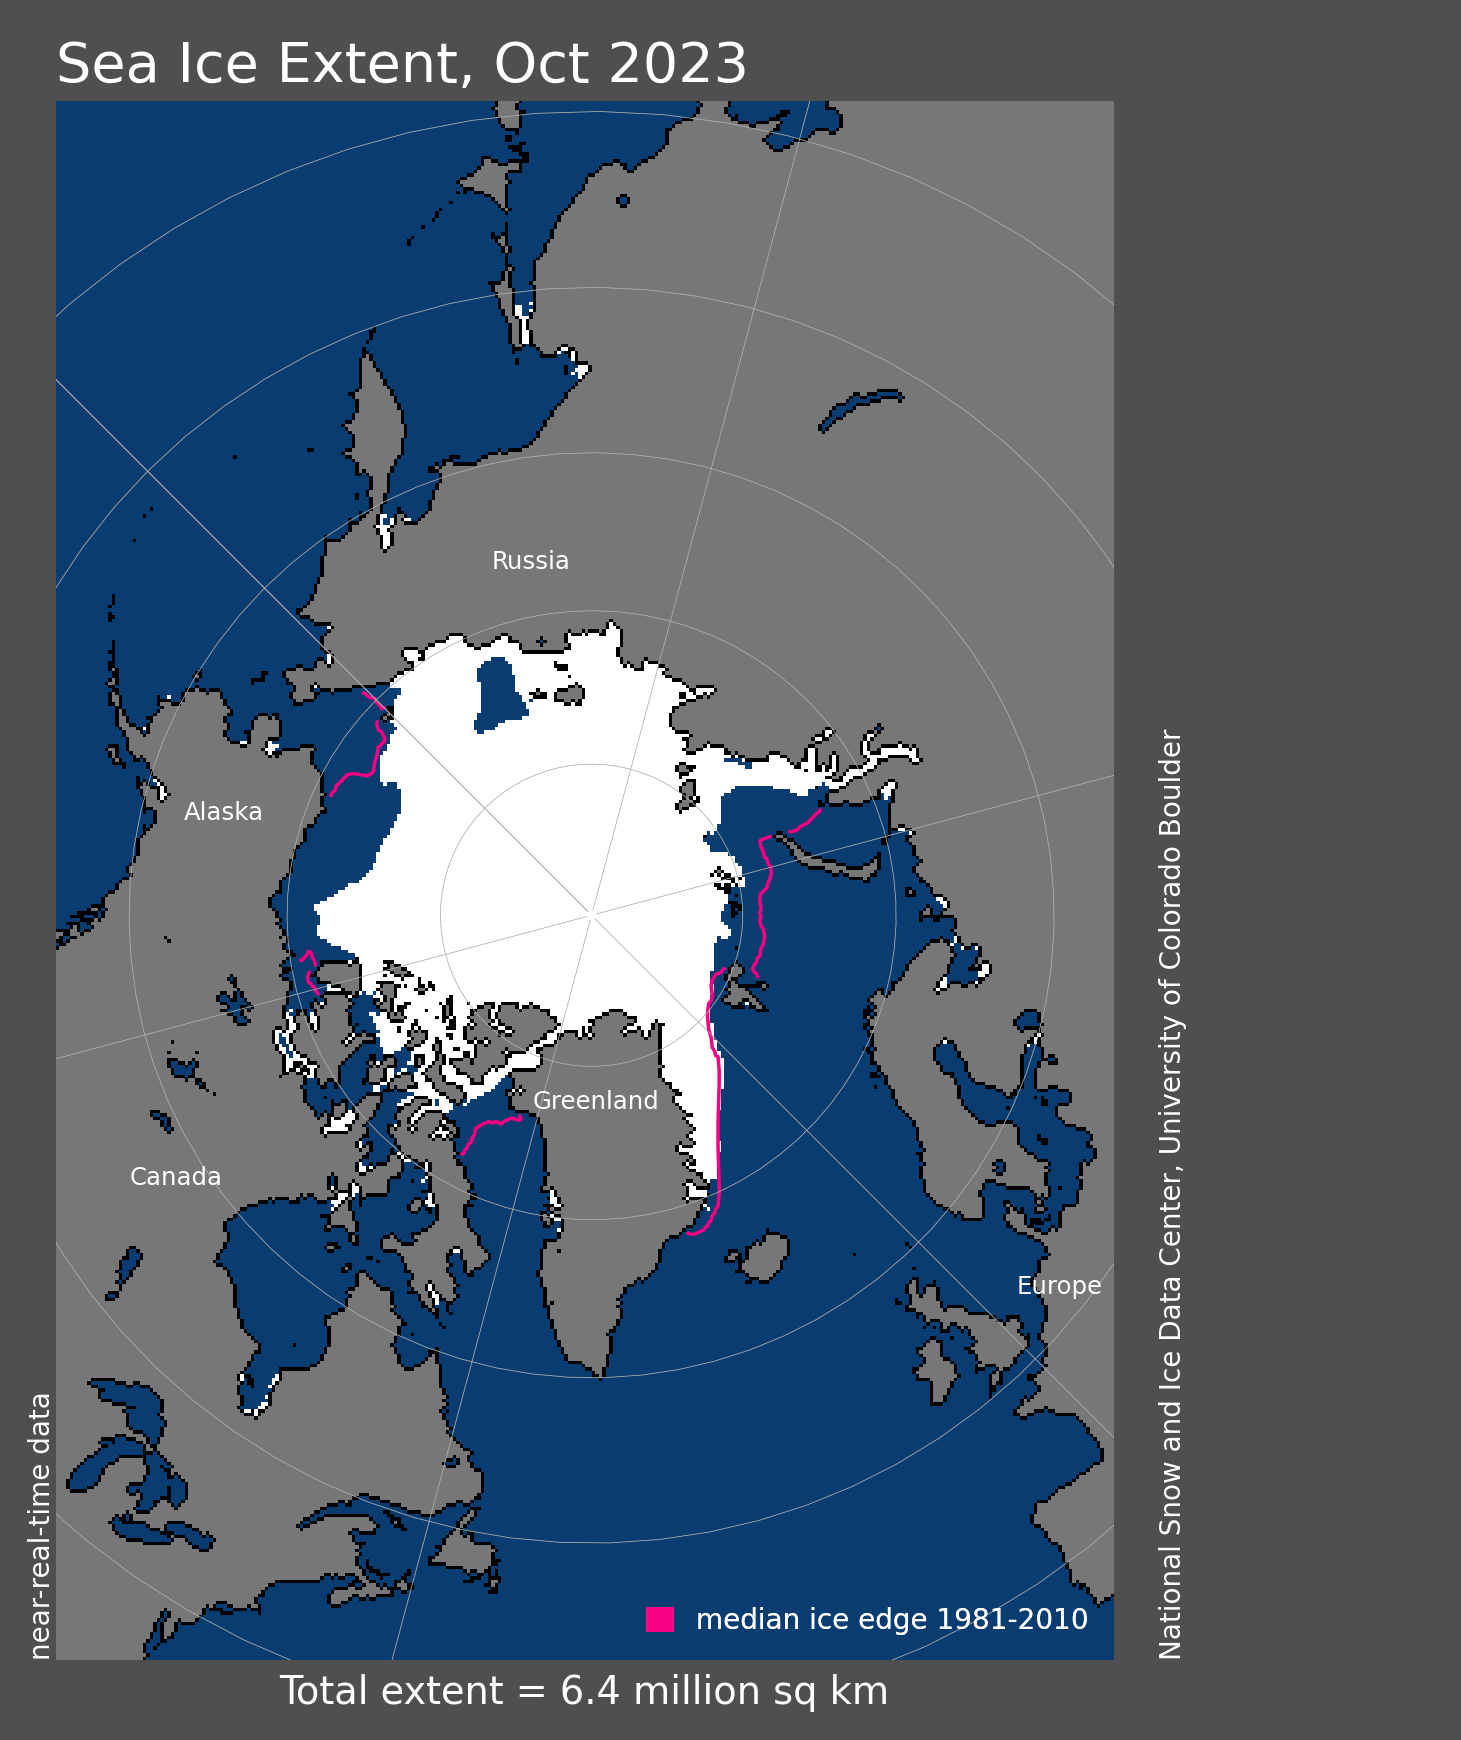
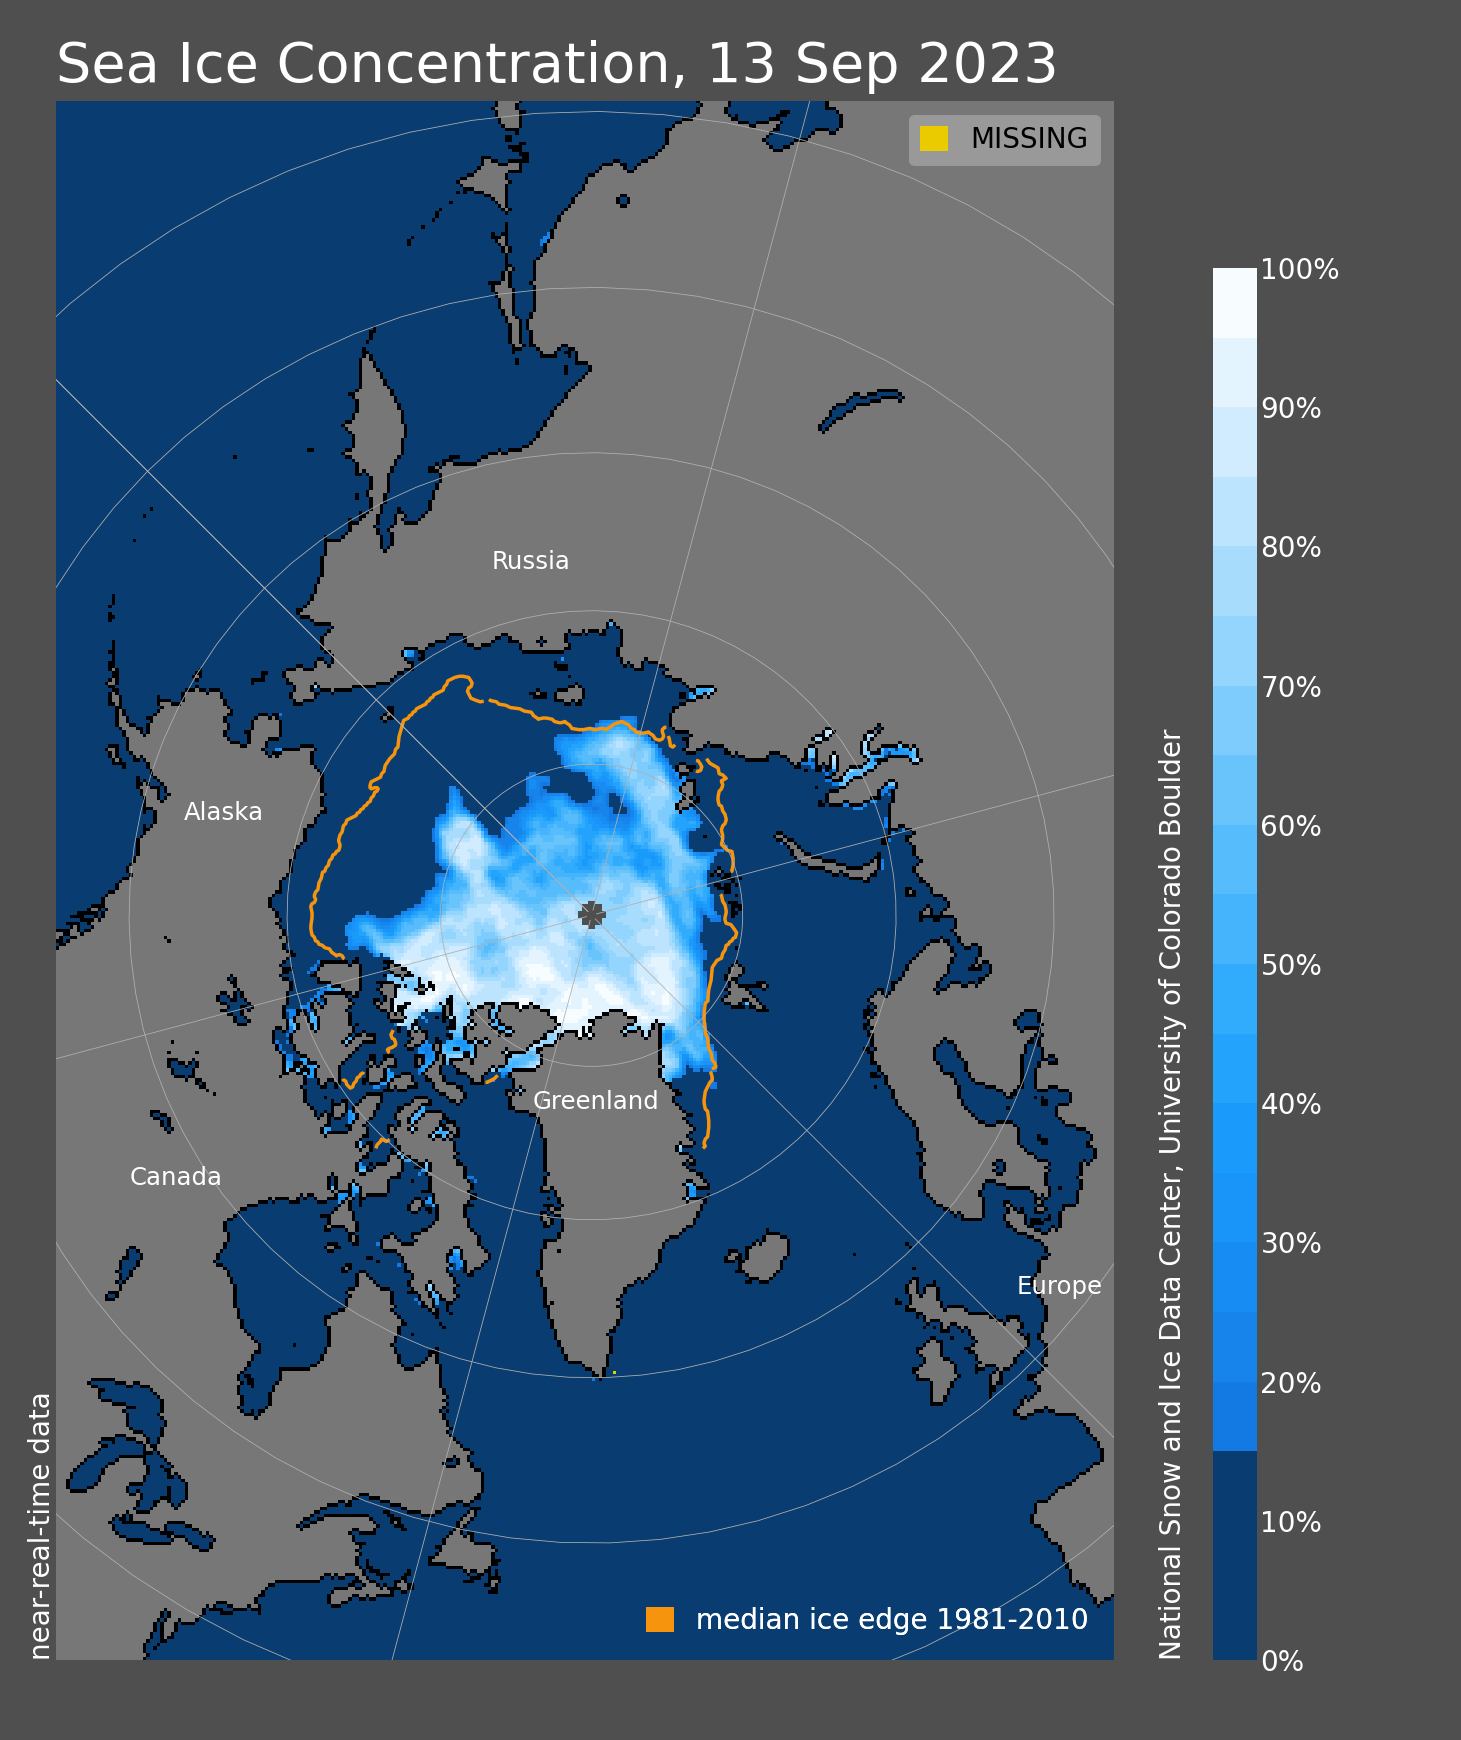
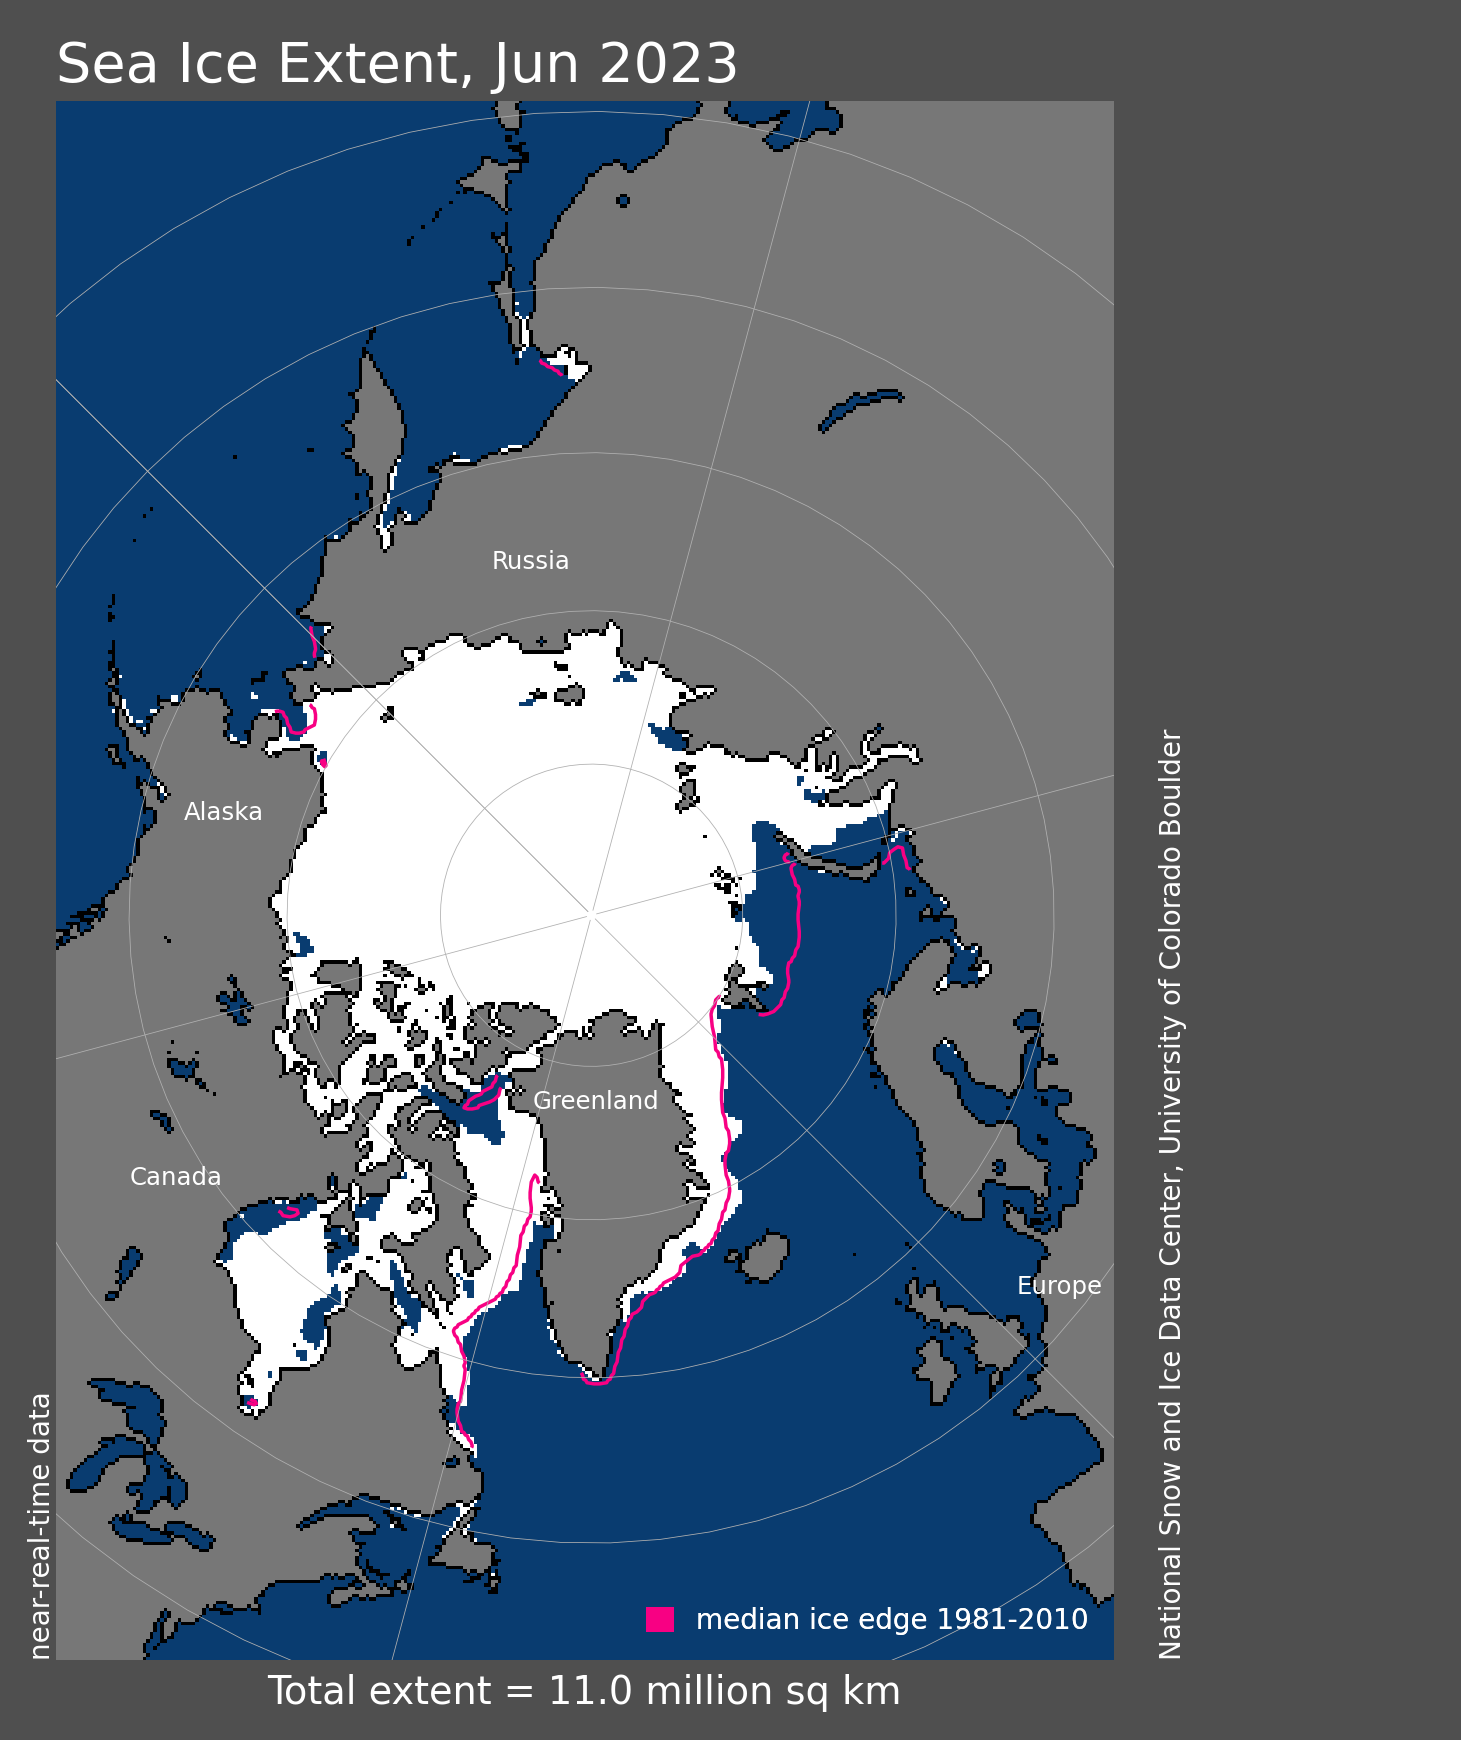
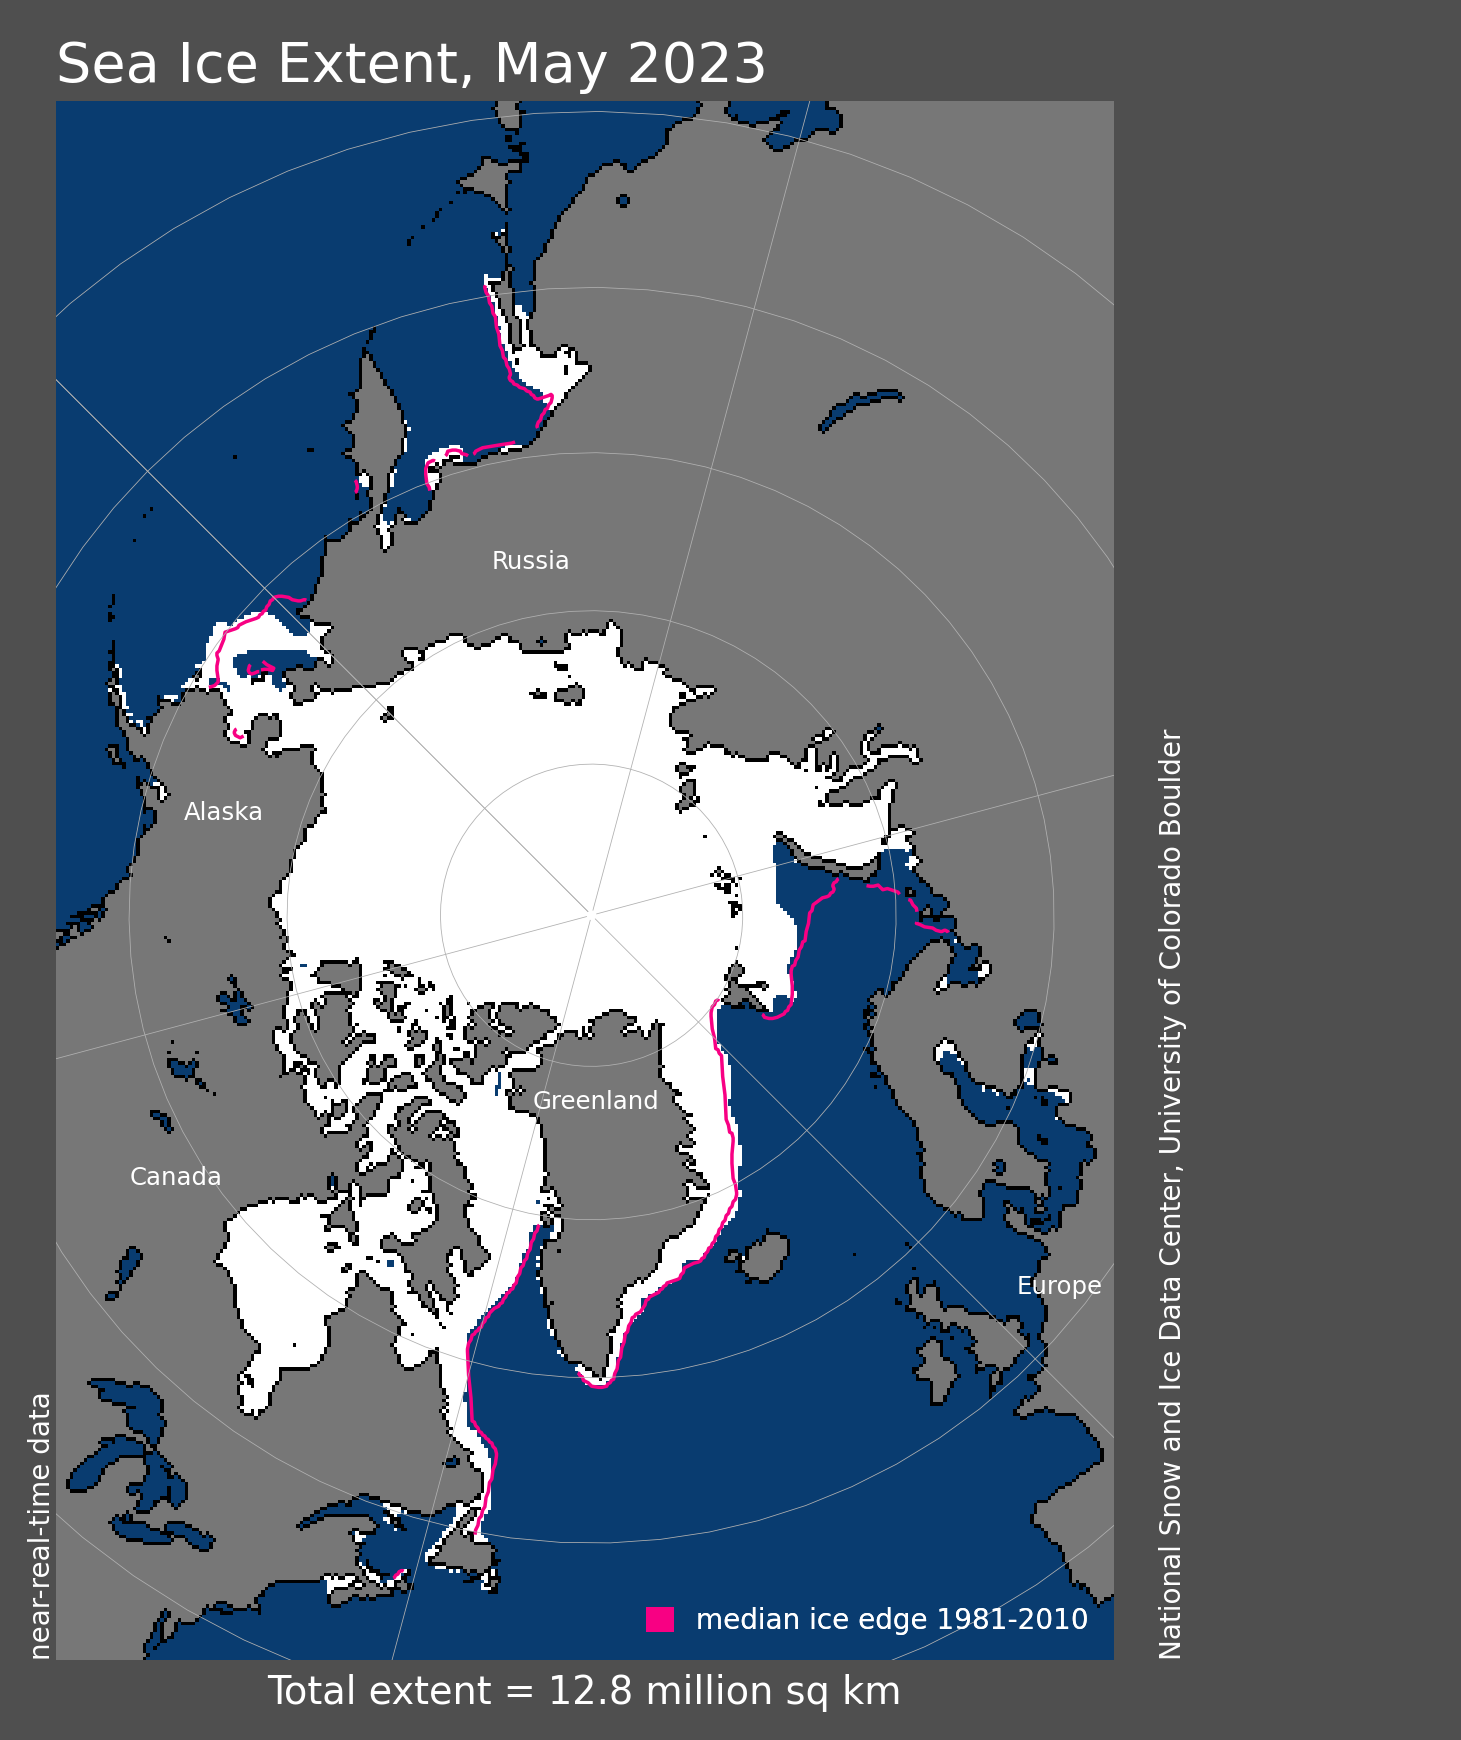
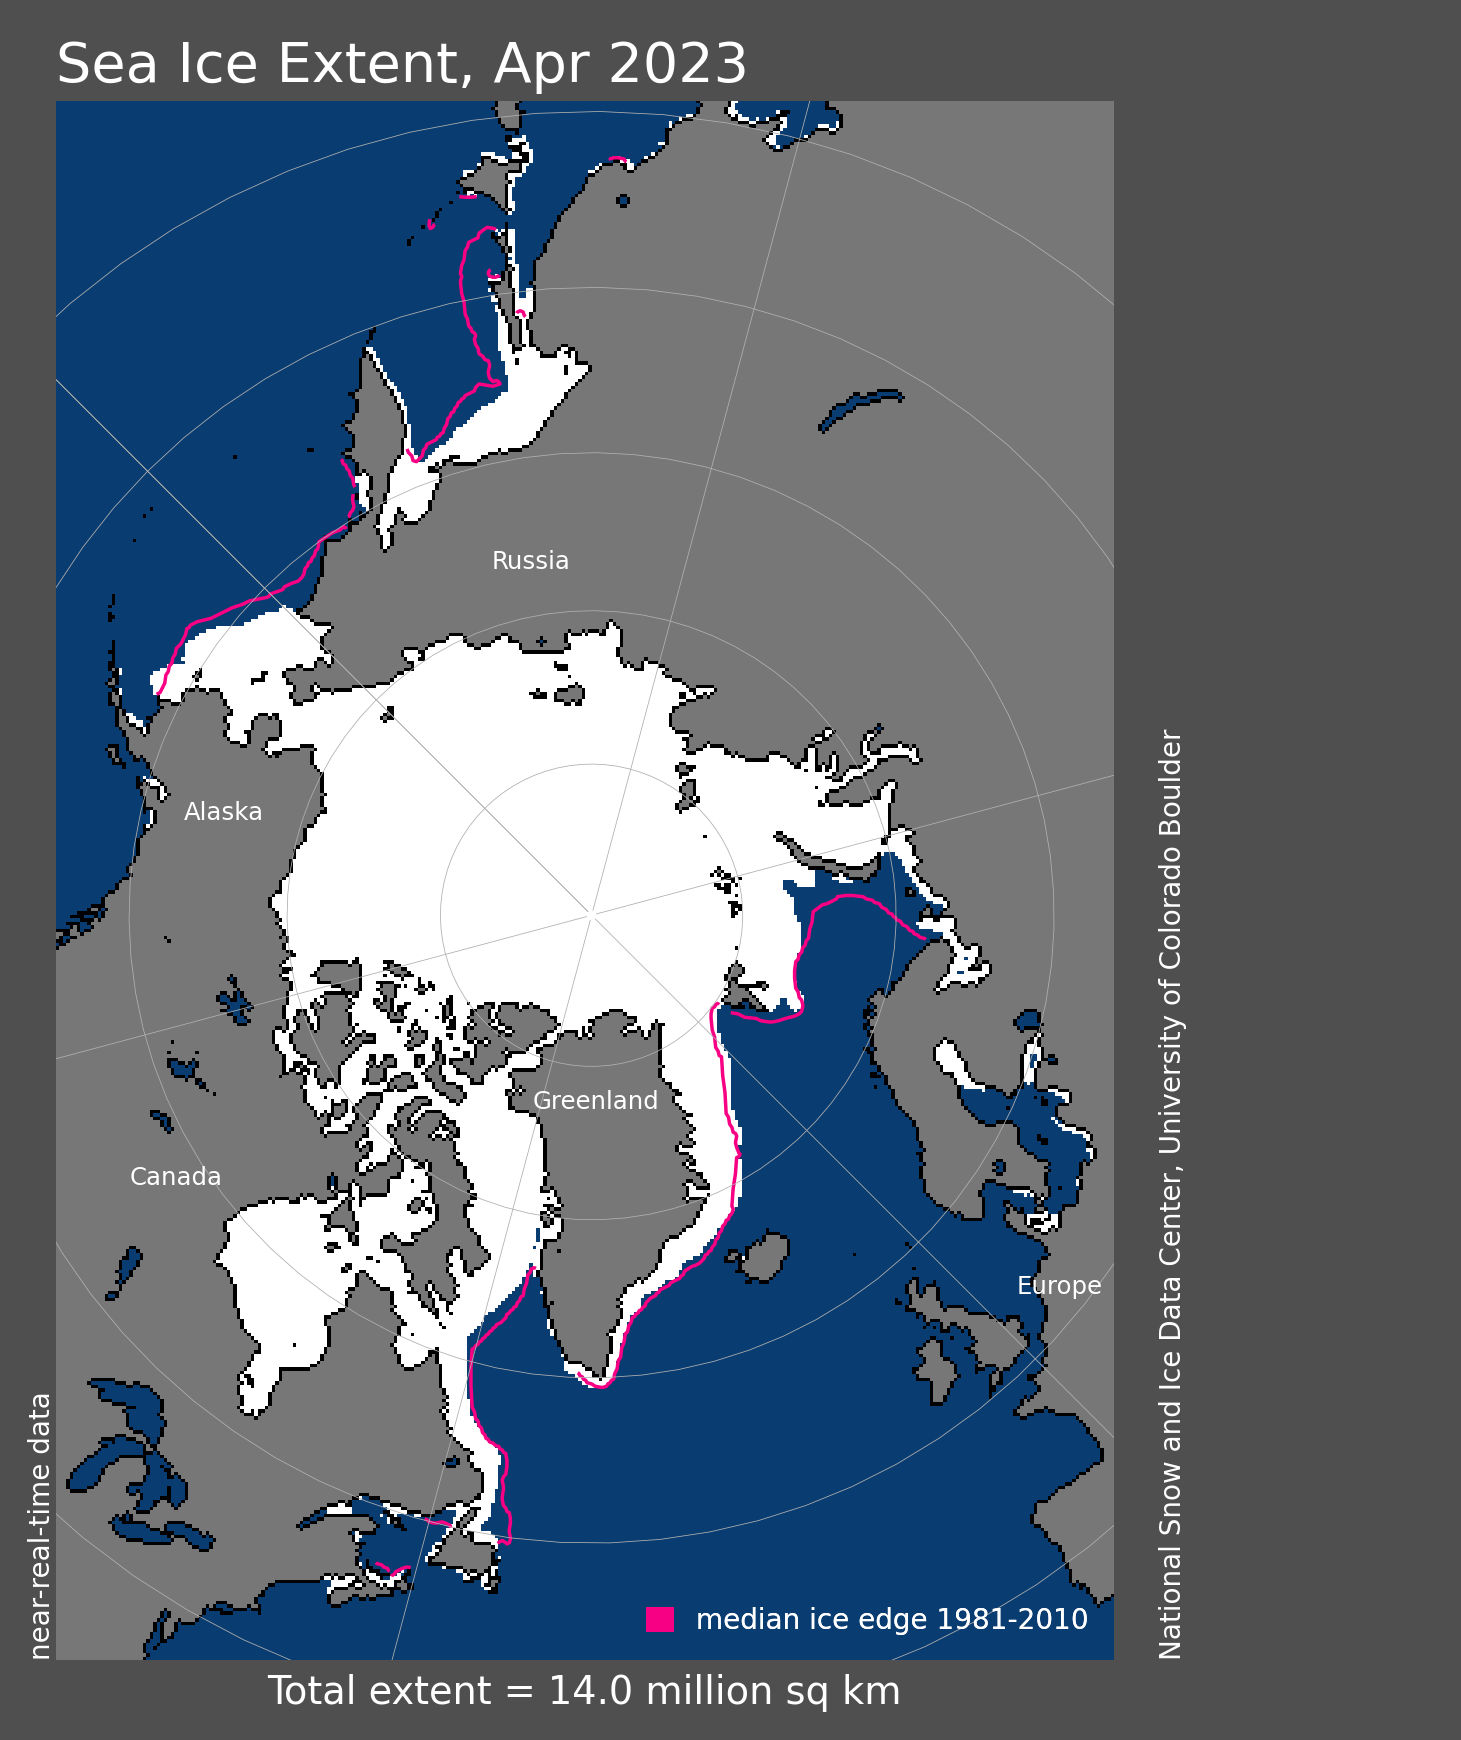
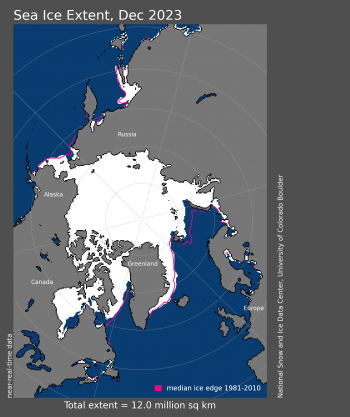
Figure 1a. Arctic sea ice extent for April 2024 was 14.12 million square kilometers (5.45 million square miles). The magenta line shows the 1981 to 2010 average extent for that month. Sea Ice Index data. About the data
Credit: National Snow and Ice Data Center
High-resolution image

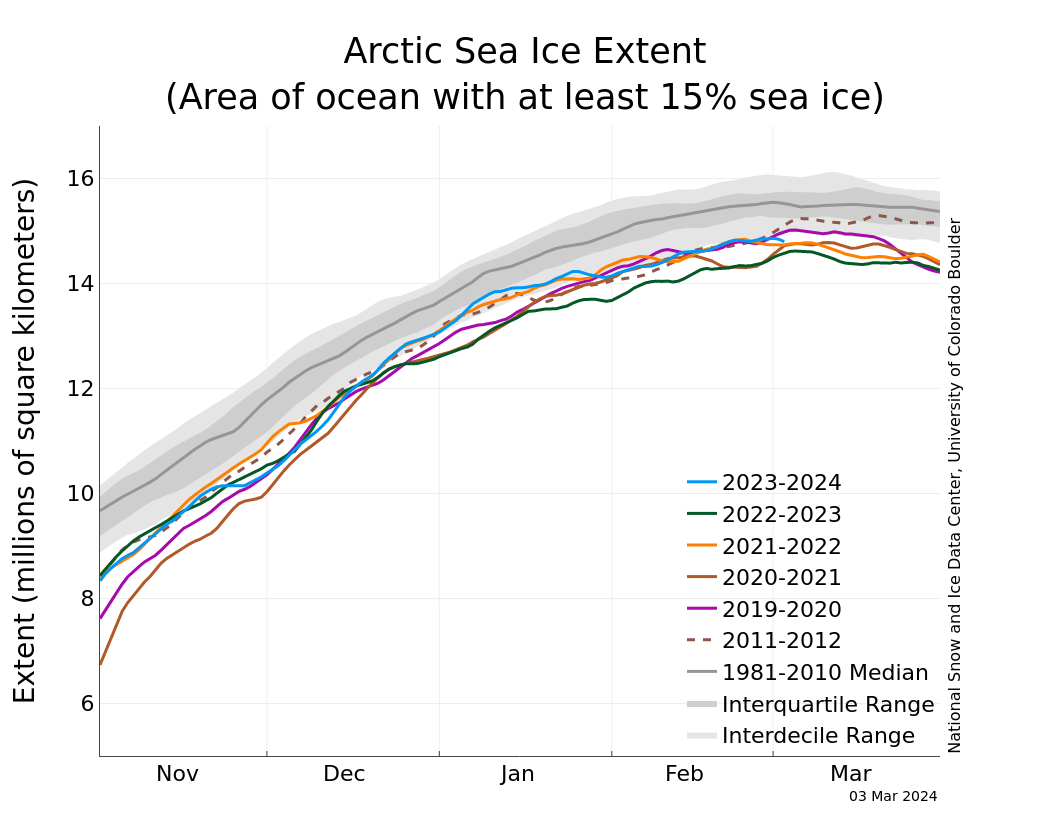
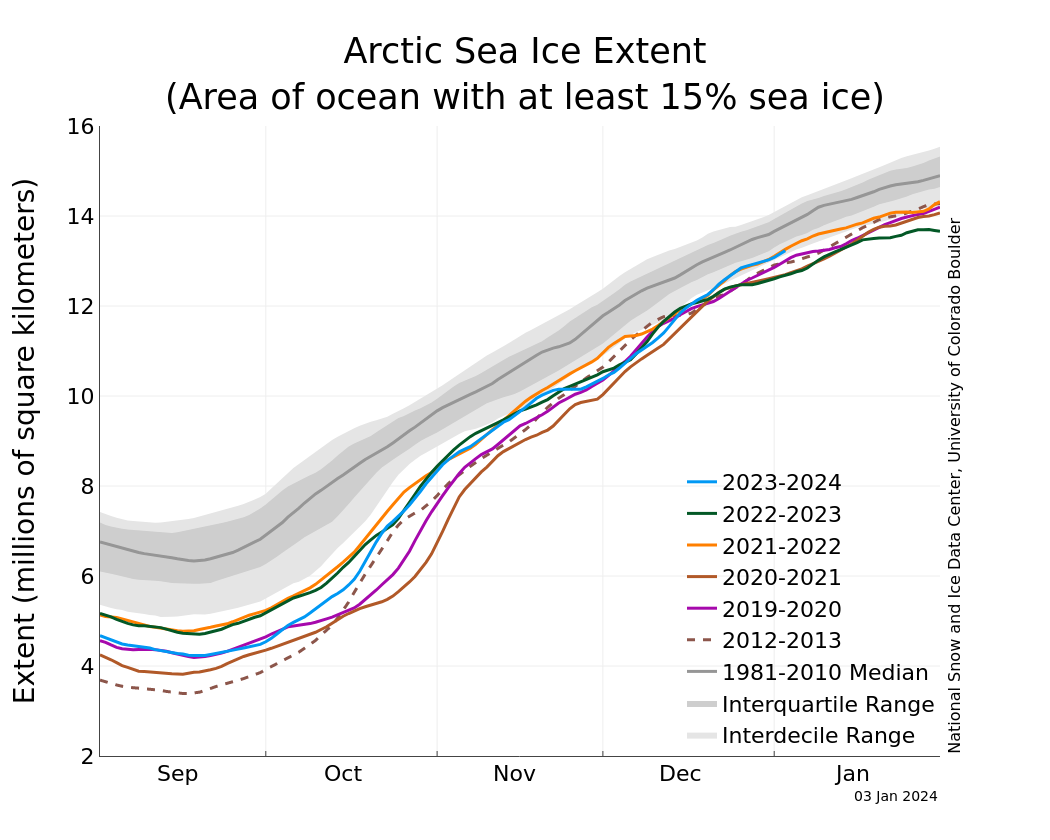
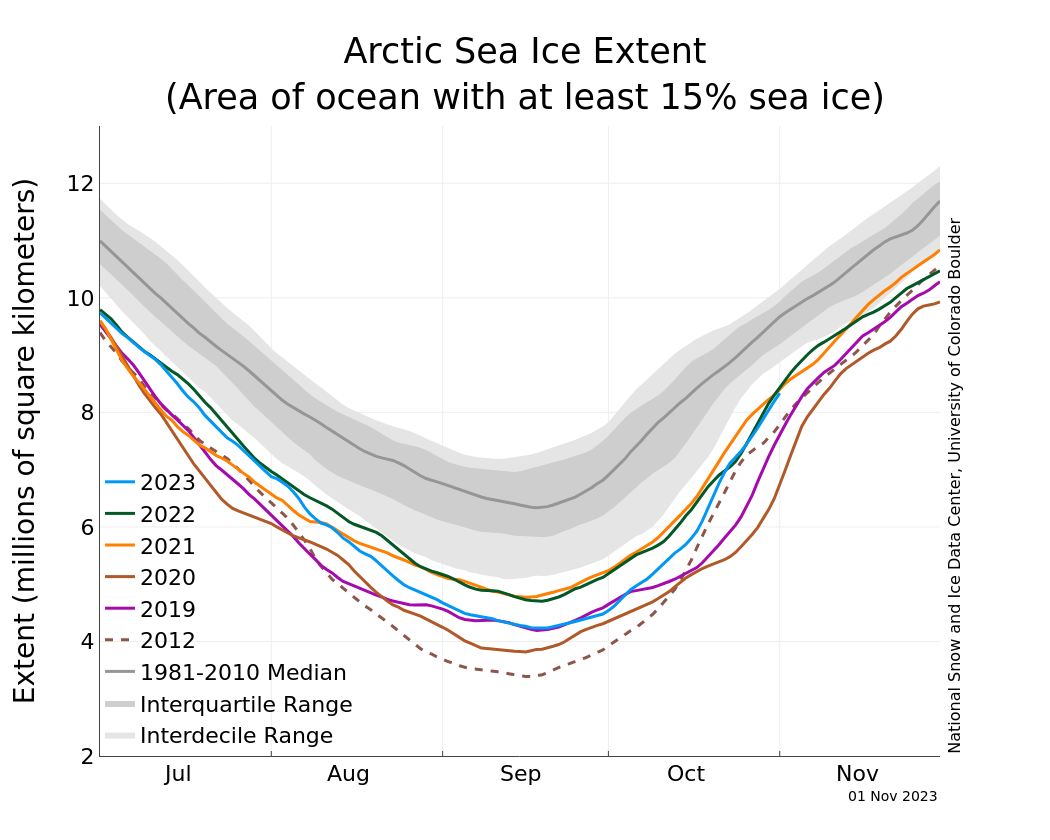
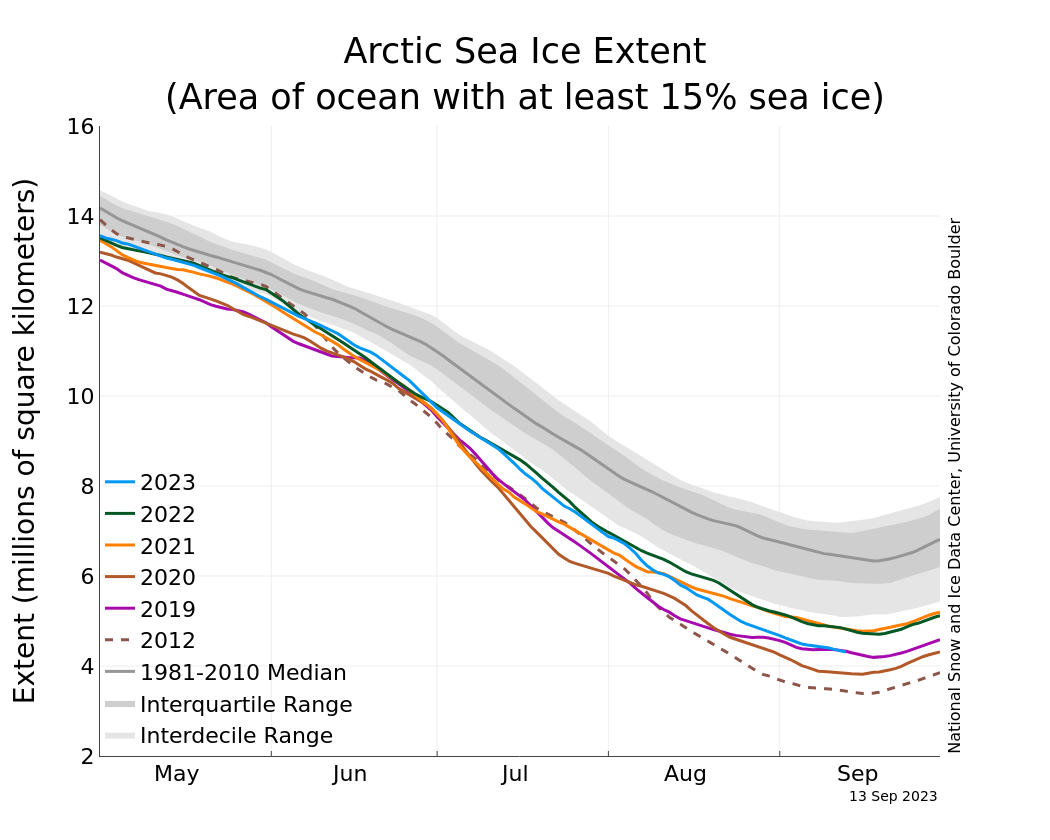
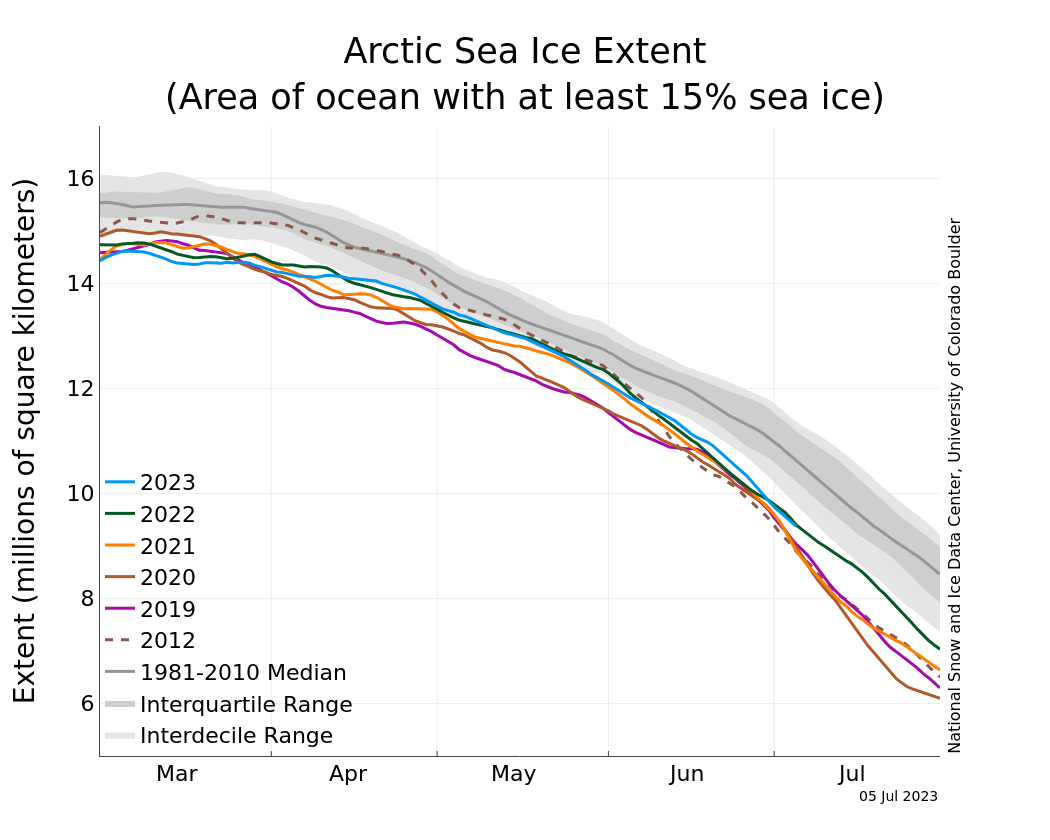
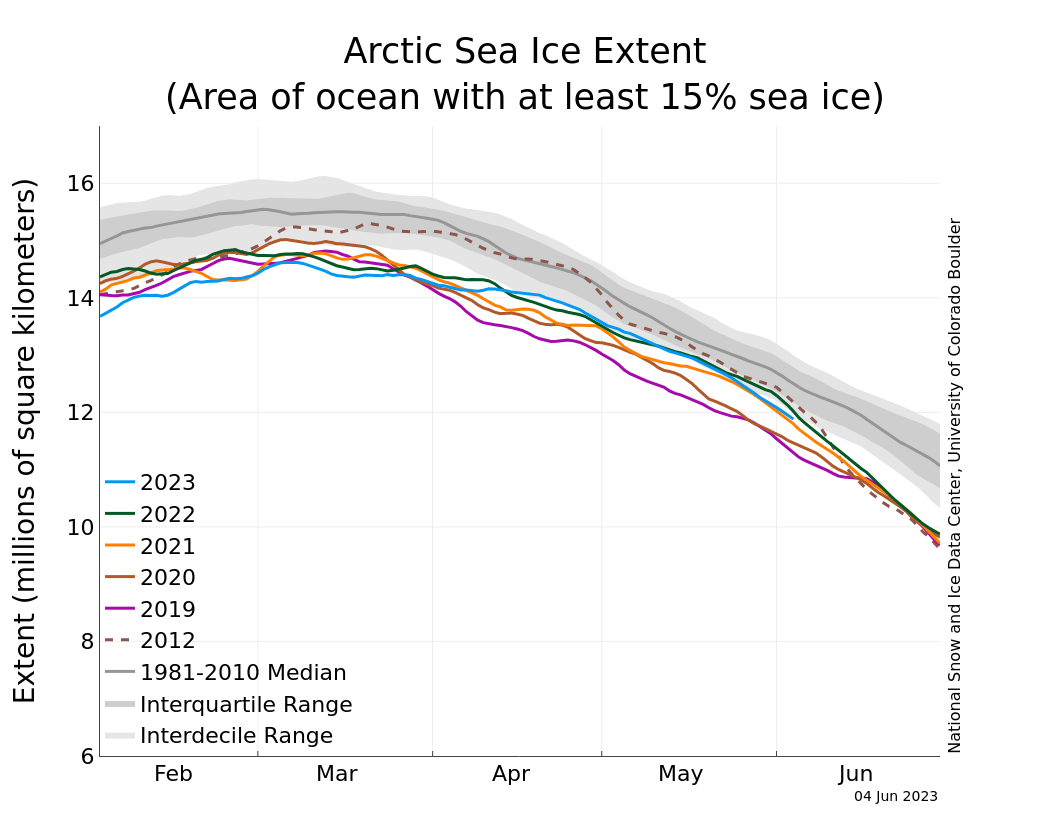
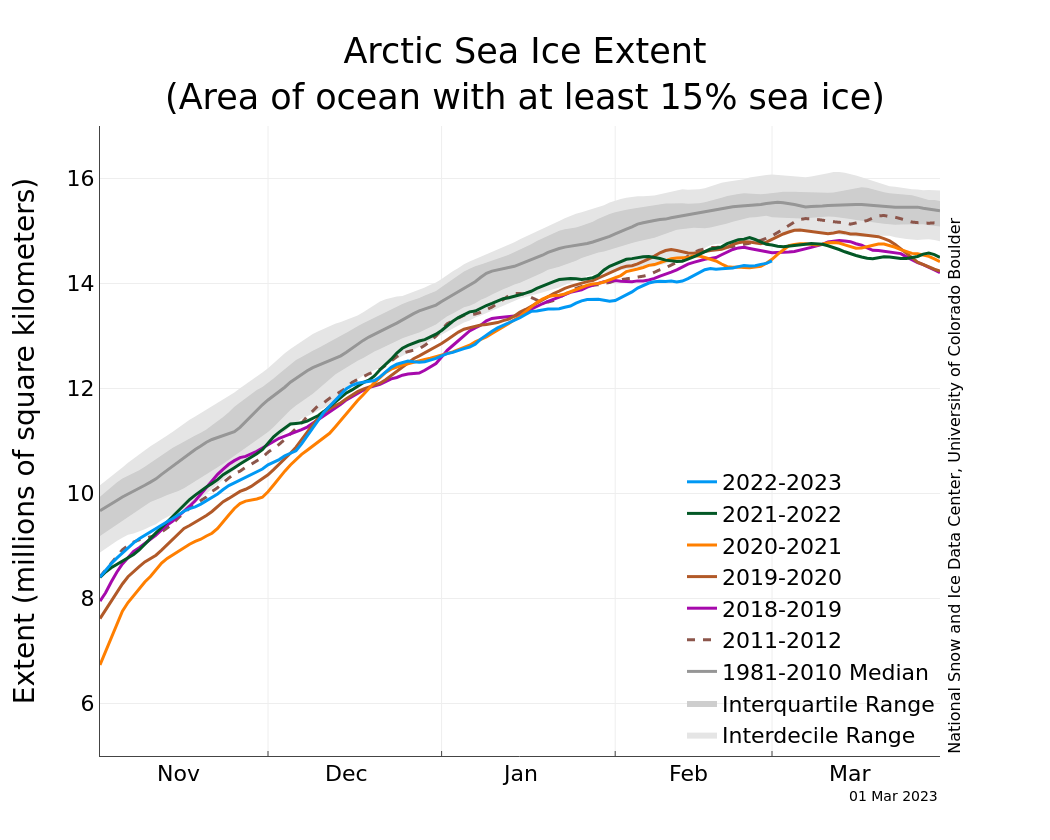
Figure 1b. The graph above shows Arctic sea ice extent as of May 5, 2024, along with daily ice extent data for four previous years and the record low year. 2024 is shown in blue, 2023 in green, 2022 in orange, 2021 in brown, 2020 in magenta, and 2012, the record low year, in dashed brown. The 1981 to 2010 median is in dark gray. The gray areas around the median line show the interquartile and interdecile ranges of the data. Sea Ice Index data.
Credit: National Snow and Ice Data Center
High-resolution image
The average Arctic sea ice extent for April 2024 was 14.12 million square kilometers (5.45 million square miles), placing it sixteenth lowest in the passive microwave satellite record (Figure 1a and 1b). As of the beginning of May, extent is well below average in the Sea of Okhotsk, and slightly below average in the Bering and Barents Seas and off the coast of Labrador. Ice is near the average position along the eastern coast of Greenland.
Conditions in context

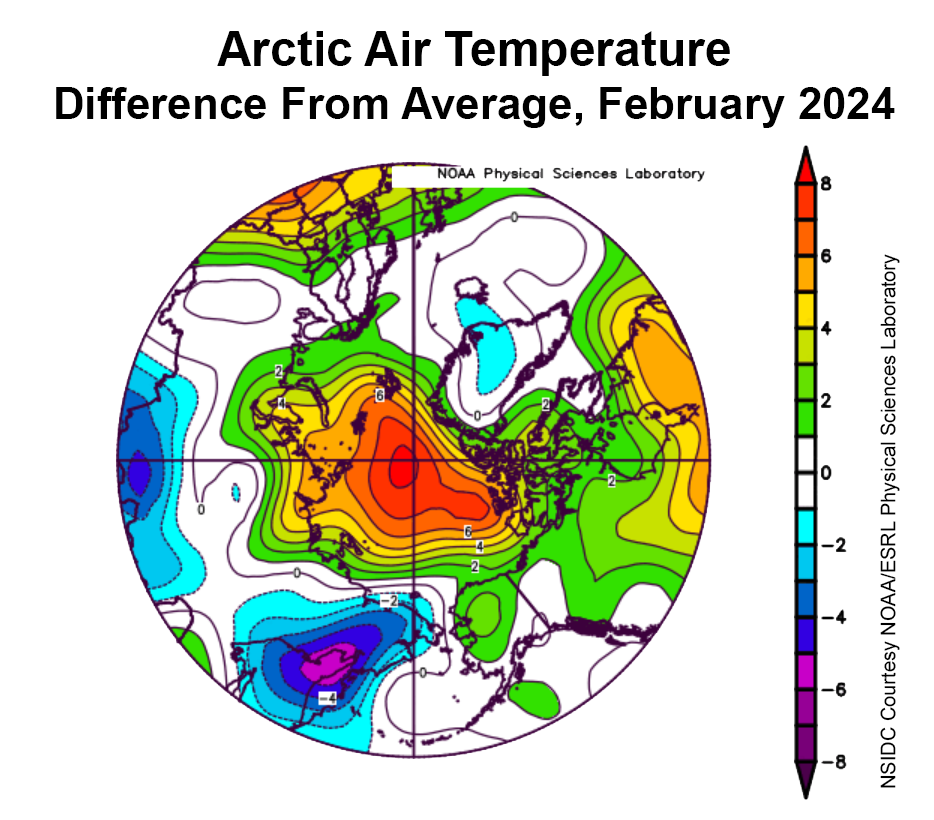
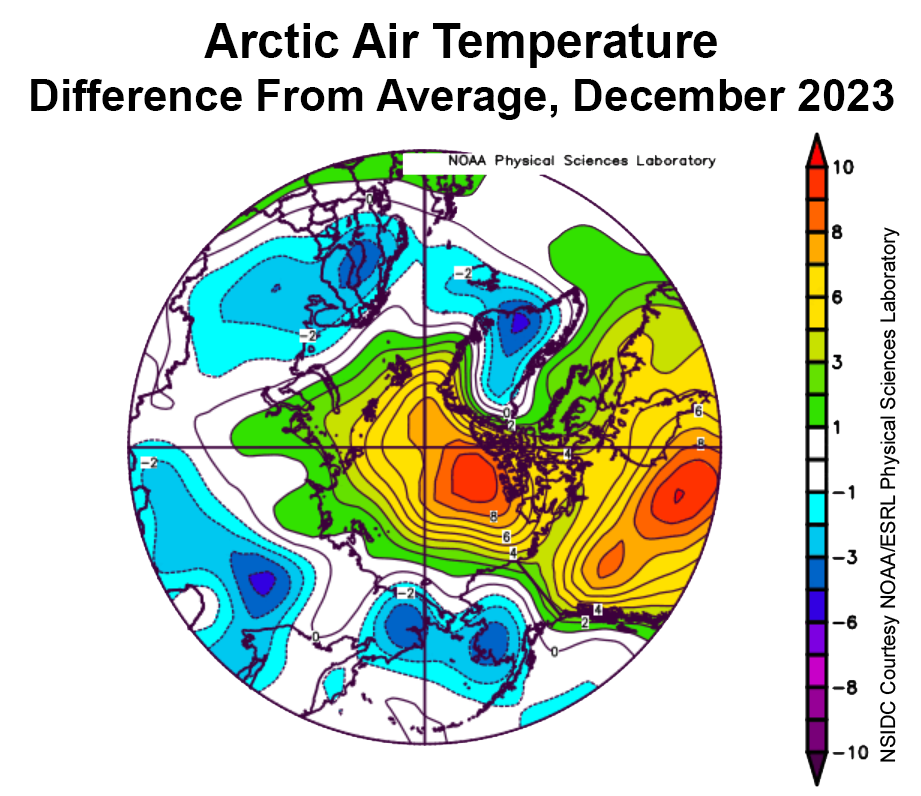
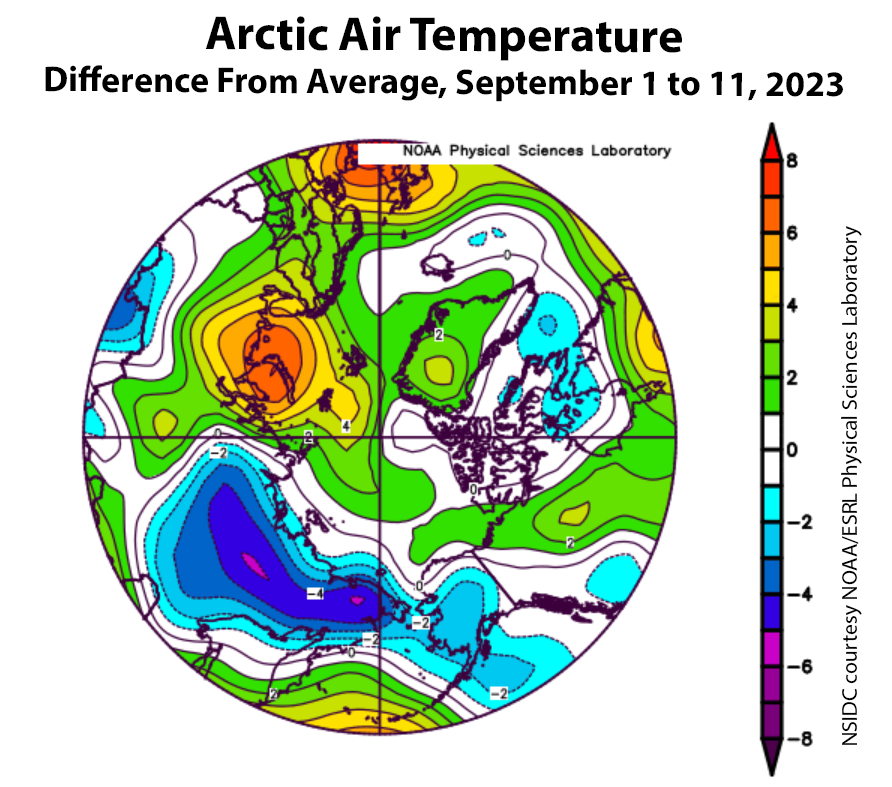
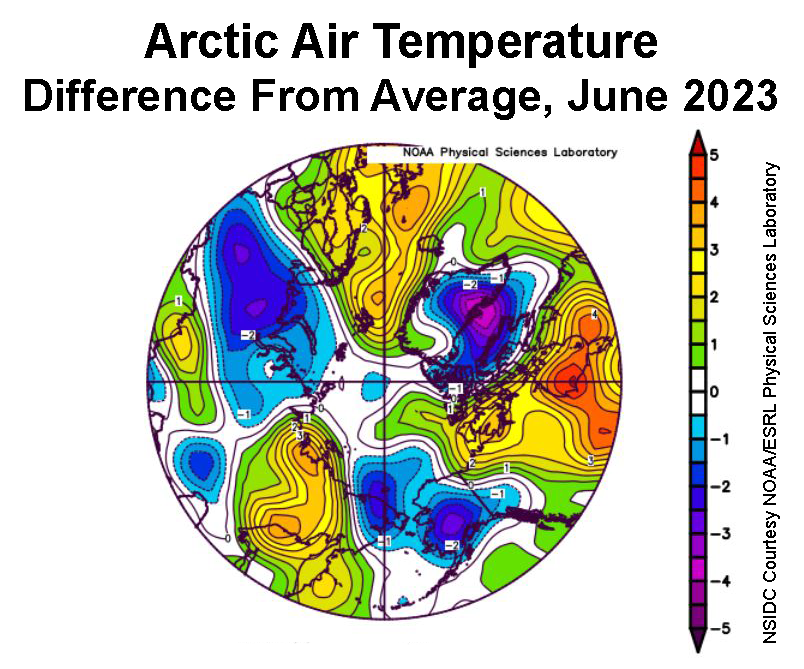
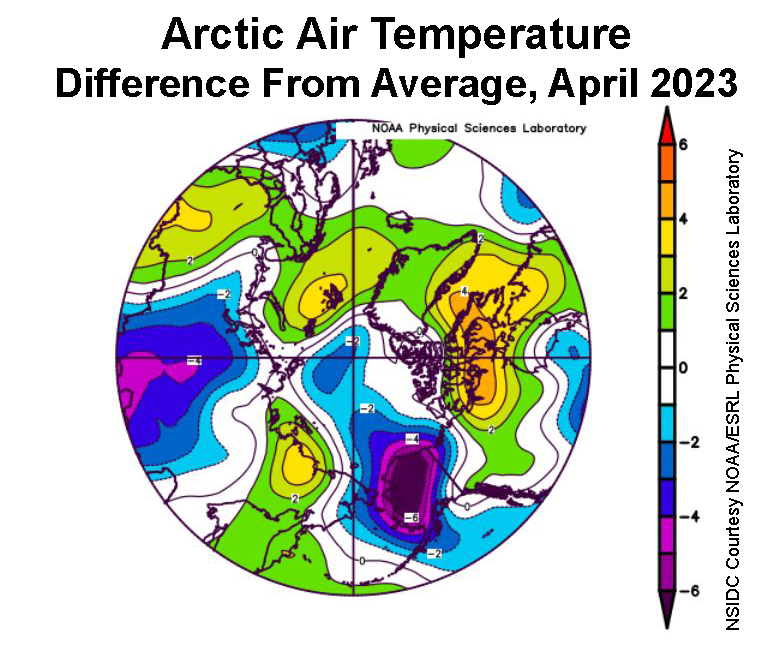
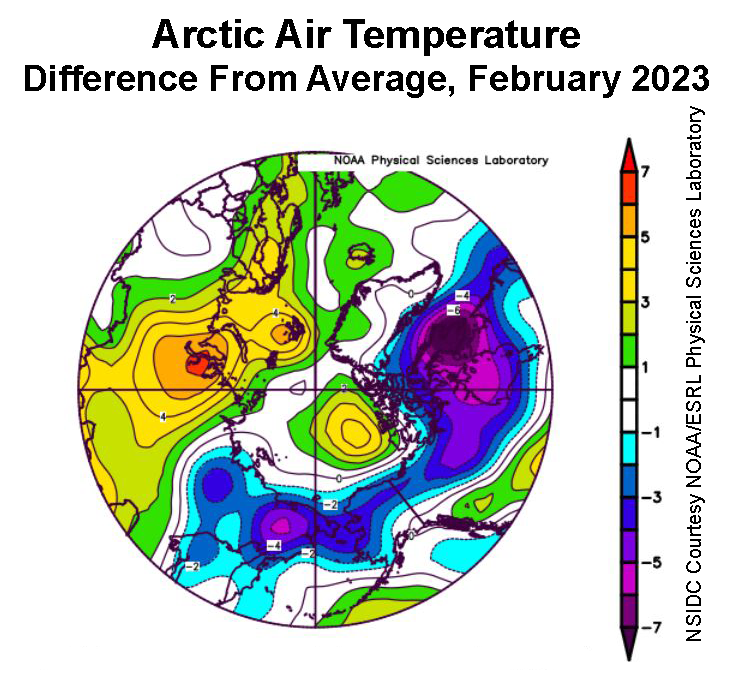
Figure 2a. This plot shows the departure from average air temperature in the Arctic at the 925 hPa level relative to the 1991 to 2020 reference period, in degrees Celsius, for April 2024. Yellows and reds indicate above average temperatures; blues and purples indicate below average temperatures.
Credit: NSIDC courtesy NOAA Earth System Research Laboratory Physical Sciences Laboratory
High-resolution image
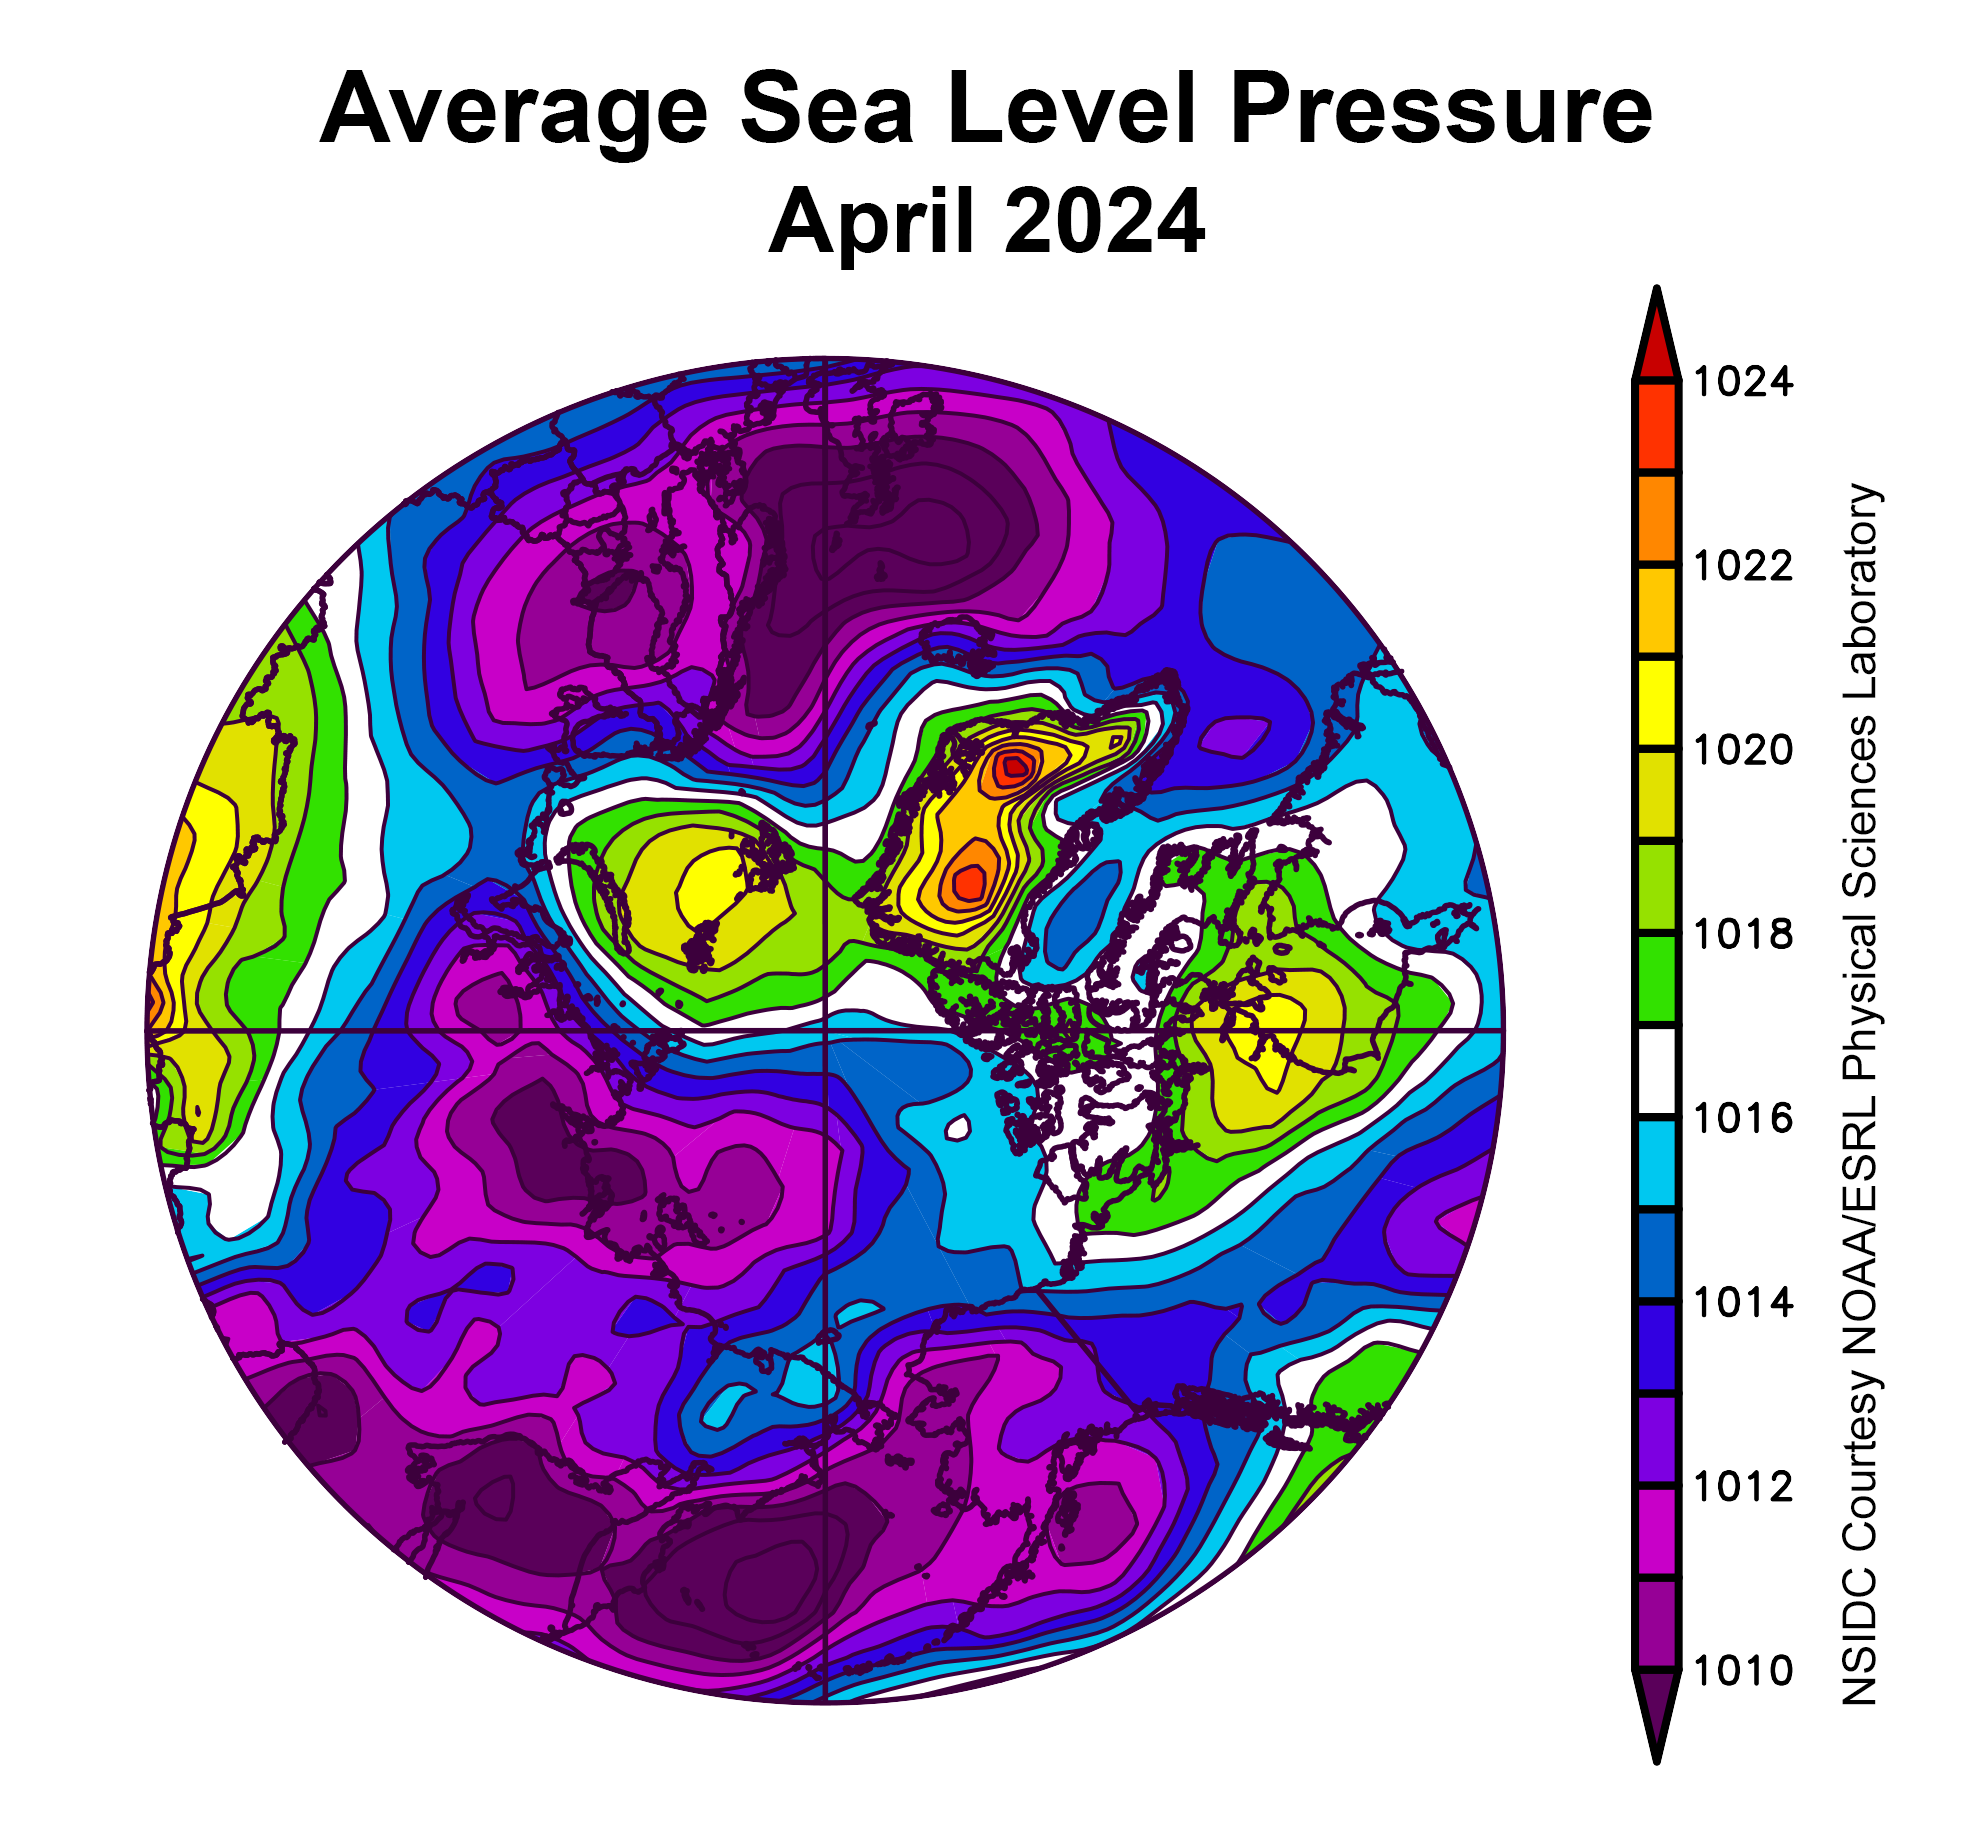
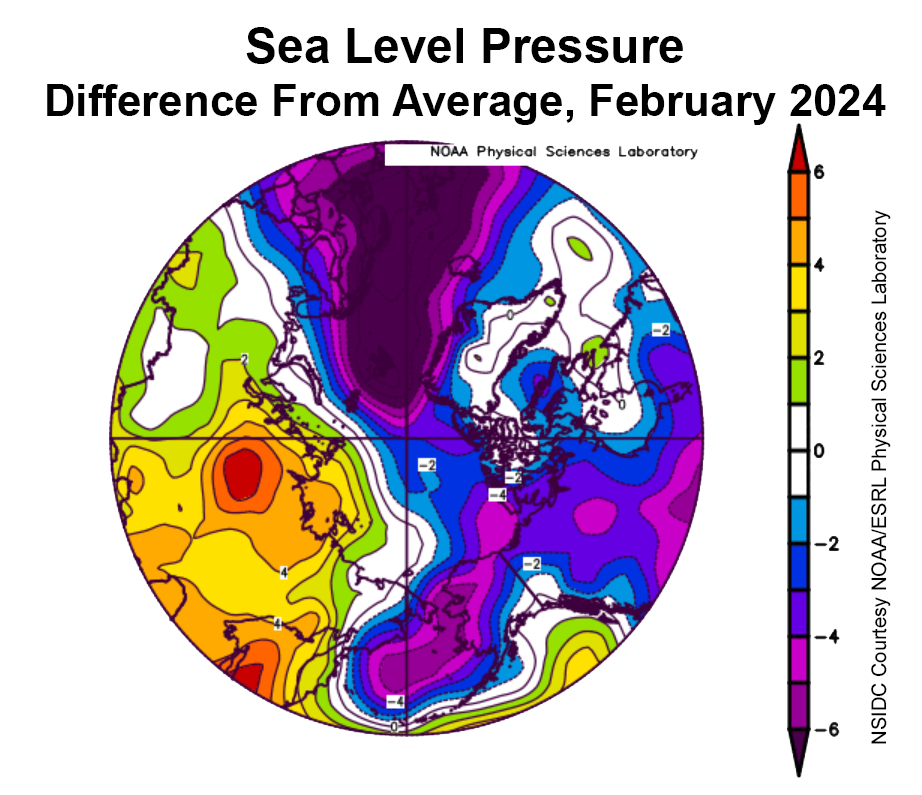
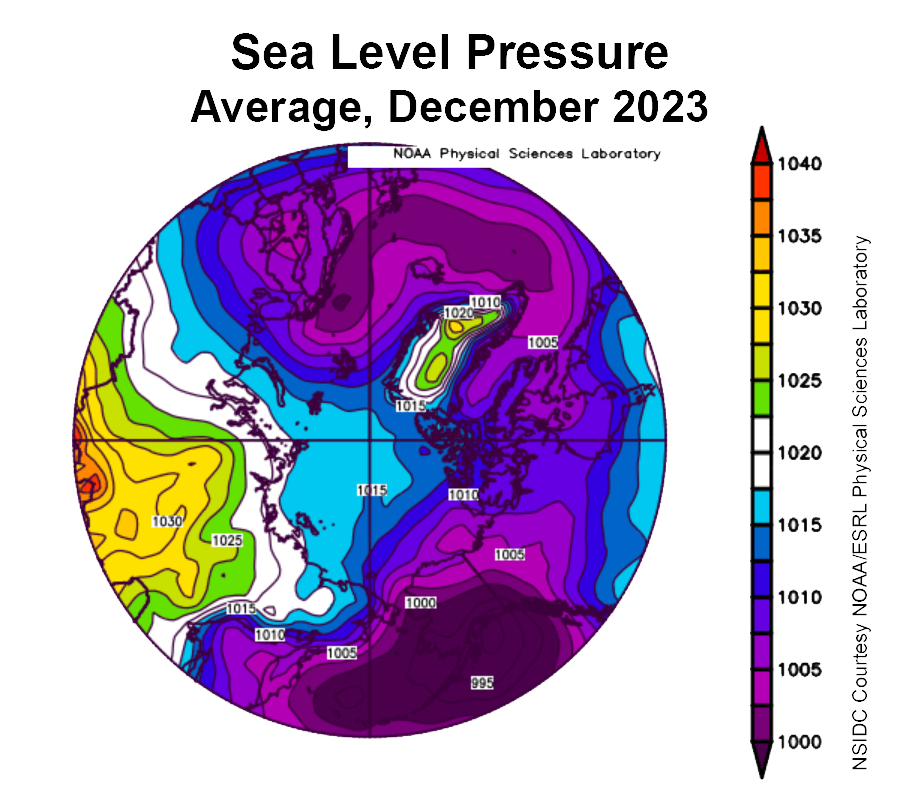
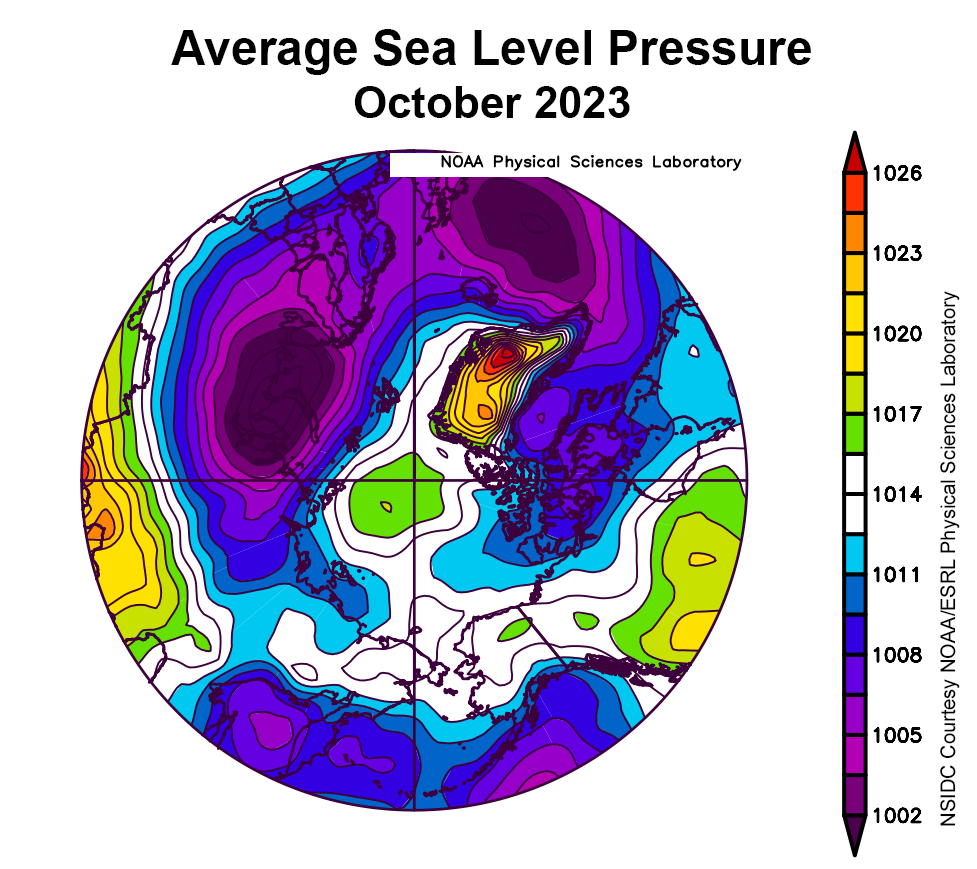
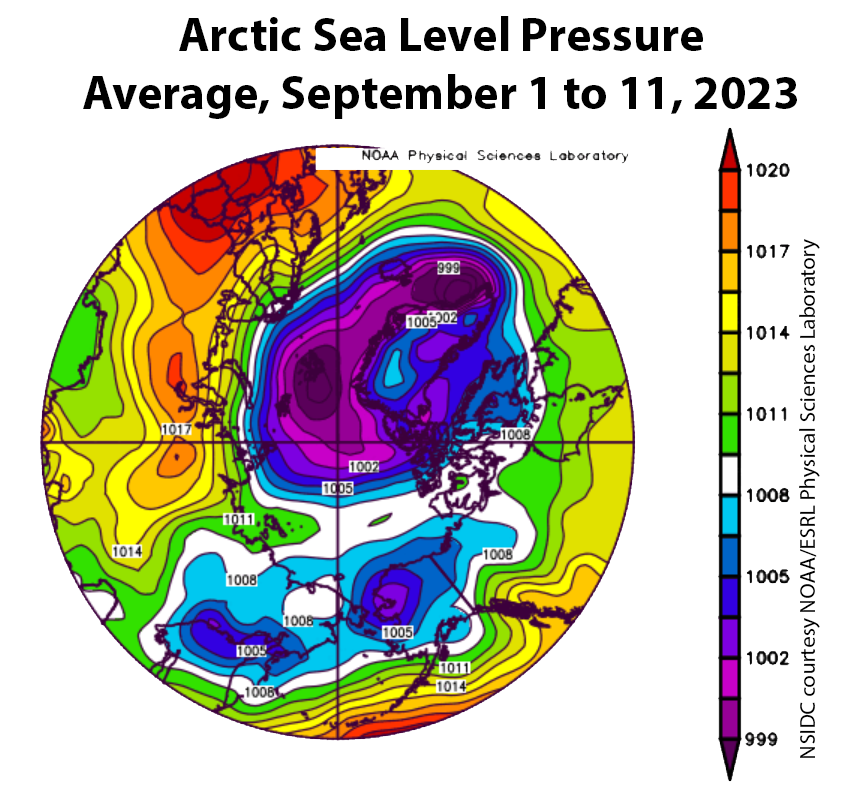
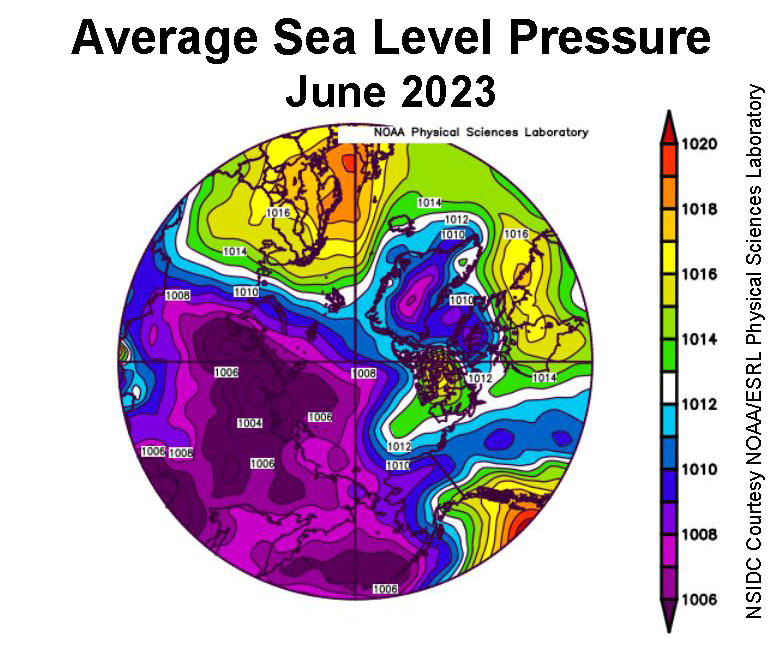
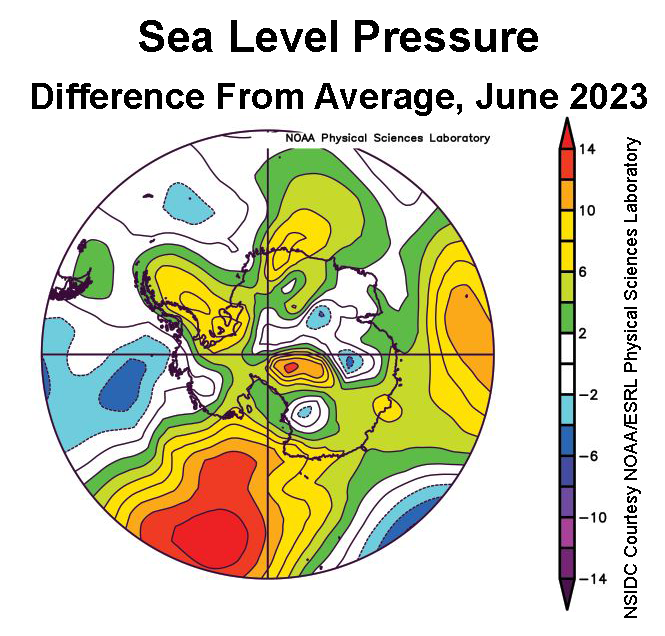
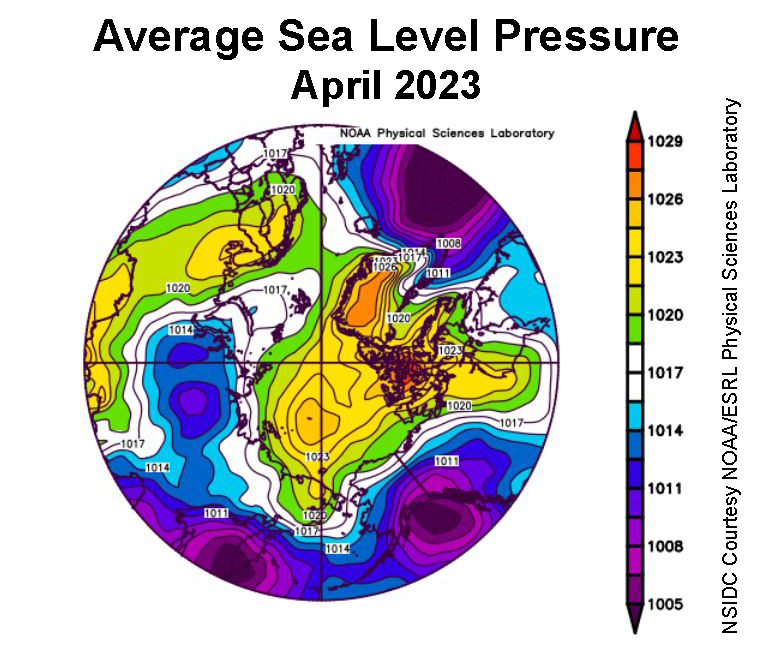
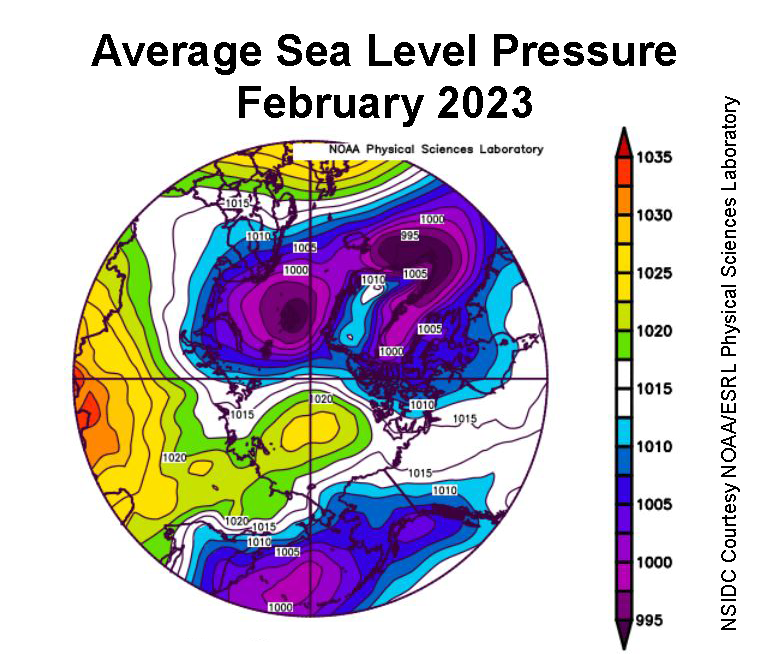
Figure 2b. This plot shows the average sea level pressure in the Arctic in millibars for April 2024. Yellows and reds indicate above average air pressures; blues and purples indicate below average air pressures.
Credit: NSIDC courtesy NOAA Earth System Research Laboratory Physical Sciences Laboratory
High-resolution image
The global average temperature in April was at a record high in many assessments. By contrast in the Arctic, April 2024 temperatures at the 925 hPa level (about 2,500 feet above the surface) were below average by 3 to 5 degrees Celsius (5 to 9 degrees Fahrenheit) along the Siberian coast and northwestern coast of Scandinavia. Markedly warm conditions were the rule over most of Canada and northern Greenland (Figure 2a). The regions near Hudson Bay and along Peary Land on the north coast of Greenland were 3 to 5 degrees Celsius (5 to 9 degrees Fahrenheit) above the 1991 to 2020 climate reference period.
The atmospheric pattern for April featured high sea level pressure centered over the Barents Sea but lower pressure over most of the rest of the Arctic Ocean (Figure 2b). In Hudson Bay and Greenland, pressures were relatively high. The pattern in March that favored faster outflow of ice through Fram Strait did not persist into April.
April 2024 compared to previous years

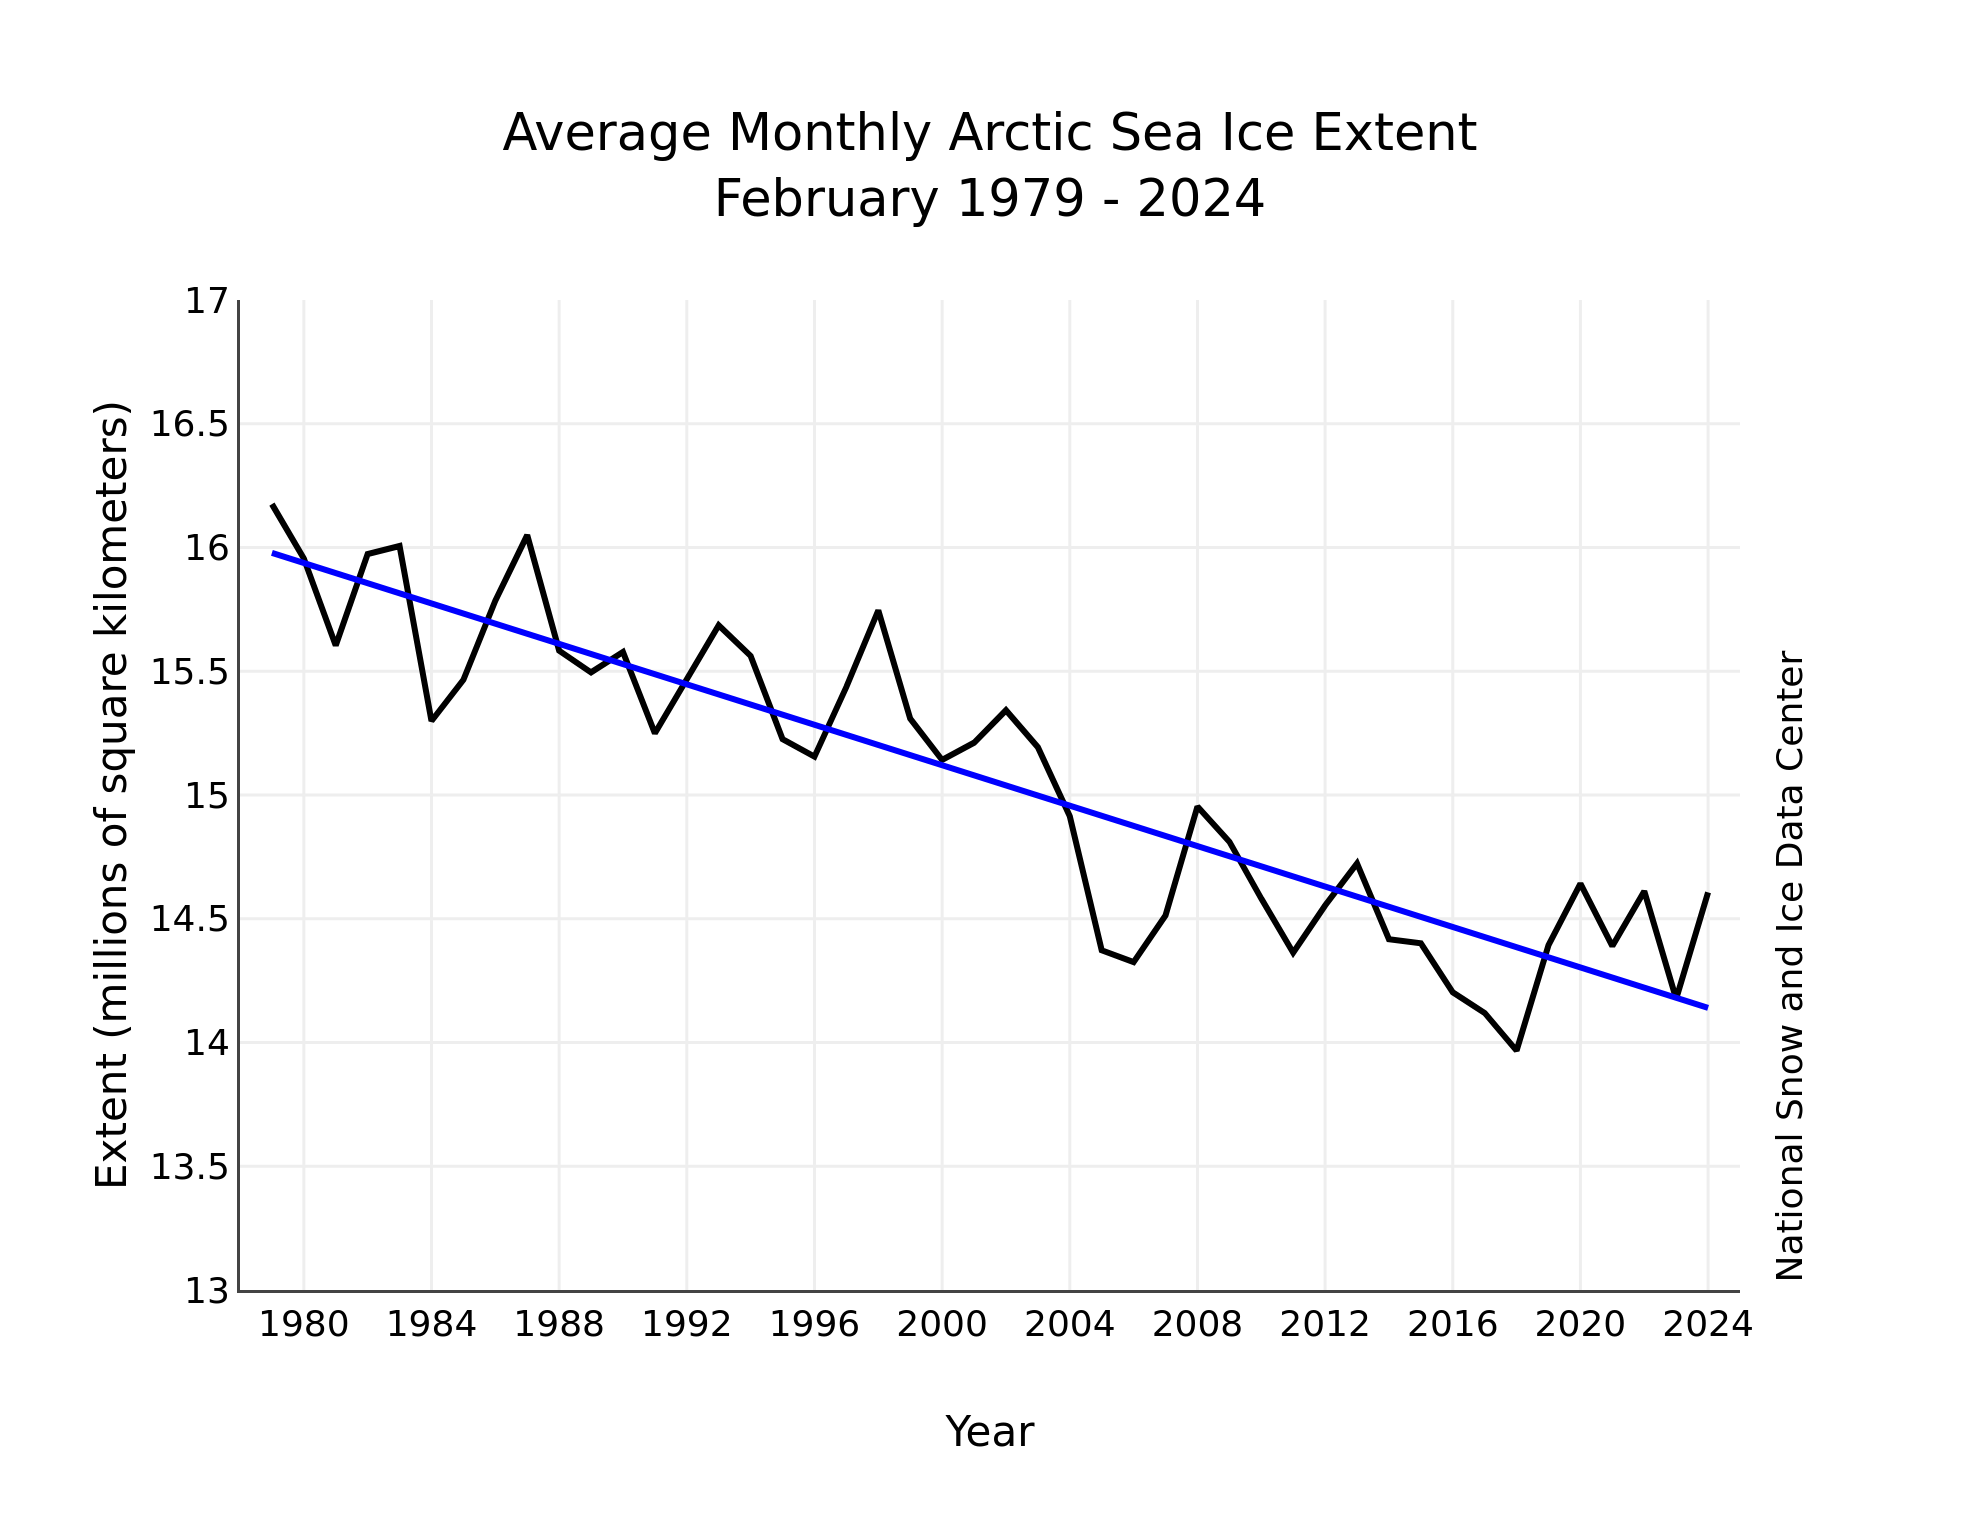
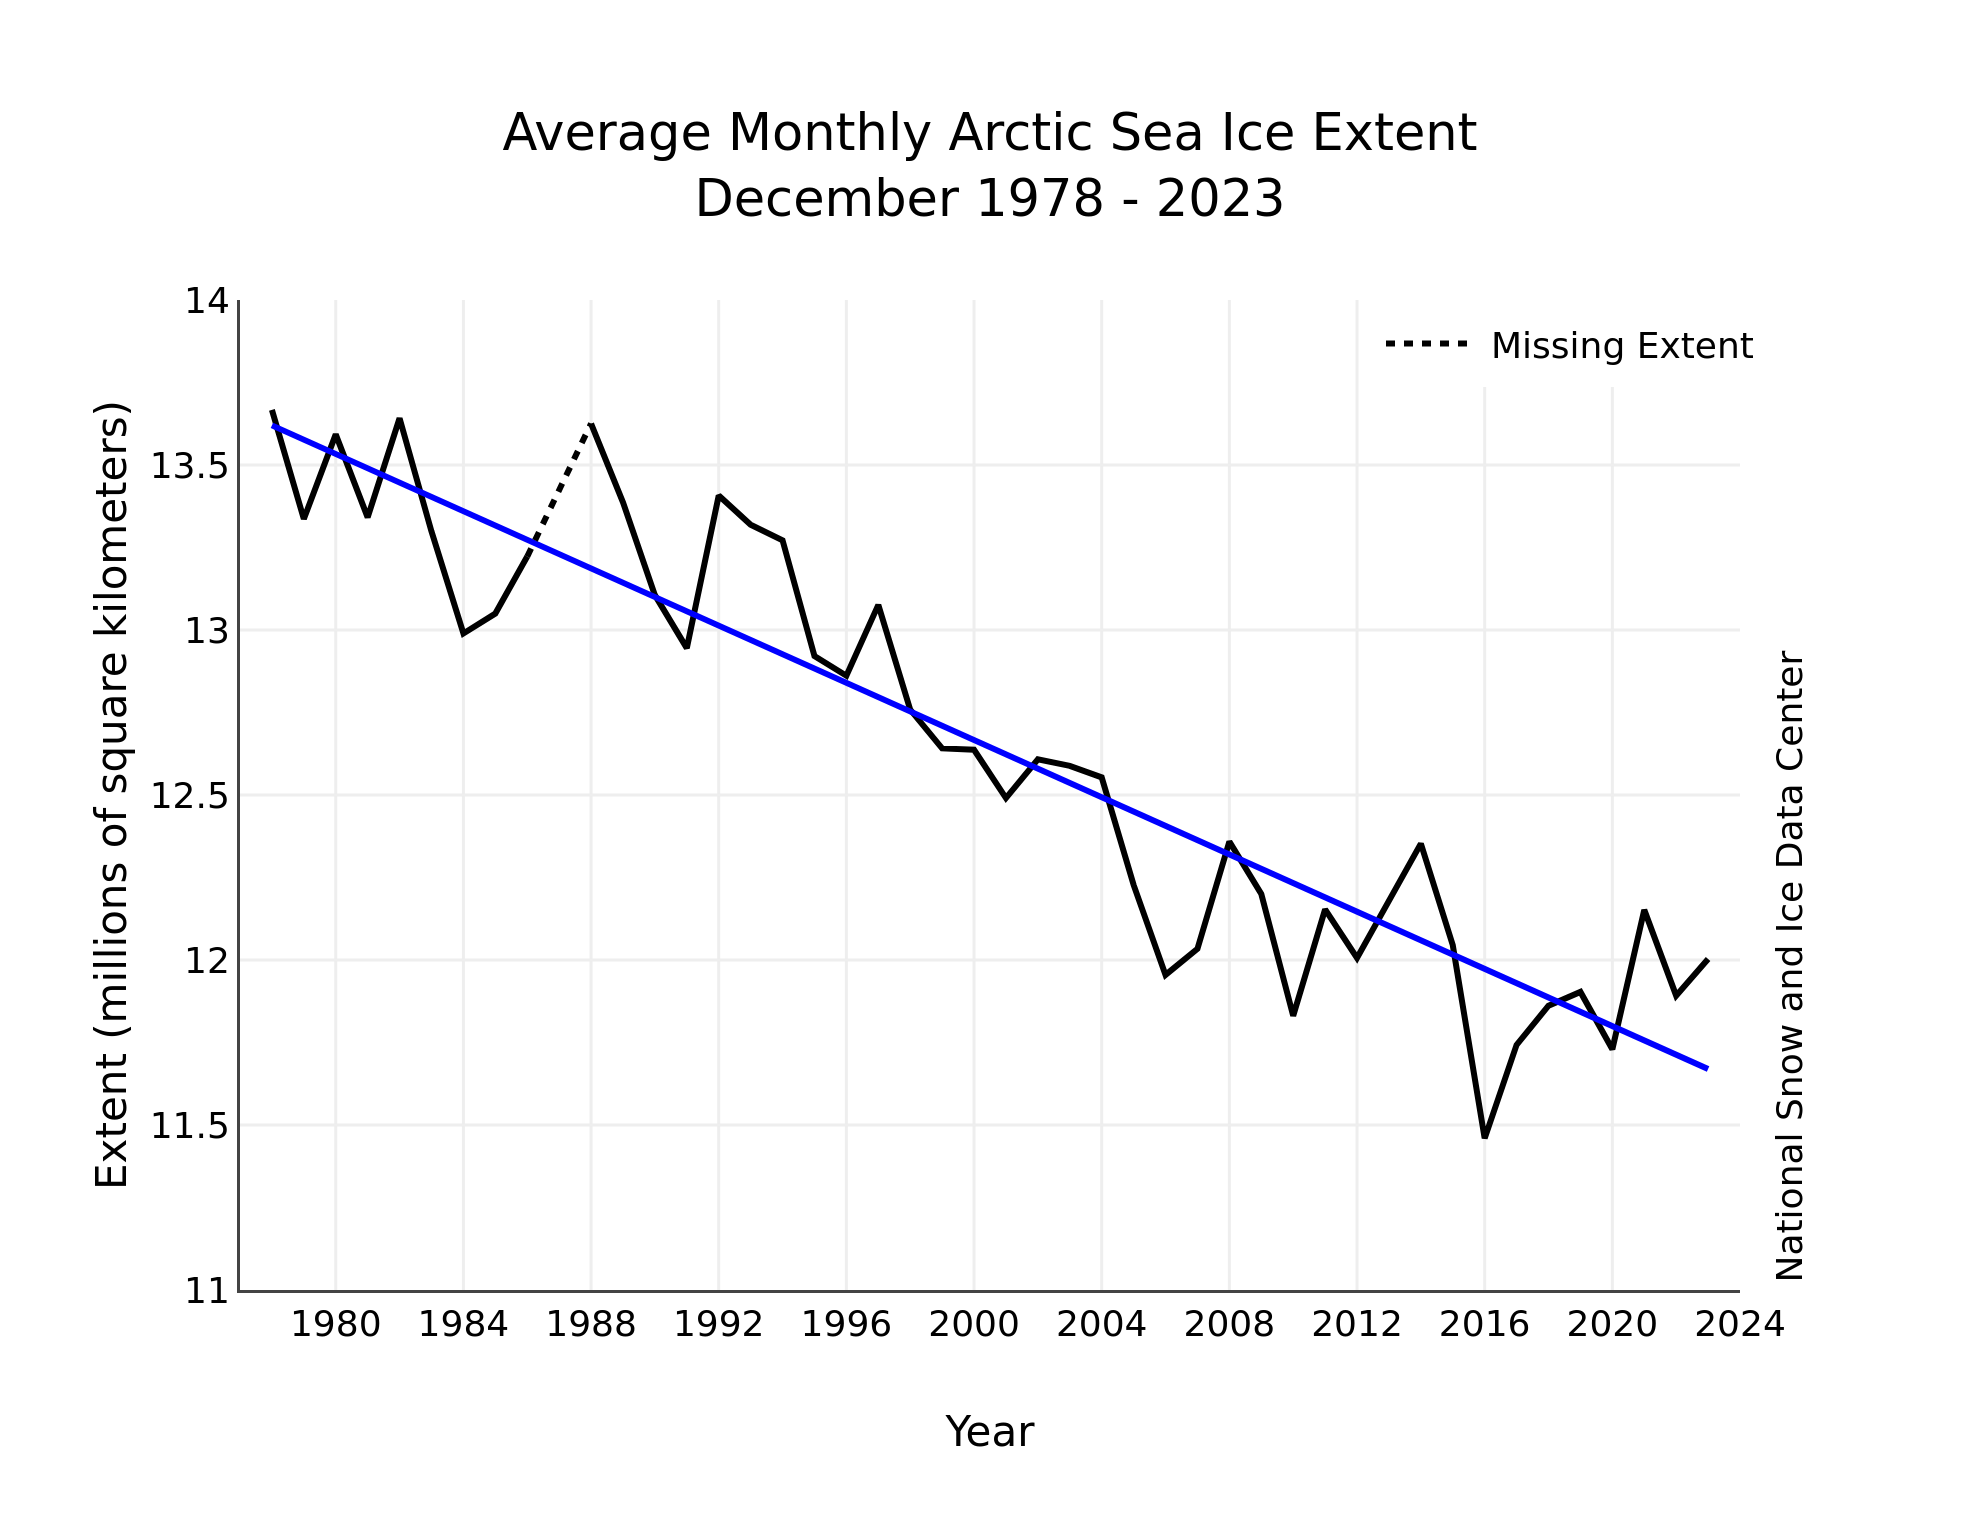
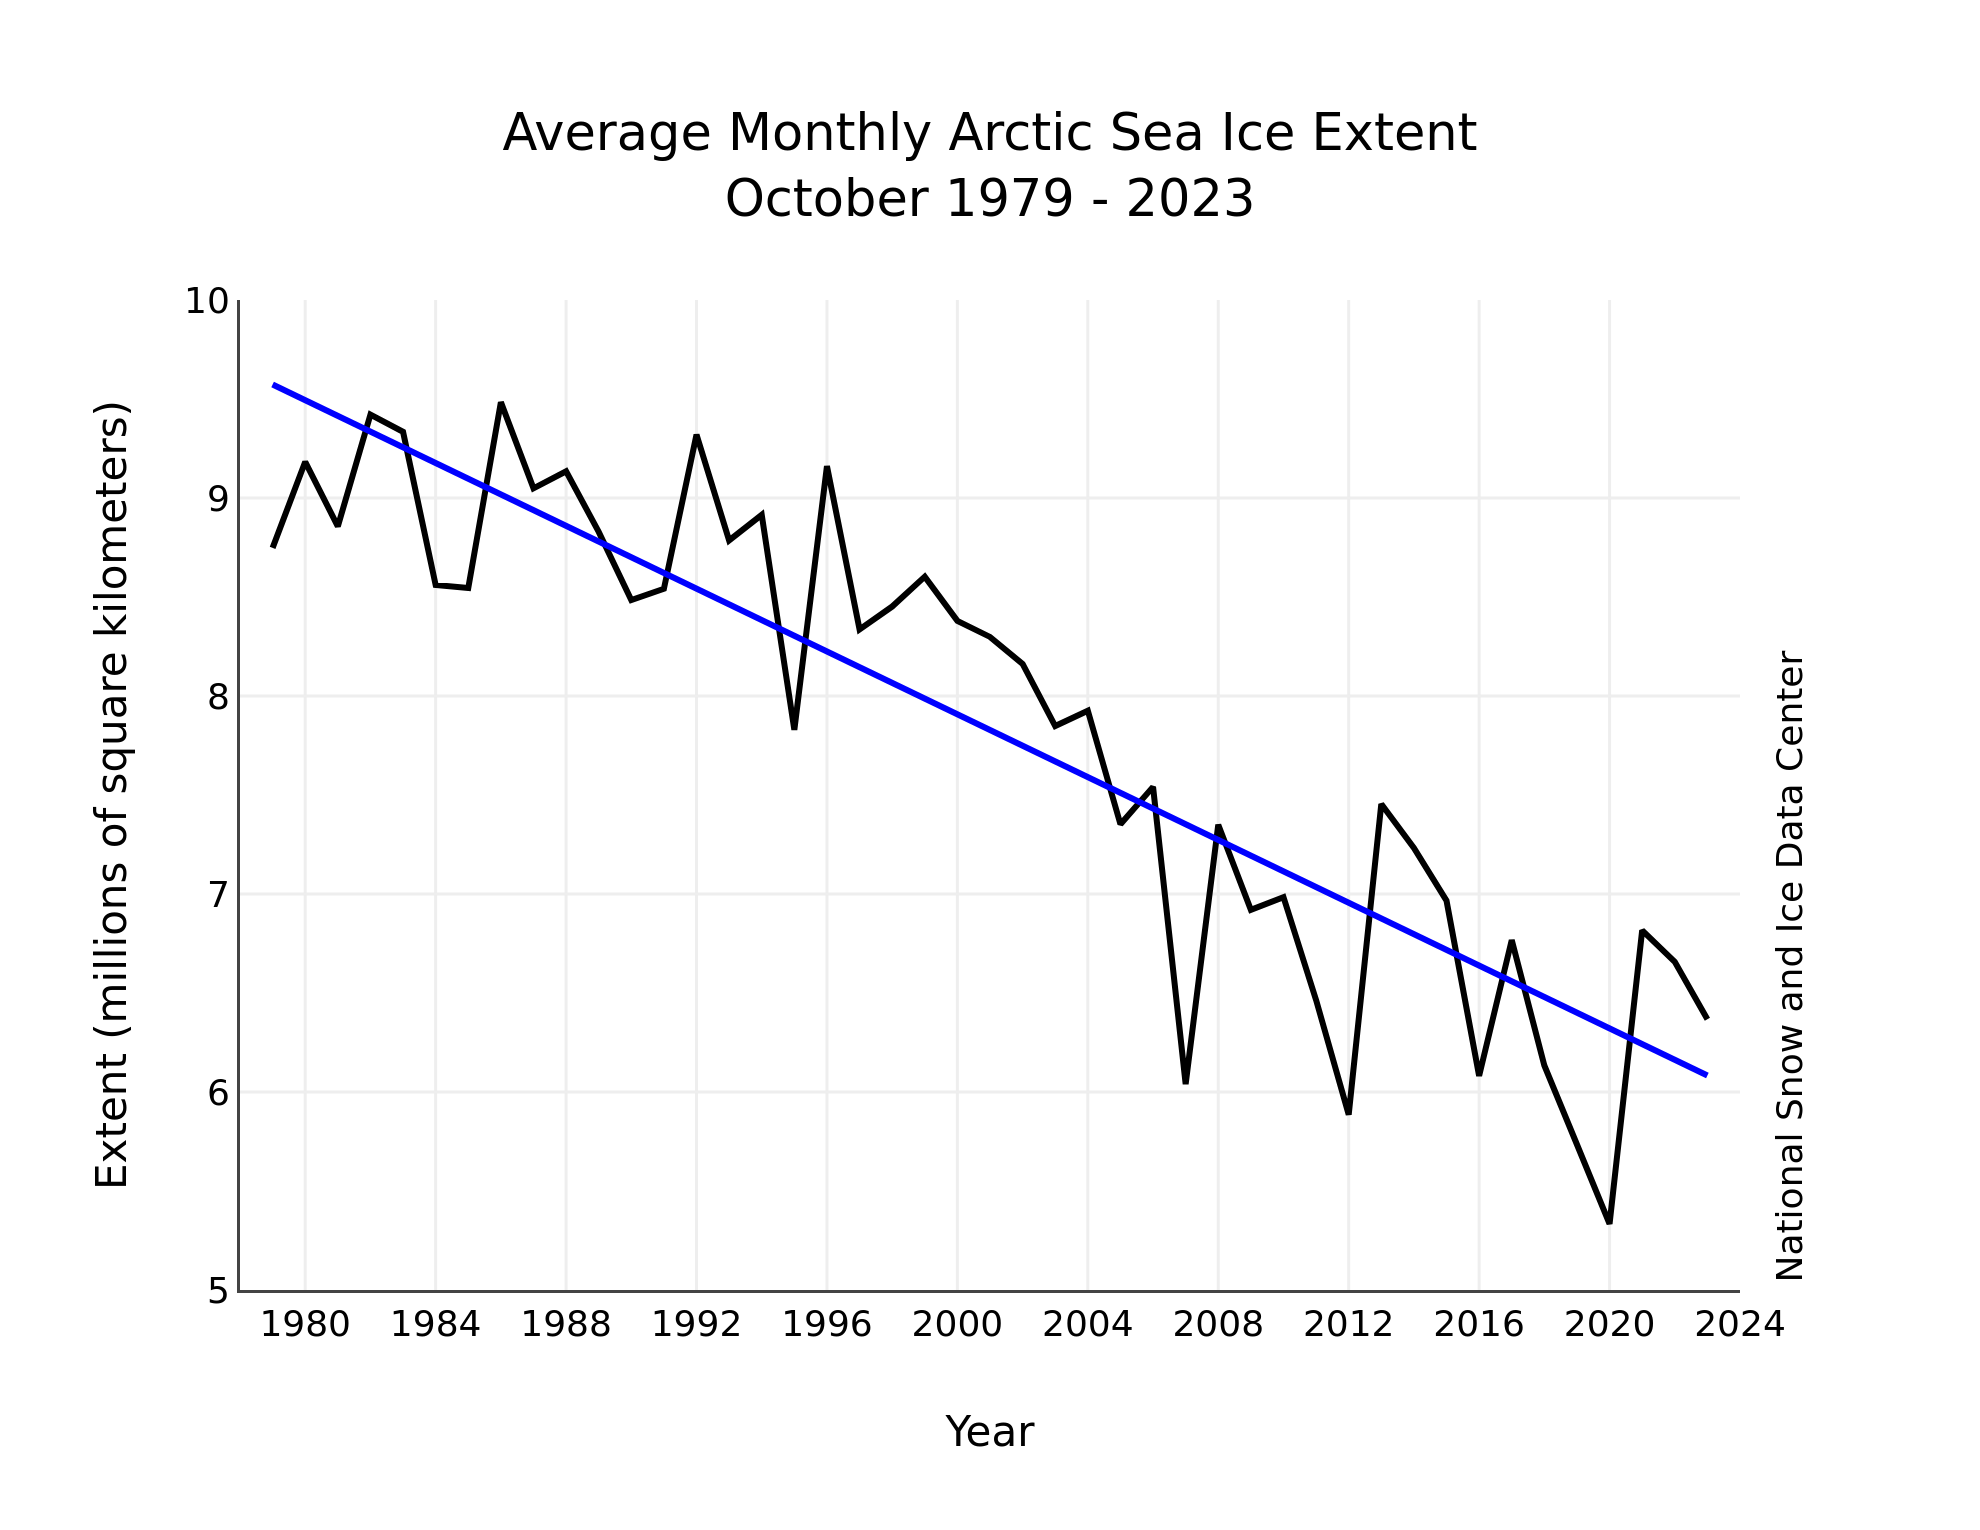
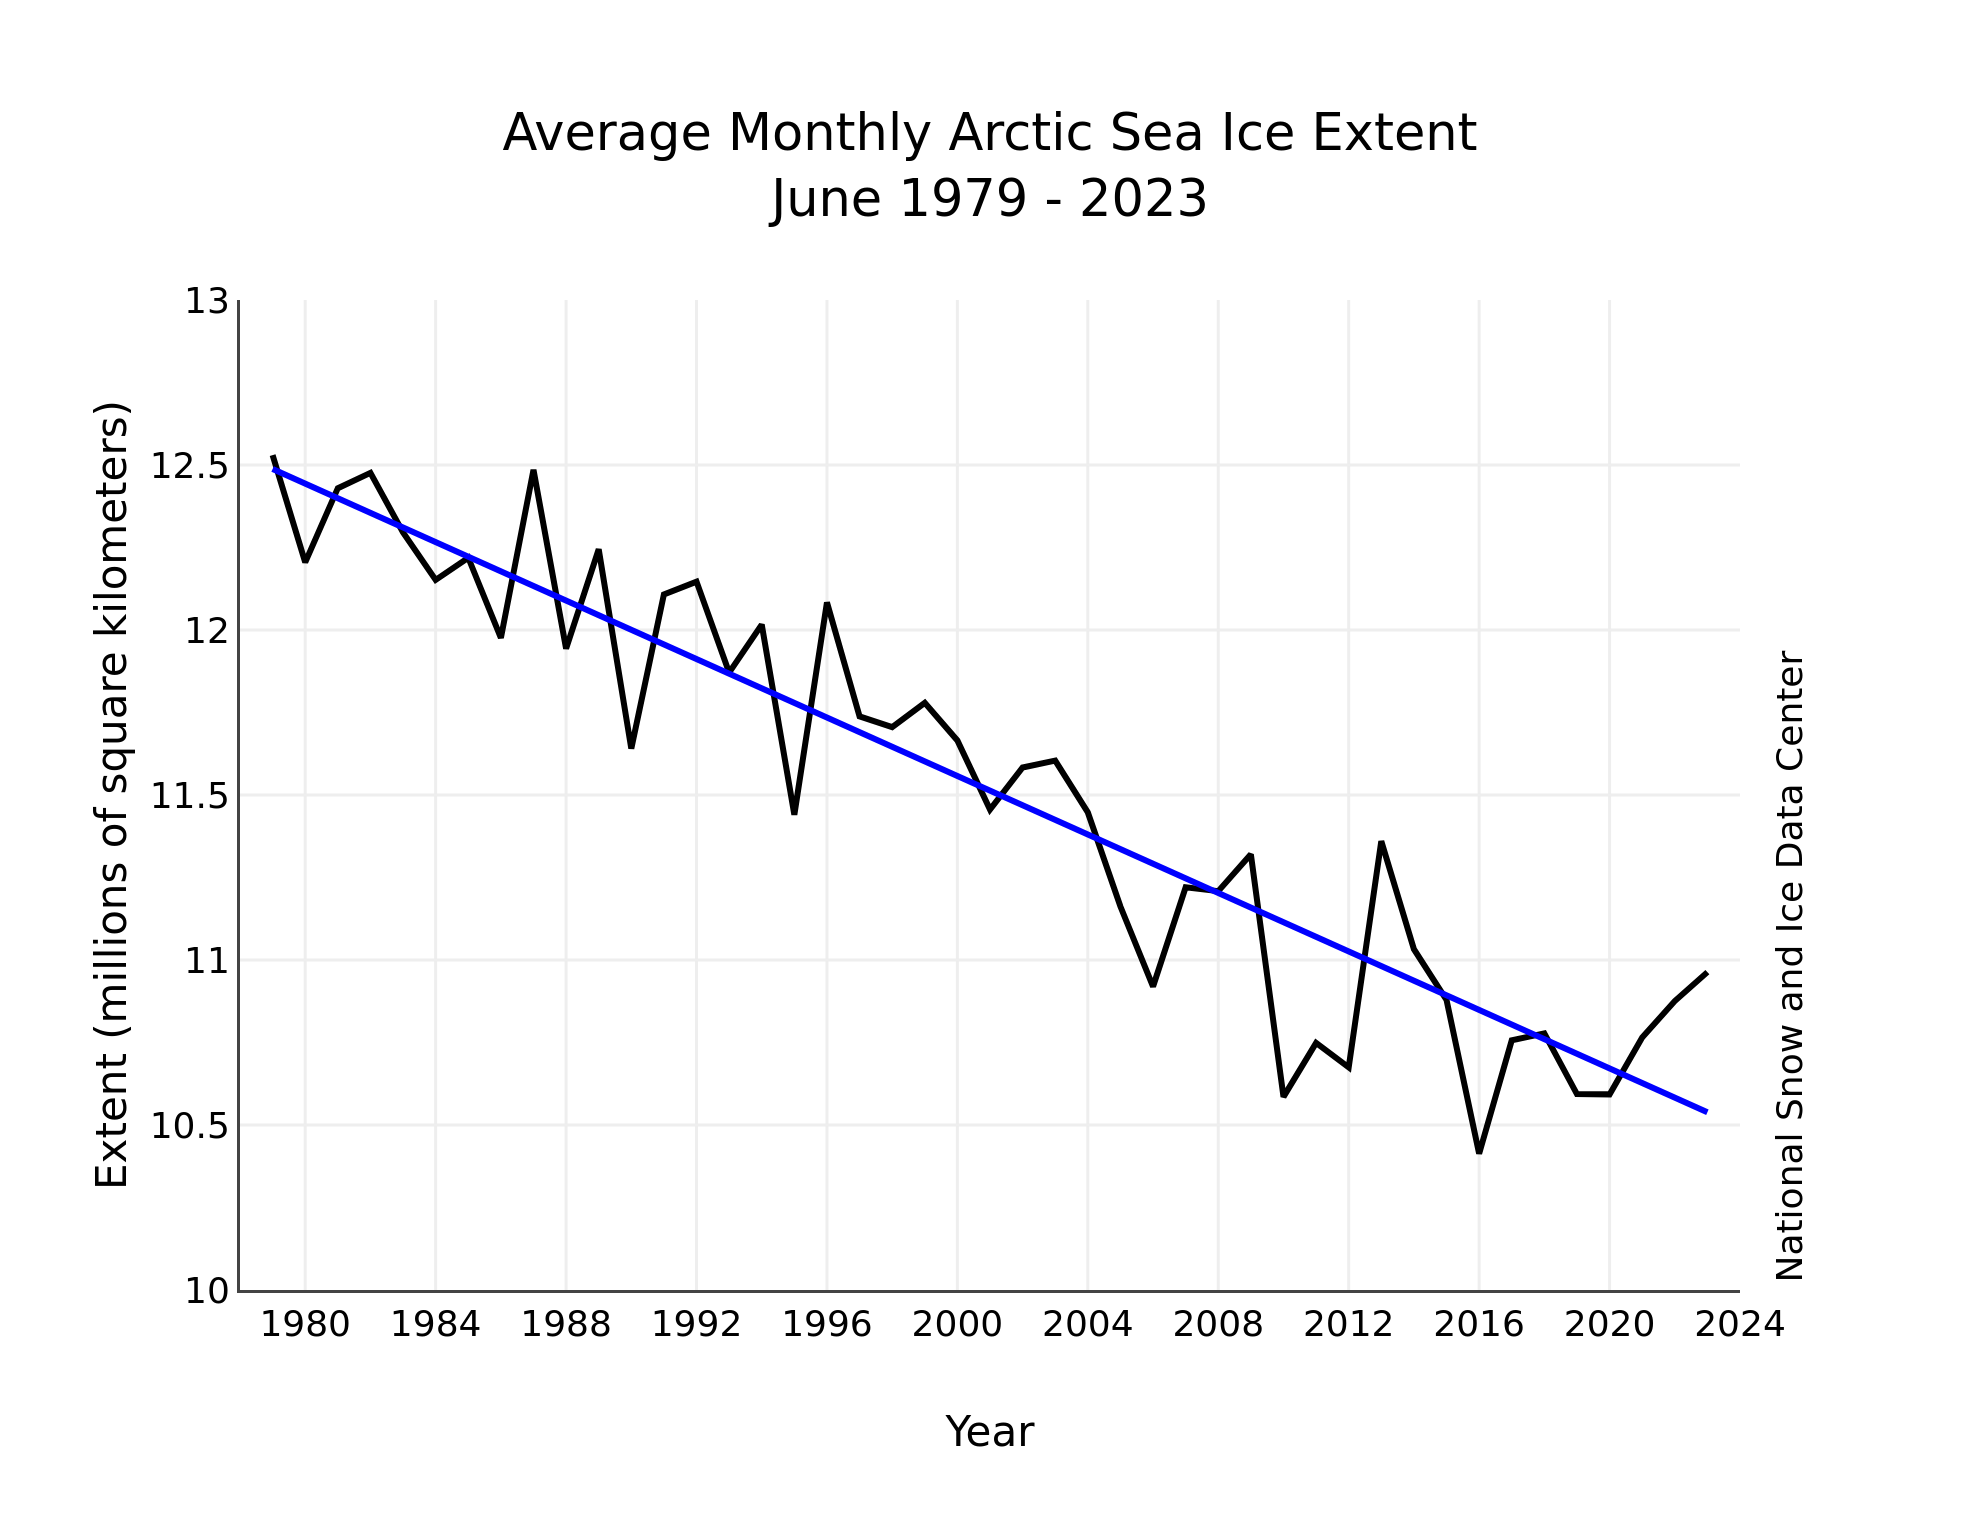
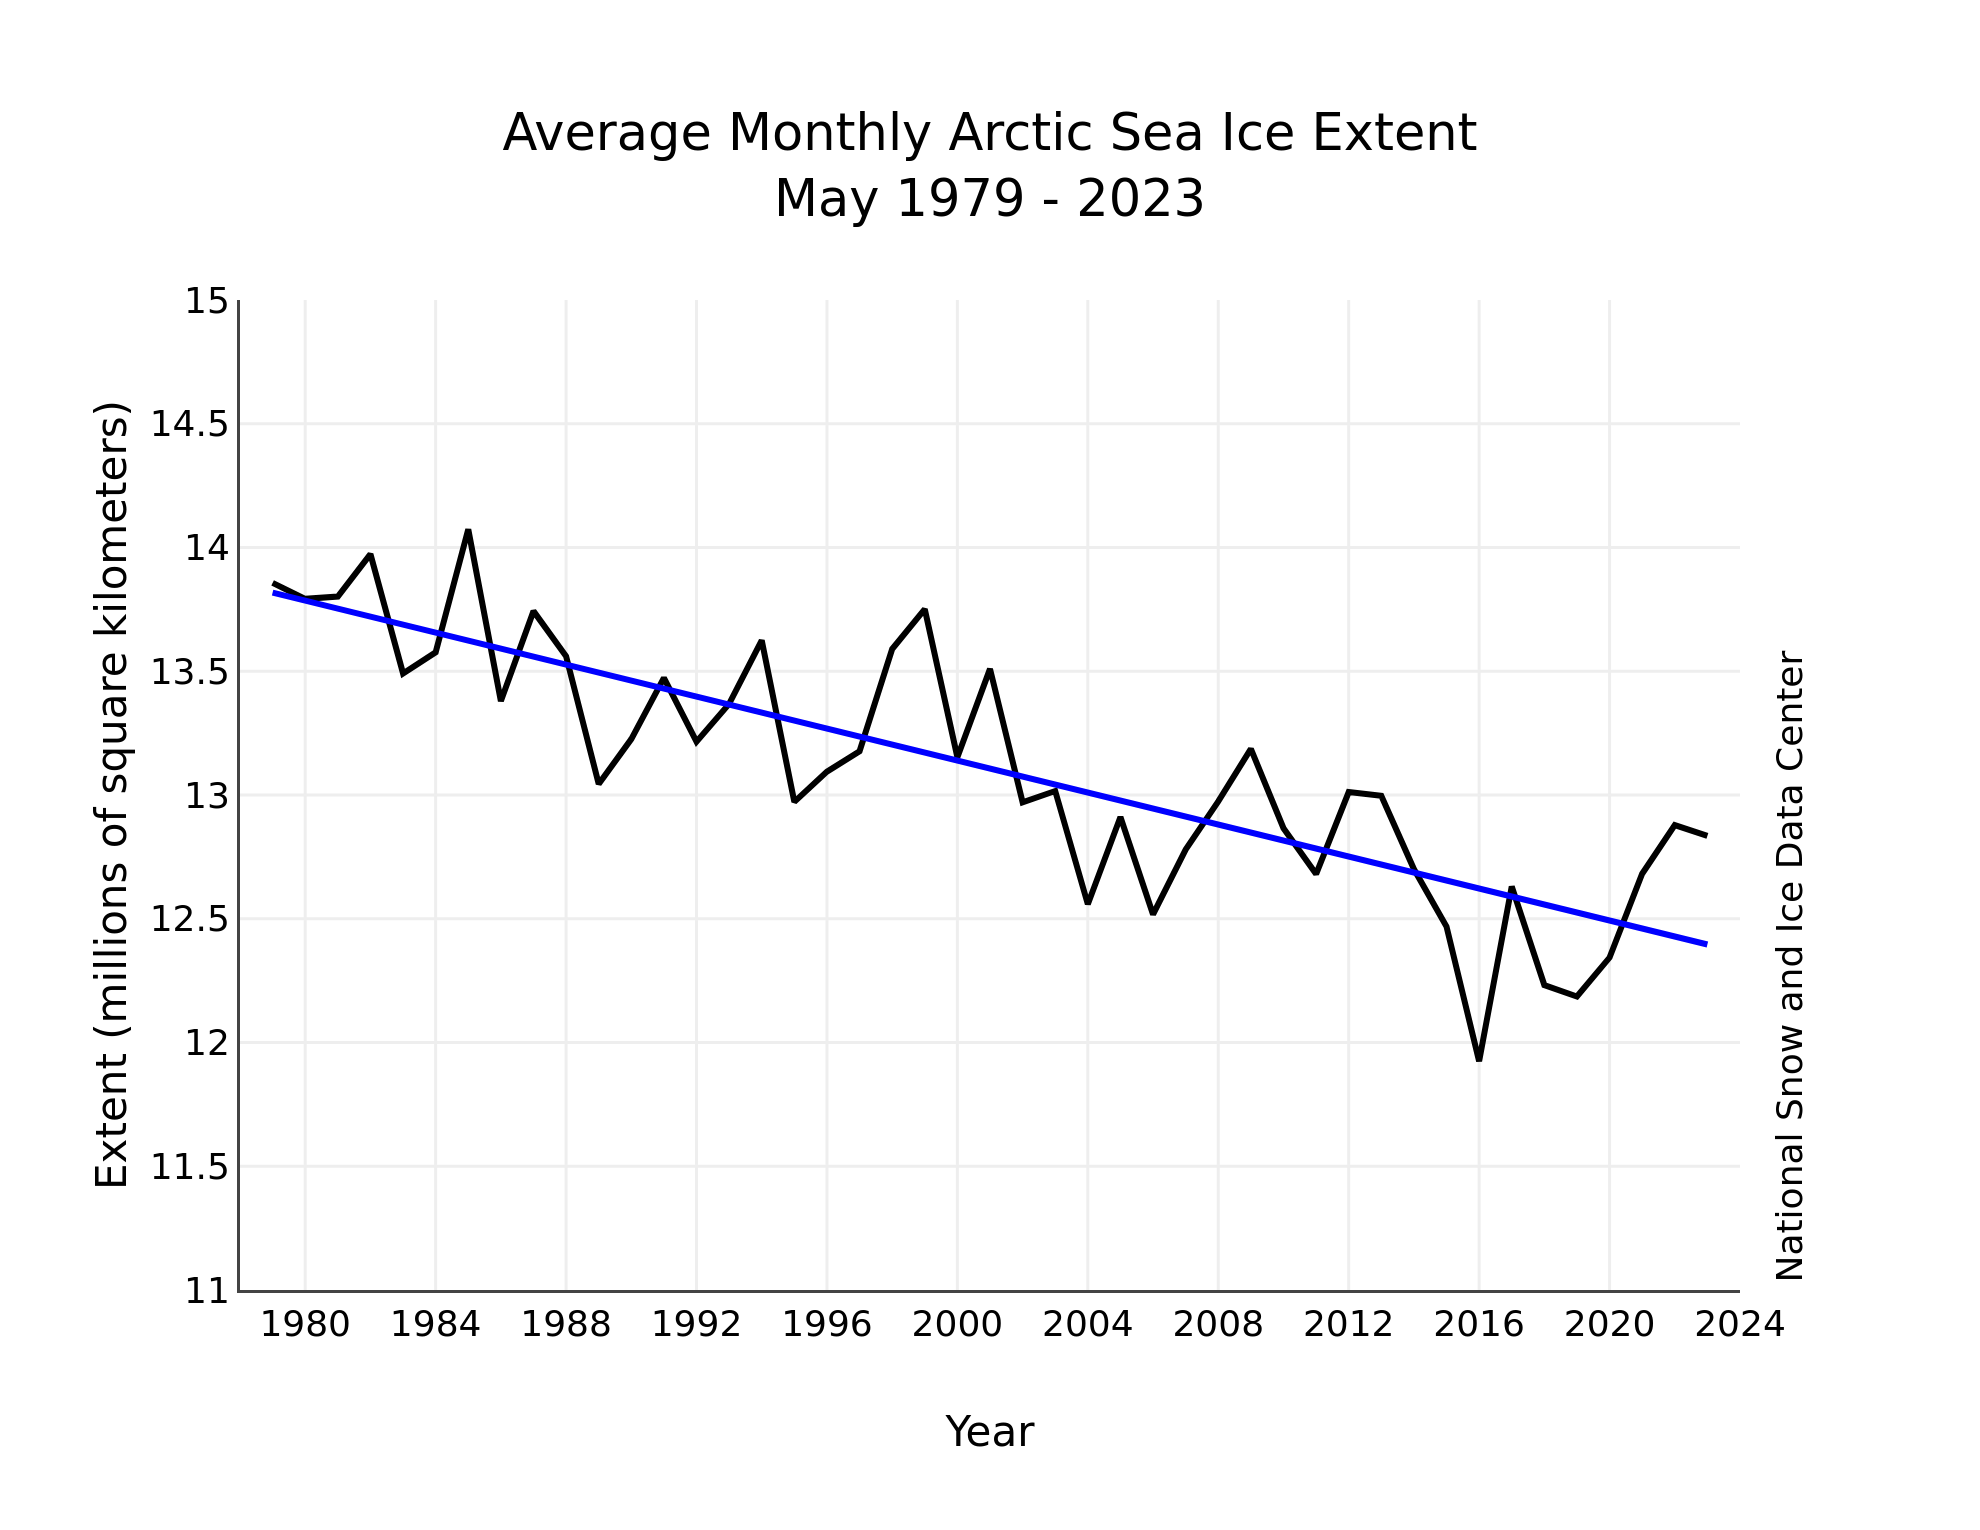
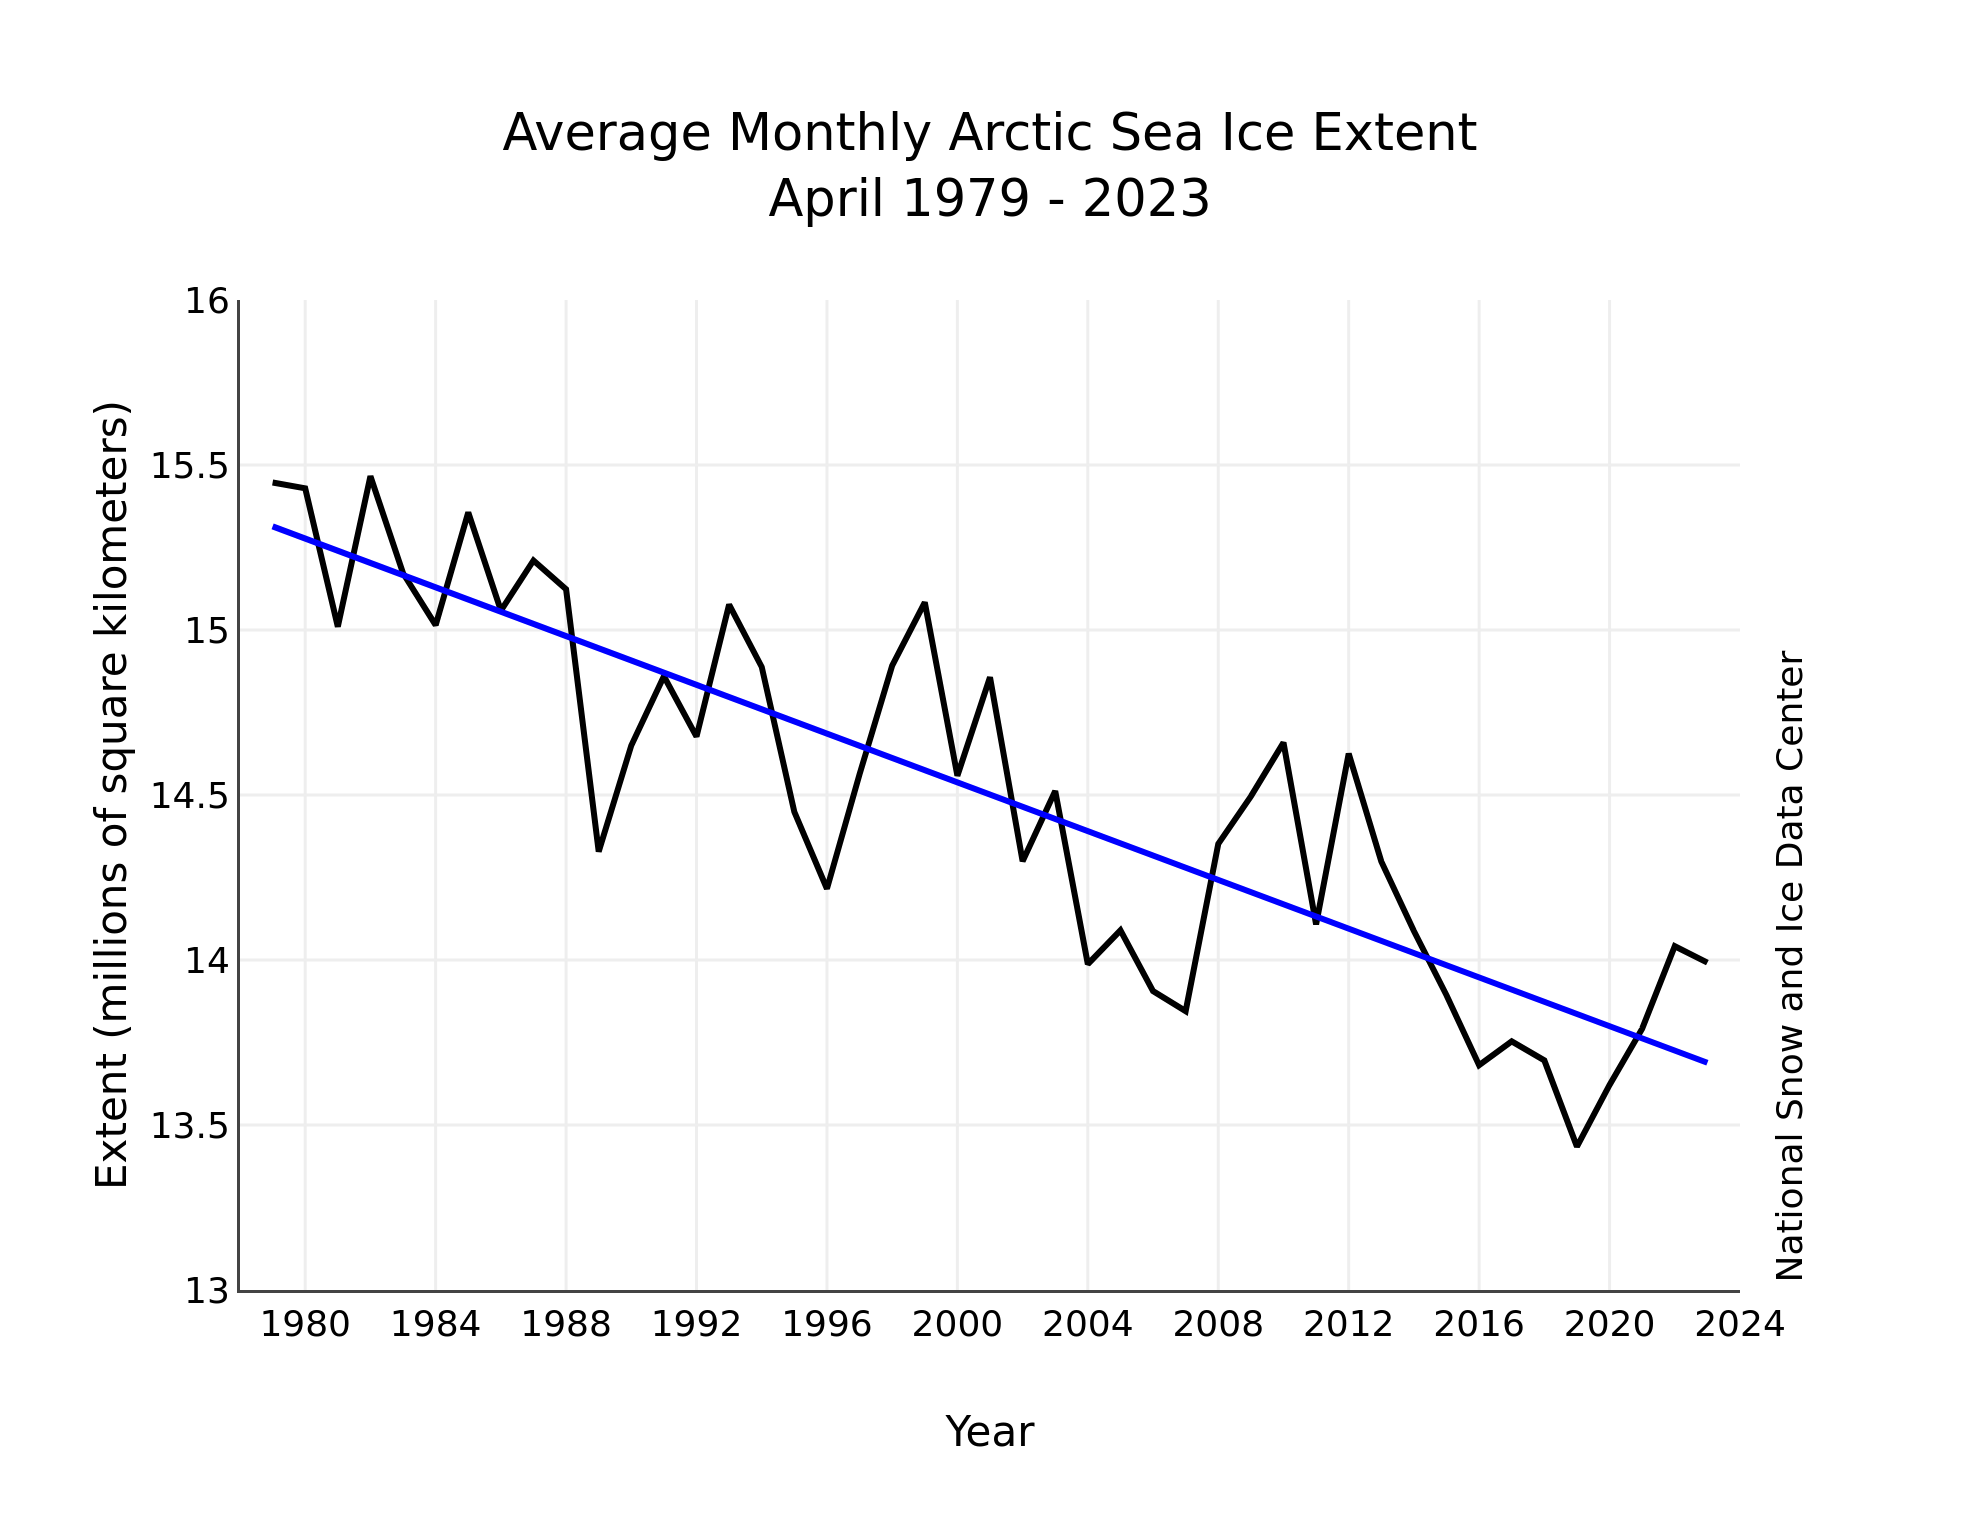
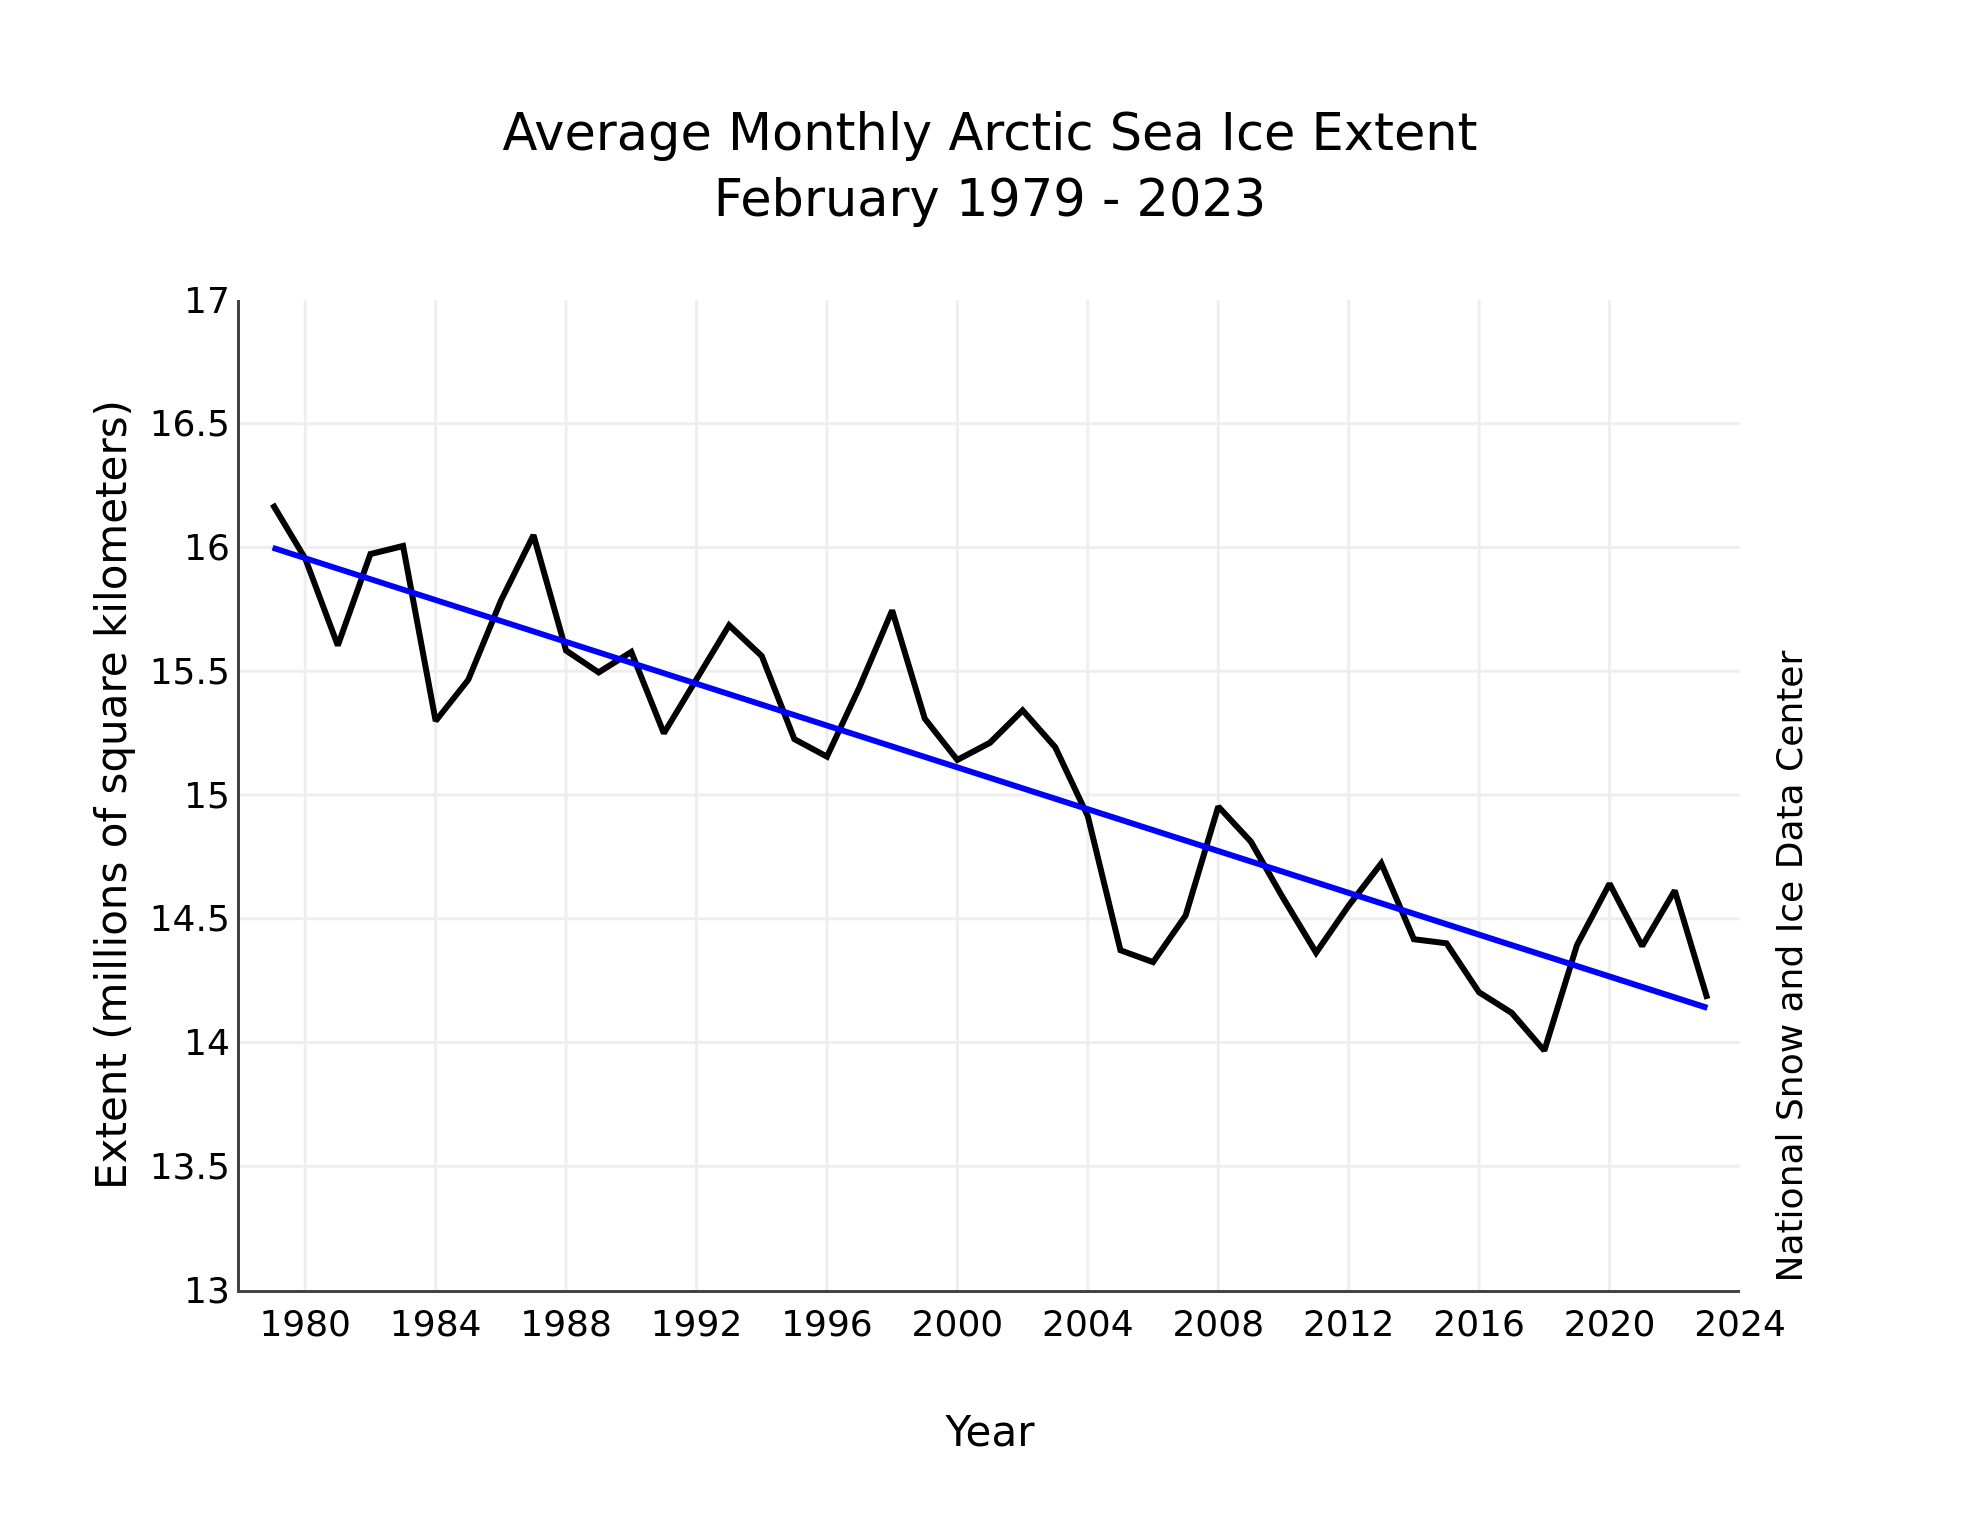
Figure 3. Monthly April ice extent for 1979 to 2024 shows a decline of 2.4 percent per decade.
Credit: National Snow and Ice Data Center
High-resolution image
Including 2024, the downward linear trend in April mean monthly sea ice extent was 36,000 square kilometers (14,000 square miles) per year, or 2.4 percent per decade relative to the 1981 to 2010 average (Figure 3). Based on the linear trend since 1979, April has lost 1.61 million square kilometers (622,000 square miles) of sea ice, which is roughly equivalent to six times the size of Colorado. April 2024 had the highest sea ice extent for the month in 12 years.
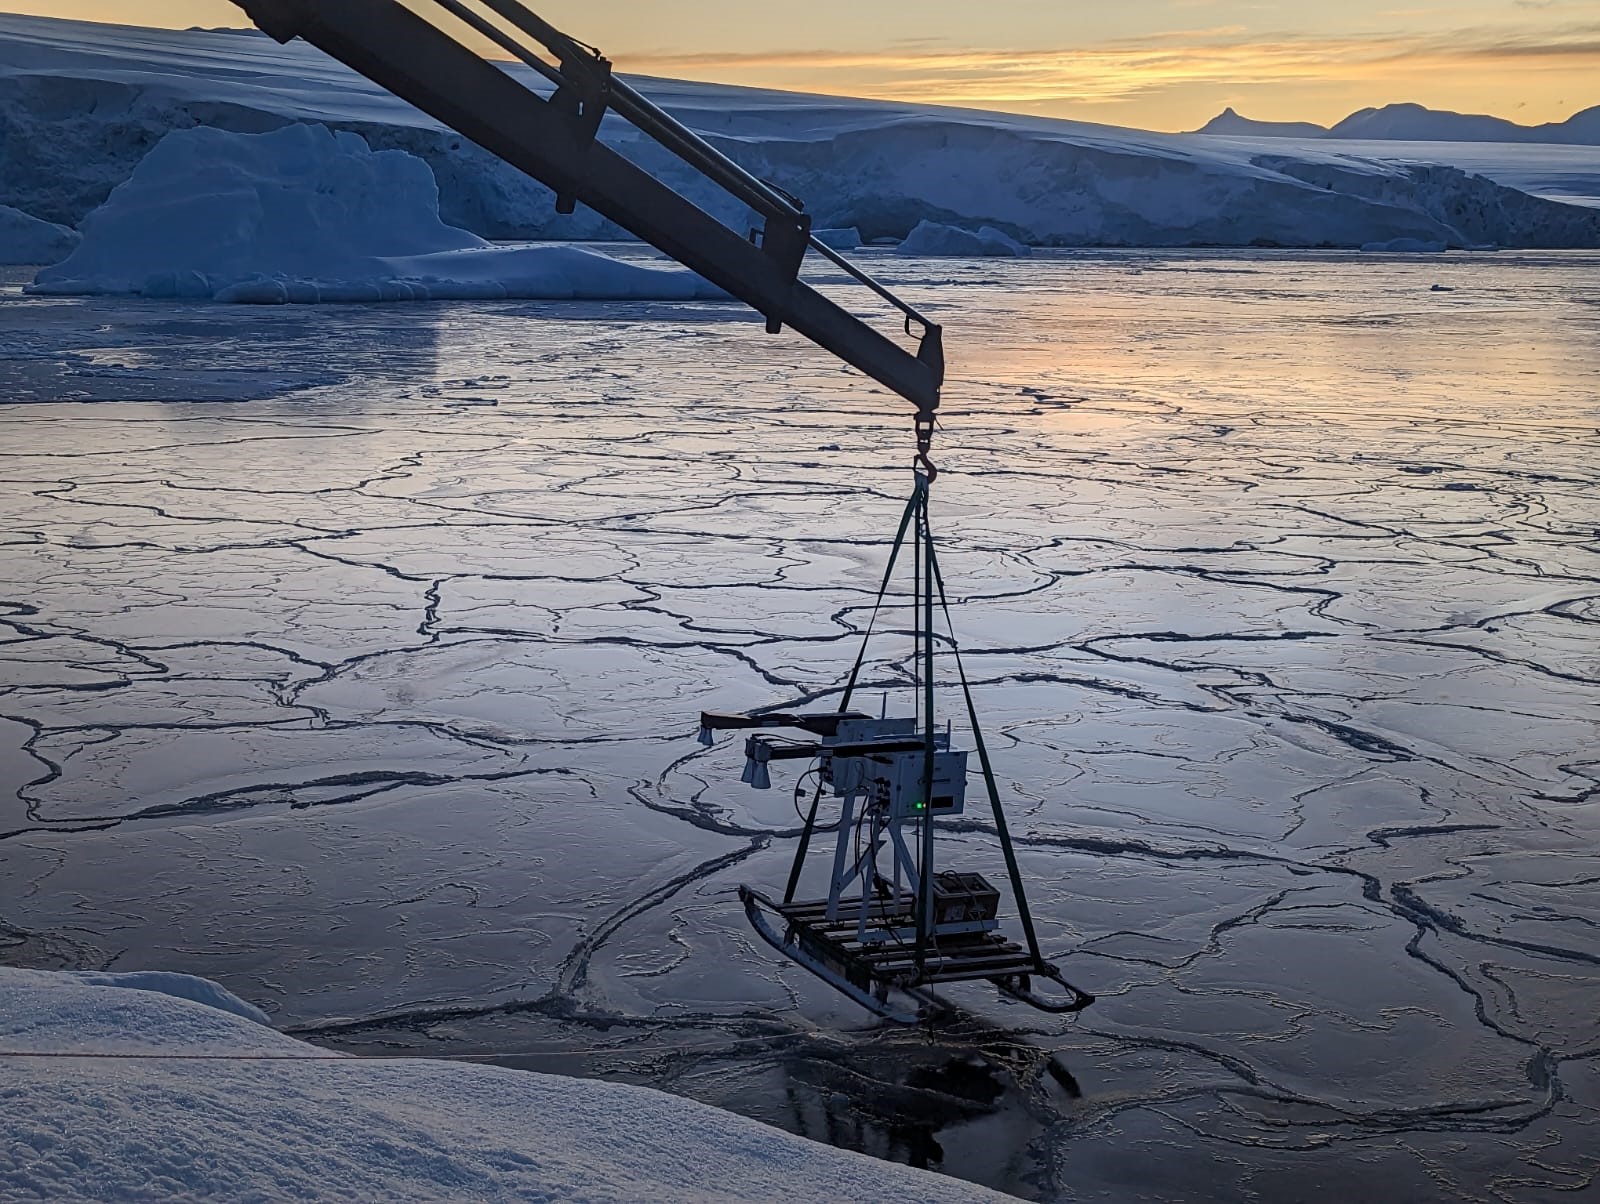
Lightening the mood in the Arctic

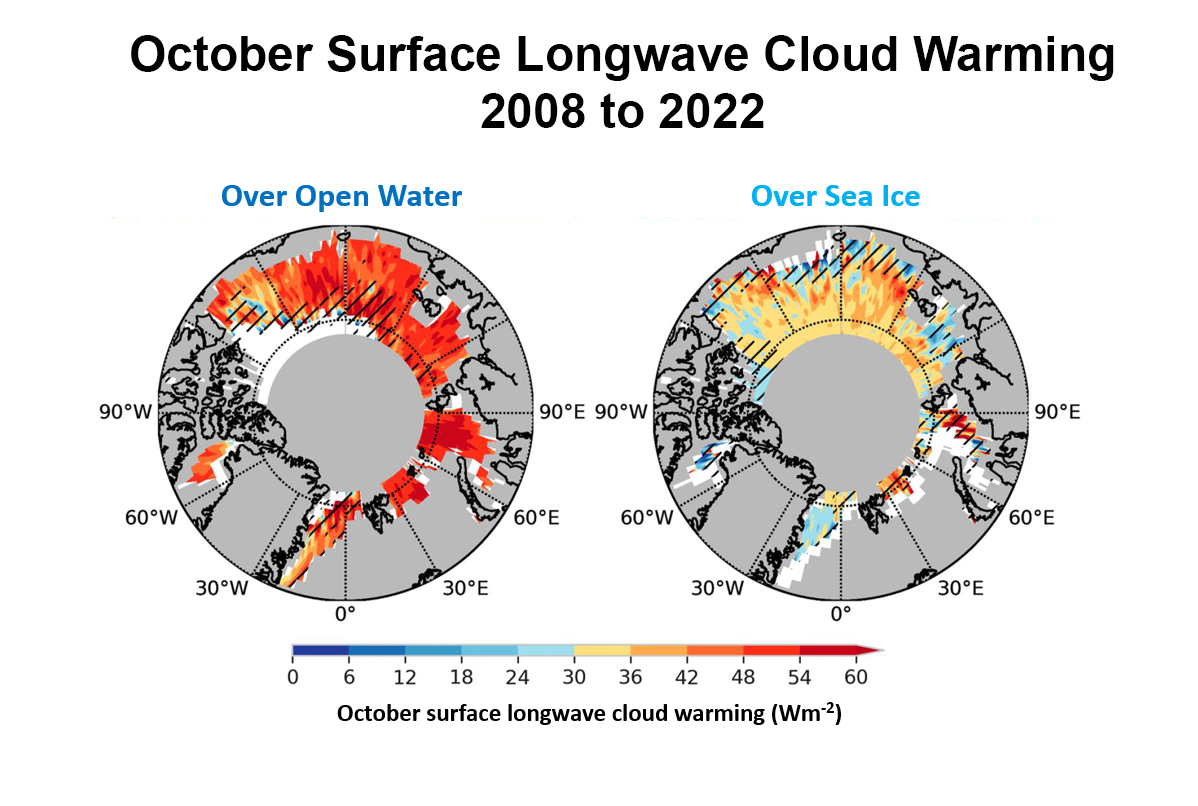
Figure 4. This set of figures shows the timing of under-ice algae bloom onset from blending CryoSat-2 (CS2), Sentinel-3 (S3), and ICESat-2 (IS2)-derived sea ice thickness data. The color bar refers to the day of the year (DOY) that enough light passes through the snow cover and sea ice to spark an algae bloom. S3 data were only available in 2019 and 2020. Missing data in 2021 and 2022 around 80N reflects missing albedo data in the Advanced Very High Resolution Radiometer (AVHRR) APP-X data product.
Credit: Stroeve et al. 2024
High-resolution image
When sea ice extent shrinks and thins, and there is less snow cover, more light enters the water deeper. Light is a primary driver for sea ice algae and phytoplankton blooms, which form the base of the Arctic marine foodchain. To determine the timing of when enough light is present to initiate an ice algal bloom, NSIDC scientist Julienne Stroeve and others took existing satellite data products and combined them with information on light extinction properties through snow and ice. Light extinction implies the amount of dimming as light passes through ice, beginning at 100 percent (high) and dropping to 10 percent at the base of the ice. This has only been possible recently, with the development of accurate daily sea ice thickness products blended from CryoSat-2, Sentinel-3, and the Ice, Cloud and land Elevation Satellite-2 (ICESat-2).
Figure 4 illustrates the timing of bloom onset from 2019 to 2022, highlighting large year-to-year variability that reflects variability in snow depth over sea ice. In 2019, for example, bloom onset occurred at the end of February in the Beaufort Sea, whereas in 2022 the bloom onset occurred between mid-March to early April. In general, bloom onset starts about a month earlier in the marginal ice zone than it does in the central Arctic Ocean.
Antarctic note

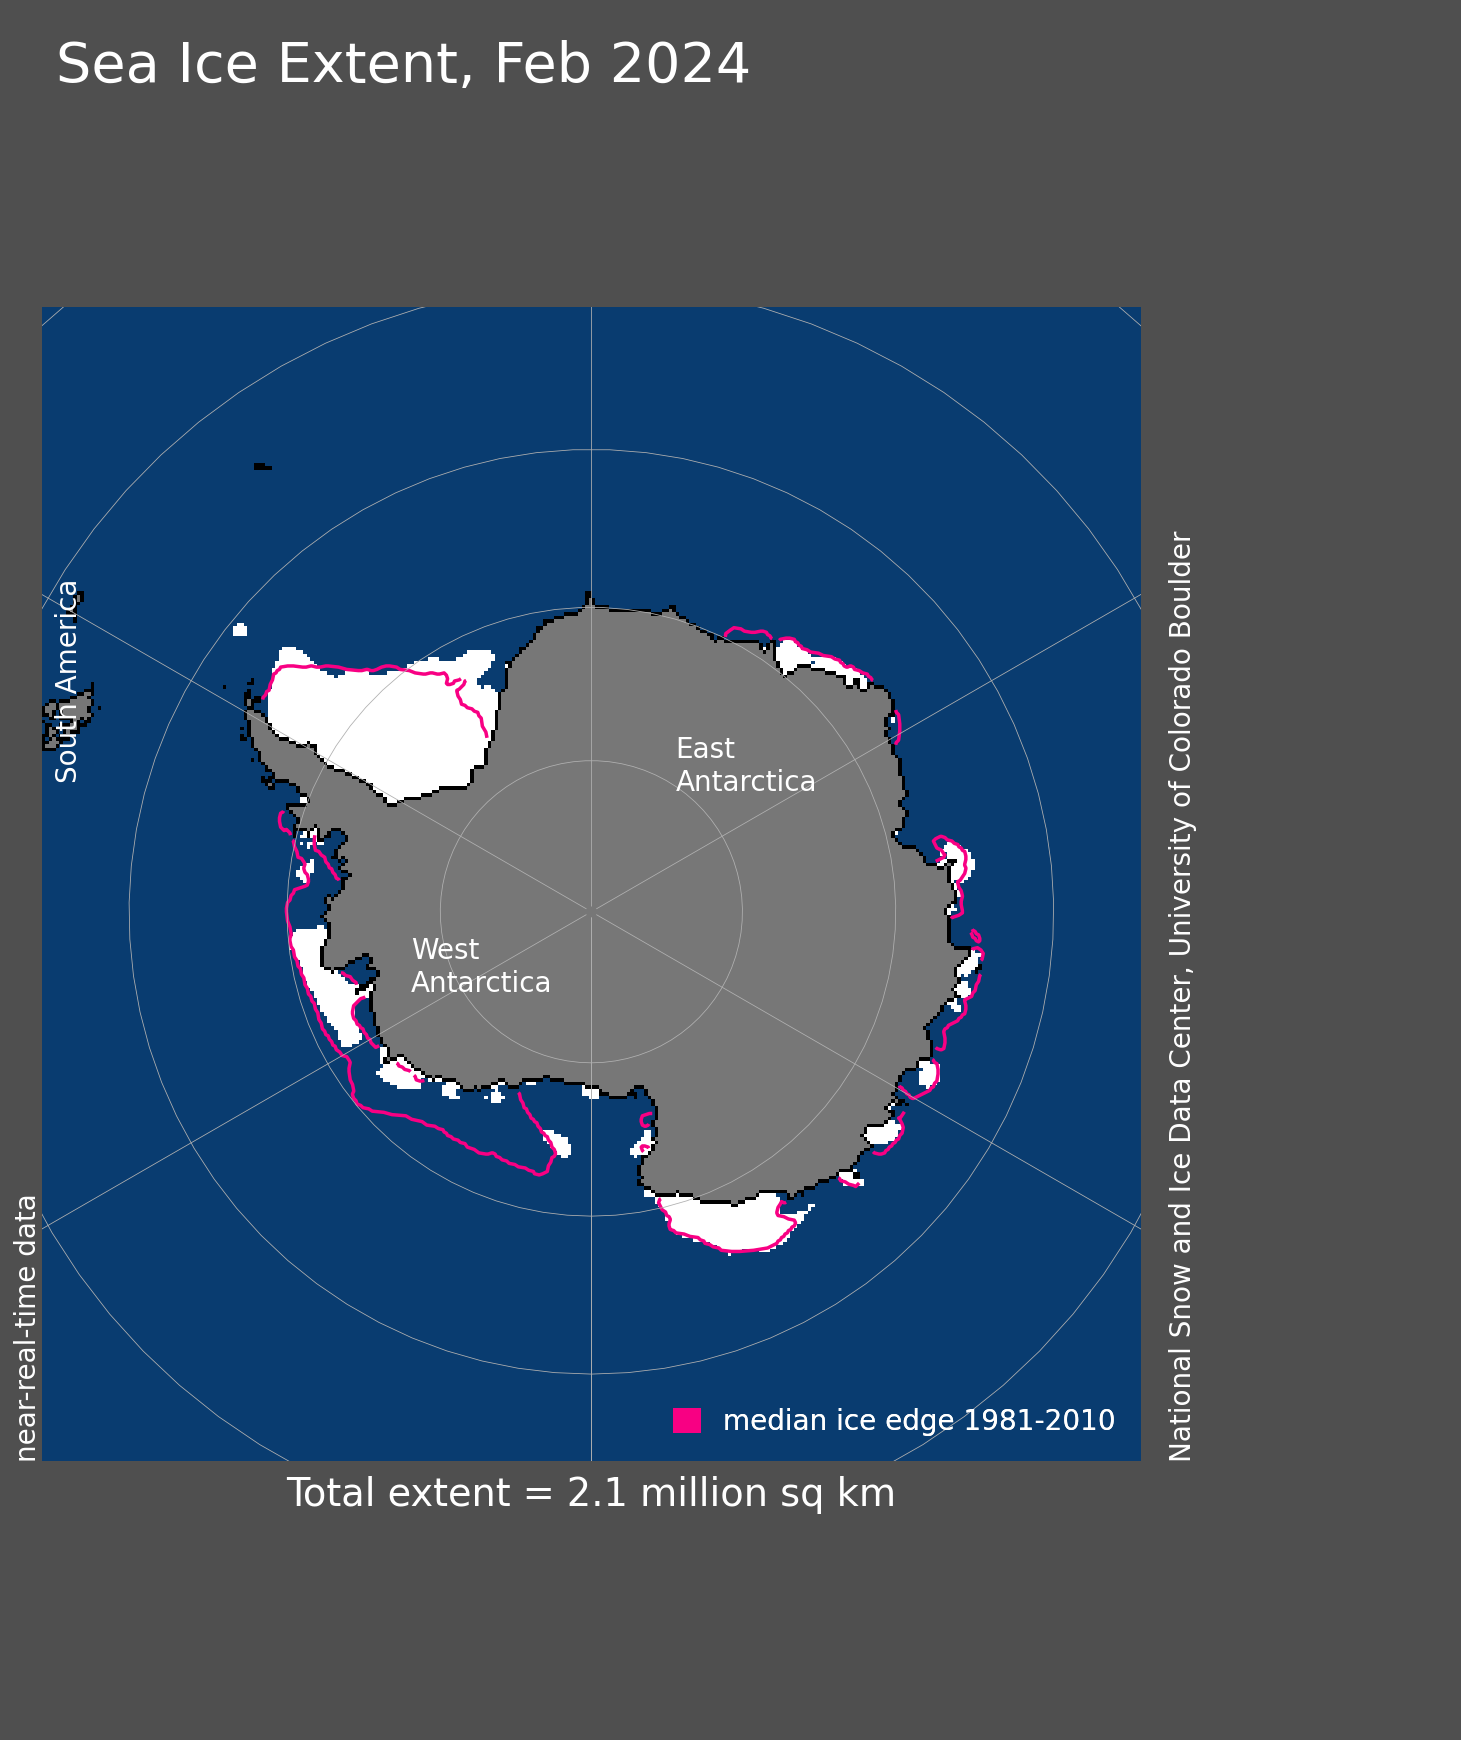
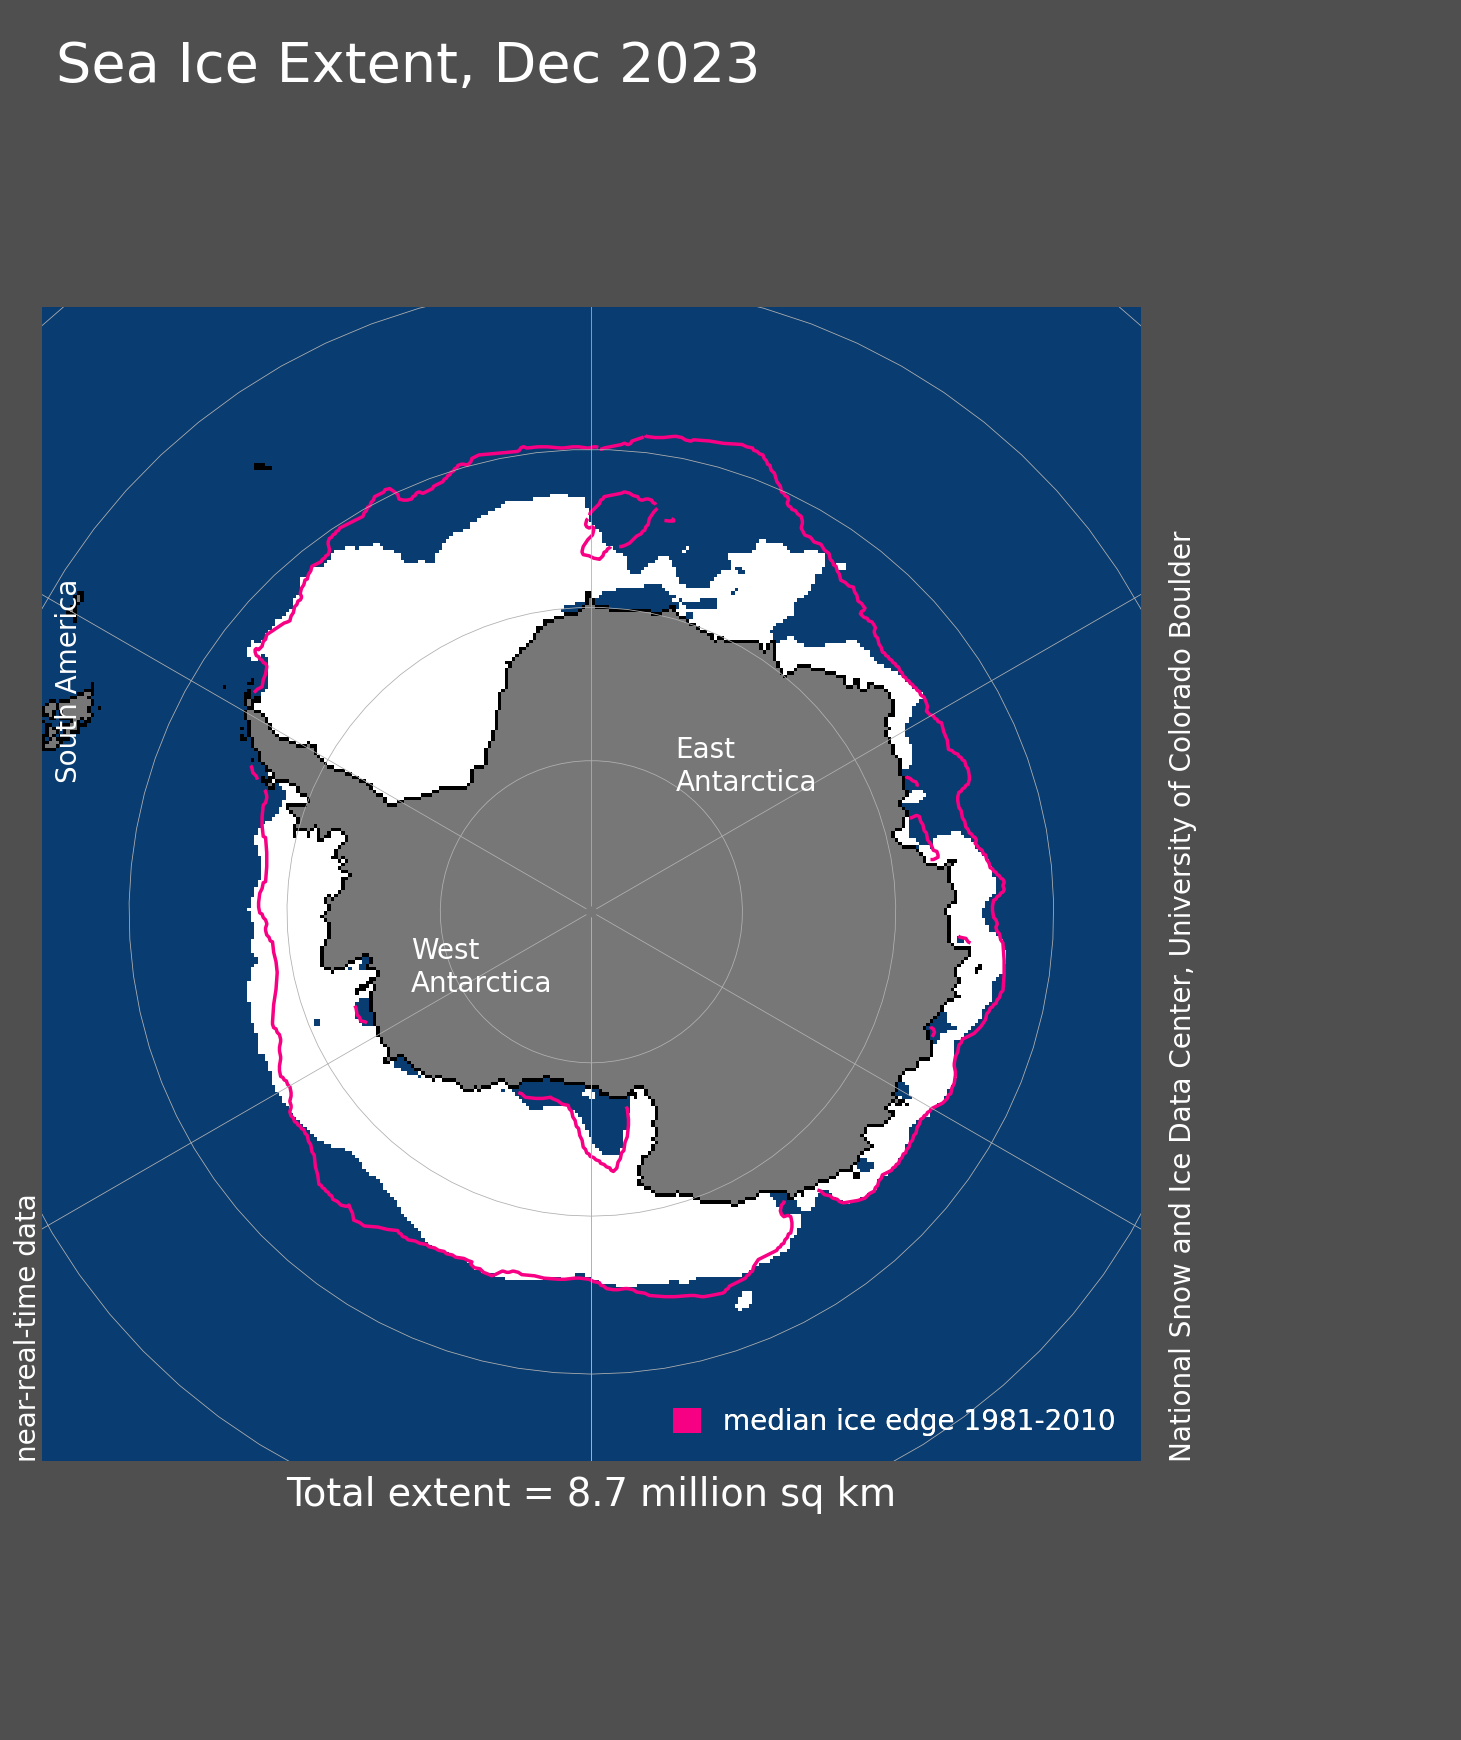
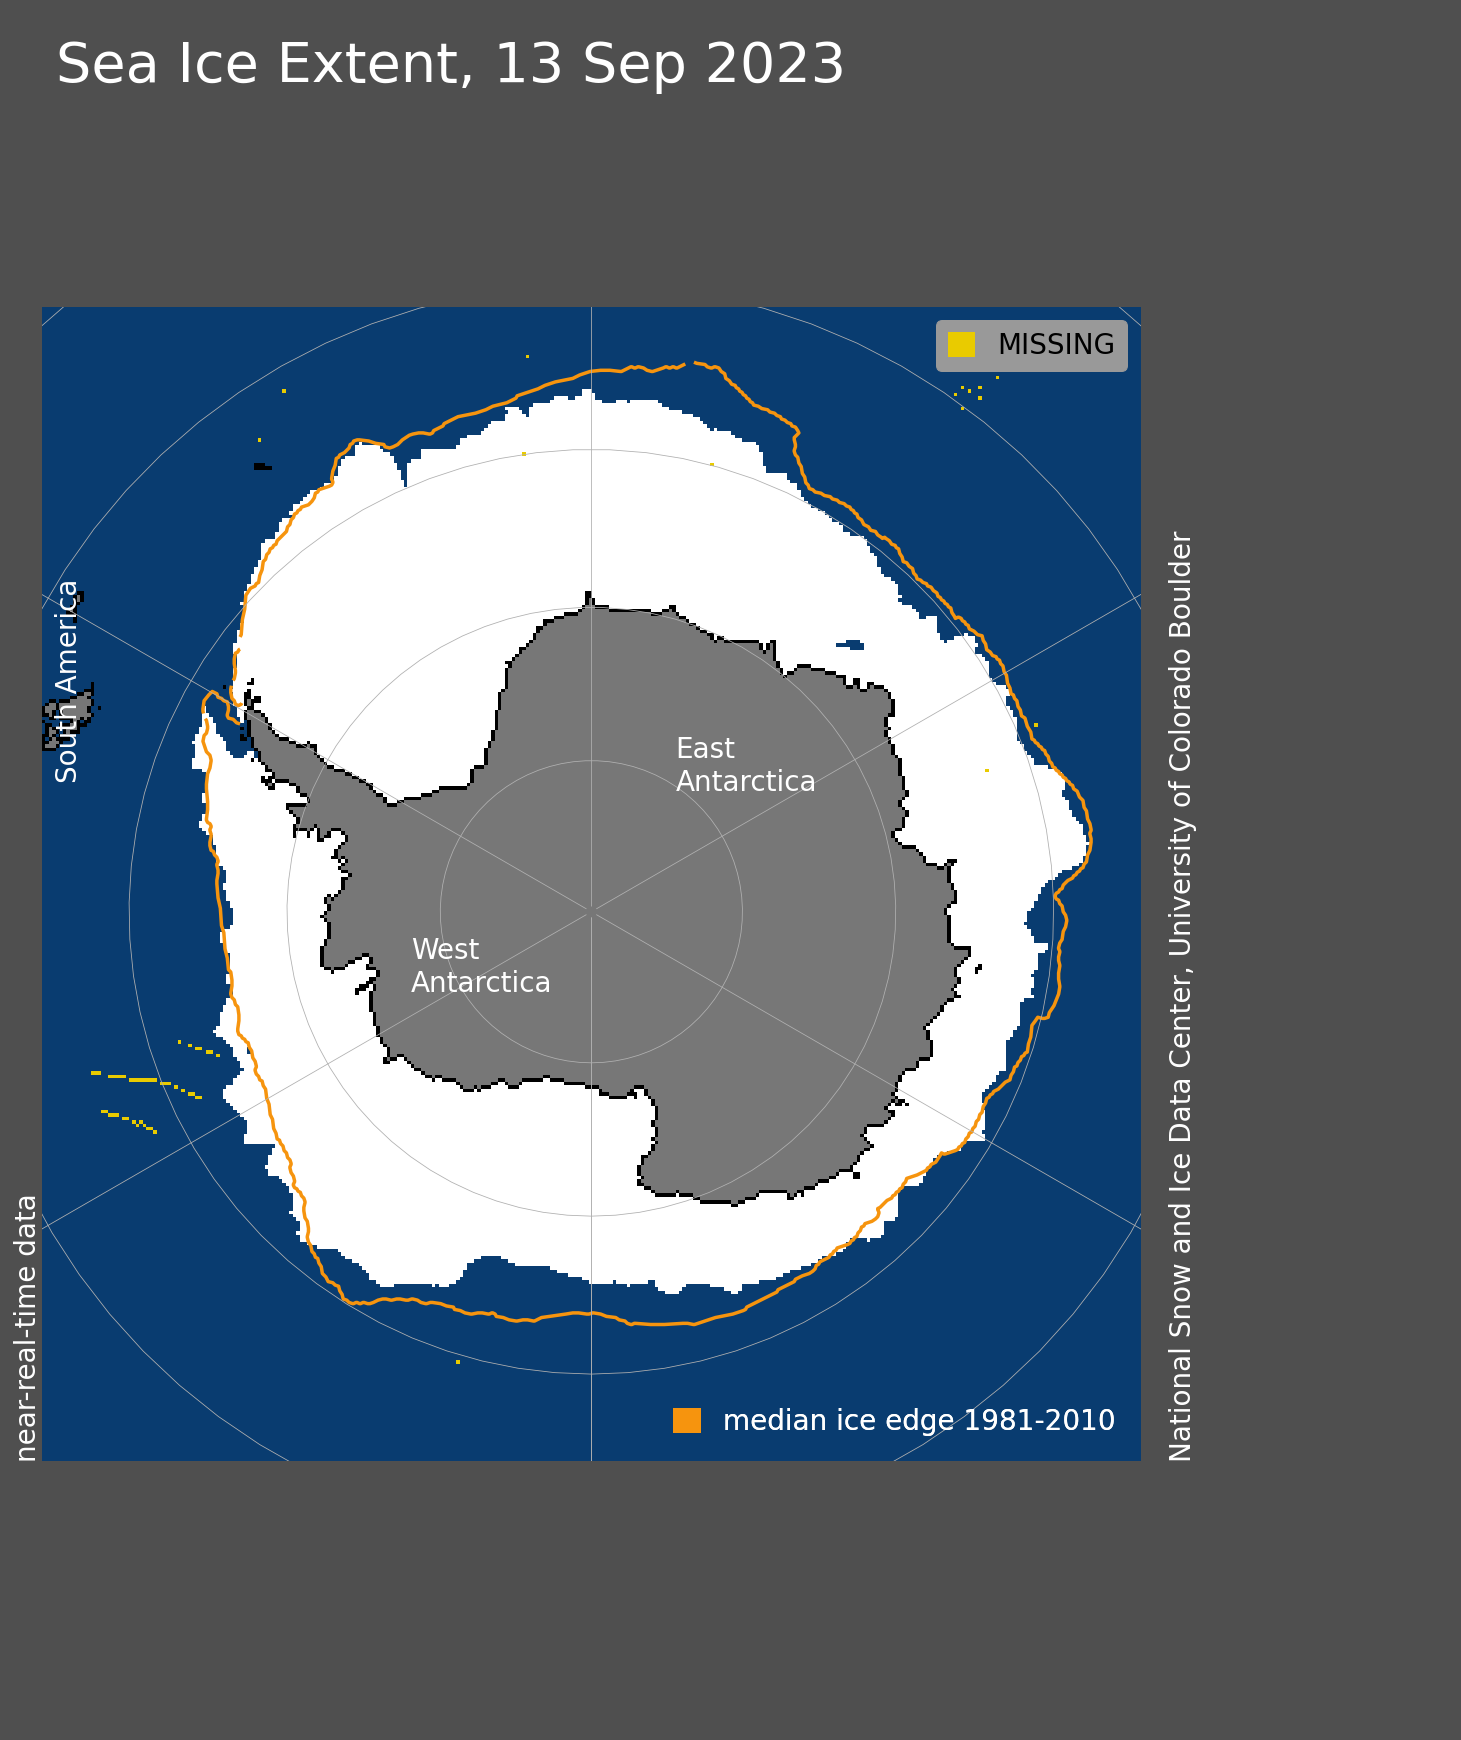
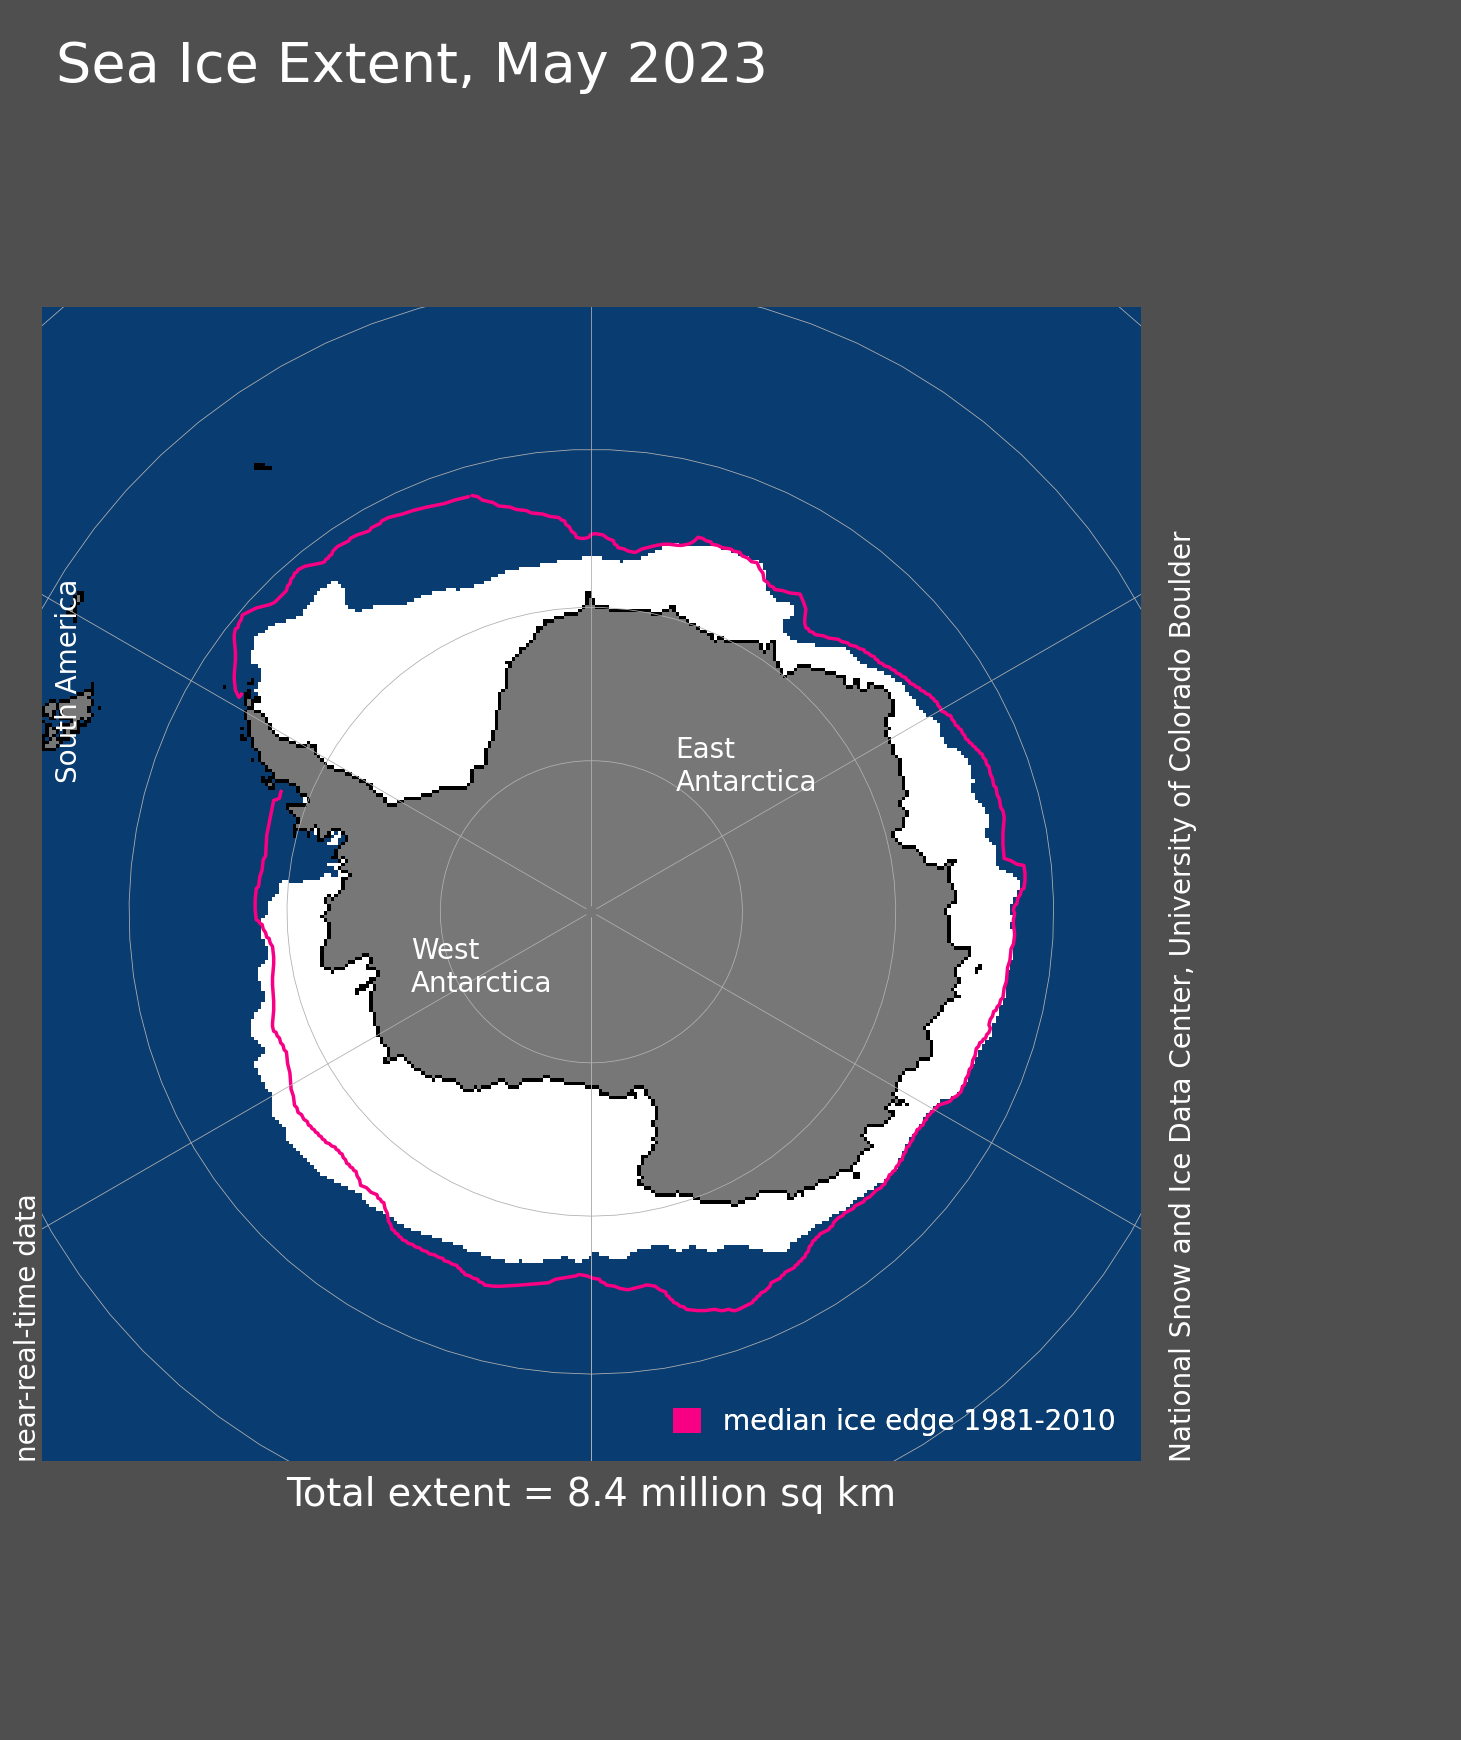
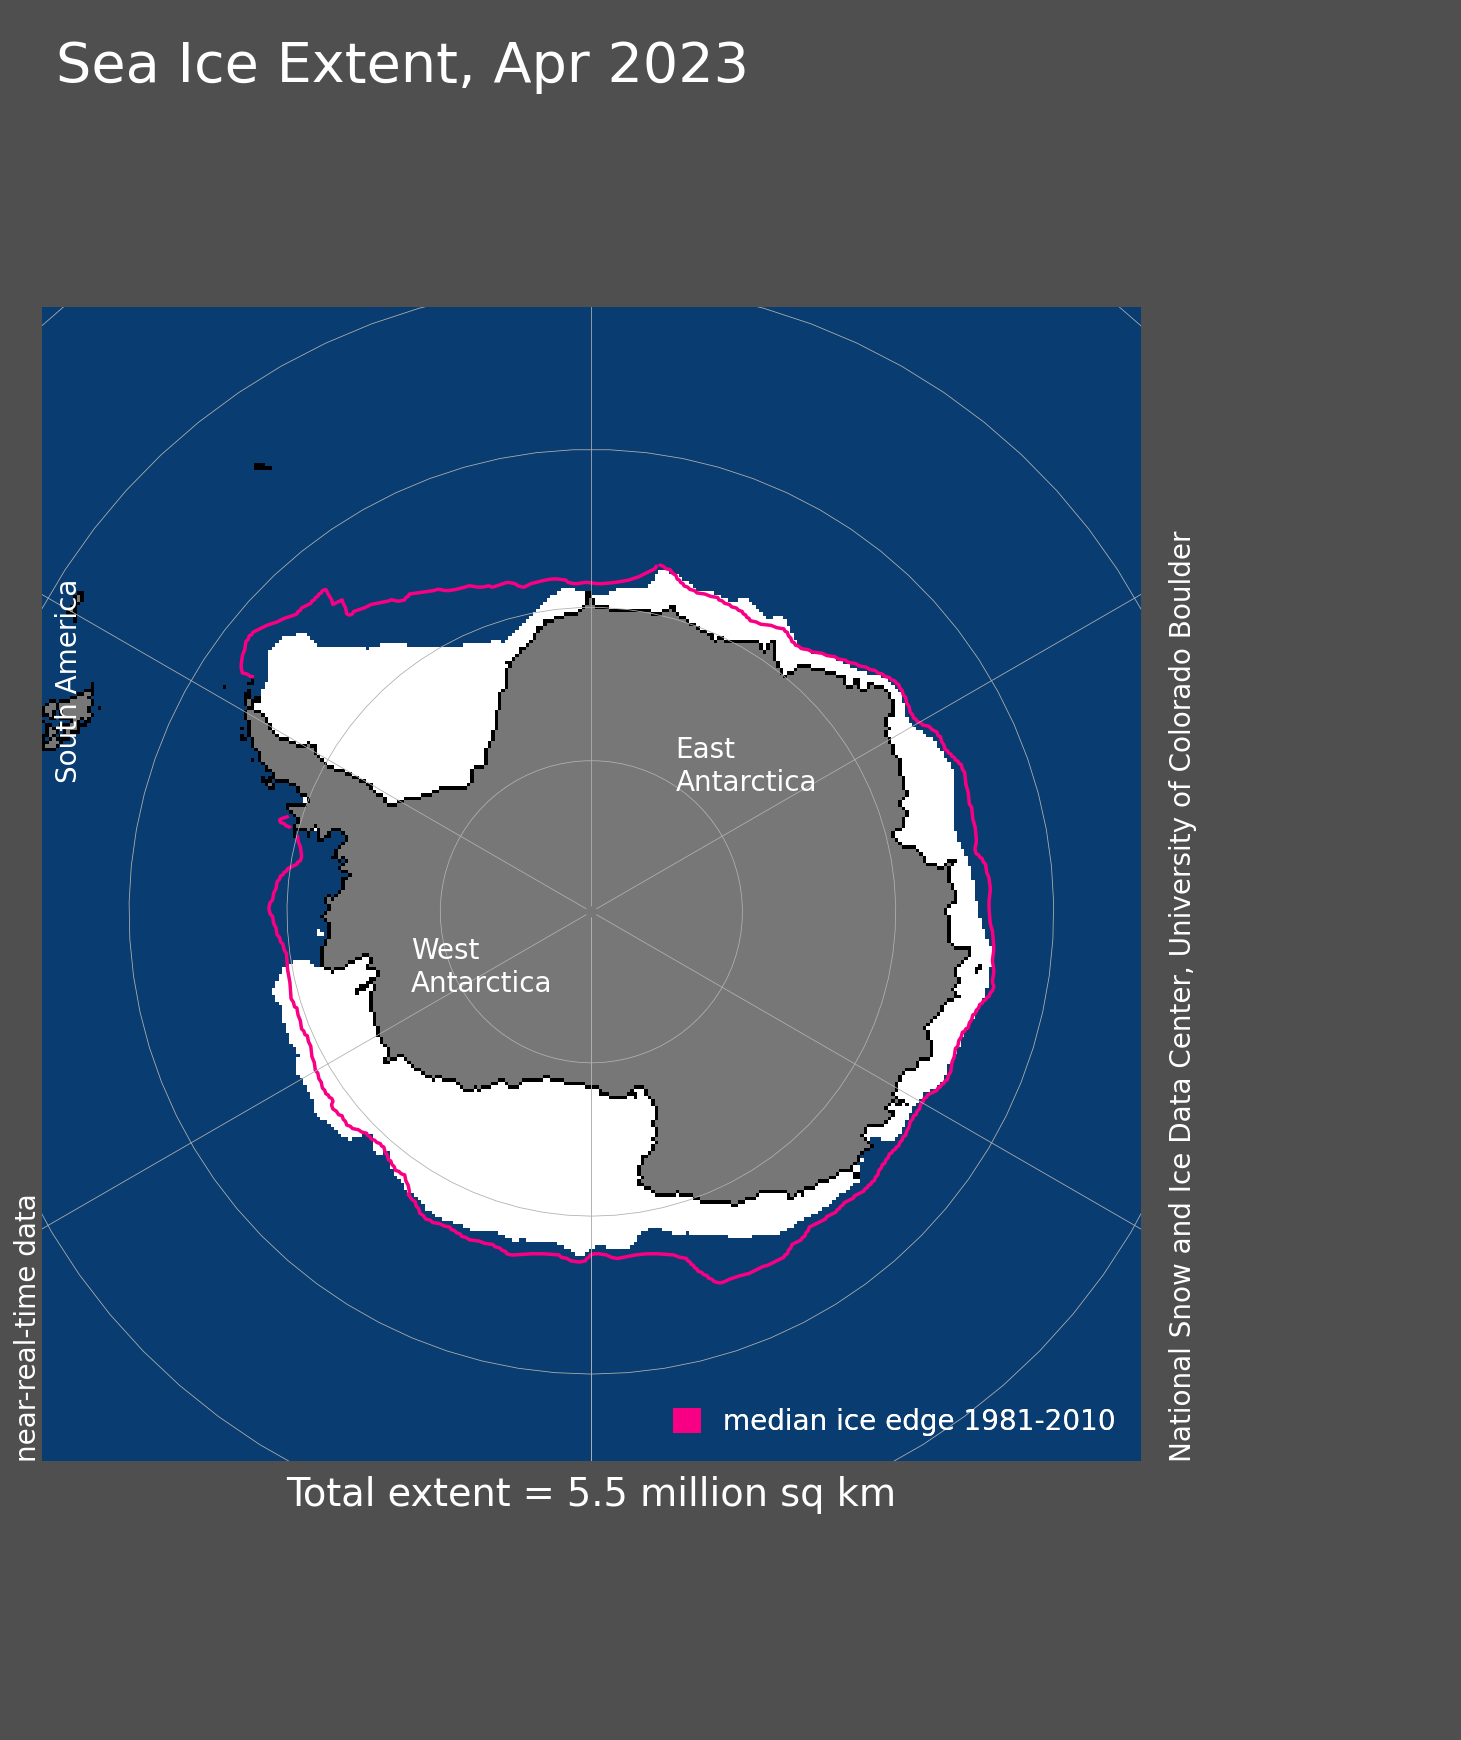
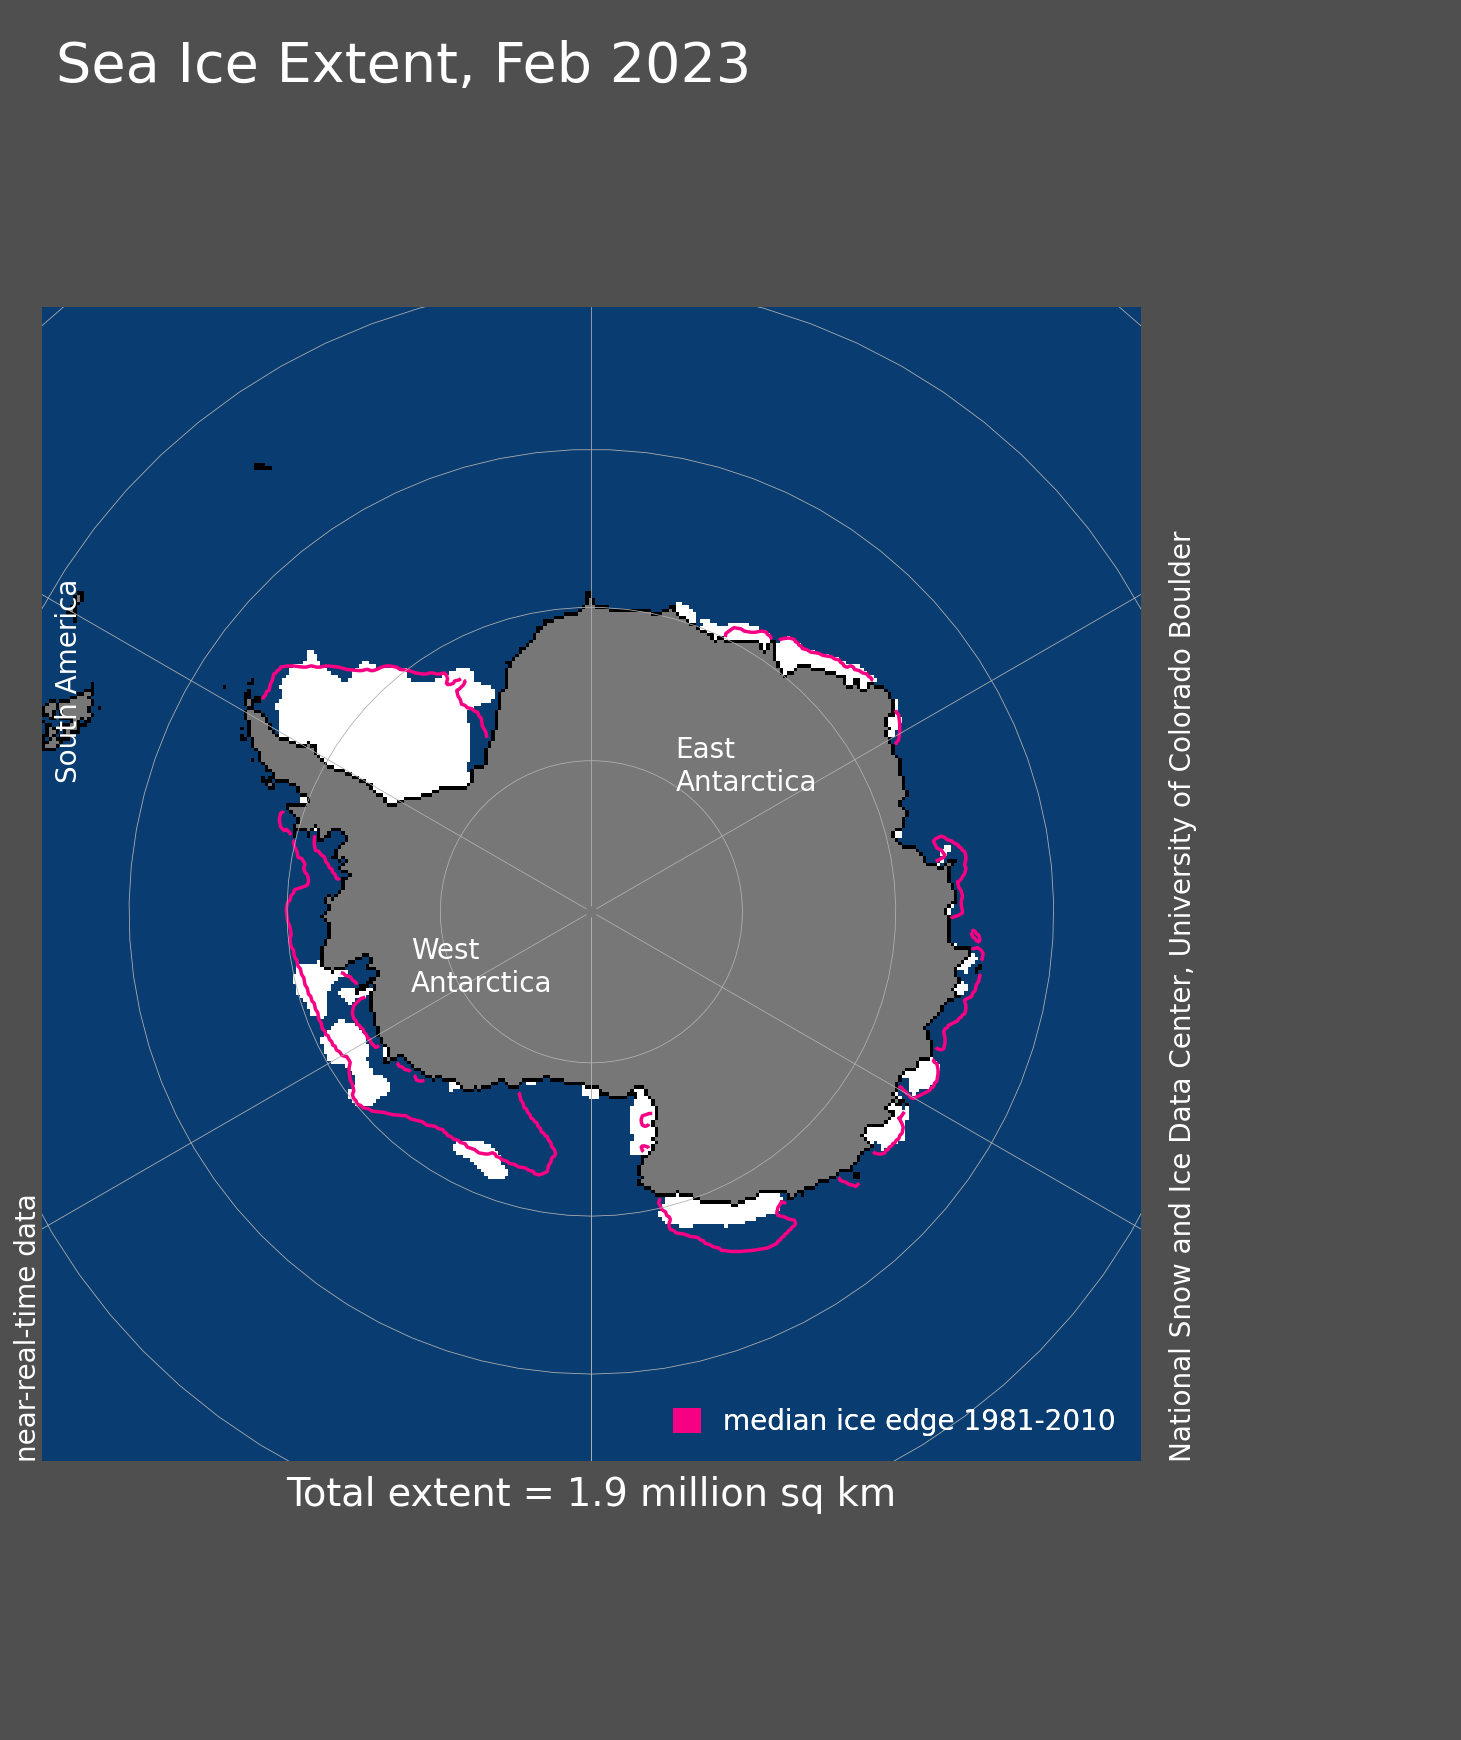
Figure 5a. Antarctic sea ice extent for April 2024 was 6.19 million square kilometers (2.39 million square miles). The magenta line shows the 1981 to 2010 average extent for that month. Sea Ice Index data. About the data
Credit: National Snow and Ice Data Center
High-resolution image

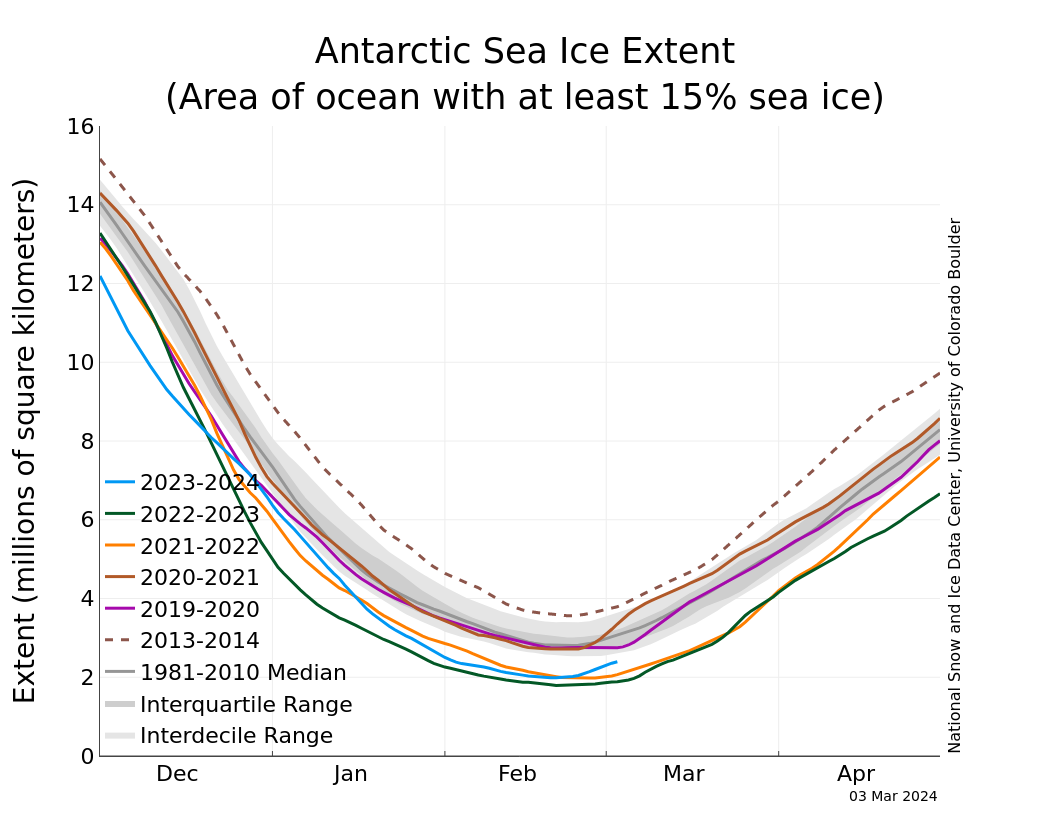
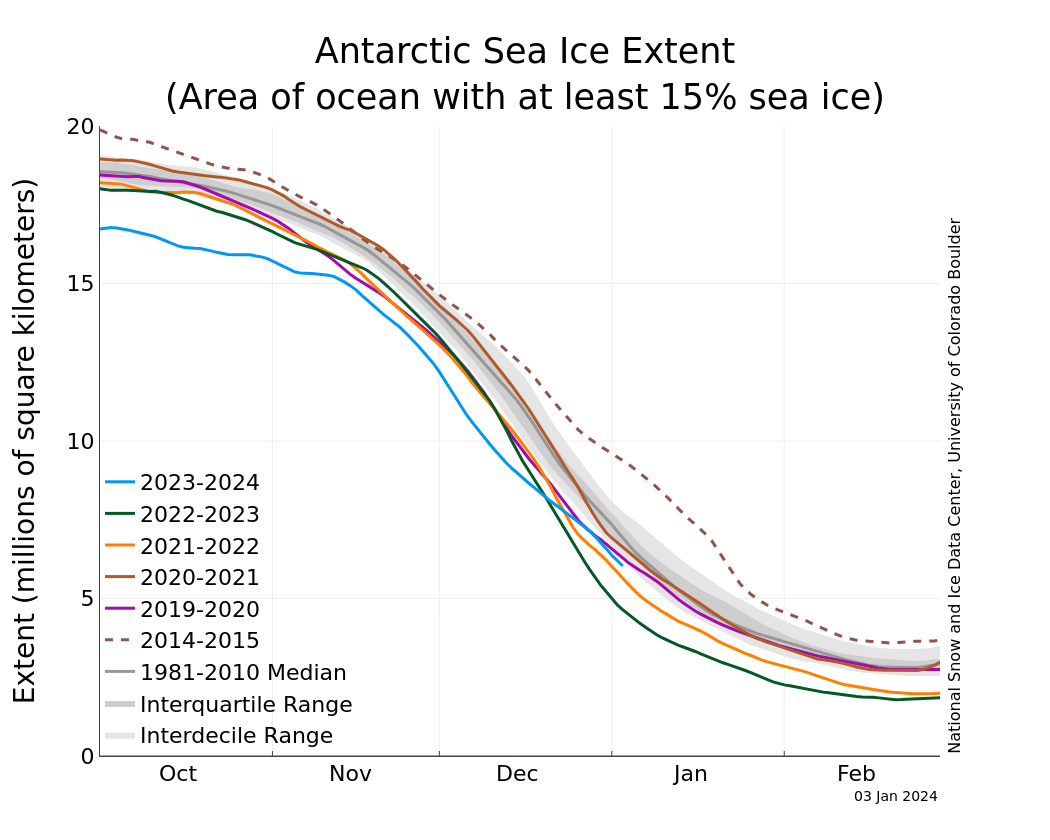
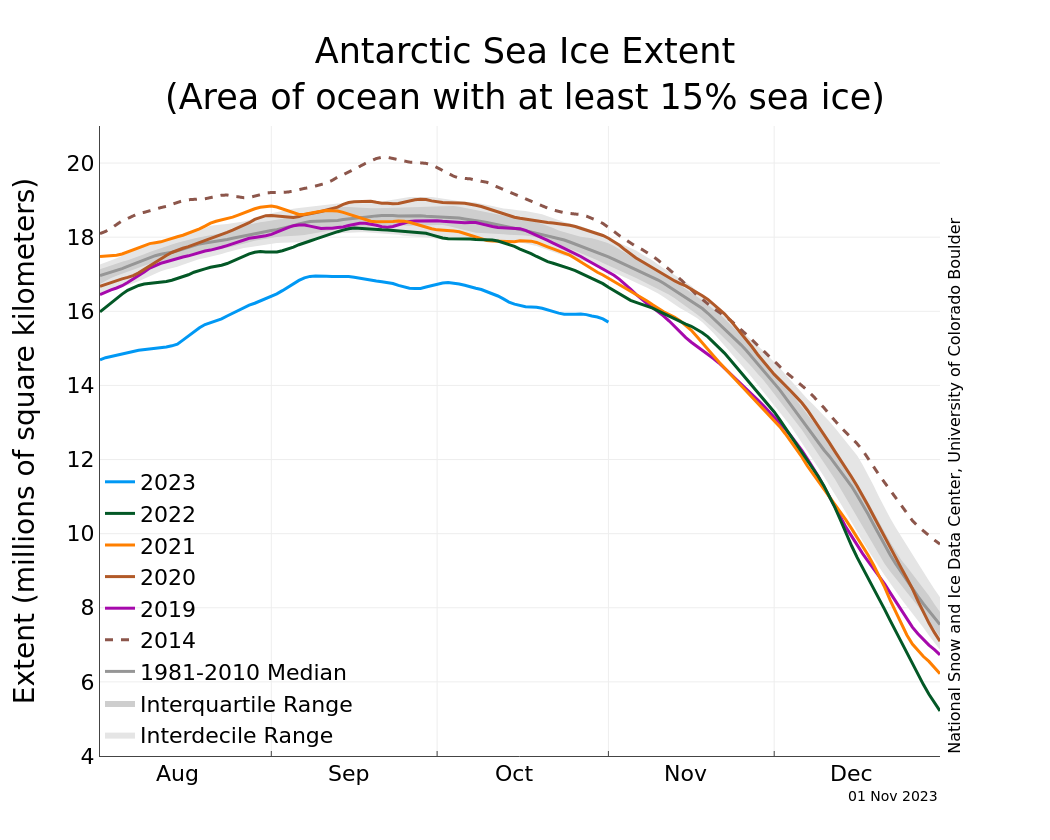
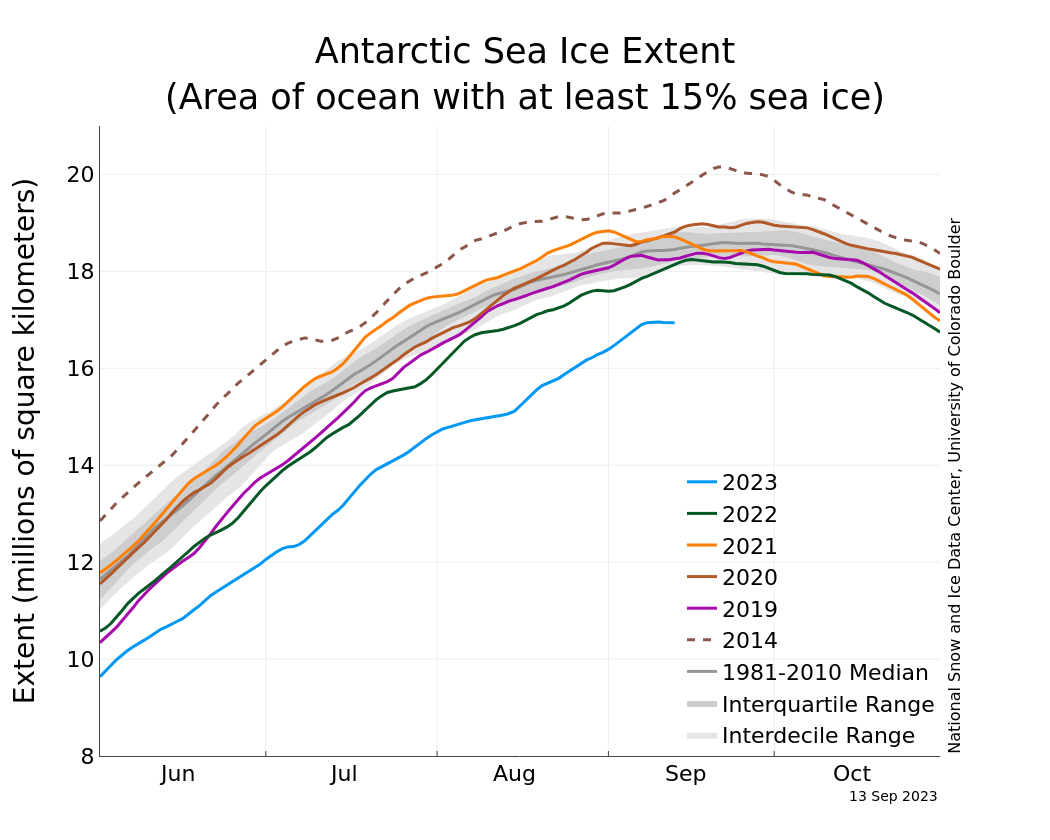
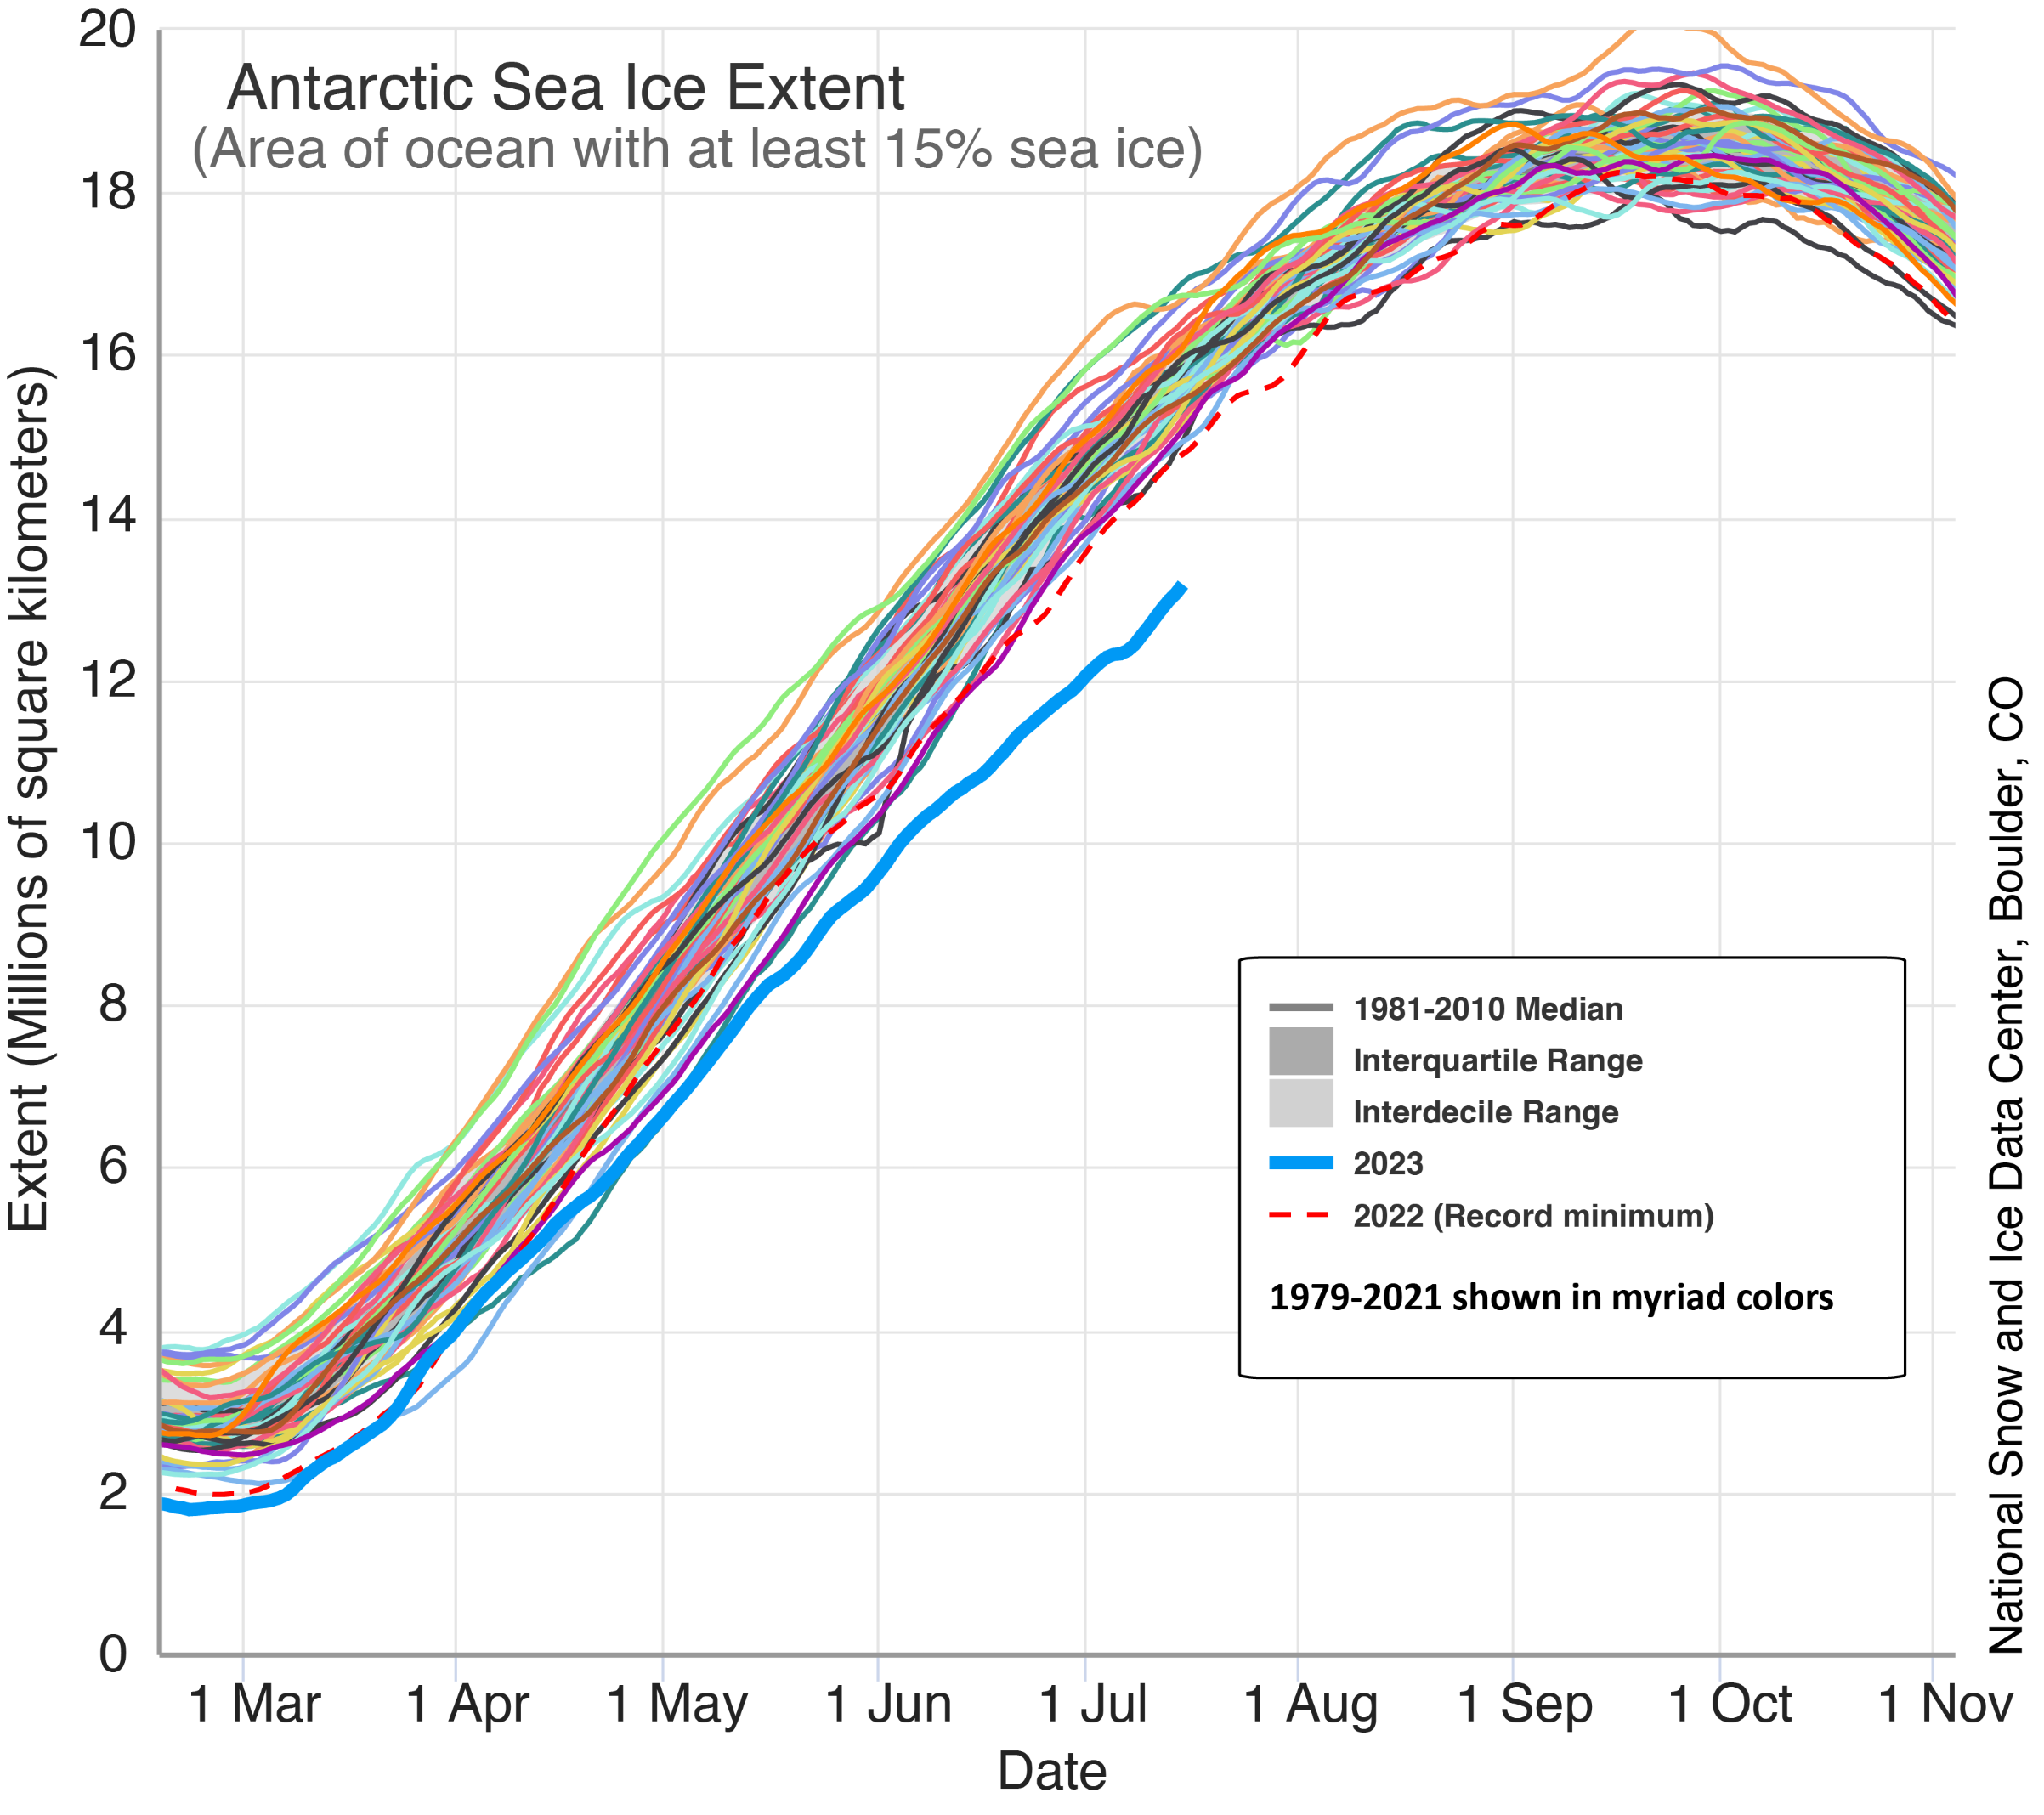
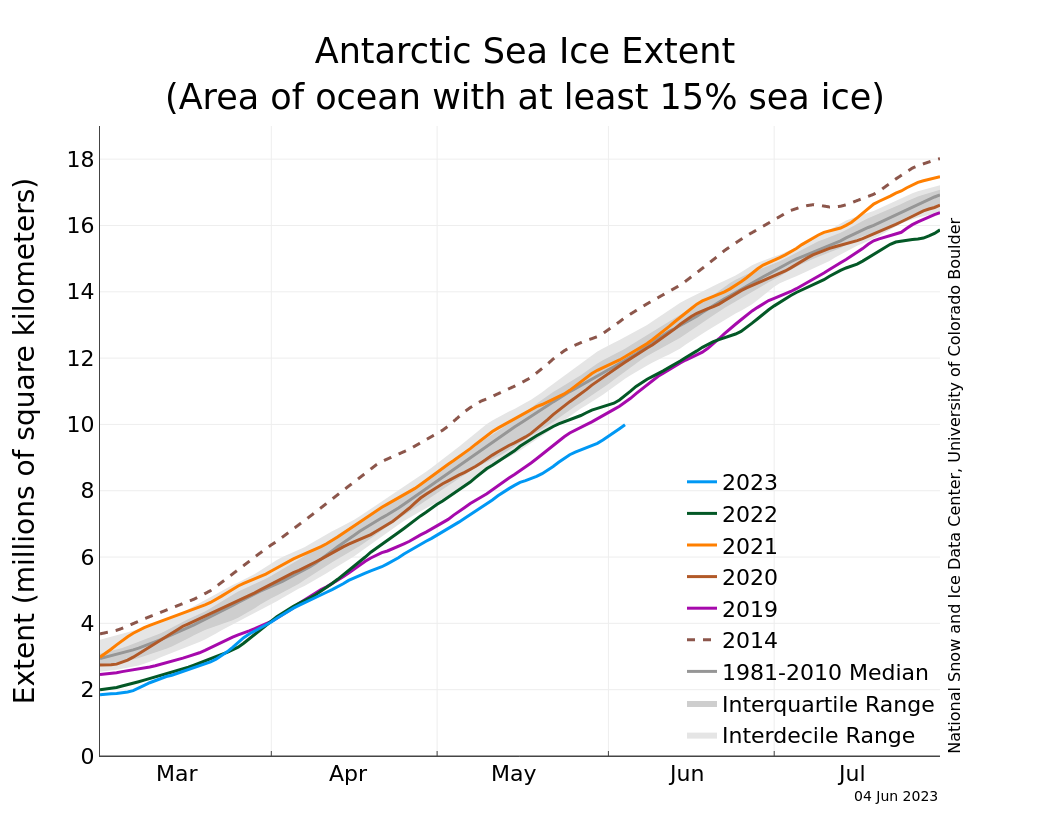
Figure 5b. The graph above shows Antarctic sea ice extent as of May 5, 2024, along with daily ice extent data for four previous years and the record high year. 2024 is shown in blue, 2023 in green, 2022 in orange, 2021 in brown, 2020 in magenta, and 2014, the record high year, in dashed brown. The 1981 to 2010 median is in dark gray. The gray areas around the median line show the interquartile and interdecile ranges of the data. Sea Ice Index data.
Credit: National Snow and Ice Data Center
High-resolution image
April is the month of most rapid ice growth in the south. Sea ice expanded relatively uniformly around the continent, but remained below the average extent in the eastern Weddell Sea and the Ross and western Amundsen Seas (Figure 5a). Sea ice grew at a slightly above-average rate, totaling about 3.6 million square kilometers (1.39 million square miles) in April, whereas the 1981 to 2010 average ice growth is 3.20 million square kilometers (1.24 million square miles) (Figure 5b).
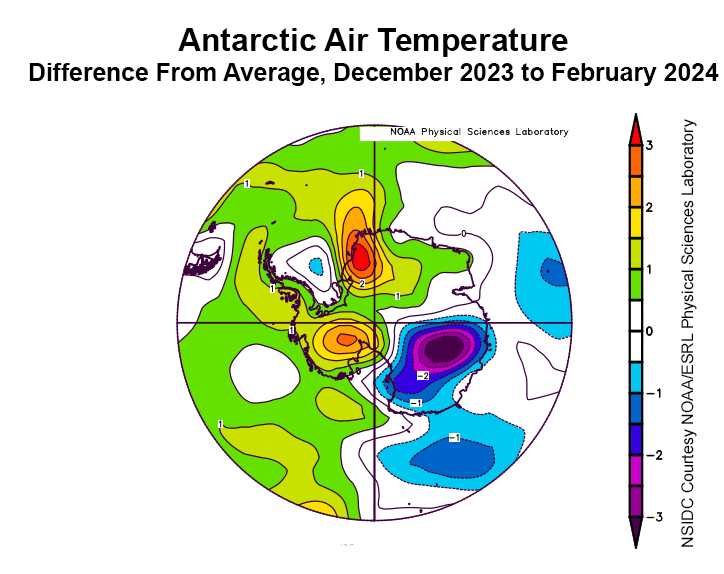
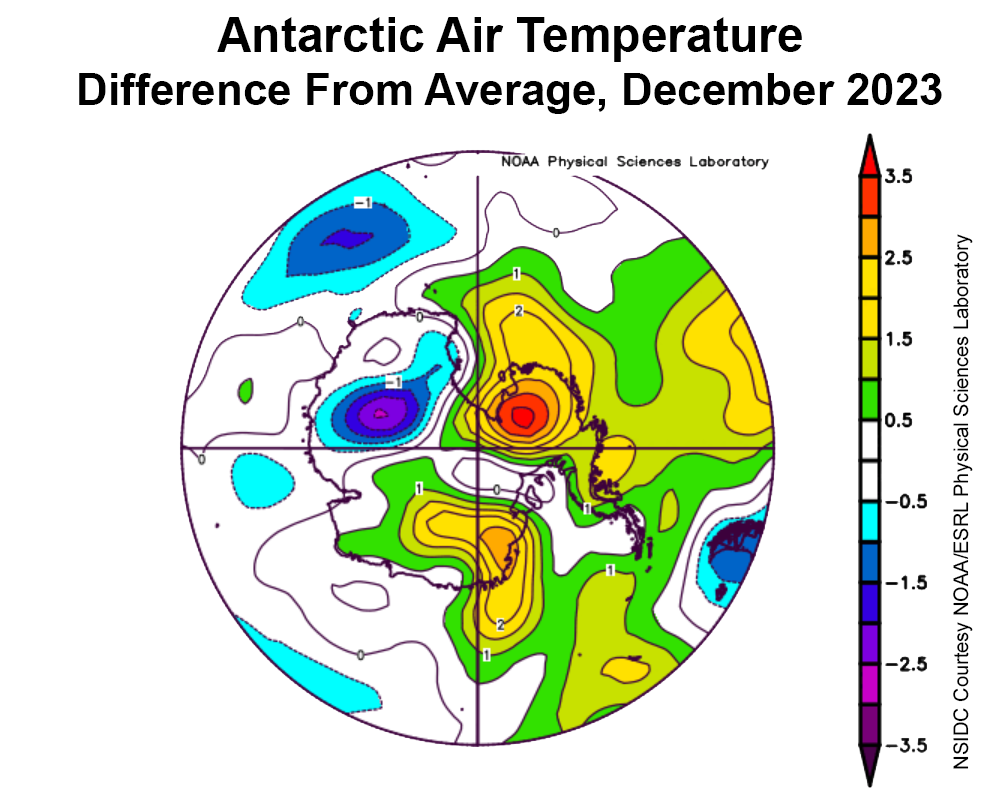
Above-average temperatures of 3 to 5 degrees Celsius (5 to 9 degrees Fahrenheit) continued to persist in western Dronning Maud Land but below-average temperatures of 4 to 7 degrees Celsius (7 to 13 degrees Fahrenheit) prevailed in the eastern Amundsen Sea and much of the Wilkes Land coast.
Conditions leading to Antarctica’s record low sea ice in 2023
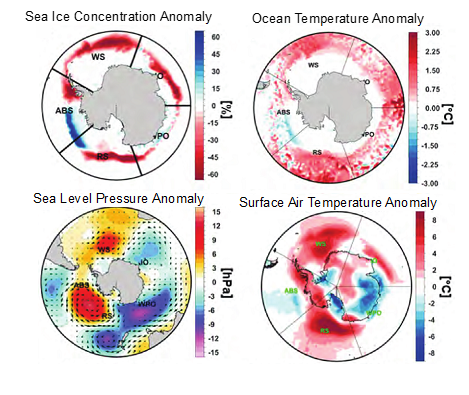
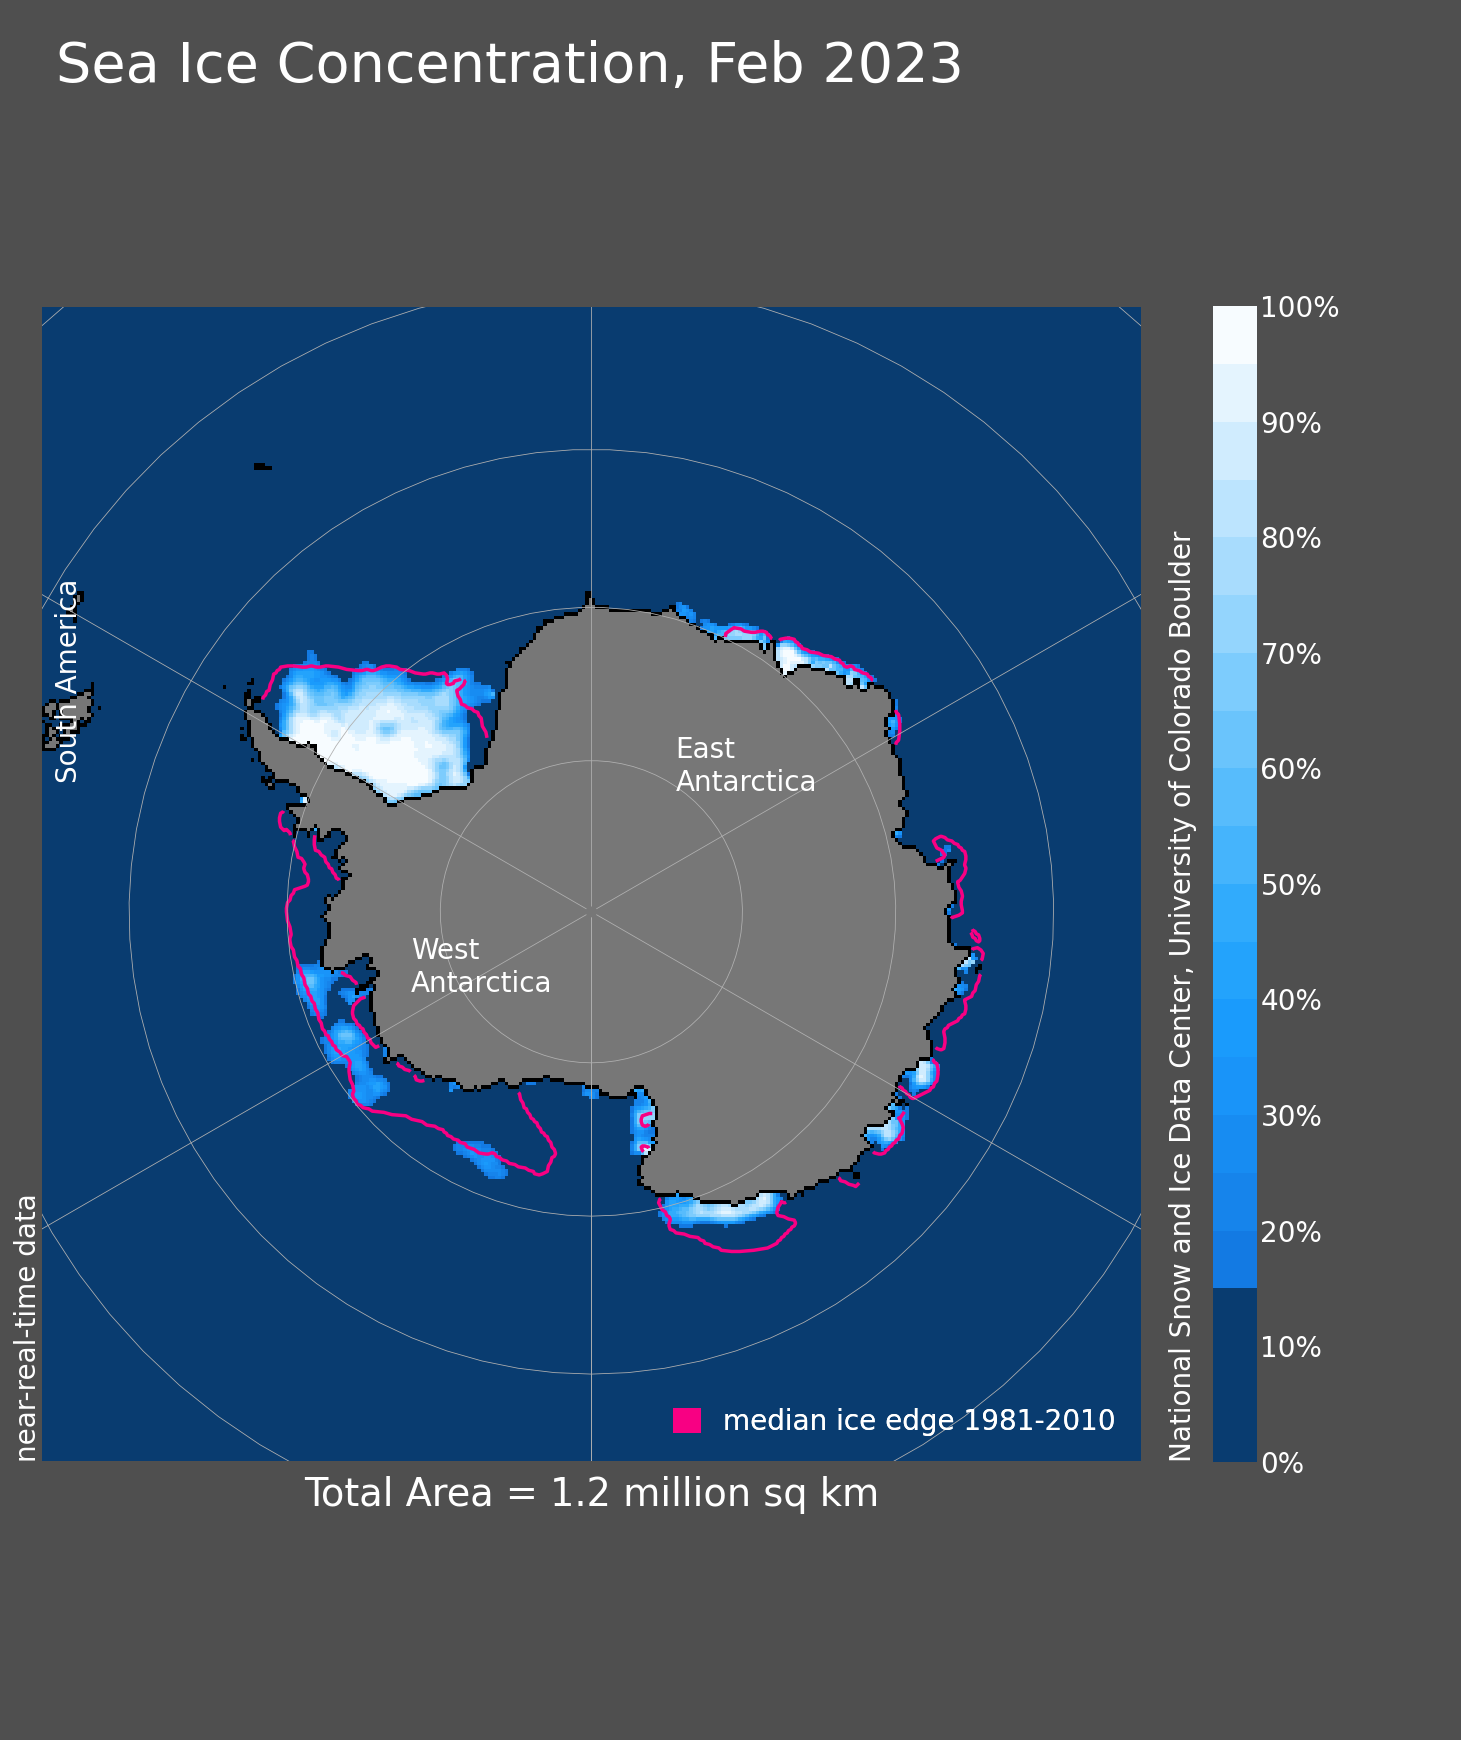
Figure 6. This figure shows climate and ocean conditions in July 2023 for the Antarctic sea ice region. The top left shows sea ice concentration difference from average in percent. The top right shows ocean temperature difference from average in degrees Celsius (1.8 degrees Fahrenheit equals 1 degree Celsius). The lower left shows sea level pressure difference from average in hectopascals (roughly equal to a millibar). The lower right shows near-surface air temperature difference from average (at 2 meters or 6.5 feet above the surface).
Credit: M. Ionita, 2024
High-resolution image
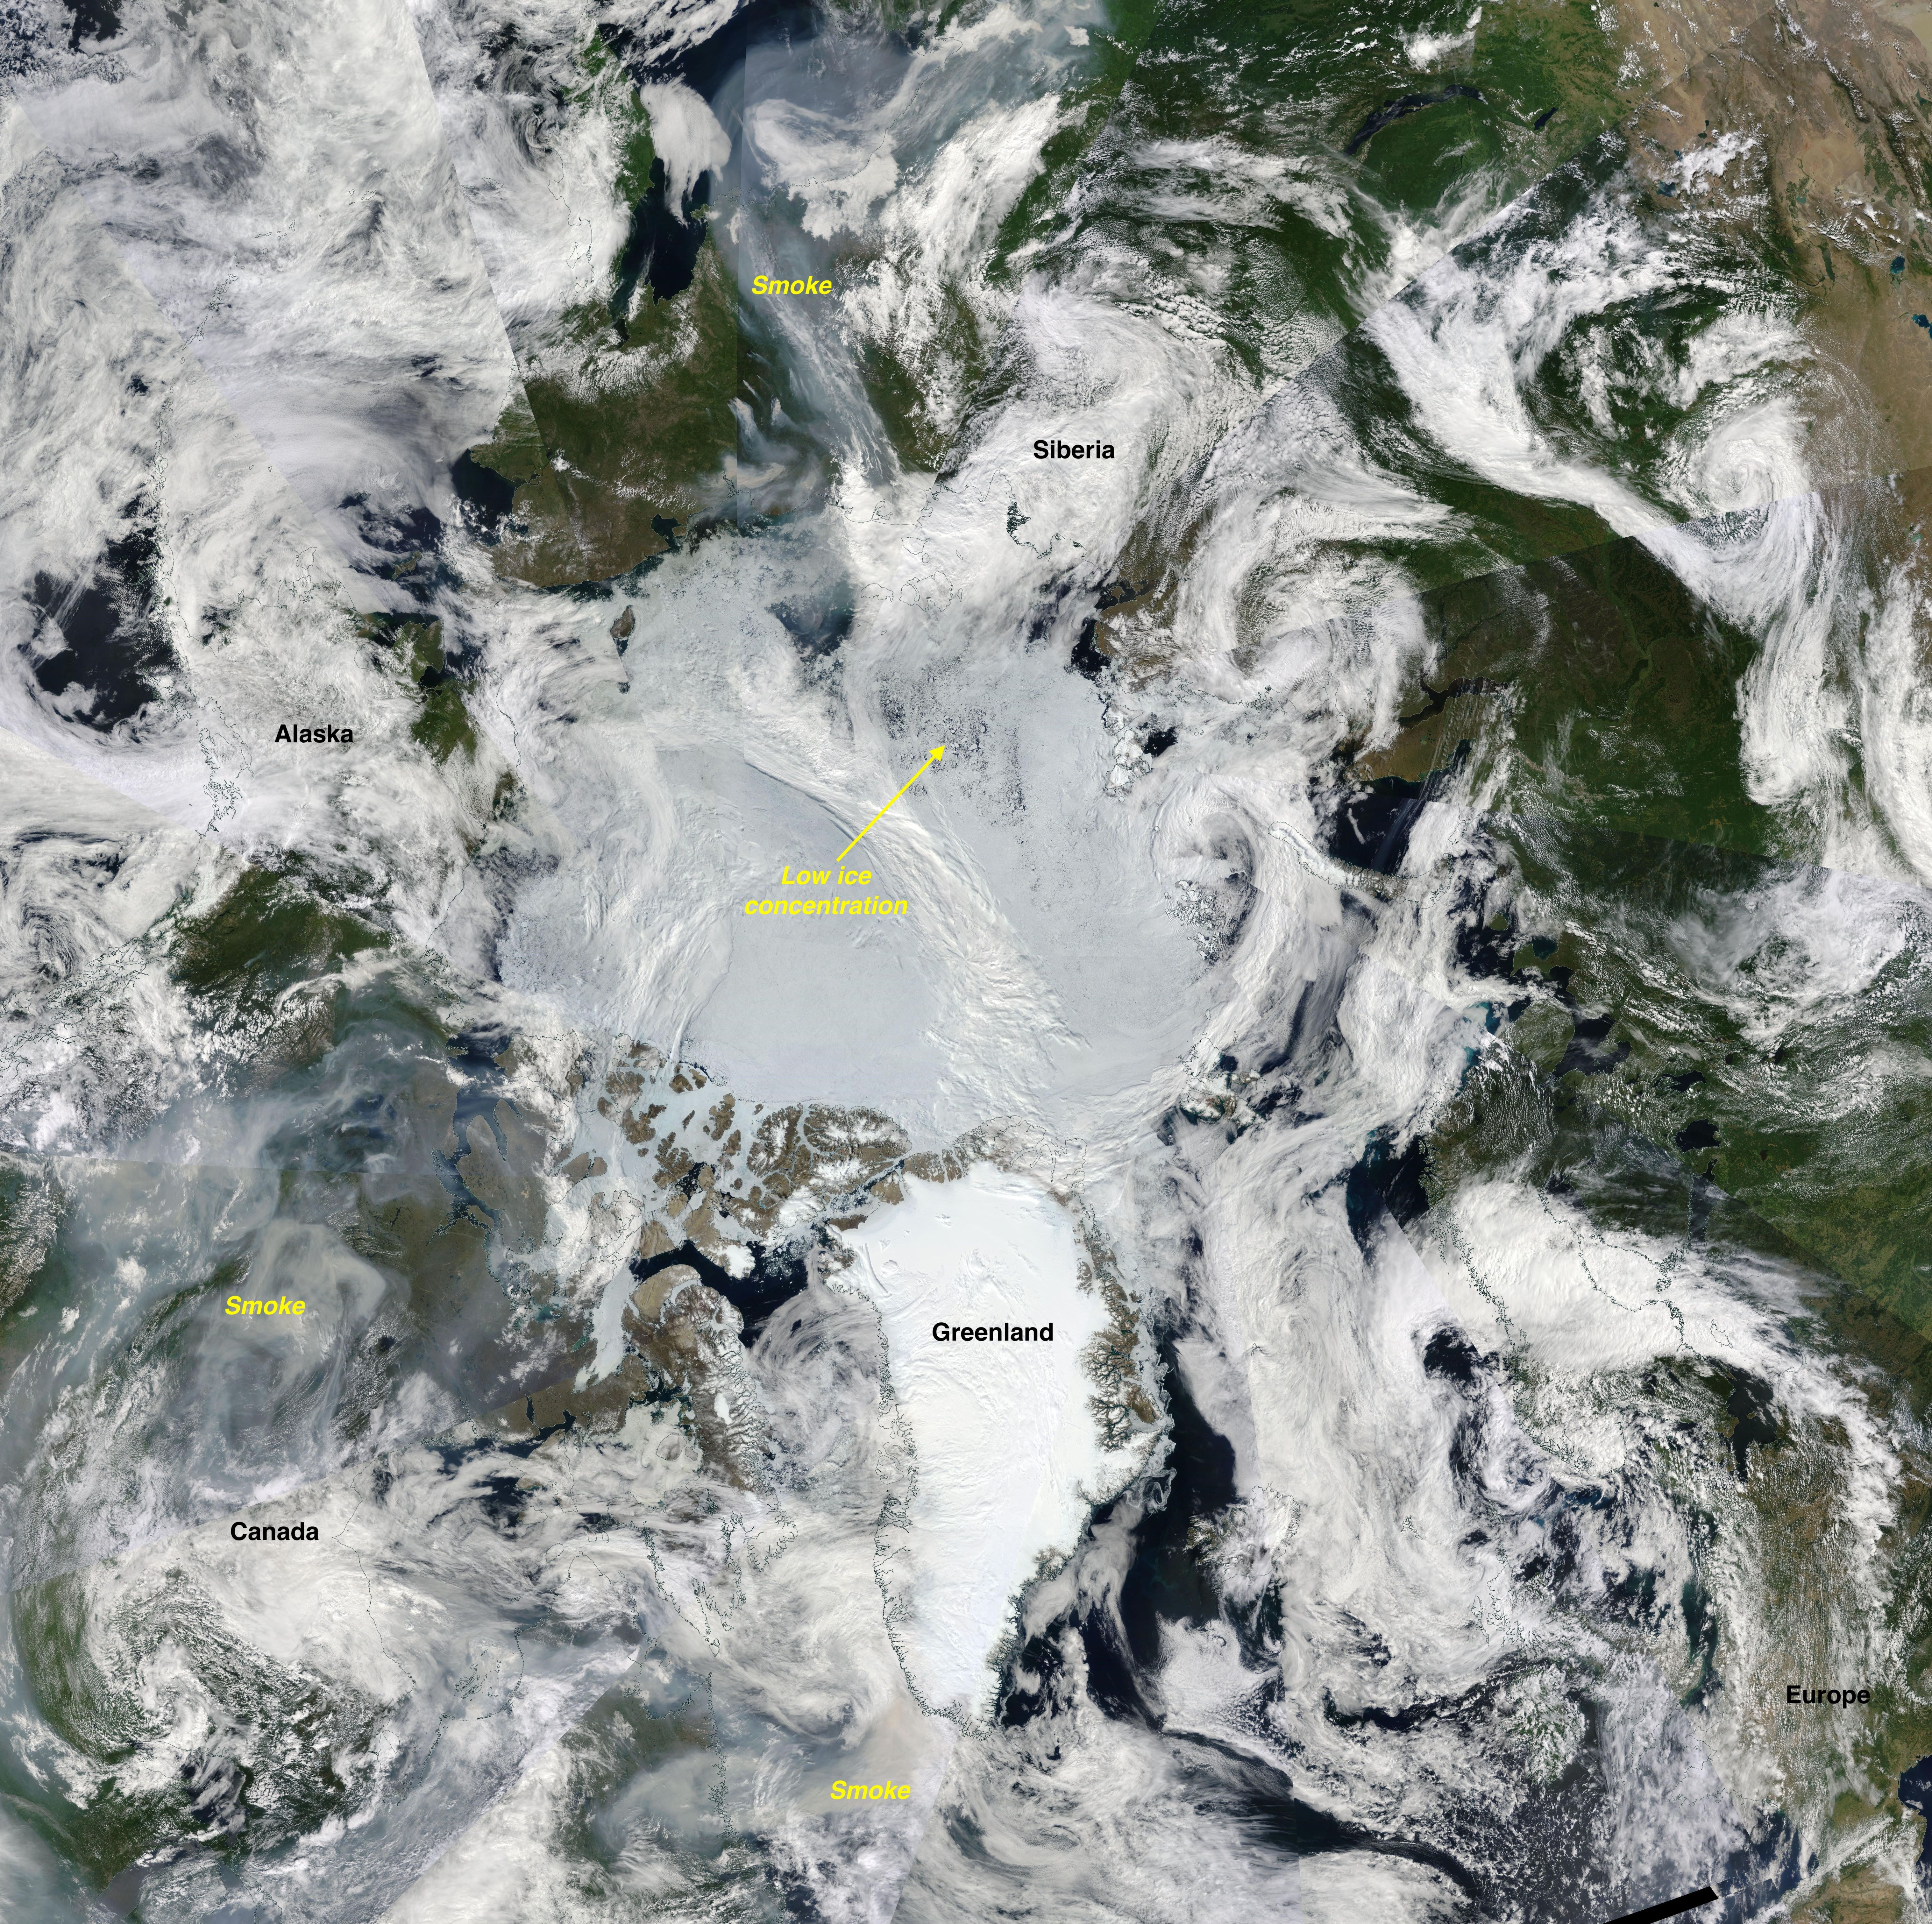
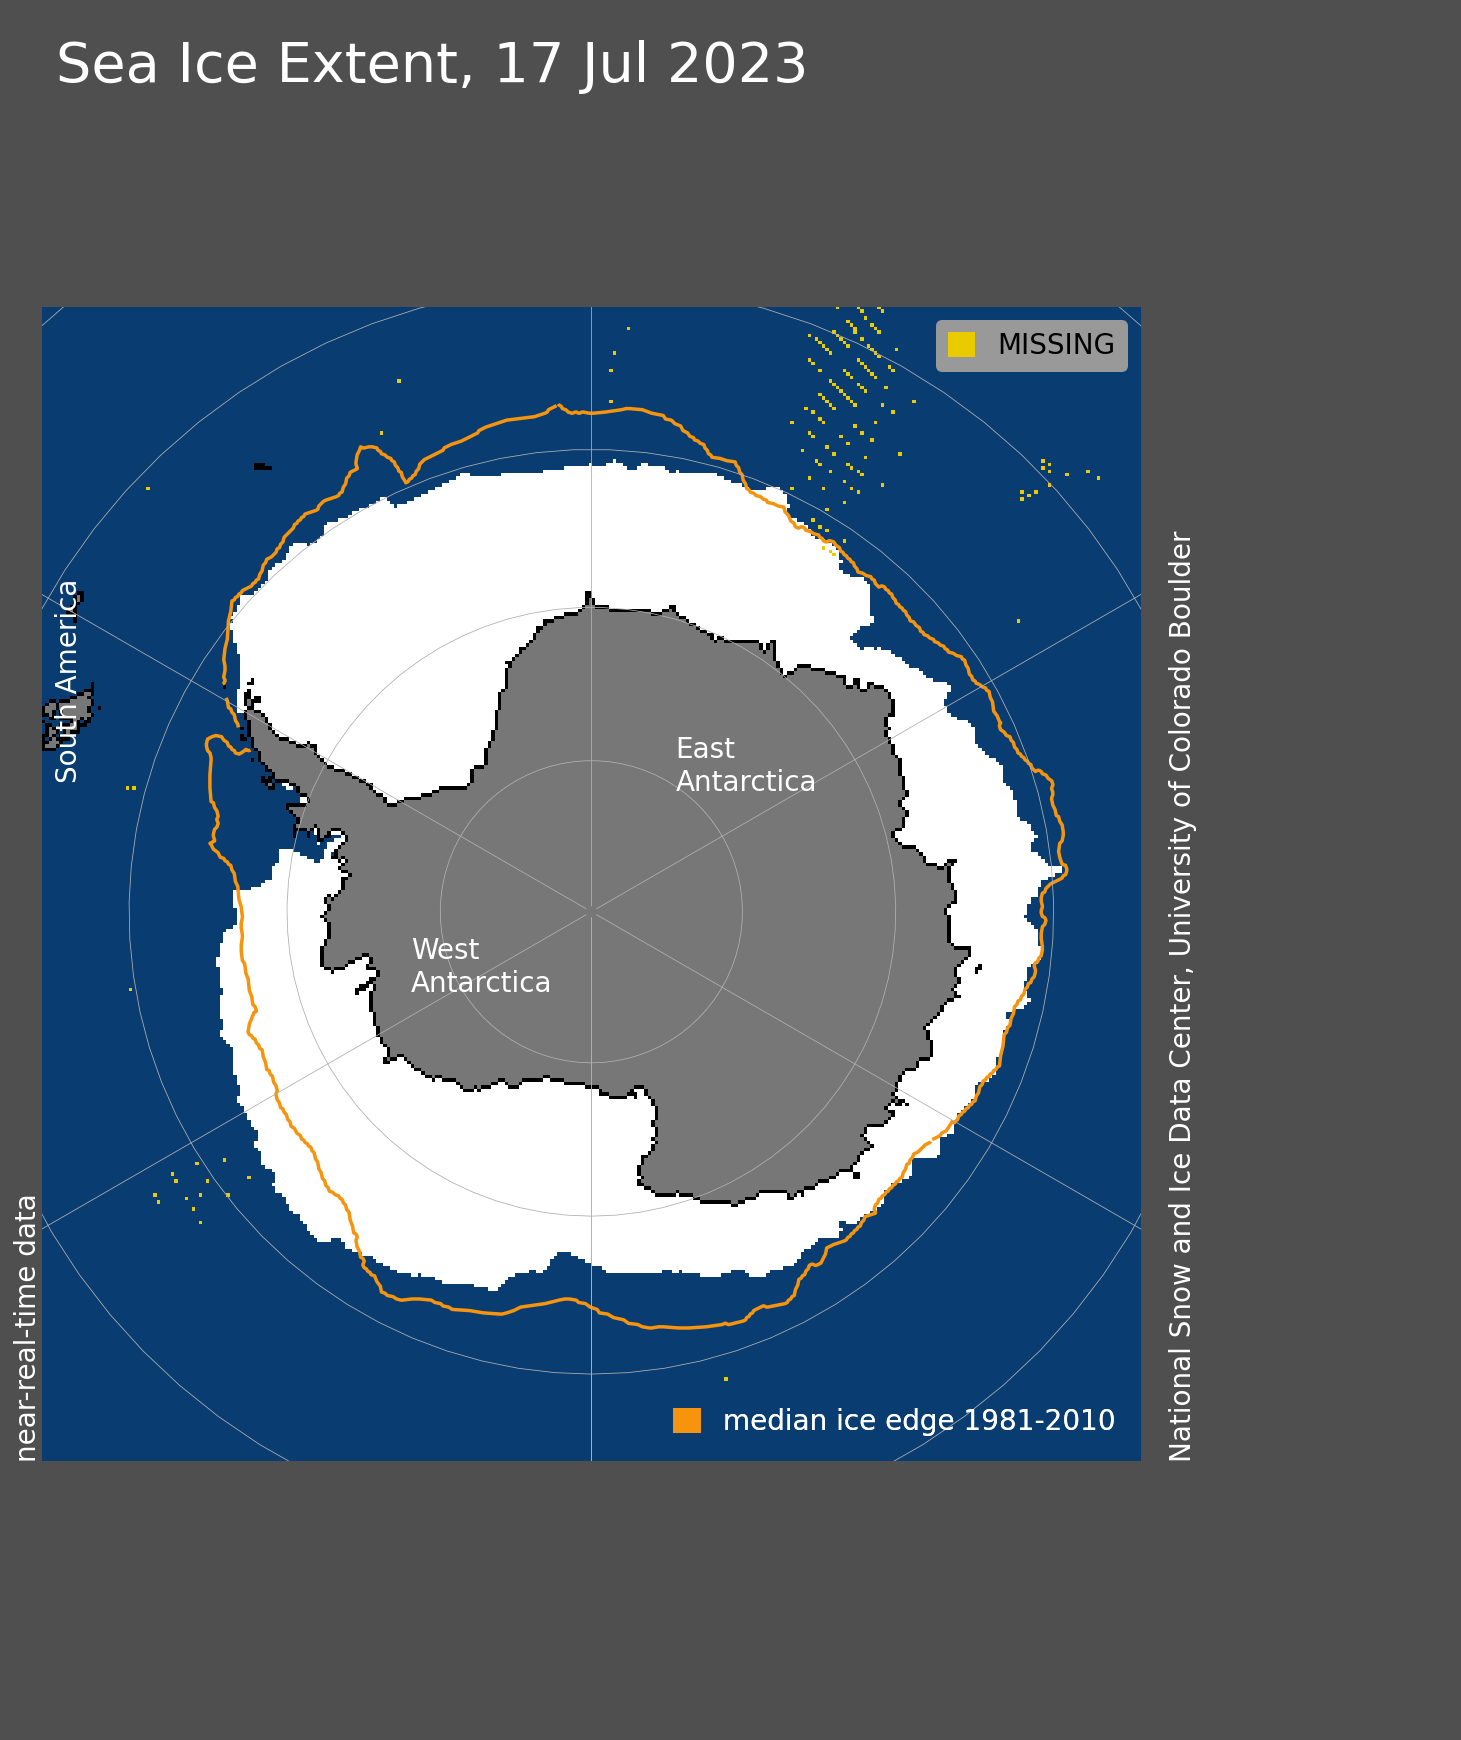
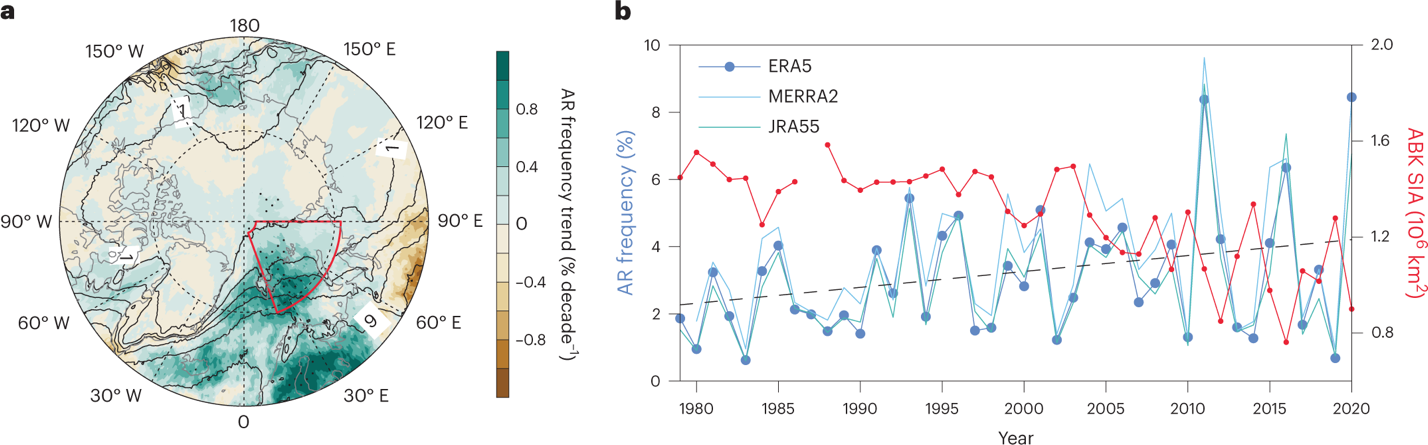
In July 2023, mid-winter Southern Ocean sea ice fell more than 2.40 million square kilometers (927,000 square miles) below the long-term average, a huge shortfall that revised scientific perceptions of what was possible in the Antarctic climate system. A recent paper written by Monica Ionita from the Alfred Wegner Institute Helmholtz Center for Polar and Marine Research placed the cause of the extreme event with a persistent threefold pattern of alternating low and high air pressure centers surrounding the continent. This pattern, known as “zonal wave-3,” transports warmth and moist air toward the Antarctic coast, suppressing sea ice formation and leading to exceptional anomalies in air temperature and ocean temperature.
Ionita, M. 2024. Large-scale drivers of the exceptionally low winter Antarctic sea ice extent in 2023. Frontiers in Earth Science. doi: 10.3389/feart.2024.1333706.
Stroeve, J, et. al. 2024. Mapping potential timing of ice algal blooms from satellite. Geophysical Research Letters. doi: 10.1029/2023GL106486.


