Arctic sea ice continues to decline at a near-average pace, with ice extent twelfth lowest in the satellite record at this time. Antarctic sea ice by contrast is growing at far below-average rates and is at an unprecedently low level for this time of year relative to the 45-year data set.
Overview of conditions
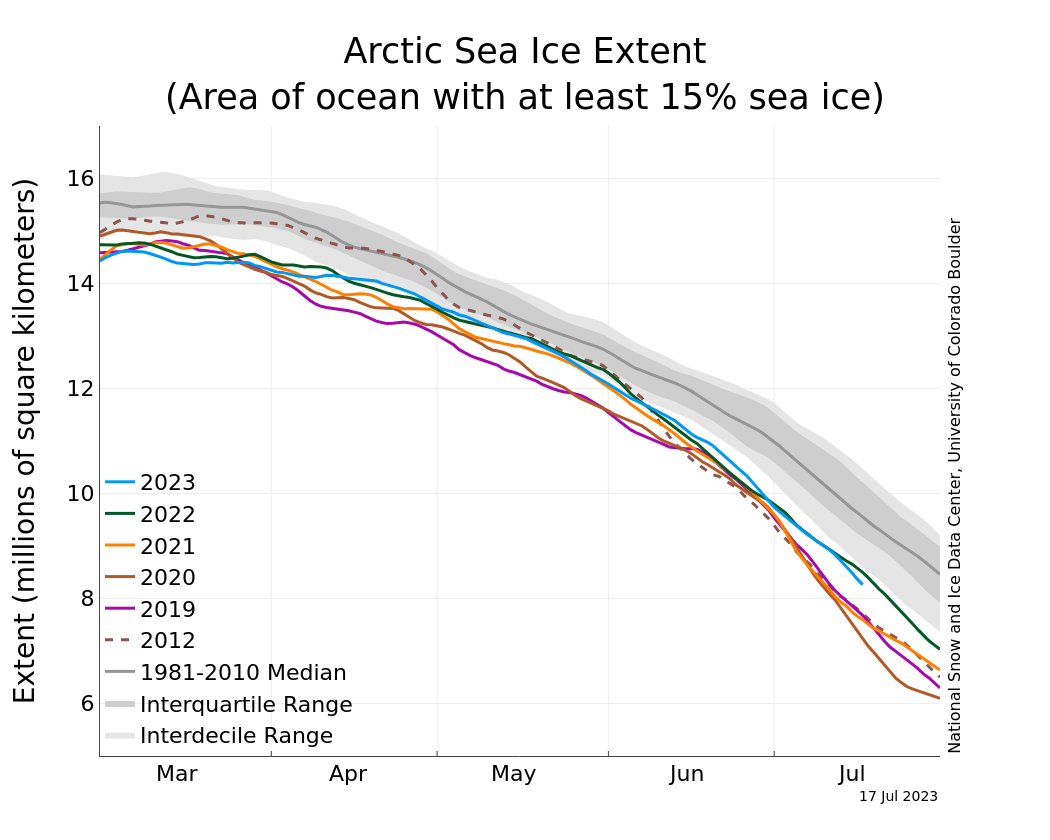
Figure 1a. The graph above shows Arctic sea ice extent as of July 17, 2023, along with daily ice extent data for four previous years and the record low year. 2023 is shown in blue, 2022 in green, 2021 in orange, 2020 in brown, 2019 in magenta, and 2012 in dashed brown. The 1981 to 2010 median is in dark gray. The gray areas around the median line show the interquartile and interdecile ranges of the data. Sea Ice Index data.
Credit: National Snow and Ice Data Center
High-resolution image
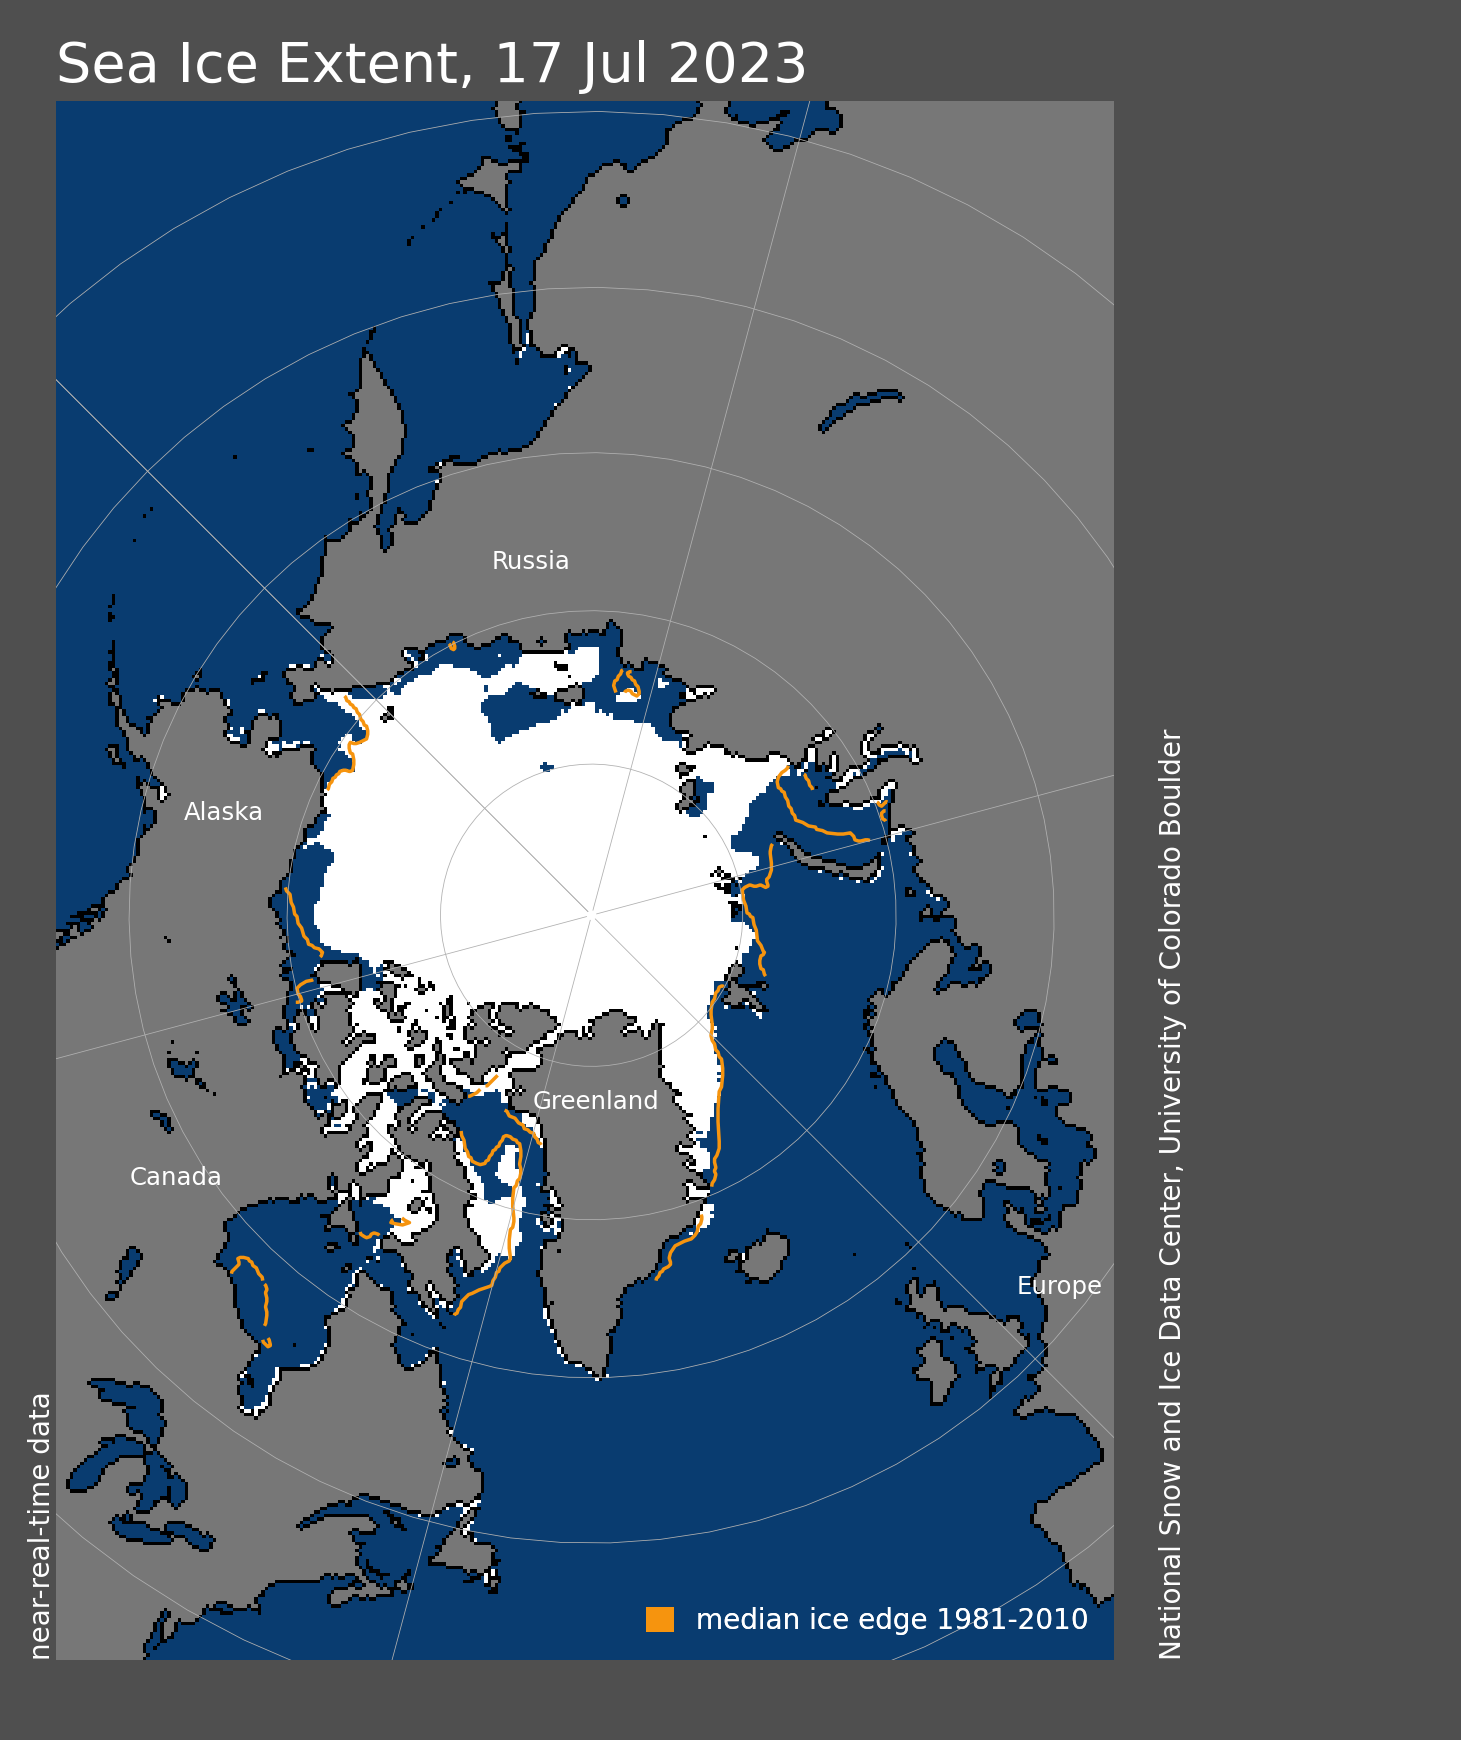
Figure 1b. Arctic sea ice extent for July 17, 2023 was 8.27 million square kilometers (3.19 million square miles). The orange line shows the 1981 to 2010 average extent for that day. Sea Ice Index data. About the data
Credit: National Snow and Ice Data Center
High-resolution image
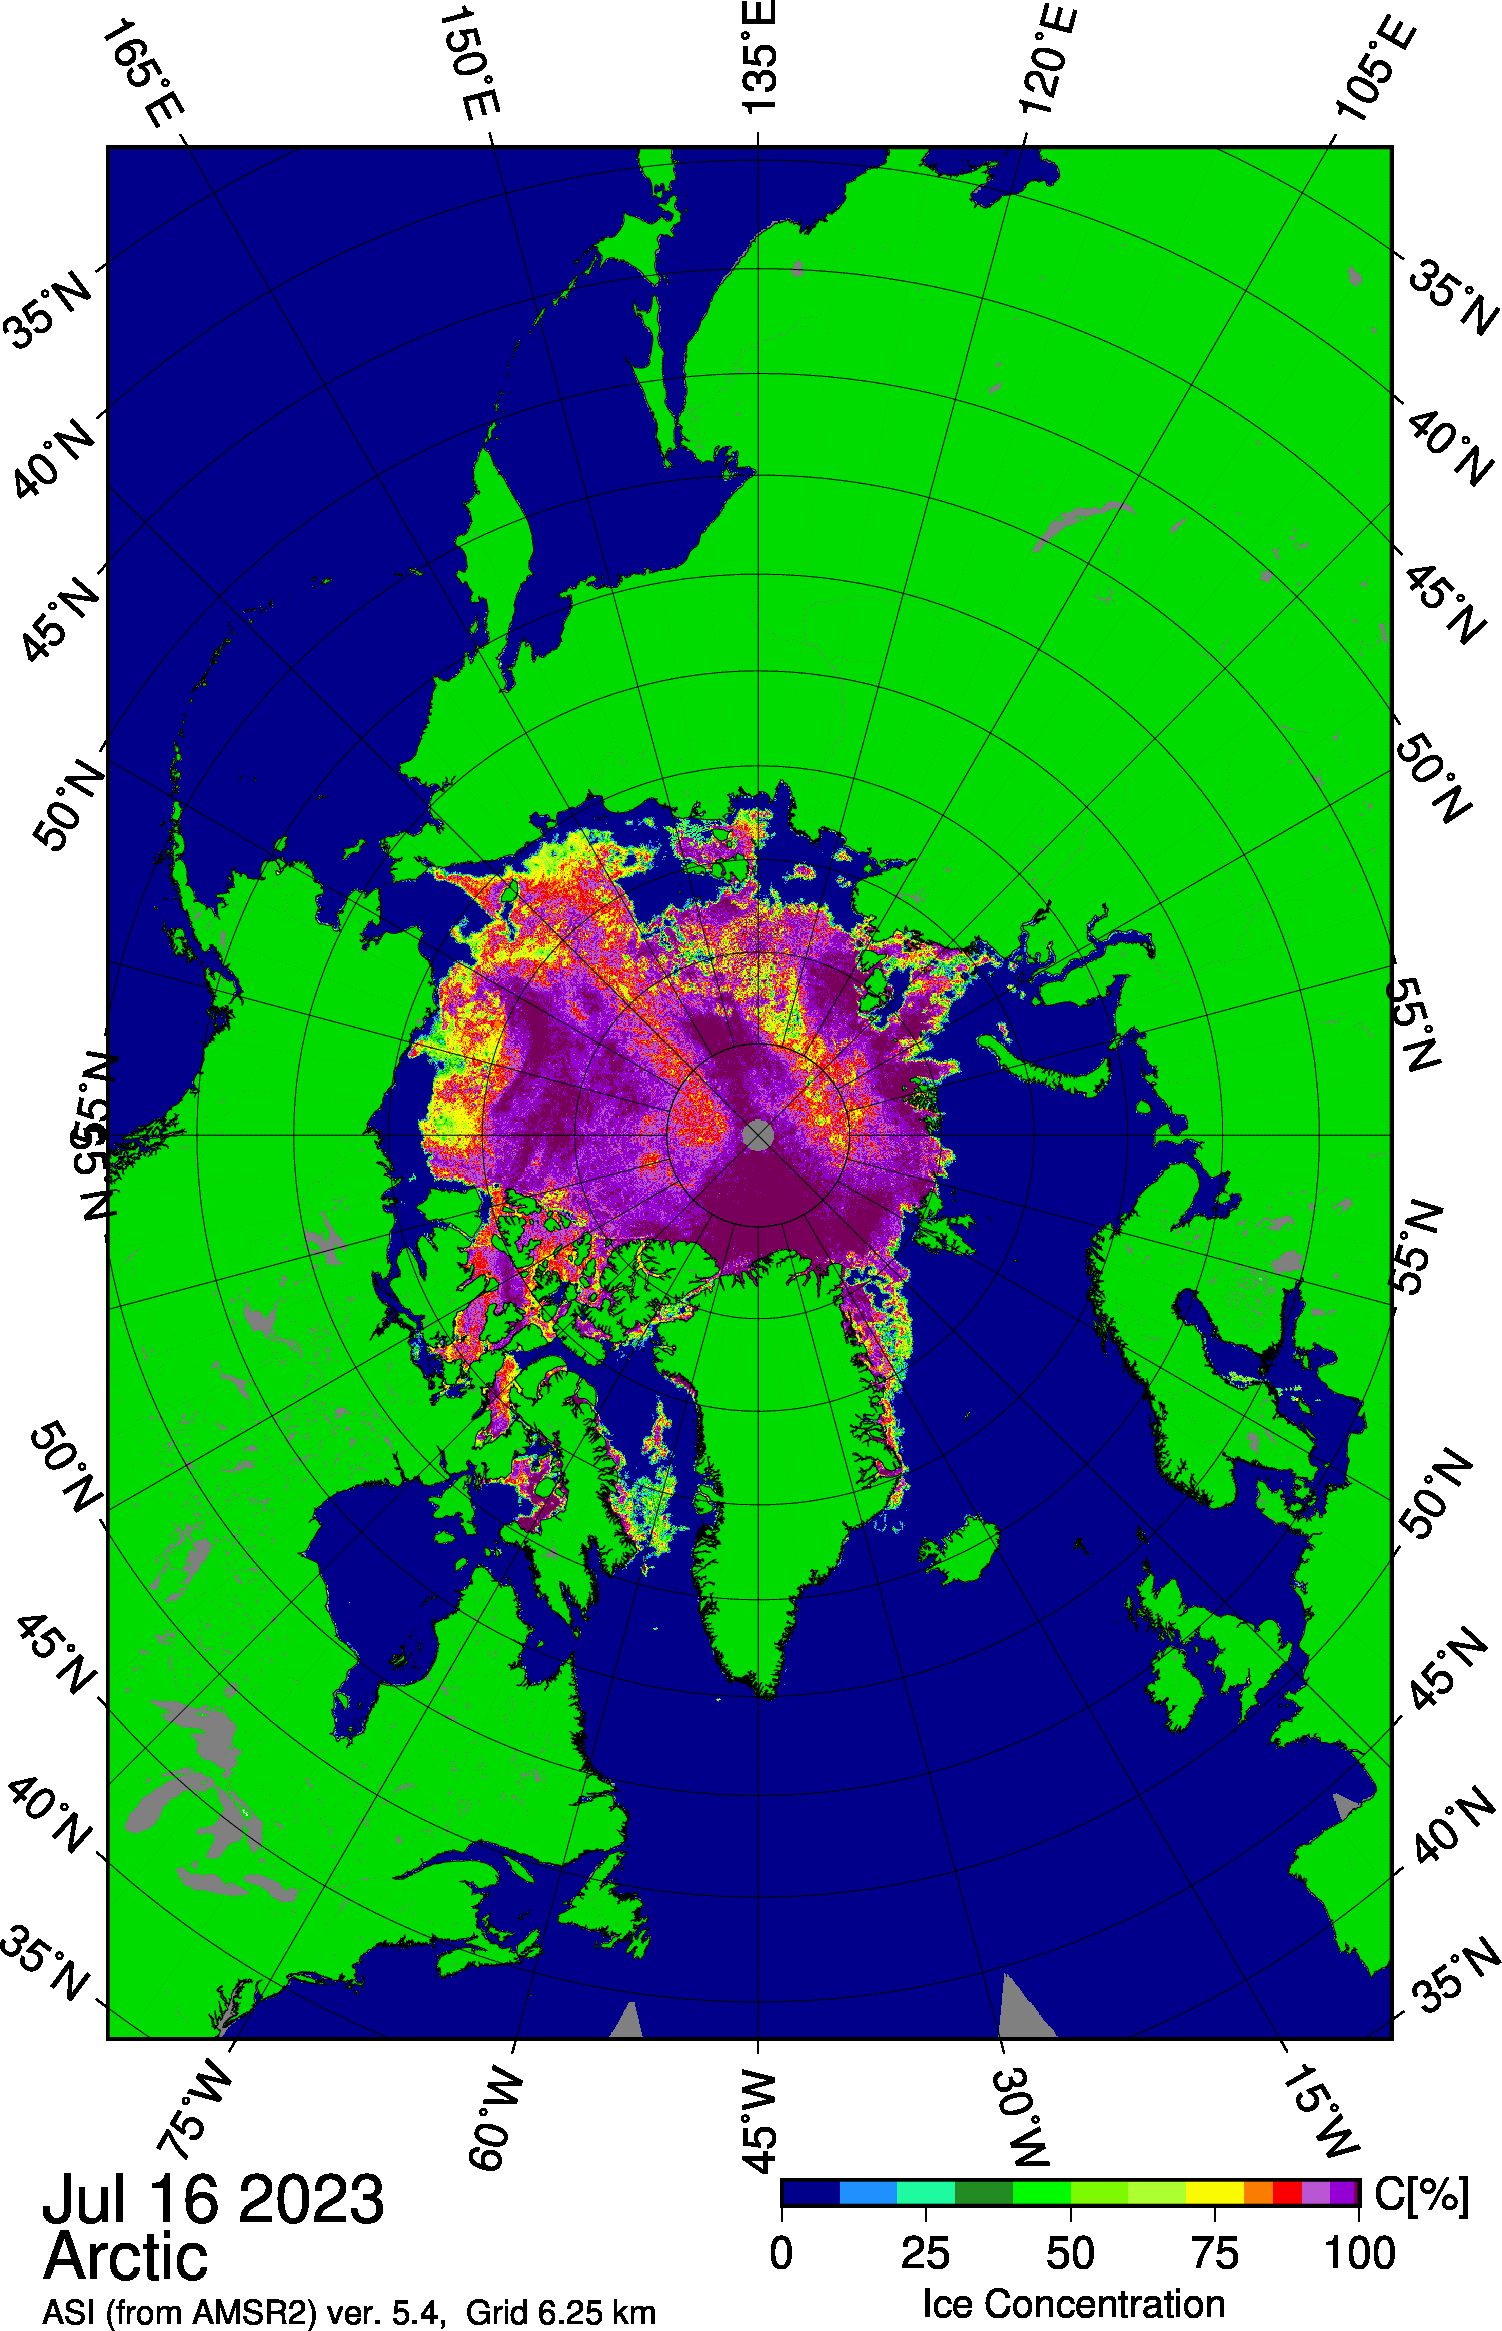
Figure 1c. This map shows a large opening in the East Siberian Sea as well as several smaller openings within the pack further north of the polynya, and areas of low concentration in the Beaufort Sea north of Alaska. Sea ice concentration data are from Advanced Microwave Scanning Radiometer 2 (AMSR2) imagery.
Credit: University of Bremen
High-resolution image
During the first half of July, Arctic sea ice extent declined at a near-average pace of 81,800 square kilometers (31,600 square miles) per day, just below the 1981 to 2010 average of 86,200 square kilometers (33,300 square miles) per day (Figure 1a). As of this post, sea ice in the Arctic is about 1.31 million square kilometers (506,000 square miles) below the 1981 to 2010 reference period, and ice extent for July 17 is twelfth lowest in the 45-year satellite record.
However, several regions have far below average extent, including Hudson Bay, which according to the satellite data became ice-free quite early this year, the Kara Sea, and the Beaufort Sea (Figure 1b). Sea ice extent and concentration from the higher-resolution Advanced Microwave Scanning Radiometer 2 (AMSR2) data processed by the University of Bremen shows a large opening in the East Siberian Sea as well as several smaller openings within the pack further north of the polynya, and areas of low concentration in the Beaufort Sea north of Alaska (Figure 1c). A large polynya has also formed in the Kara Sea near Severnaya Zemlya.
To date since June 1, 3.82 million square kilometers (1.47 million square miles) of ice have melted.
Conditions in context
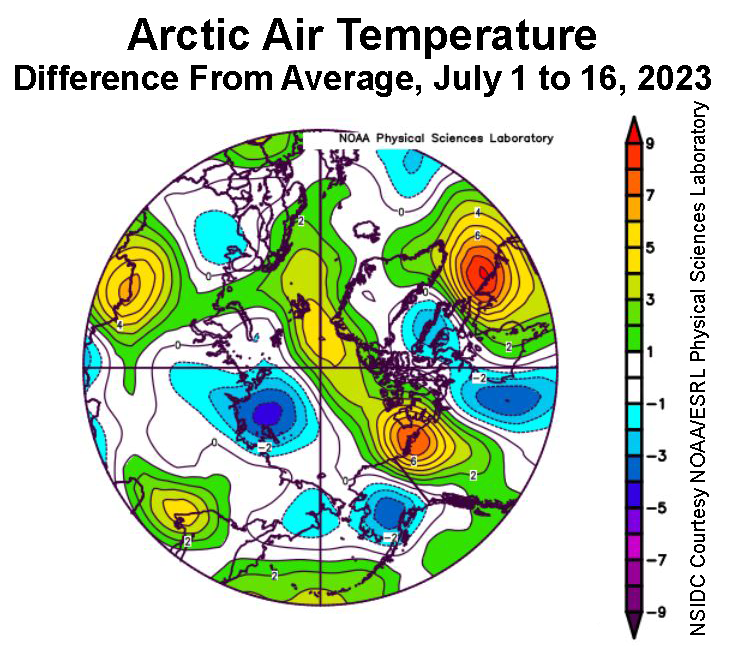
Figure 2a. This plot shows the departure from average air temperature in the Arctic at the 925 hPa level, in degrees Celsius, for July 1 to 16, 2023. Yellows and reds indicate higher than average temperatures; blues and purples indicate lower than average temperatures.
Credit: NSIDC courtesy NOAA Earth System Research Laboratory Physical Sciences Laboratory
High-resolution image
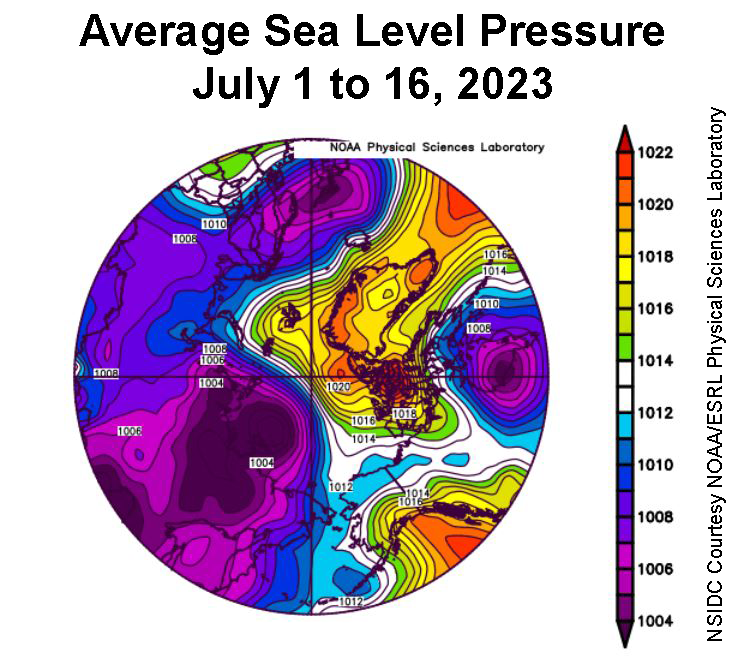
Figure 2b. This plot shows average sea level pressure in the Arctic in millibars for July 1 to 16, 2023. Yellows and reds indicate high air pressure; blues and purples indicate low pressure.
Credit: NSIDC courtesy NOAA Earth System Research Laboratory Physical Sciences Laboratory
High-resolution image
Air temperatures at the 925 millibar level (approximately 2,500 feet above the surface) over the Arctic Ocean for the first half of July ranged from 3 to 6 degrees Celsius (5 to 11 degrees Fahrenheit) below average over the Laptev Sea, contrasting with above-average values of 2 to 7 degrees Celsius (4 to 13 degrees Fahrenheit) in a band extending from northeast of Greenland to the Beaufort Sea off the coast of Canada (Figure 2a). Particularly warm conditions were the rule near the MacKenzie River delta. Another area of warm conditions existed in the southern Baffin Bay and the Labrador coast. The atmospheric circulation for the first half of July was characterized by generally low pressure over the Siberian side of the Arctic Ocean, and high air pressure in a broad area covering Greenland, Fram Strait, and the northern Barents Sea (Figure 2b).
Smoke on the Arctic water
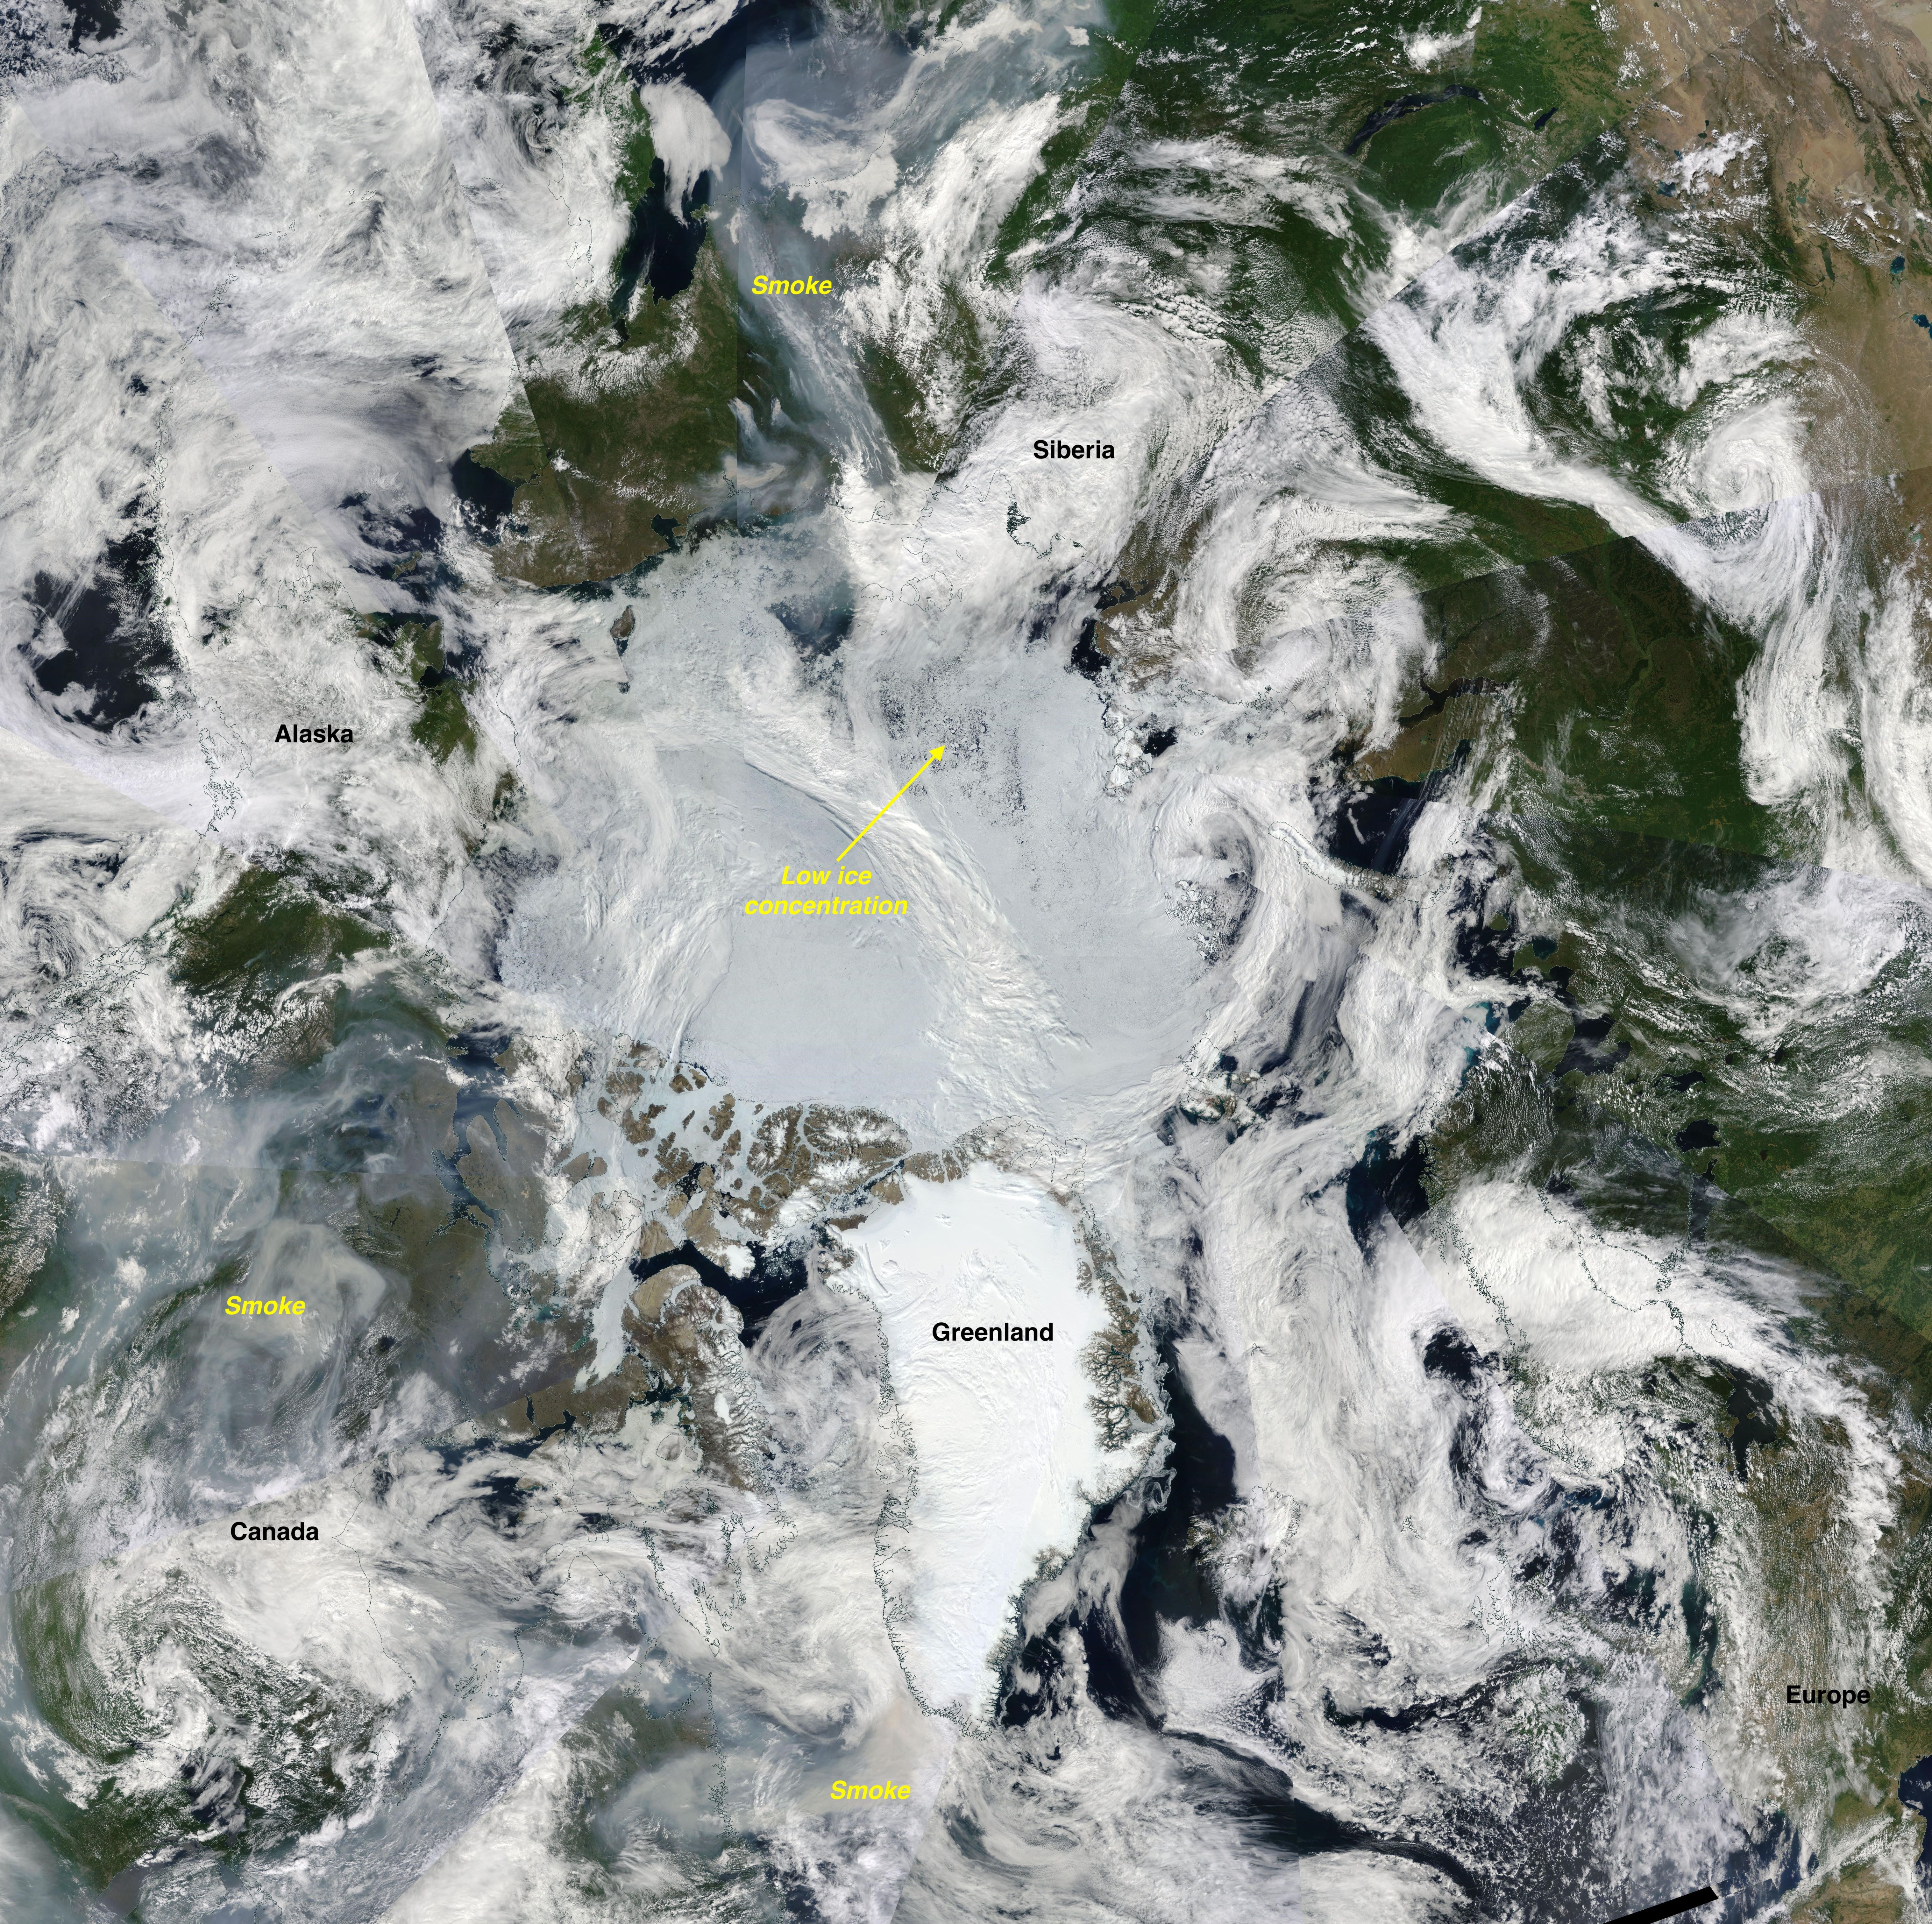
Figure 3. This true color composite image from the NASA Moderate Resolution Imaging Spectroradiometer (MODIS) on July 16 shows the North Pole at the center of the image, with Greenland pointing down.
Credit: NASA Worldview
High-resolution image
A relatively clear-sky image from the NASA Moderate Resolution Imaging Spectroradiometer (MODIS) sensor on July 16 provides a visual glimpse of the condition of sea ice and surrounding areas (Figure 3). Open water is visible in the East Siberian Sea with lower concentration ice extending toward the east, confirming the concentration pattern seen in the AMSR2 imagery (Figure 1c). Another interesting feature of the MODIS image is the wildfire smoke over Canada, which has drifted into the US causing air quality issues. There is also wildfire smoke in eastern Siberia. Some smoke from both areas have drifted over coastal sea ice areas. Such smoke can reduce the amount of solar energy reaching the sea ice surface, which could slow melt. However, as smoke particles fall onto the ice, they darken the ice surface, causing it to absorb more of the sun’s energy, which would enhance melt. Given the limited region of sea ice covered by smoke, any effect is unlikely to substantially impact this year’s melt.
Antarctic sea ice extent
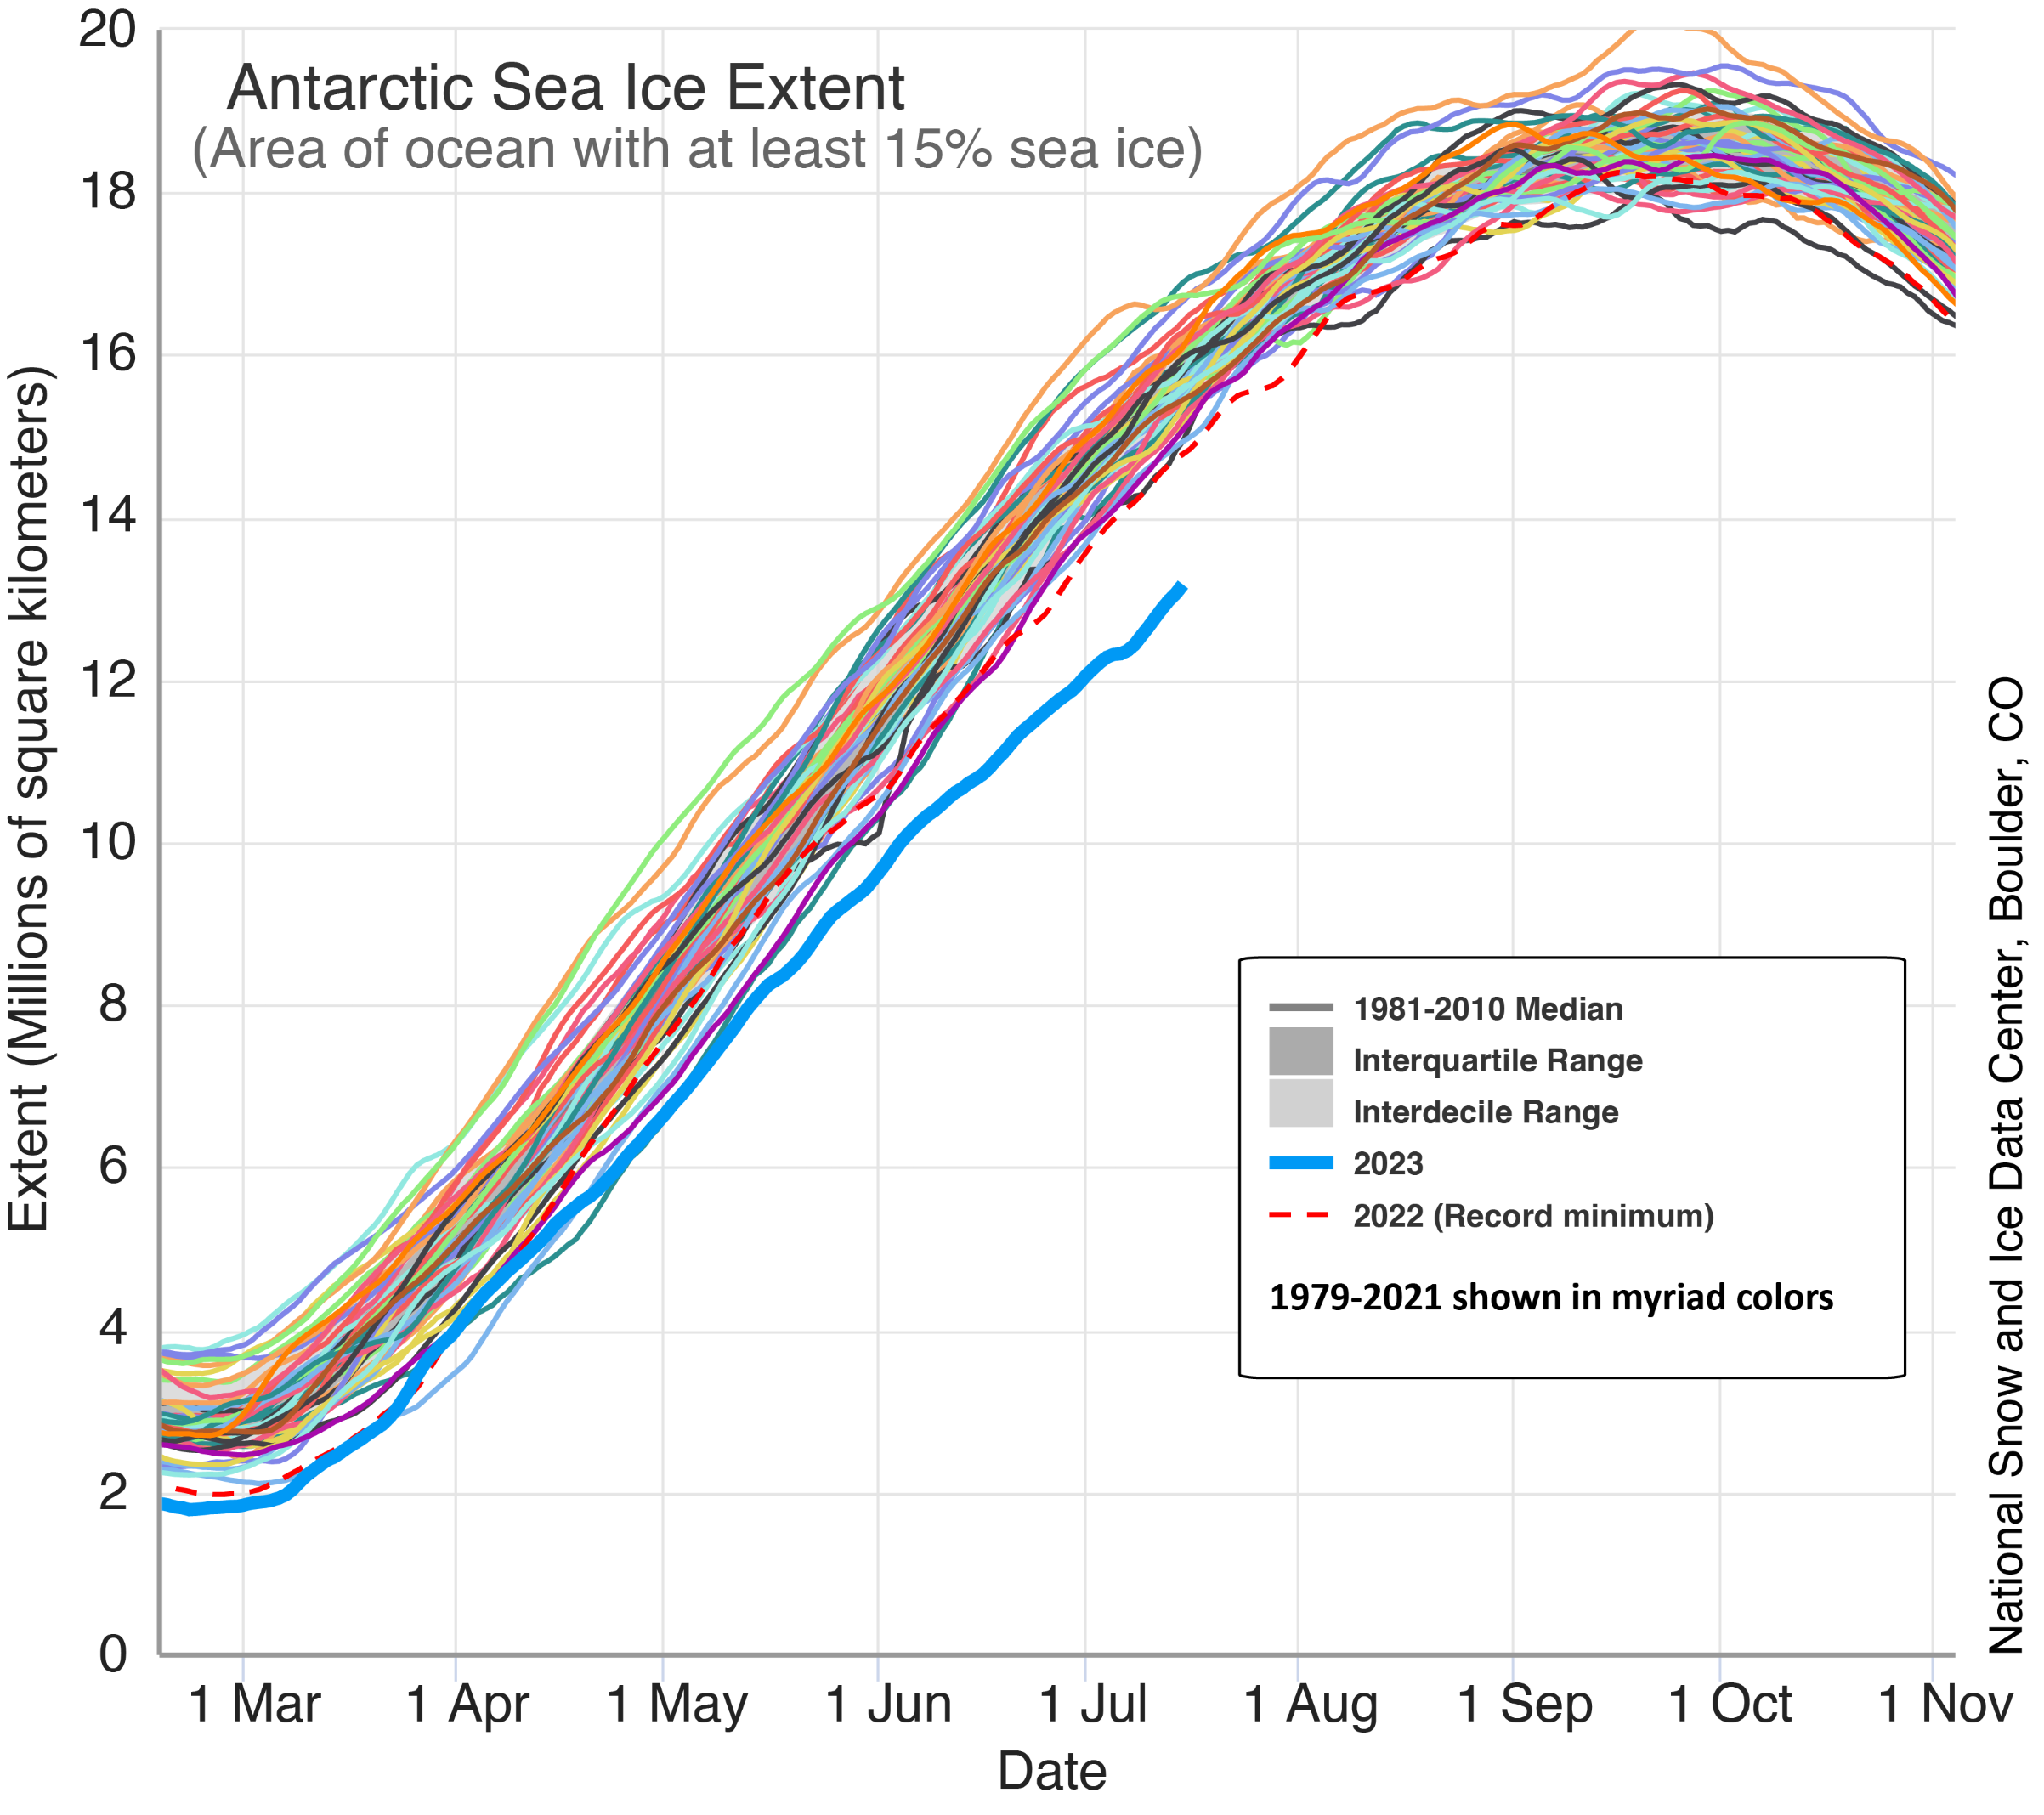
Figure 4a. The graph above shows sea ice extent for February 18 to November 2 for every year in the 45-year satellite data set, with 2023 shown in blue. The dashed red line is the 2022 ice extent, which was the former record summer minimum low before 2023.
Credit: Ted Scambos, Cooperative Institute for Research in Environmental Sciences
High-resolution image
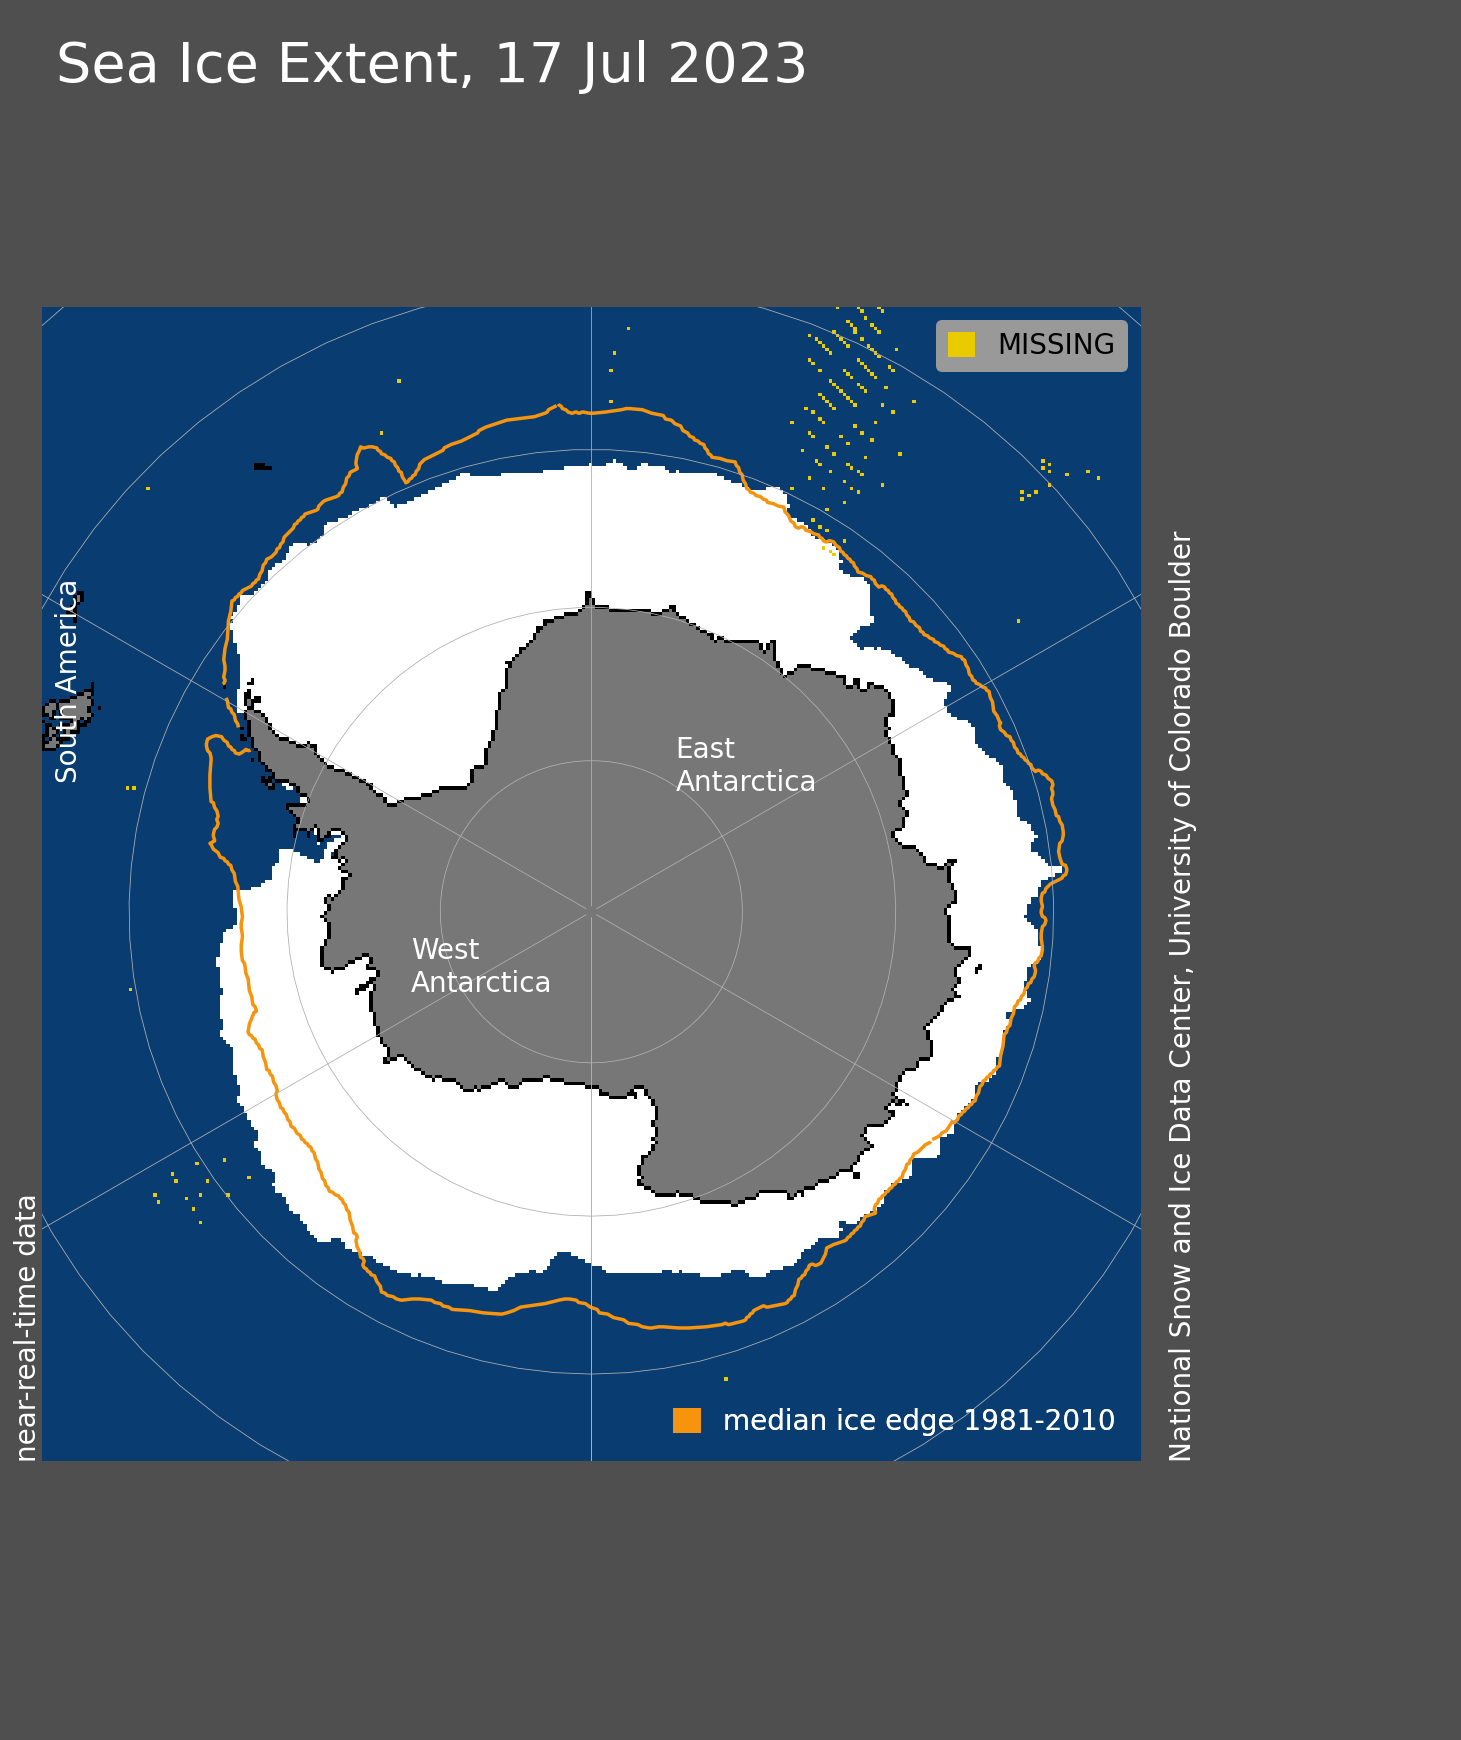
Figure 4b. Antarctic sea ice extent for July 17, 2023 was 13.45 million square kilometers (5.19 million square miles). The orange line shows the 1981 to 2010 average extent for that day. Sea Ice Index data. About the data
Credit: National Snow and Ice Data Center
High-resolution image
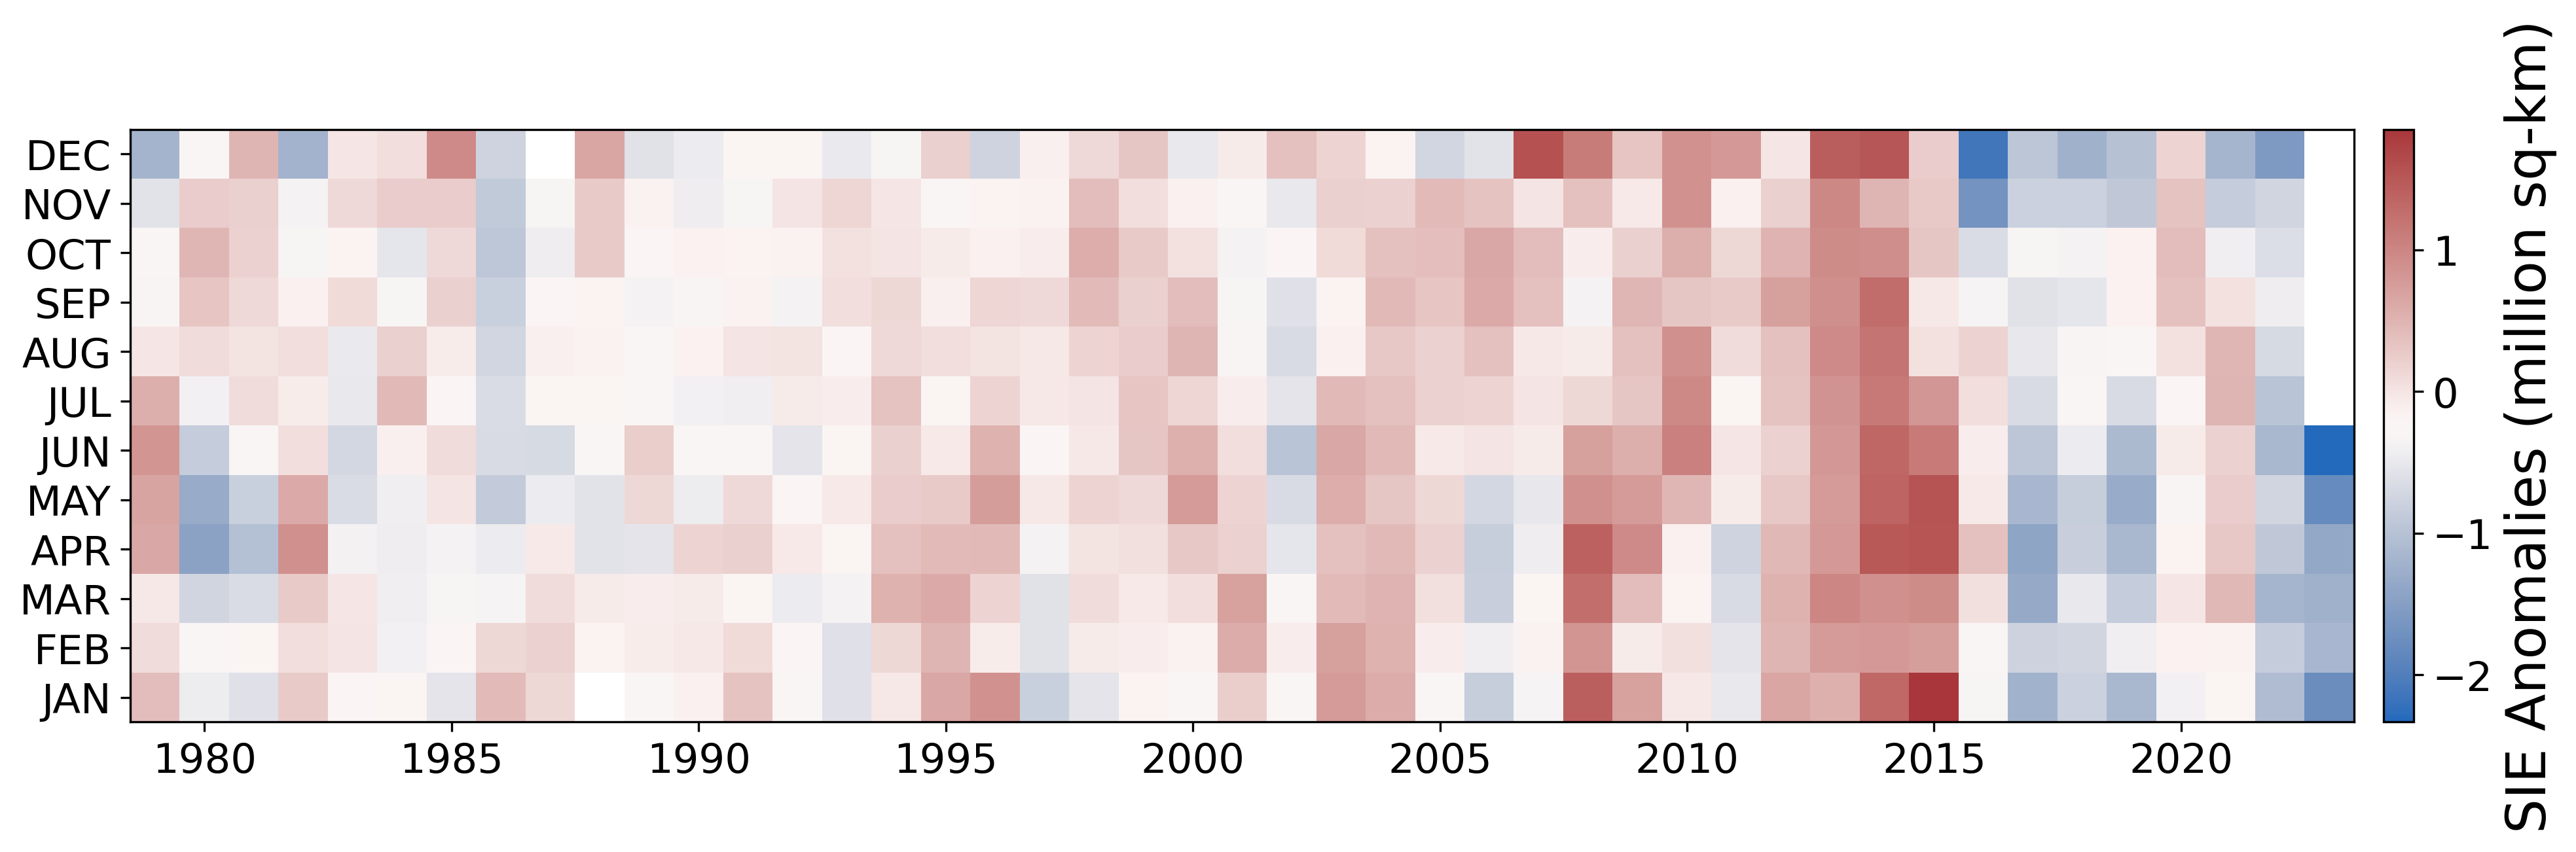
Figure 4c. This figure shows the monthly Antarctic sea ice extent (SIE) anomaly (difference relative to the 1981 to 2010 average) for January 1979 to July 2023. The x-axis shows years, 1979 through 2023. The y-axis shows months of the year from January (bottom) to December (top). Red shades indicate higher than average extent, while blue shades indicate lower than average extent, with darker shades corresponding to larger differences.
Credit: Julienne Stroeve, National Snow and Ice Data Center
High-resolution image
Sea ice surrounding the Antarctic continent continues to be exceptionally low. Antarctic ice extent as of mid-July is more than 2.6 million square kilometers (1.00 million square miles) below the 1981 to 2010 average, an area nearly as large as Argentina or the combined areas of Texas, California, New Mexico, Arizona, Nevada, Utah, and Colorado. It is 1.6 million square kilometers (618,000 square miles) below the previous record low extent for the date, set in 2022 (Figure 4a). Low ice extent is present nearly everywhere, but particularly in the northern Weddell Sea, western Ross Sea, and southern Bellingshausen Sea (Figure 4b). Above average extent is prevalent in the Amundsen Sea.
The research community has been discussing the causes for the sudden turnabout in Antarctic sea ice extent, from a weakly positive linear trend from 1978 to 2015 to a strongly negative trend since 2016; and the events of 2022 and 2023 have garnered much attention. Many recent studies point to changing conditions in the upper ocean layer. Warm water from the north has mixed into this layer, which tends to increase the stratification of the ocean. This appears to coincide with when sea ice went from record high extents to low extents beginning in September 2016, and still lower extents in 2023.
Further reading
Eayrs, C., X. Li, M. N. Raphael, and D. M. Holland. 2021. Rapid decline in Antarctic sea ice in recent years hints at future change. Nature Geoscience. doi:10.1038/s41561-021-00768-3

