Sea ice extent for February 2021 tracked well below average, but at month’s end was still higher than levels recorded in several recent years. Extent grew at an average pace. For the first two weeks of the month, sea level pressure was extremely high over the central Arctic Ocean, driving a pronounced and enlarged Beaufort Gyre sea ice circulation. A strong negative phase of the Arctic Oscillation was a part of the overall Arctic pattern.
Overview of conditions
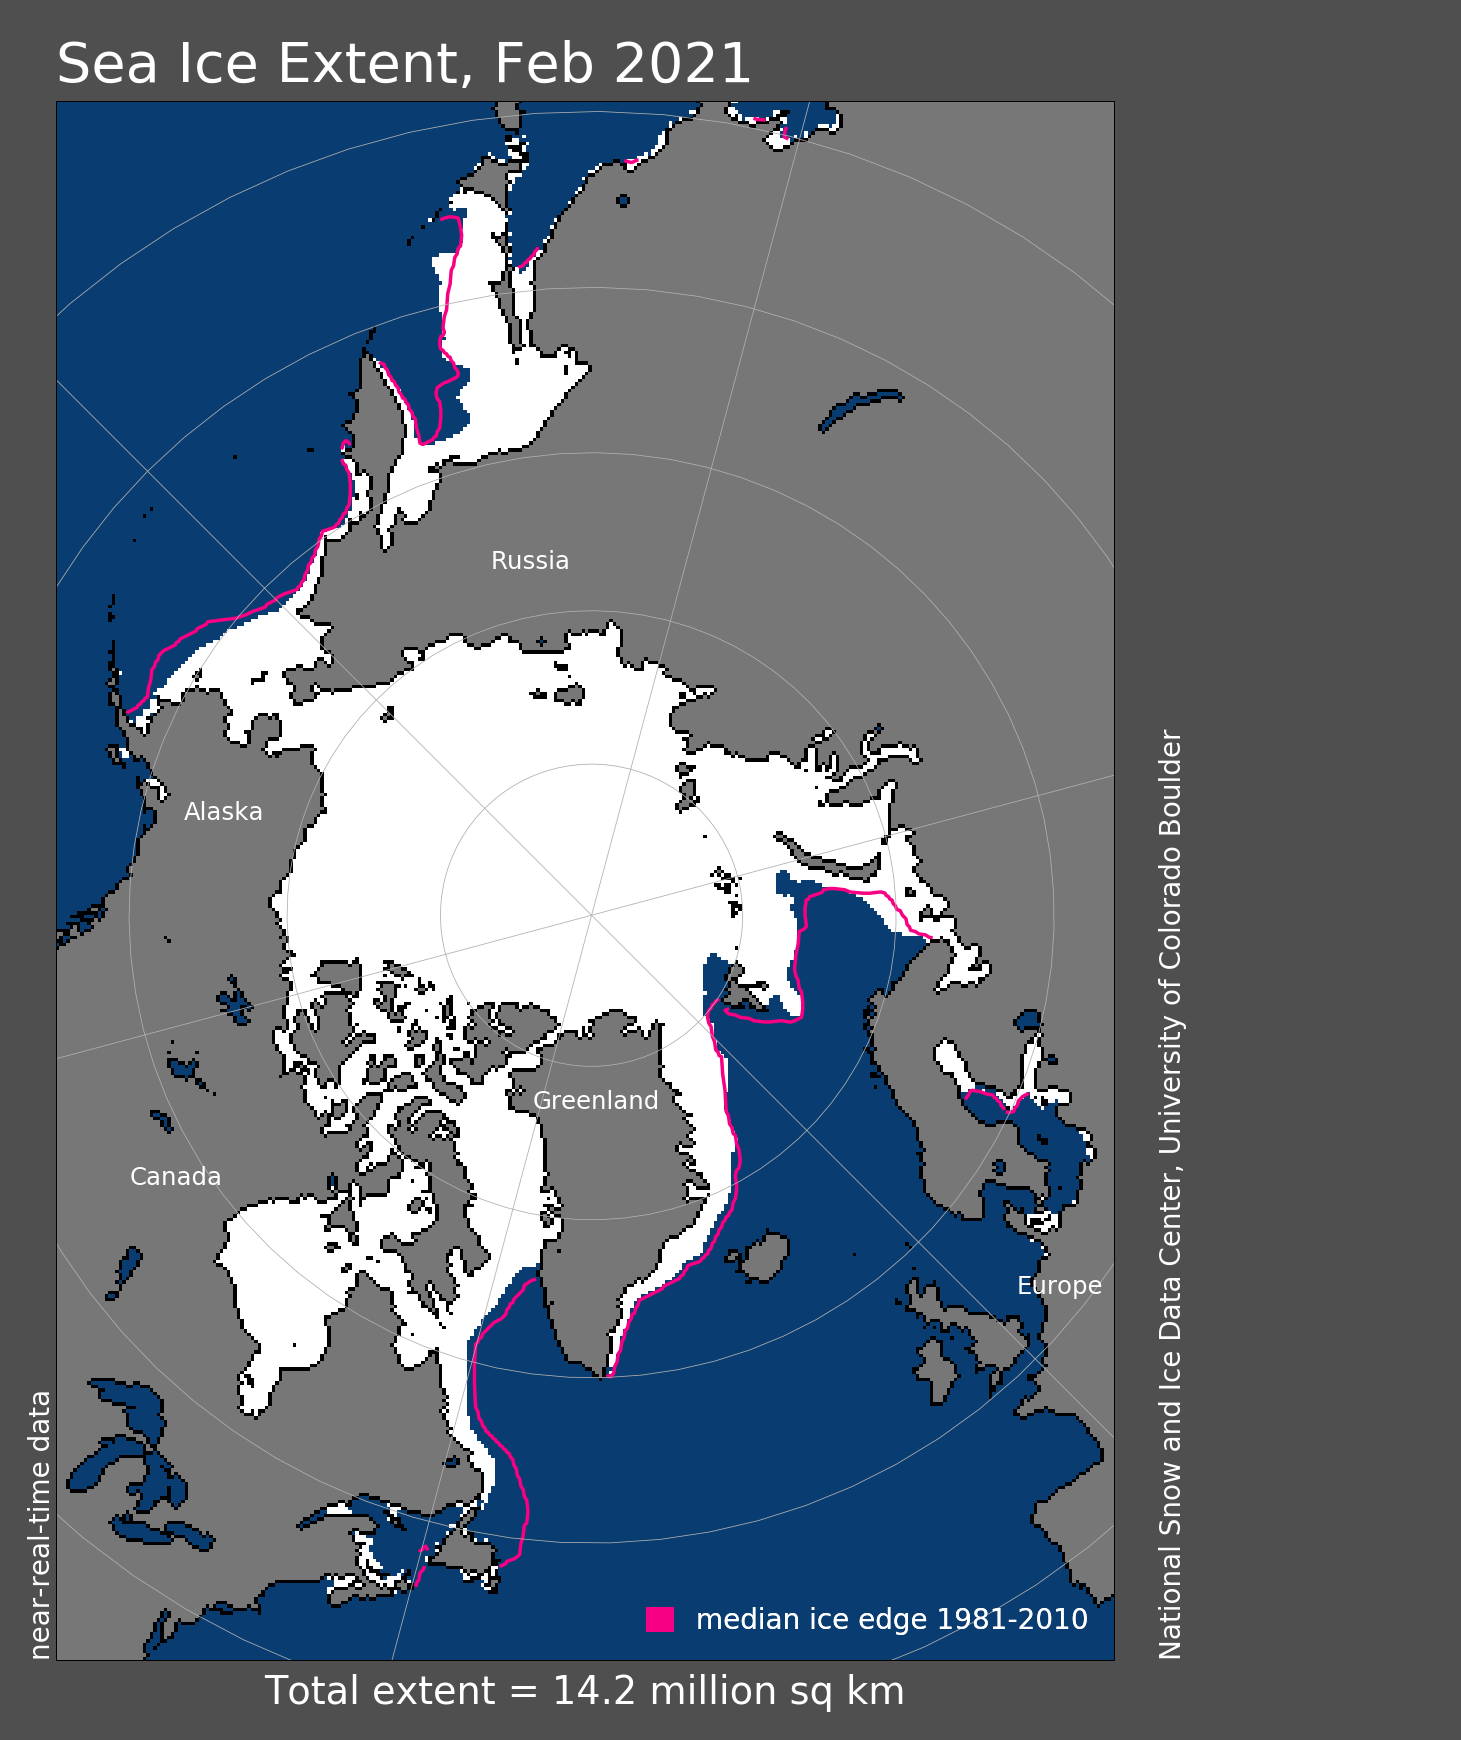
Figure 1. Arctic sea ice extent for February 2021 was 14.39 million square kilometers (5.56 million square miles). The magenta line shows the 1981 to 2010 average extent for that month. Sea Ice Index data. About the data
Credit: National Snow and Ice Data Center
High-resolution image
Arctic sea ice extent averaged for the month of February 2021 was 14.39 million square kilometers (5.56 million square miles), placing it seventh lowest in the satellite record for the month. This was 910,000 square kilometers (351,000 square miles) below the 1981 to 2010 February average and 420,000 square kilometers (162,000 square miles) above the record low mark for February set in 2018. For the month of February, ice extent was near average in most regions of the Arctic except most notably in the Gulf of St. Lawrence, and to a lesser extent in the Bering Sea and the Sea of Okhotsk. The ice edge was also further north than average on the northern and western side of Svalbard.
Conditions in context
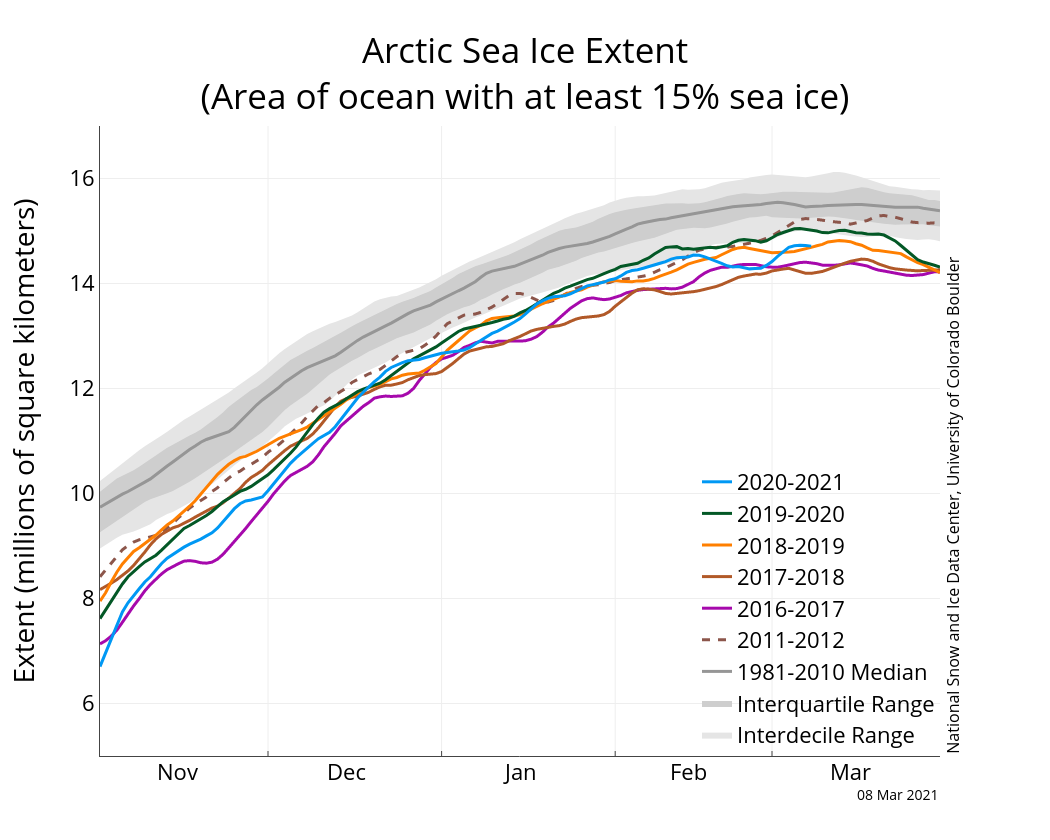
Figure 2a. The graph above shows Arctic sea ice extent as of March 8, 2021, along with daily ice extent data for four previous winter seasons and the record low year. 2020 to 2021 is shown in blue, 2019 to 2020 in green, 2018 to 2019 in orange, 2017 to 2018 in brown, 2016 to 2015 in magenta, and 2011 to 2012 in dashed brown. The 1981 to 2010 median is in dark gray. The gray areas around the median line show the interquartile and interdecile ranges of the data. Sea Ice Index data.
Credit: National Snow and Ice Data Center
High-resolution image
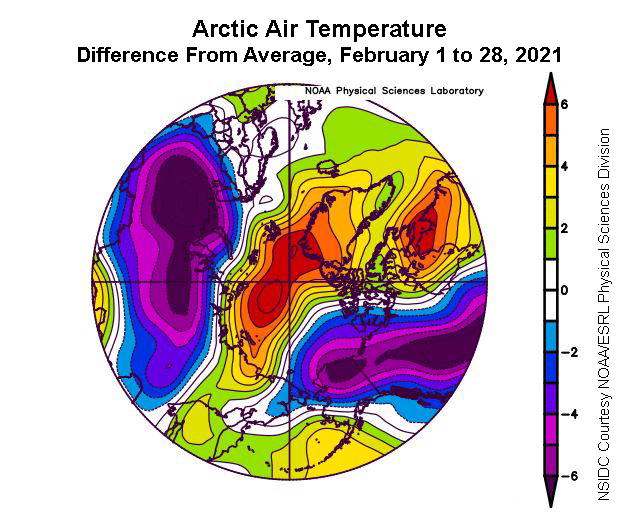
Figure 2b. This plot shows the departure from average air temperature in the Arctic at the 925 hPa level, in degrees Celsius, for February 2021. Yellows and reds indicate higher than average temperatures; blues and purples indicate lower than average temperatures.
Credit: NSIDC courtesy NOAA Earth System Research Laboratory Physical Sciences Division
High-resolution image
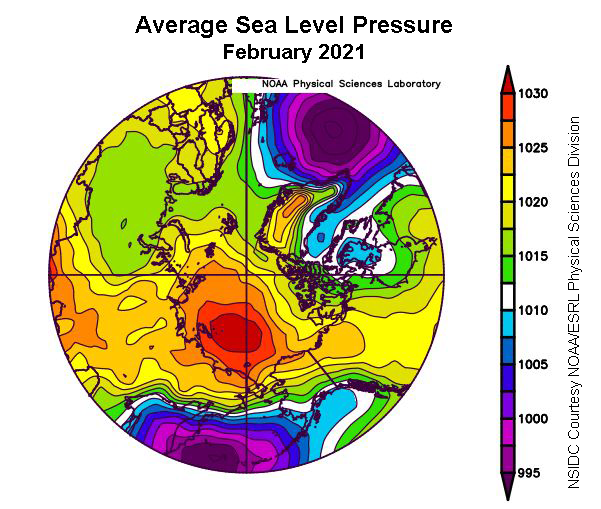
Figure 2c. This plot shows average sea level pressure in the Arctic in millibars for February 2021. Yellows and reds indicate high air pressure; blues and purples indicate low pressure.
Credit: NSIDC courtesy NOAA Earth System Research Laboratory Physical Sciences Division
High-resolution image
Throughout the month, sea ice grew by an average of 9,900 square kilometers (3,800 square miles) per day, roughly half the average rate over the period 1981 to 2010 of 20,300 square kilometers (7,800 square miles per day).
Air temperatures at the 925 hPa level (about 2,500 feet above the surface) were from 1 to 6 degrees Celsius (2 to 11 degrees Fahrenheit) above average across much of the central Arctic Ocean, East Siberian Sea, Atlantic Sector, and Canadian Arctic Archipelago. By contrast, northern Alaska, Siberia, and the Beaufort Seas saw temperatures up to 8 degrees Celsius (14 degrees Fahrenheit) below average (Figure 2b).
The first part of the month was characterized by extremely high sea level pressure over the central Arctic Ocean, driving an exceptionally strong clockwise Beaufort Gyre sea ice circulation. This is consistent with the strongly negative phase of the Arctic Oscillation observed over this time period, which is sometimes associated with a wavy jet stream pattern and cold air outbreaks in lower latitudes, such as was experienced in Texas during the middle of the month. While this pattern broke down later in the month, the average sea level pressure pattern for February still featured a strong Beaufort High, with peak surface pressures exceeding 1,030 (Figure 2c). This atmospheric circulation pattern, driving a pronounced clockwise Beaufort Gyre circulation, led to the transport of thick multiyear ice along the Canadian Arctic Archipelago towards the Alaskan coastline.
February 2021 compared to previous years
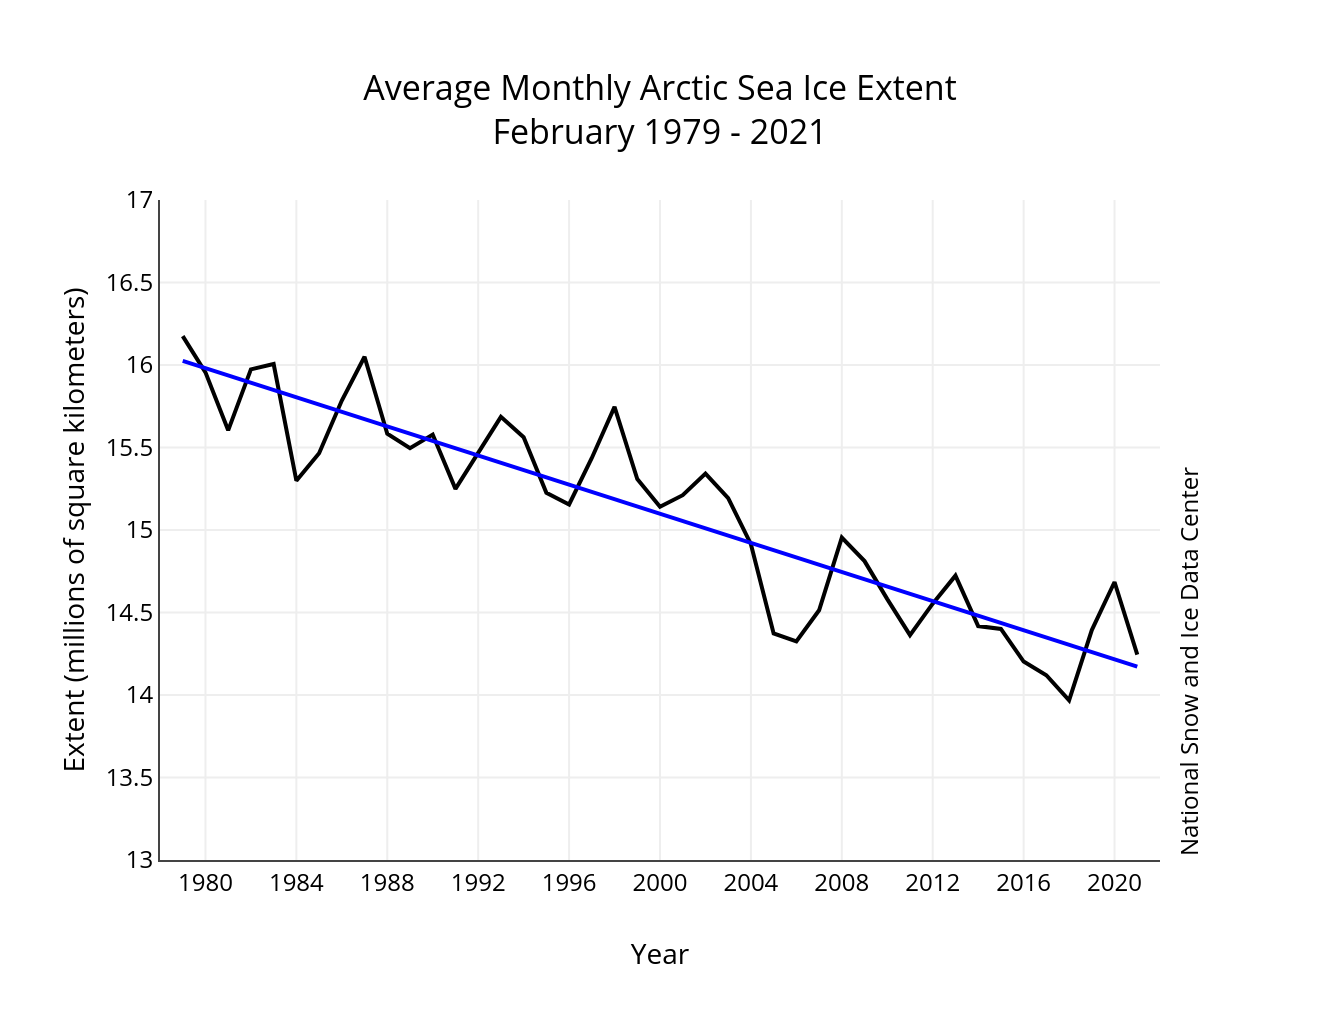
Figure 3. Monthly February ice extent for 1979 to 2021 shows a decline of 2.9 percent per decade.
Credit: National Snow and Ice Data Center
High-resolution image
Including 2021, the linear rate of decline for February ice extent is 2.9 percent per decade. This corresponds to a trend of 43,800 square kilometers (16,900 square miles) per year, which is roughly twice the size of the state of New Hampshire. Over the 43-year satellite record, the Arctic has lost about 1.84 million square kilometers (710,000 square miles) of sea ice in February, based on the difference in linear trend values in 2020 and 1979. This is an area about two and a half times the size of Texas.
The minimum in the south
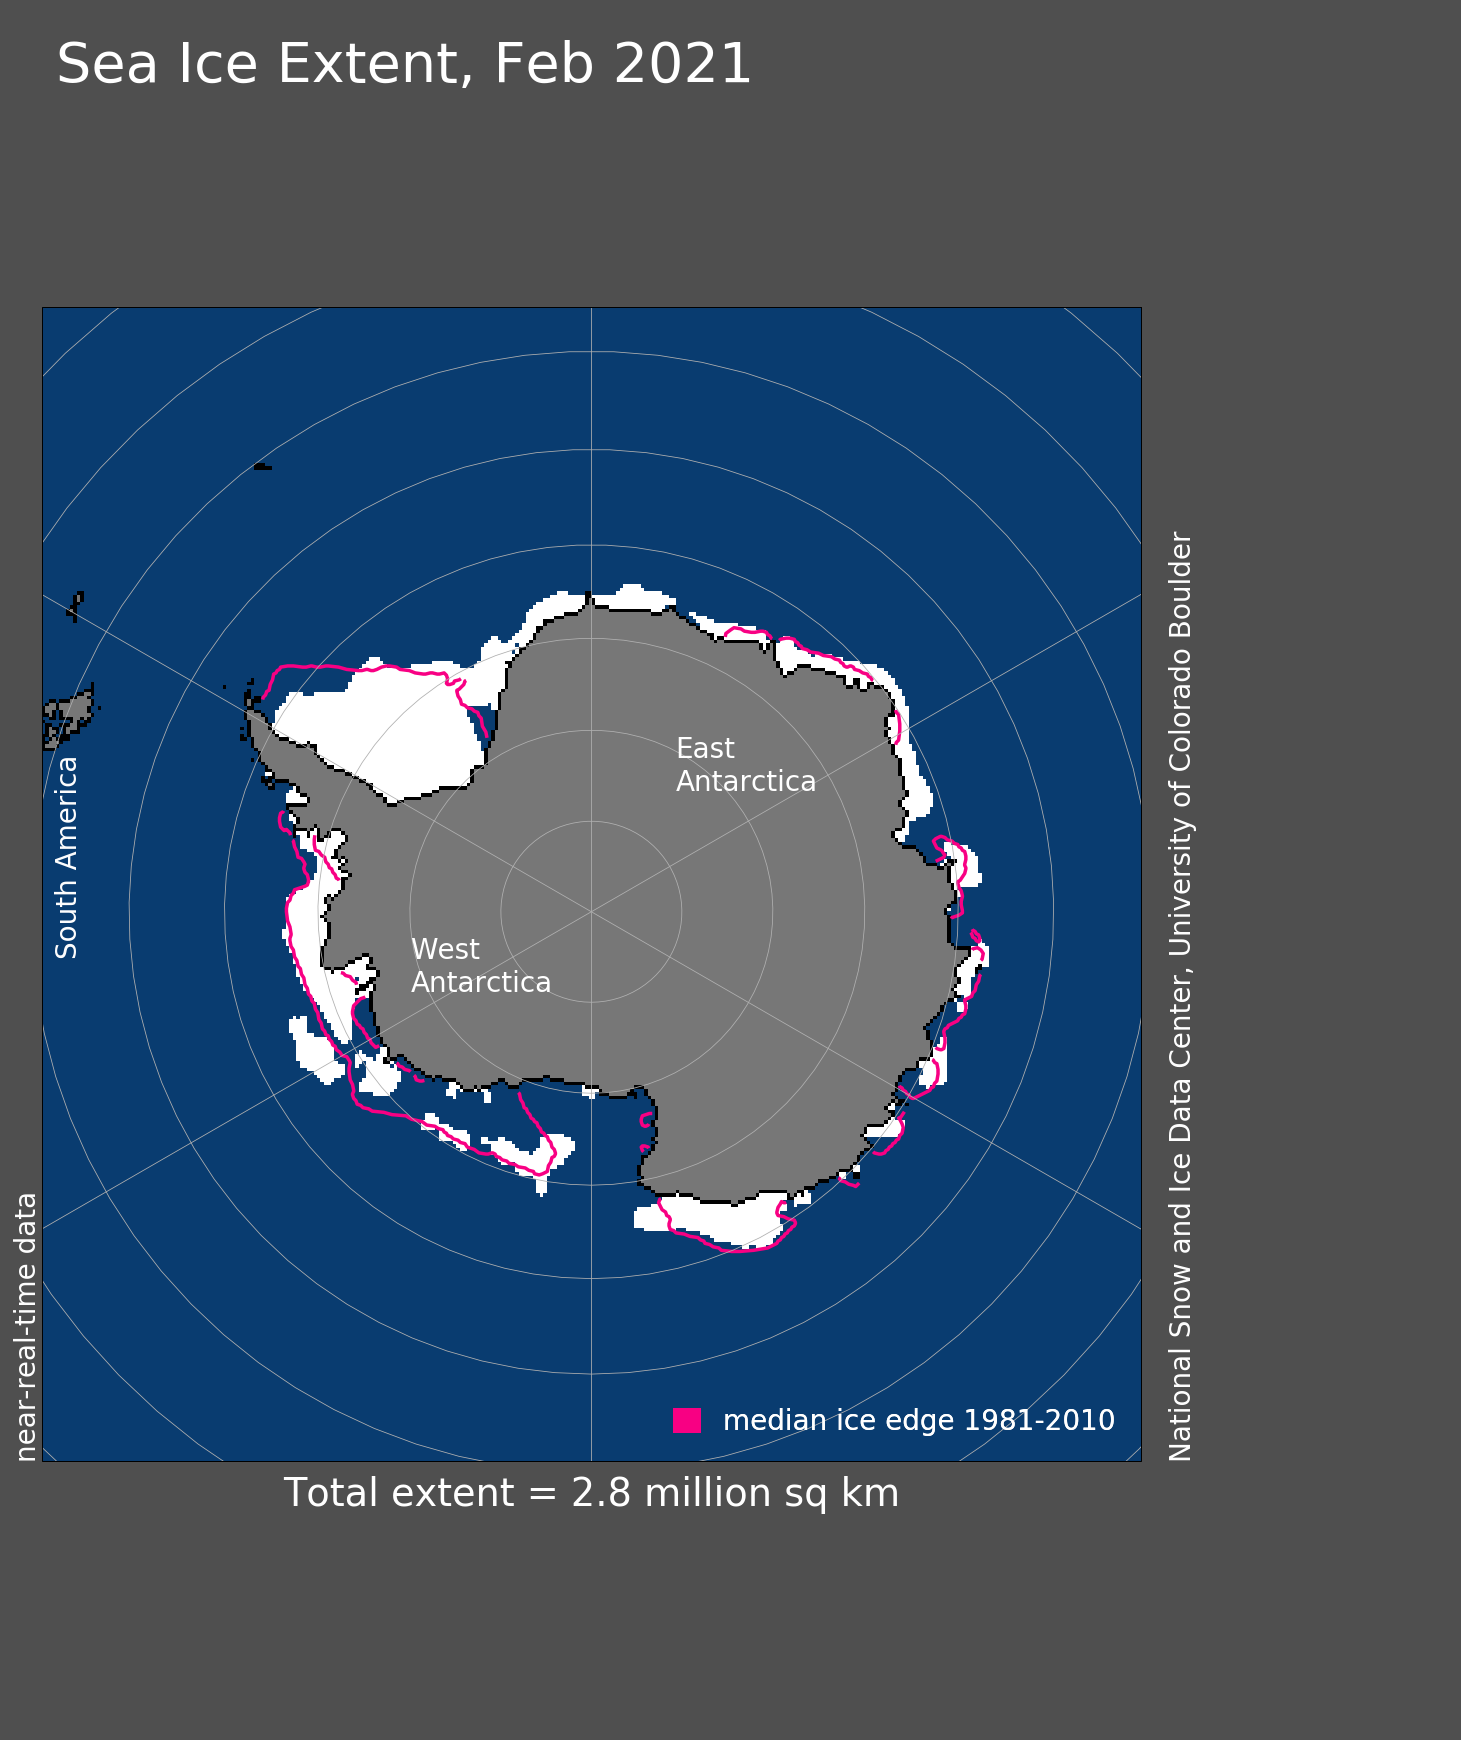
Figure 4. Antarctic sea ice extent for February 2021 was 2.83 million square kilometers (1.09 million square miles). The magenta line shows the 1981 to 2010 average extent for that month. Sea Ice Index data. About the data
Credit: National Snow and Ice Data Center
High-resolution image
Antarctic sea ice extent reached its minimum around February 21, during the period of missing data of which we had notified data users. After February 21, sea ice began a rapid increase in extent caused by the early rapid sea ice growth in the Amundsen and eastern Ross Seas. Advanced Microwave Scanning Radiometer 2 (AMSR-2) data, which was not impacted by the outage, confirms that the minimum was reached on or near February 21.
Sea ice extent has trended below average again after several months in mid- to late 2020 above the 1981 to 2010 average. However, the 2021 minimum extent is twelfth lowest in the satellite record and far from the record low extent, which occurred in 2017. Below-average extents were present in the northern Weddell and eastern Ross Seas, while the Bellingshausen Sea and the Wilkes Land Coast were near average (Figure 4).
Sticking with our 30-year reference climatology
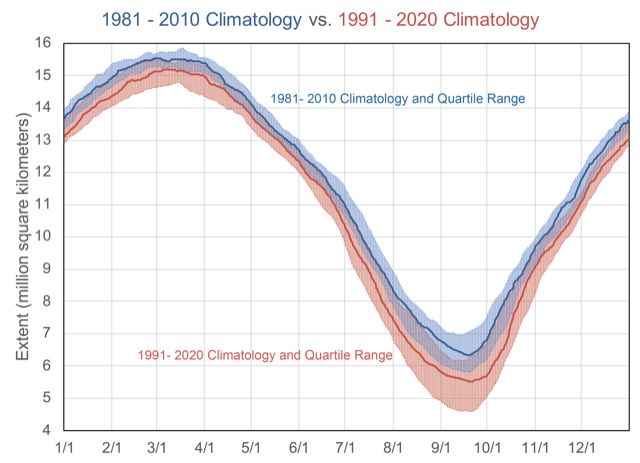
Figure 5. This graph shows the daily median Arctic sea ice extent for the calendar year from the 1981 to 2010 period and the 1991 to 2020 for comparison. NSIDC plans to maintain the 1981 to 2010 period as our standard climatology.
Credit: National Snow and Ice Data Center
High-resolution image
A 30-year climatology is commonly used as a reference period in weather and climate to define “normal” conditions. Thirty years is long enough to average out most natural variations in climate, like El Niño, that can affect the average in the short term. At the same time, 30 years is short enough that it provides a window into recent experience for planning purposes, such as crop rotation. Weather forecast services update their climatology with each new decade. So, the US National Weather Service will soon update the period from 1981 to 2010 to 1991 to 2020.
However, a shifting baseline makes tracking long-term climate change more complicated. As the baseline shifts, anomalies (amount above or below “normal”) and relative (percent per decade) trends will change. For climate, it is better to use a fixed period with a good data record so that as new data is collected, there is a consistent baseline for decadal or longer evaluation of change. Ideally, this baseline period would be relatively stable and without much of a trend. This is particularly a problem for Arctic sea ice where the last 10 years have had several extremely low extents. Including these recent years hardly represents “normal” in terms of the long-term climate. For this reason, we plan to maintain the 1981 to 2010 period as our standard climatology. The period comprises the earliest three full decades in the continuous satellite record. The data for this period have been well validated and consistency has been maintained through careful calibrations between different sensors used in the time series. Figure 5 shows the daily median extent for the calendar year from the 1981 to 2010 period and the 1991 to 2020 for comparison. As expected, the 1991 to 2020 median extents are lower than the 1981 to 2010 values, particularly during summer. The annual minimum of the 1991 to 2020 median extent is about 800,000 square kilometers (309,000 square miles) lower than the 1981 to 2010 median. Additionally, 1991 to 2020 sea ice extents exhibit much greater variability compared to sea ice conditions between 1981 and 2010.
We will consider adding a 1991 to 2020 median line to our Charctic interactive sea ice graph. Our Sea Ice Analysis Tool allows users to customize the baseline period for anomaly calculations. A more thorough discussion of the issue of climate “normal” can be found in a recent Yale Climate Connections article.
Addressing the mid-February data gap
As previously posted, a gap occurred in our sea ice extent estimates from February 20 to 21 due to a data loss by our source of passive microwave sensor data used to derive our concentration and extent estimates. These data unfortunately do not appear to be recoverable. However, the sensor is still healthy and another outage is not expected. The data gap resulted in temporary outages of Sea Ice Index data and various tools, such as Charctic. Values for February 20 and 21 were derived by interpolating from surrounding days.

