Arctic sea ice extent for January 2021 tracked below average, with the monthly average finishing sixth lowest in the satellite record. While air temperatures were well above average on the Atlantic side of the Arctic, air temperatures were strongly below average over Siberia. A warm spell hit the Canadian Arctic, and rain fell on snow over Nunavut, Canada. According to NASA and the National Oceanic and Atmospheric Administration (NOAA), 2020 tied for the highest global annual temperature with 2016.
Overview of conditions
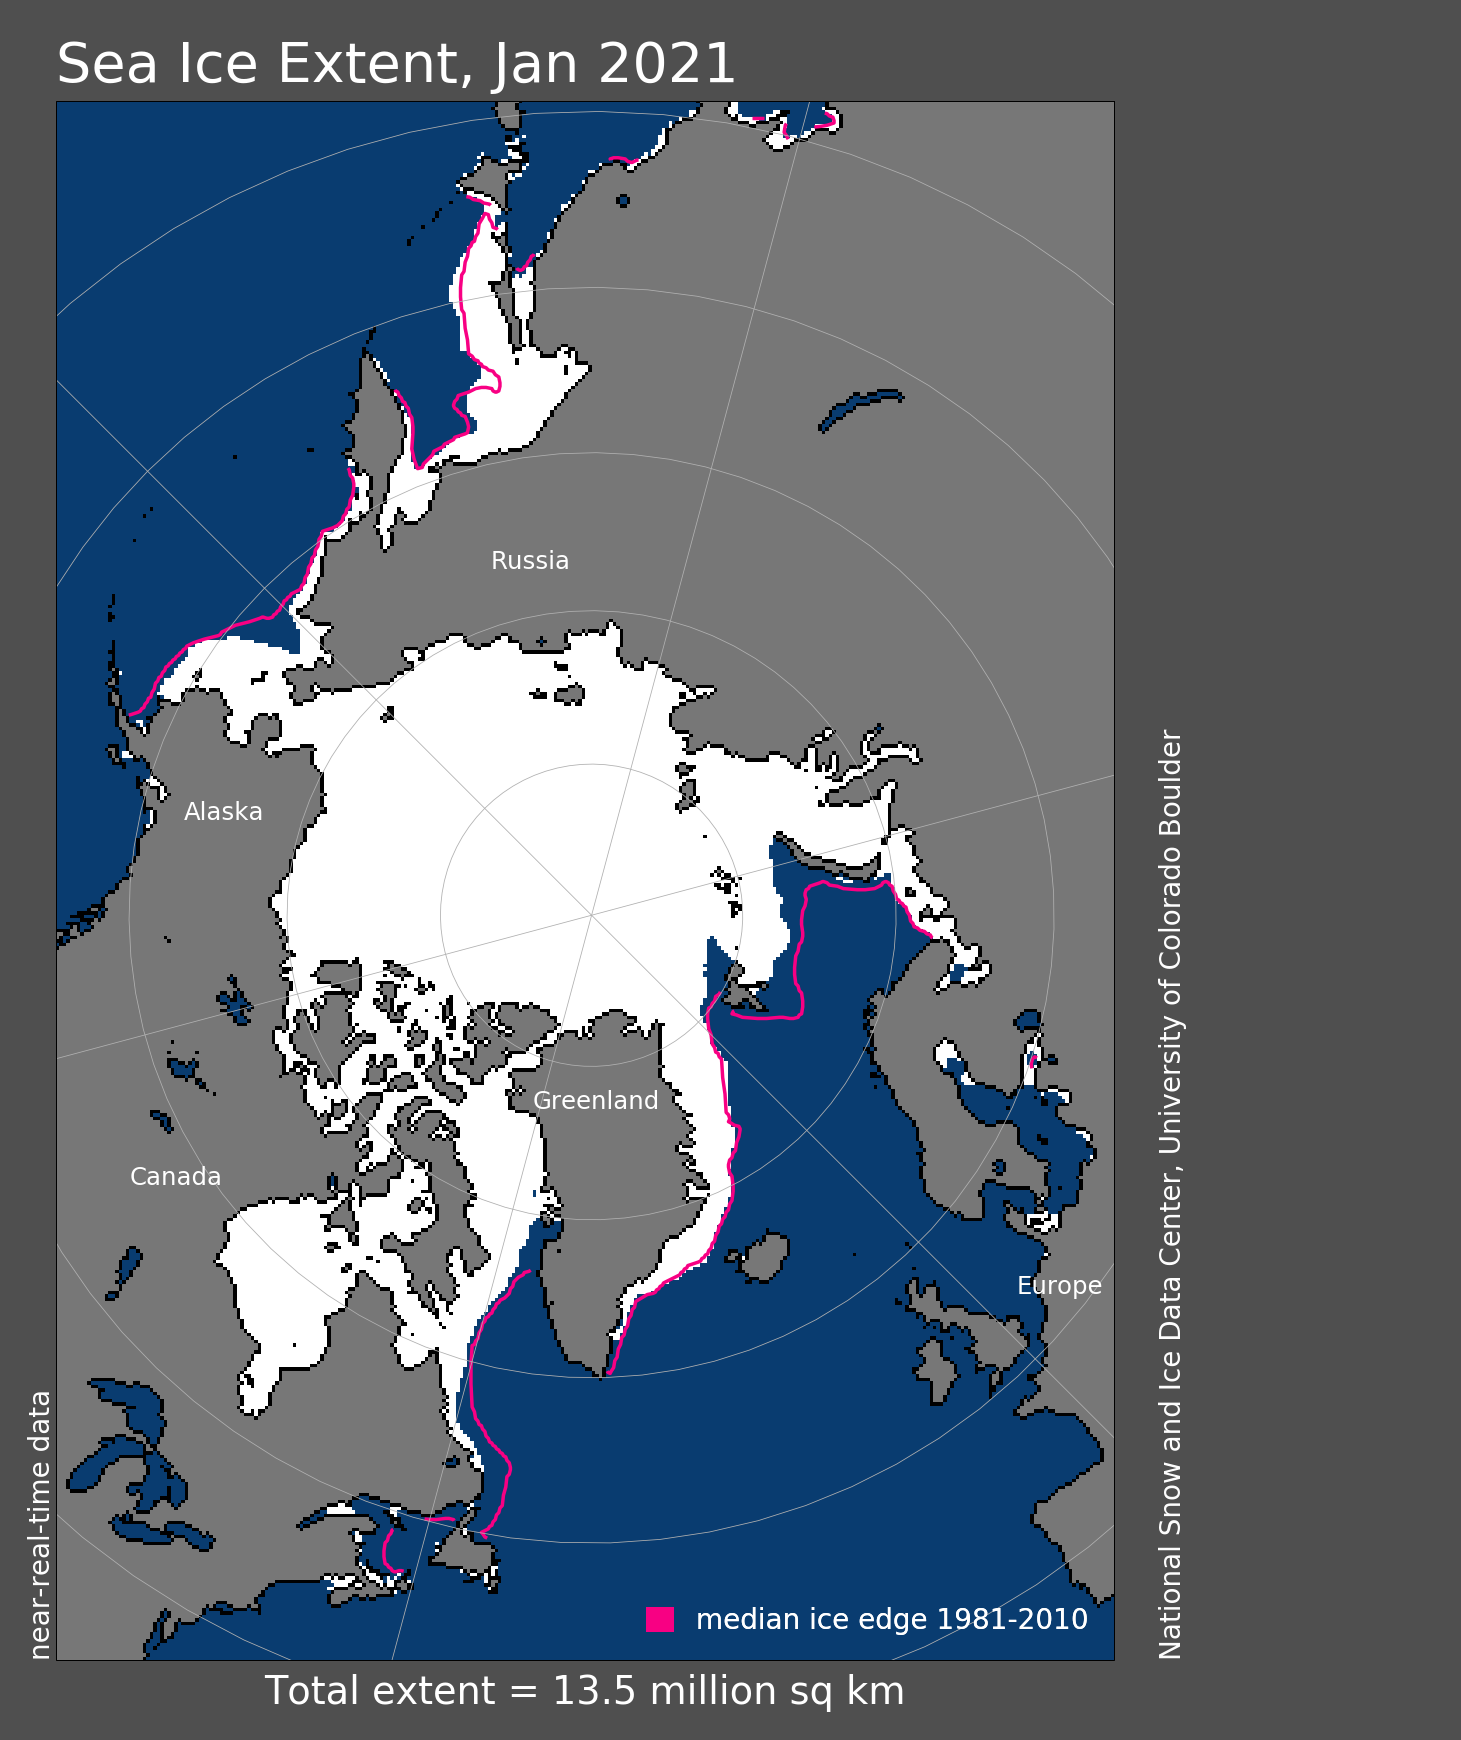
Figure 1. Arctic sea ice extent for January 2021 was 13.48 million square kilometers (5.20 million square miles). The magenta line shows the 1981 to 2010 average extent for that month. Sea Ice Index data. About the data
Credit: National Snow and Ice Data Center
High-resolution image
Arctic sea ice extent averaged for January 2021 was 13.48 million square kilometers (5.20 million square miles). This was 400,000 square kilometers (154,000 square miles) above the record low set in 2018 and 940,000 square kilometers (363,000 square miles) below the 1981 to 2010 average. Extent continued to track below average in the Barents Sea, Baffin Bay, Davis Strait, and the Labrador Sea. Extent was also below average on the Russian side of the Bering Sea, but elsewhere the ice edge was near its average location for this time of year. Ice extent expanded through the month on the Alaskan side of the Bering Sea and within the Sea of Okhotsk. Ice growth was also prominent in the northern Barents Sea west of Svalbard.
Conditions in context
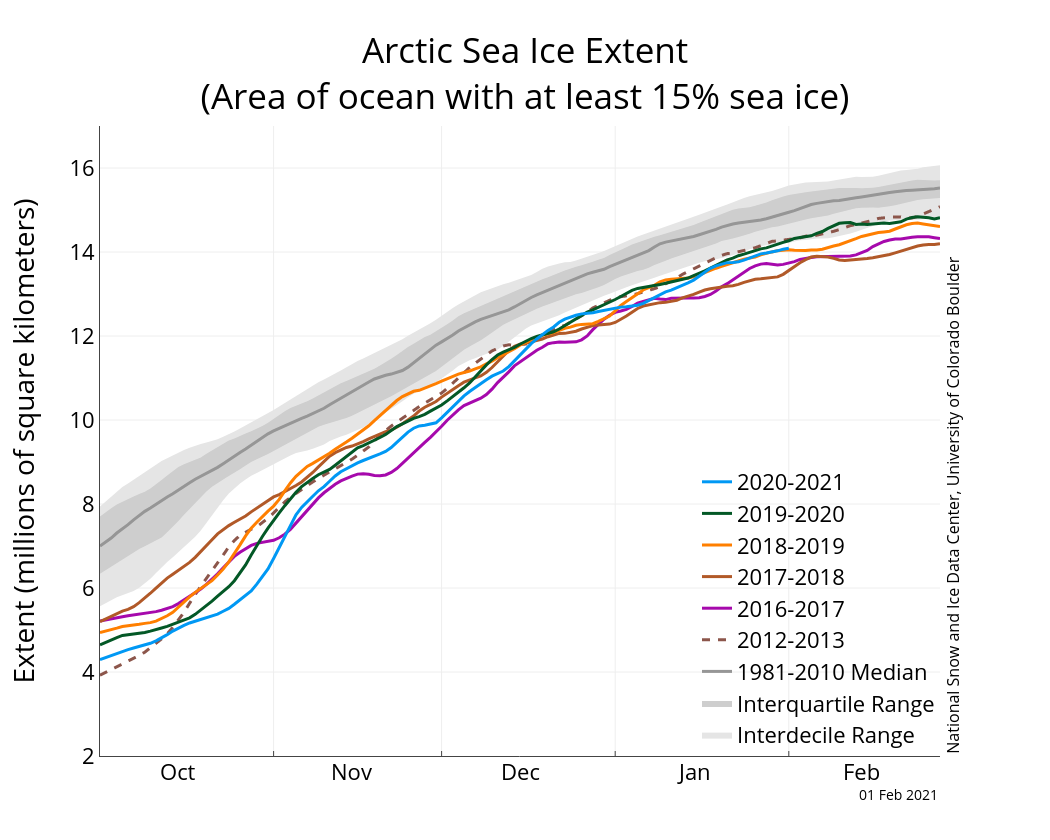
Figure 2a. The graph above shows Arctic sea ice extent as of February 1, 2021, along with daily ice extent data for four previous years and the record low year. 2020 to 2021 is shown in blue, 2019 to 2020 in green, 2018 to 2019 in orange, 2017 to 2018 in brown, 2016 to 2017 in magenta, and 2012 to 2013 in dashed brown. The 1981 to 2010 median is in dark gray. The gray areas around the median line show the interquartile and interdecile ranges of the data. Sea Ice Index data.
Credit: National Snow and Ice Data Center
High-resolution image
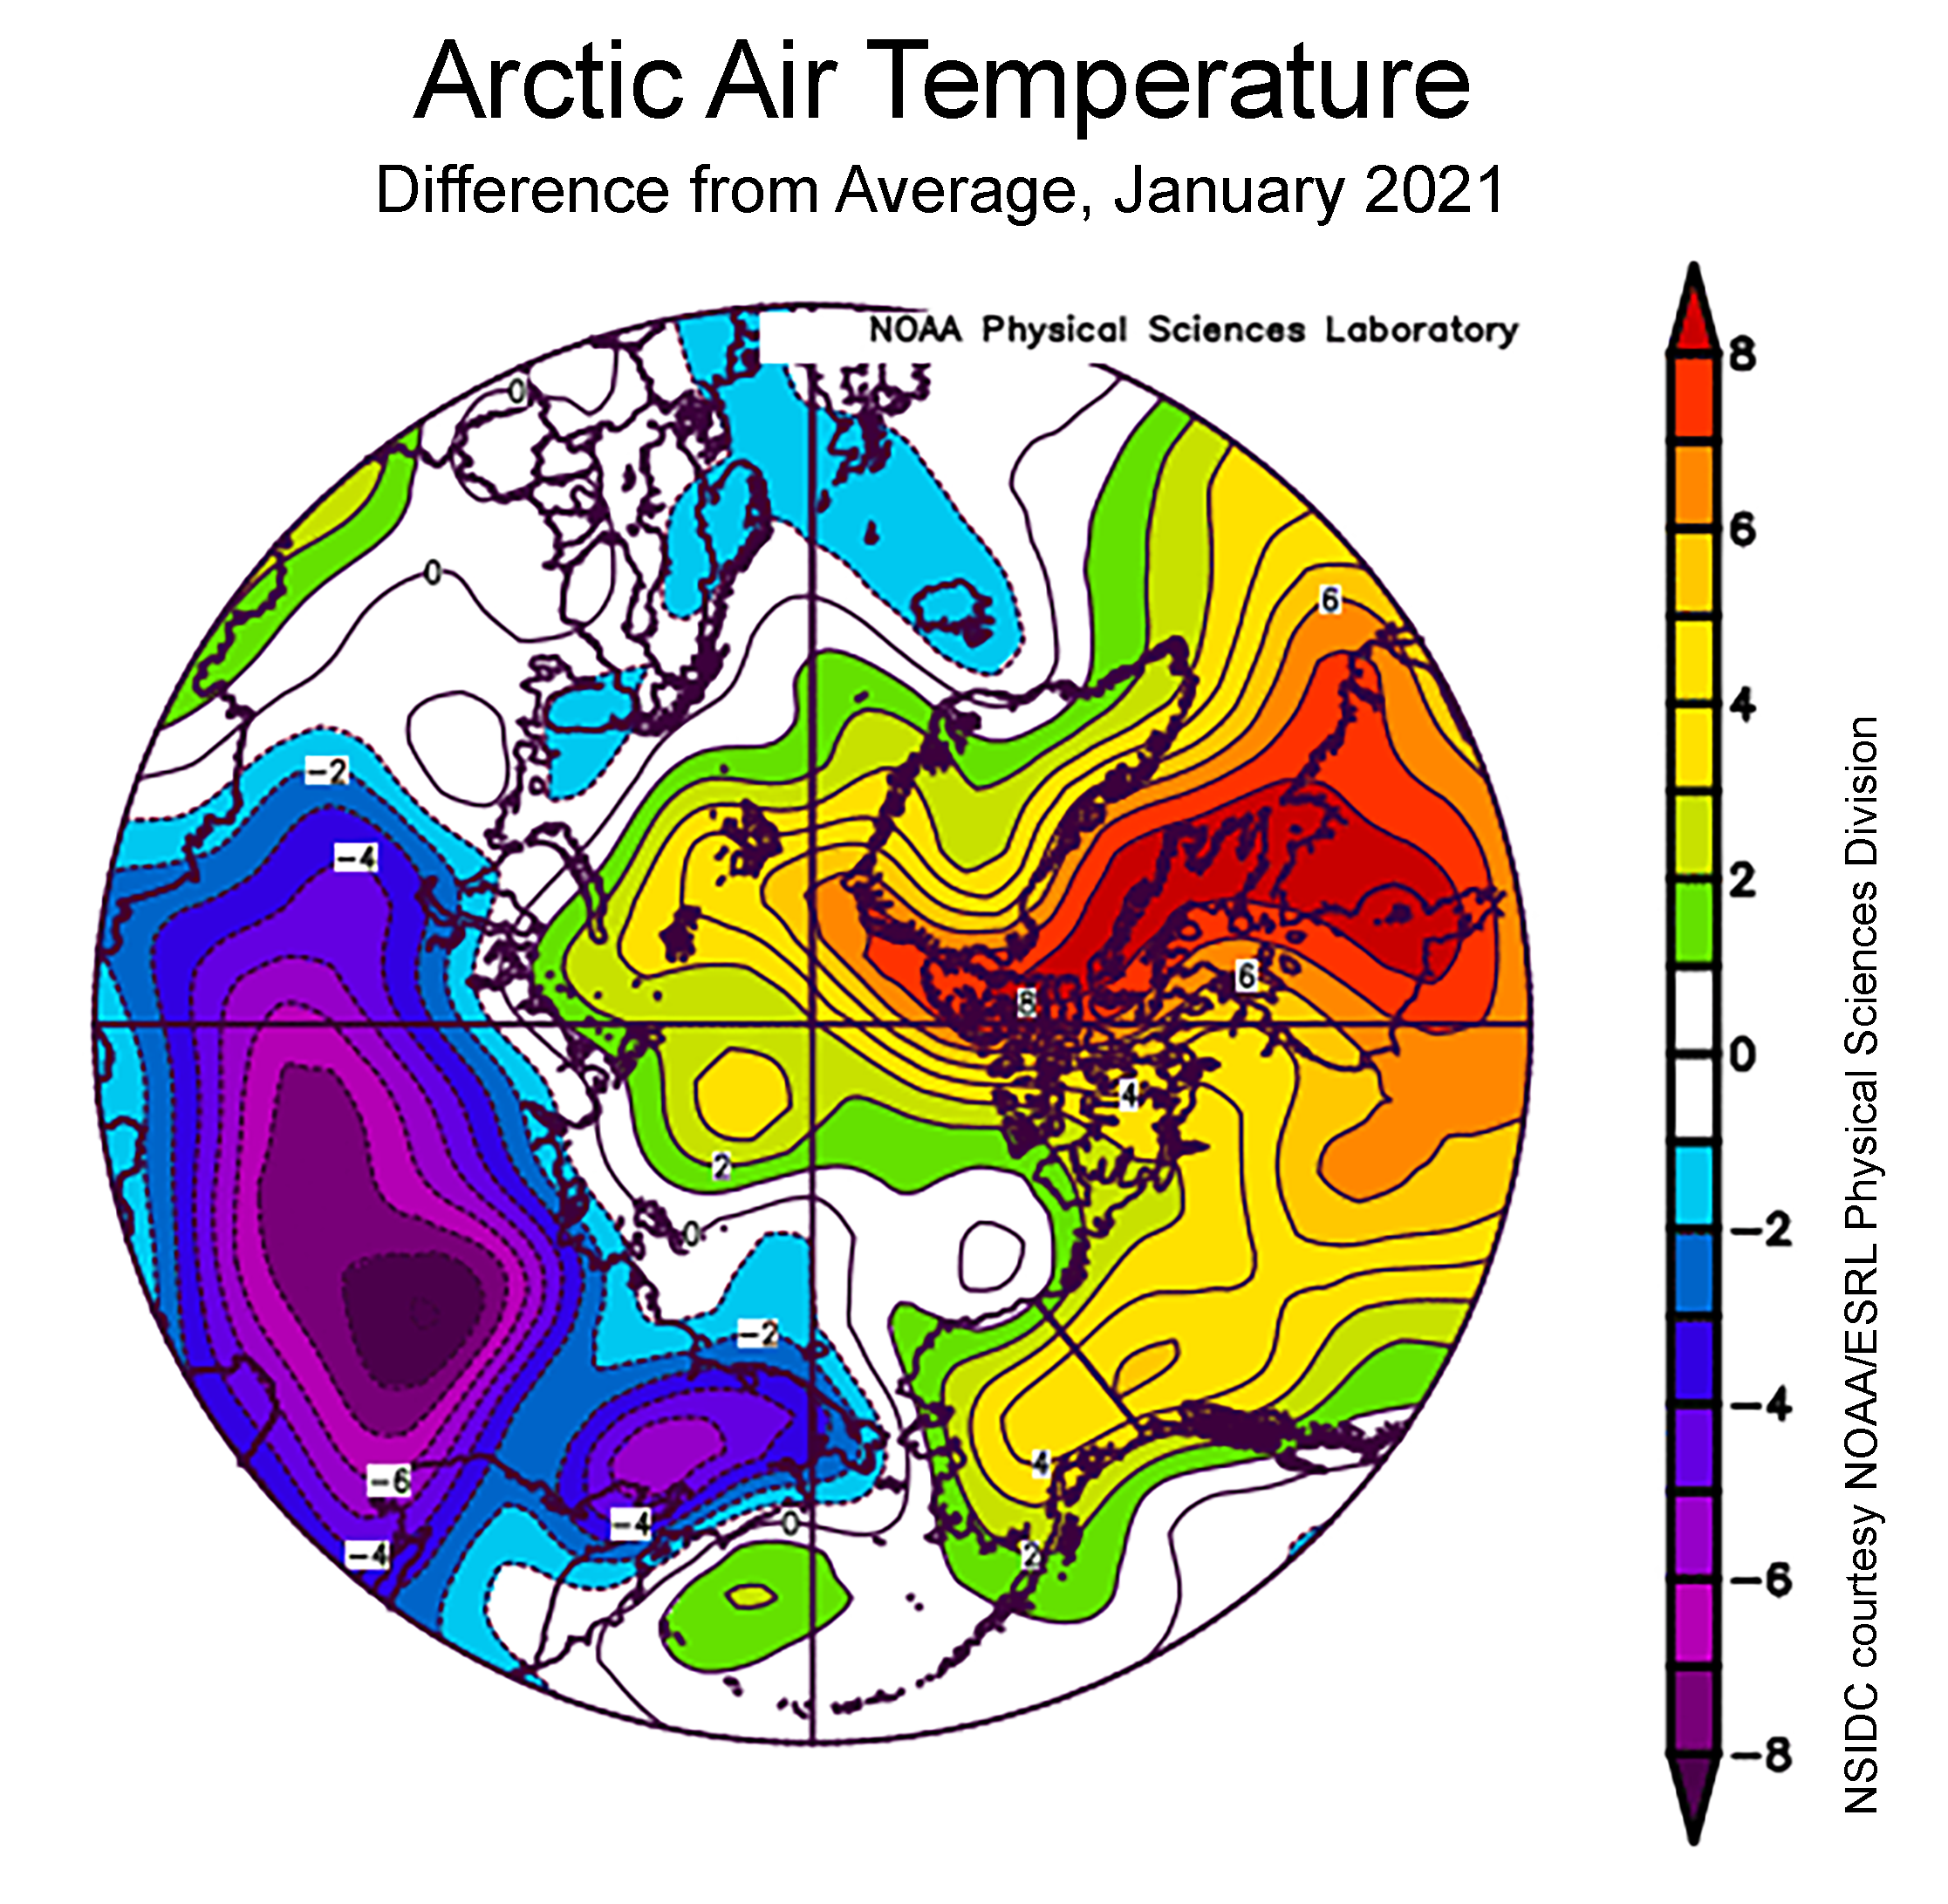
Figure 2b. This plot shows the departure from average air temperature in the Arctic at the 925 hPa level, in degrees Celsius, for January 2021. Yellows and reds indicate higher than average temperatures; blues and purples indicate lower than average temperatures.
Credit: NSIDC courtesy NOAA Earth System Research Laboratory Physical Sciences Division
High-resolution image

Figure 2c. This plot shows average sea level pressure in the Arctic in millibars for January 2021. Yellows and reds indicate high air pressure; blues and purples indicate low pressure.
Credit: NSIDC courtesy NOAA Earth System Research Laboratory Physical Sciences Division
High-resolution image
During January, sea ice extent tracked below measured values for most years except 2017 and 2016, but by the middle of the month, extent rose above the average for the last 10 years, from 2011 to 2020. Overall, in January the Arctic gained 1.42 million square kilometers (548,000 square miles) of ice.
Air temperatures at the 925 mb level (about 2,500 feet above sea level) in January were considerably above average over the Atlantic side of the Arctic, especially in the Baffin Bay region (up to 8 degrees Celsius or 14 degrees Fahrenheit) above average. Temperatures were 2 to 6 degrees Celsius (4 to 11 degrees Fahrenheit) above average over Canada and Alaska. By sharp contrast, air temperatures were between 6 and 8 degrees Celsius (11 and 14 degrees Fahrenheit) below average over Siberia. The atmospheric circulation associated with this lopsided pattern was dominated by high pressure over Siberia and low pressure over the Northern North Atlantic and Pacific Ocean.
January 2021 compared to previous years
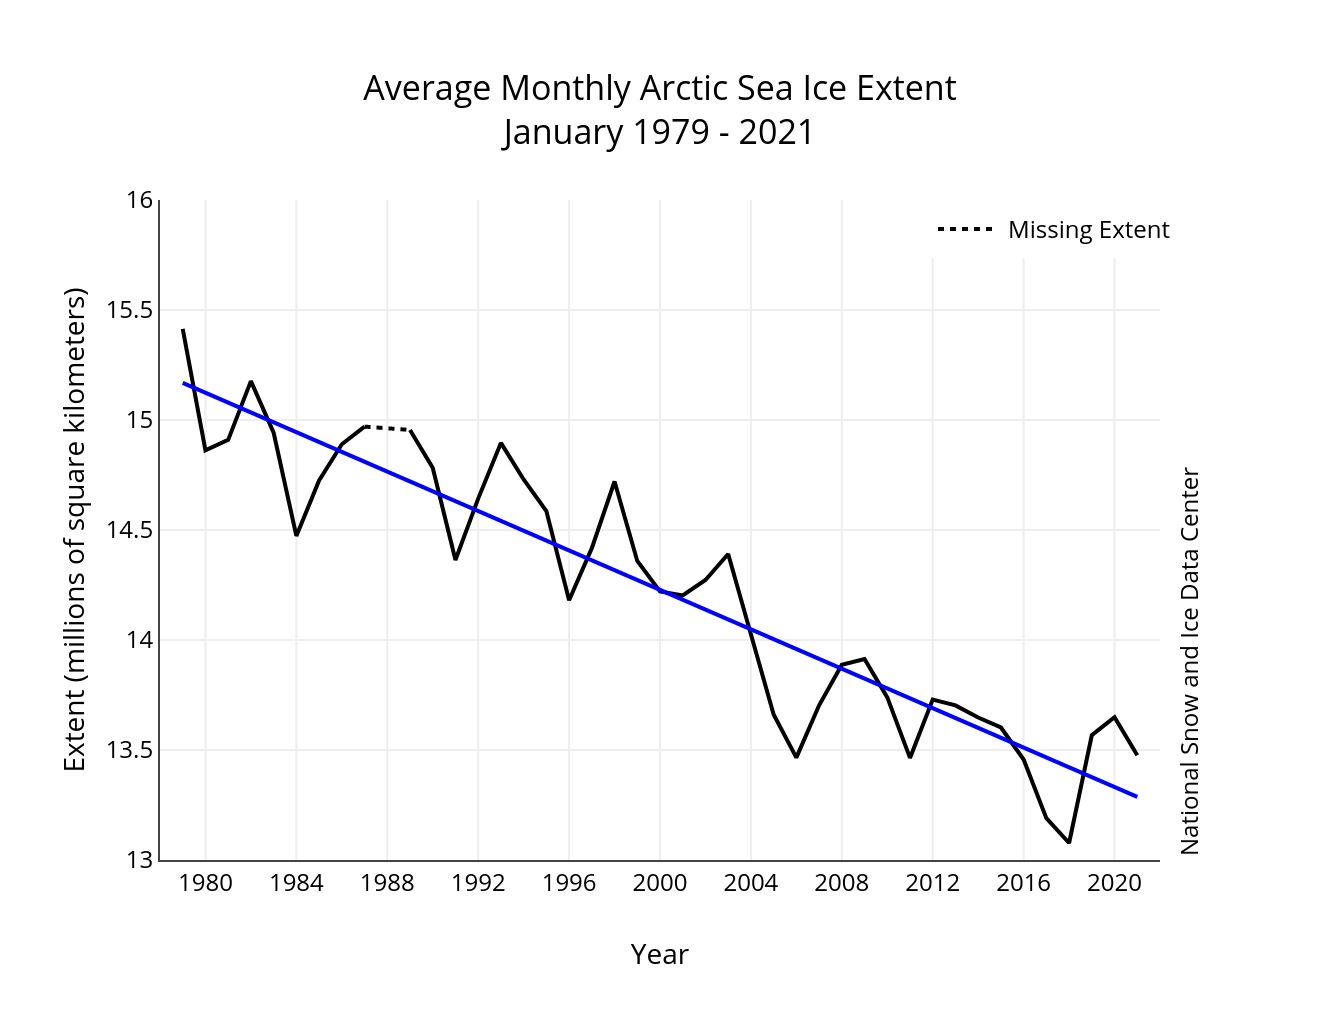
Figure 3. Monthly January ice extent for 1979 to 2021 shows a decline of 3.1 percent per decade.
Credit: National Snow and Ice Data Center
High-resolution image
Through 2021, the linear rate of decline for January sea ice extent is 3.1 percent per decade, which corresponds to 44,700 square kilometers (17,300 square miles) per year, about twice the size of New Jersey. The cumulative January ice loss over the 43-year satellite record is 1.88 million square kilometers (726,000 square miles), based on the difference in linear trend values in 2021 and 1979.
2020 ties for the warmest year on record
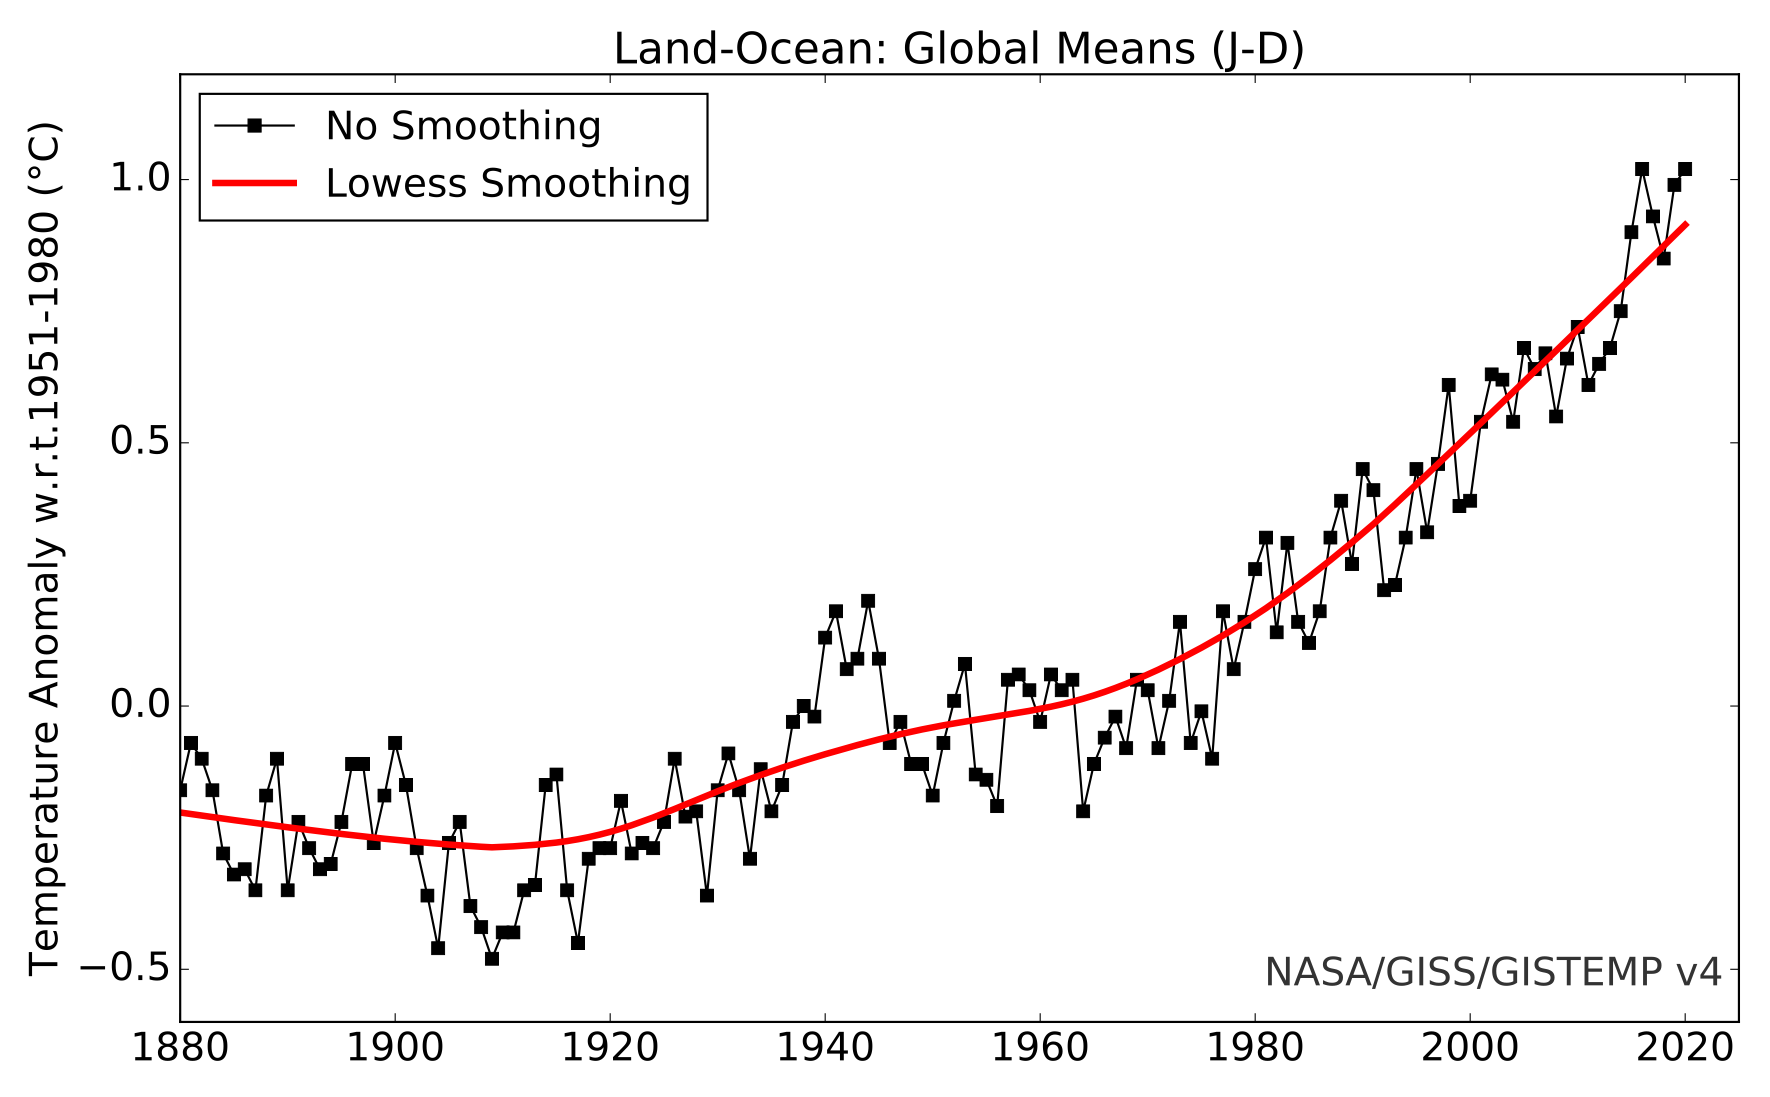
Figure 4a. This time-series shows global annual average air temperatures from 1880 through 2020.
Credit: NASA
High-resolution image

Figure 4b. The plot on the left shows annual air temperature departures in 2020 from the 1951 to 1980 average for the Arctic, while the plot on the right shows air temperature departures for Antarctica for the same time period.
Credit: NASA
High-resolution image
According to the National Oceanic and Atmospheric Administration (NOAA) and the analysis of the NASA Goddard Institute for Space Studies (GISS), the global surface temperature for 2020 tied with 2016 as the highest in the instrumental record, at 1.02 degrees Celsius (1.84 degrees Fahrenheit) above than the baseline of 1951 to 1980 (Figure 4a). While both institutions use the same raw temperature record in their analysis, NOAA does not infer temperatures in the polar regions where observations are not as numerous. Whether travel restrictions may have opposed warming by reducing particulate air pollution and global CO2 emissions remains unclear. Year-to-year variability in global air temperatures is known to be partly tied to the phase of the El Niño-Southern Oscillation (ENSO). When ENSO is positive (El-Niño), more heat is exchanged between the ocean and the atmosphere, especially in the Pacific, leading to a higher global average temperature, such as in 1998 and 2016. While 2020 started in with modest El Niño conditions, it ended with La Niña conditions.
In the Arctic, NASA GISS analysis suggests that 2020 ranked as the warmest year on record, with extremely high temperatures relative to average over the Siberian Arctic; Temperatures were 6.4 degrees Celsius (11.5 degrees Fahrenheit) above the 1951 to 1980 average. The region around north central Siberia was especially warm (Figure 4b). The North Atlantic, east of Greenland, is an exception to the Northern Hemisphere warmth. Previous studies have linked relatively cool conditions in this area to weakening of the Atlantic Meridional Overturning Circulation (AMOC), related to an increase in freshwater input to the North Atlantic from Greenland’s melt water. A new study suggests other factors are also involved, including more low-level clouds that reduce the amount of incoming sunlight in that region.
Over the Antarctic, air temperatures were mostly above average during 2020, with particularly warm conditions over the West Antarctic Peninsula and the Bellingshausen Sea. This contrasts with below average temperatures over the Weddell Sea.
Leaky Arctic plug

Figure 5a. This map shows the Nares Strait in relation to Greenland, Ellesmere Island (a northernmost Canadian Island). The ice arch forms at the entrance into Nares Strait from the Lincoln Sea.
Credit: Moore et al., 2021, Nature Communications
High-resolution image
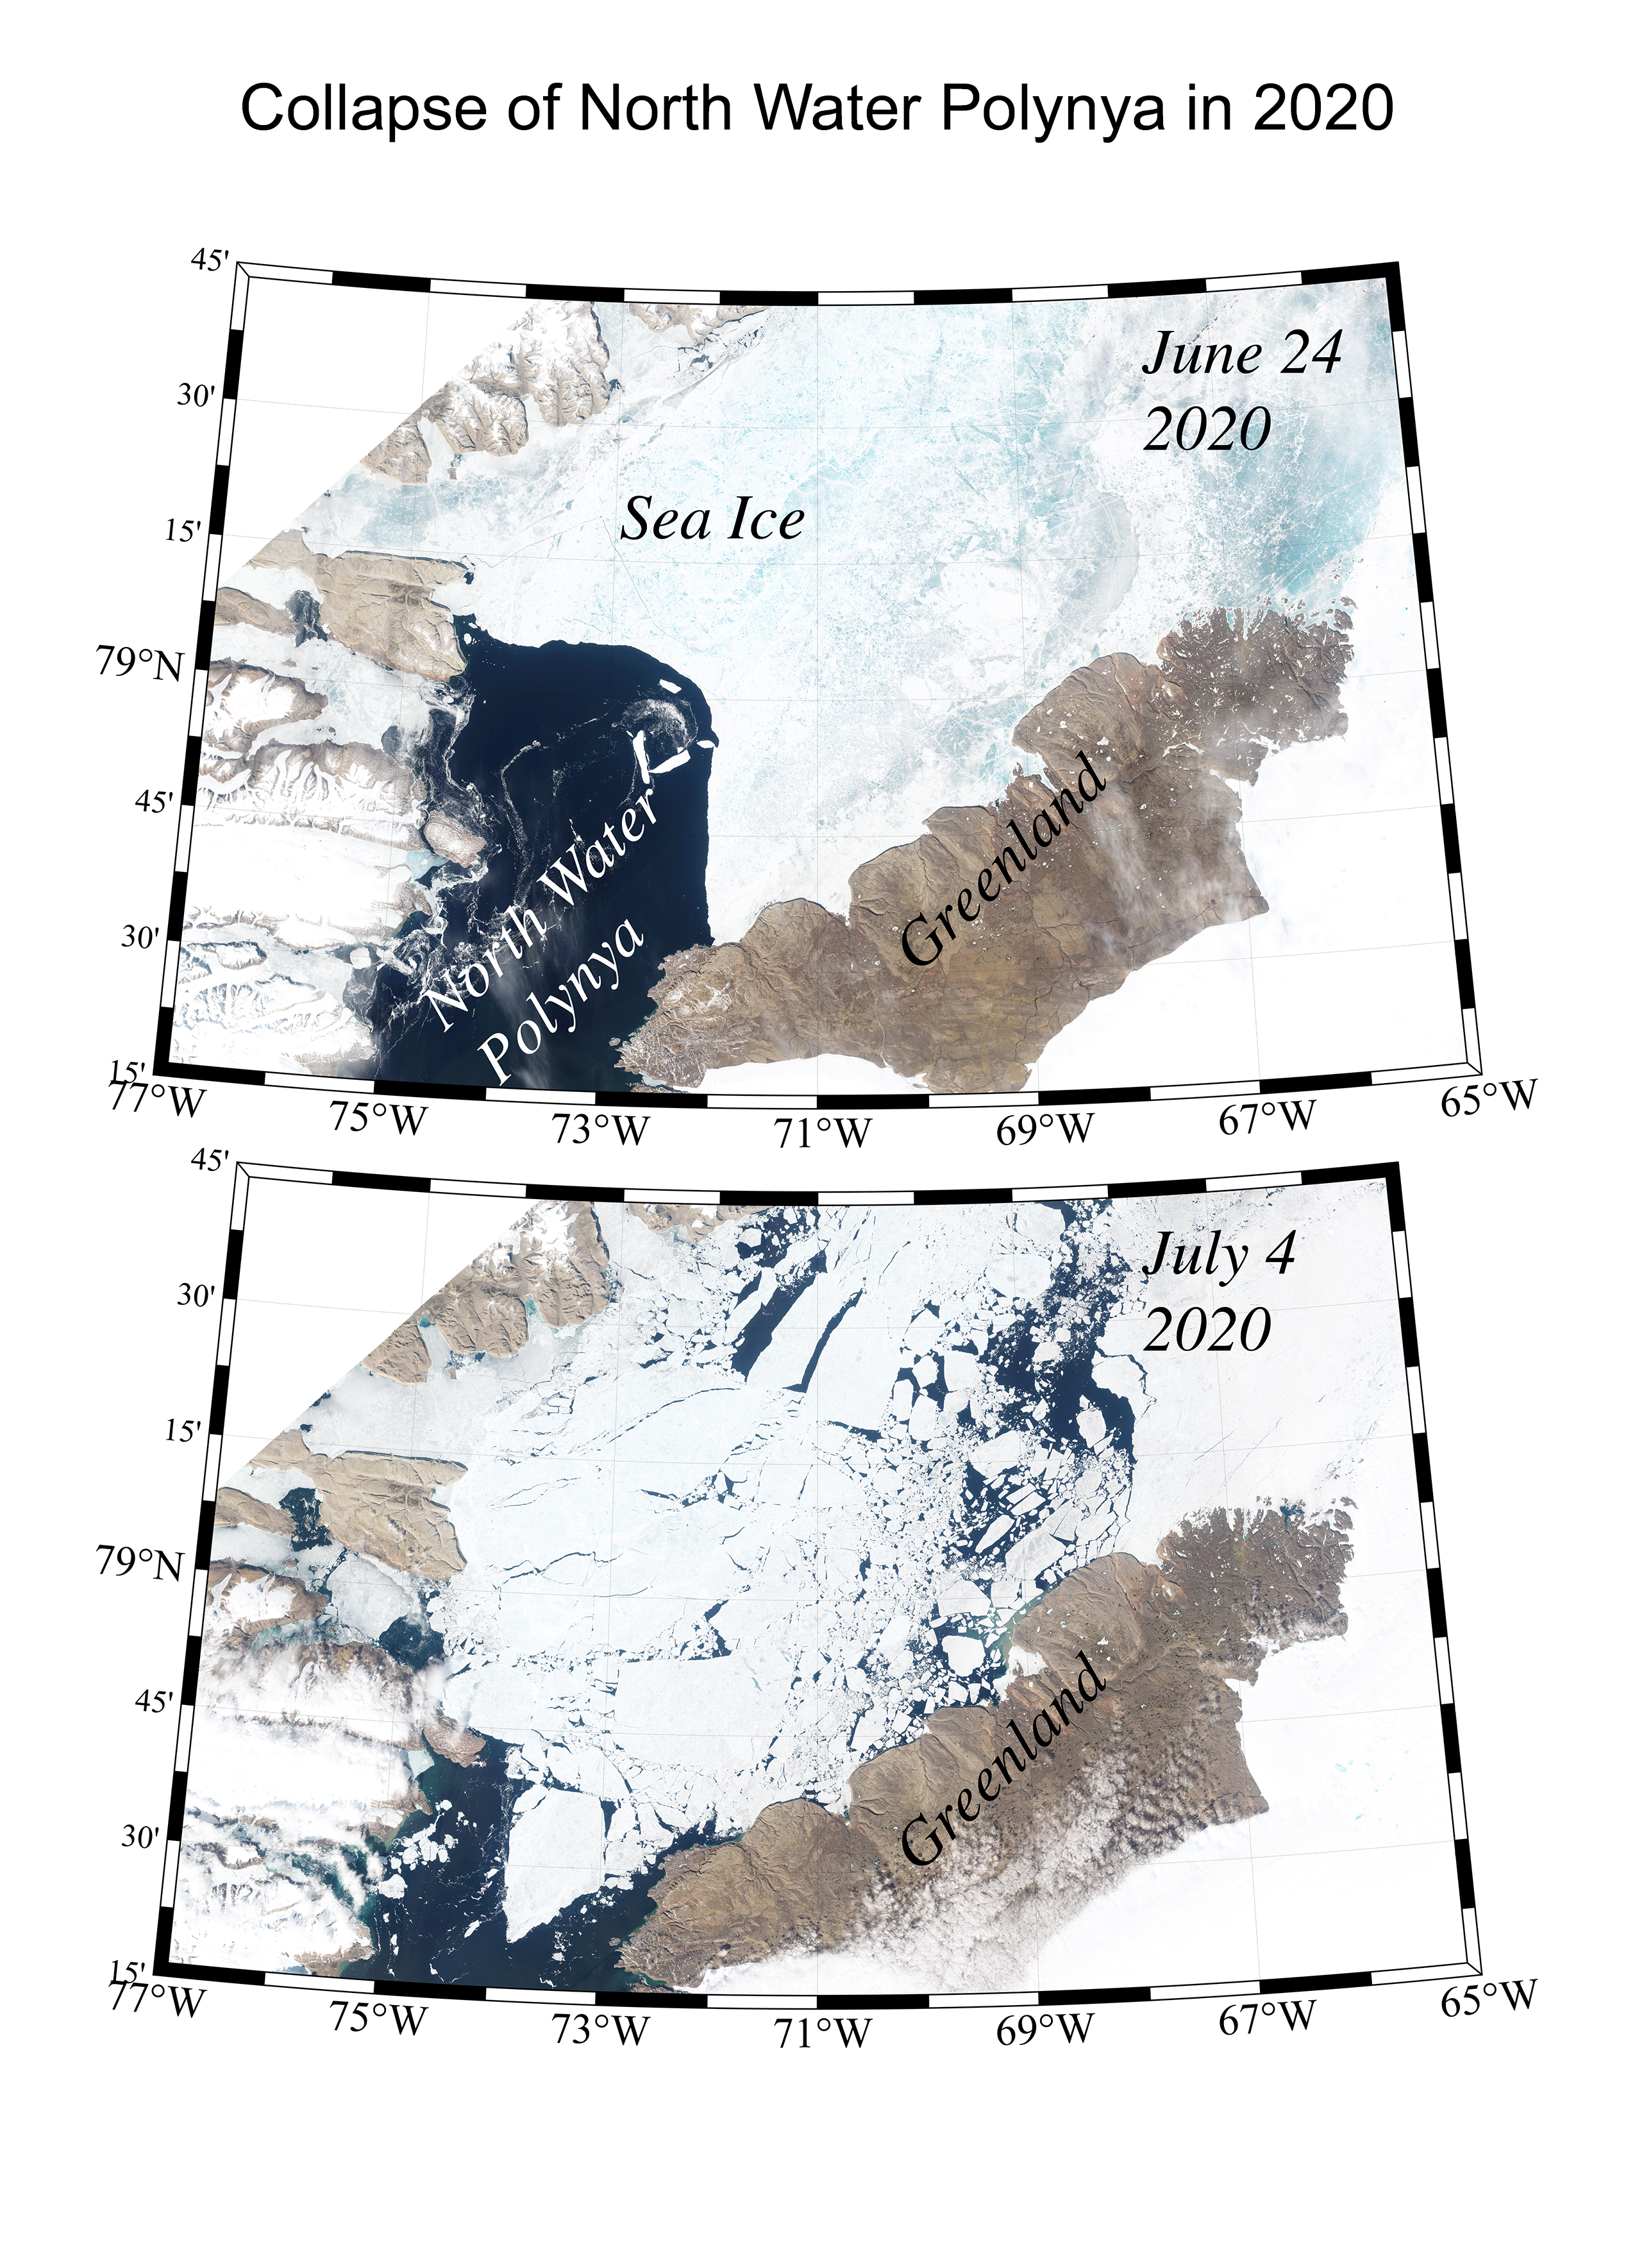
Figure 5b. These two images show the collapse of the North Water Polynya between June 24 and July 4, 2020.
Credit: Moore et al., 2021, Nature Communications
High-resolution image
The amount of Arctic sea ice can be reduced through more summer melt, less winter growth, or export out of the Arctic Ocean through various passages, notably Fram Strait and the narrow passages in the Canadian Arctic Archipelago. Nares Strait, a passage between Ellesmere Island and Greenland that connects the Lincoln Sea with Baffin Bay, is one of the last refuges for old thick ice (Figure 5a). Most of the year, ice dams, or ice arches, prevent ice in the Lincoln Sea moving through Nares Strait. However, a recent study shows that the seasonal duration of the ice arch has fallen from typically 200 to 300 days annually between 1997 and 2001 to about 150 days or less since 2003. This allows some of the old and thick ice to move southwards where it melts out in Baffin Bay. An increased flow of thick, multiyear ice into northern Baffin Bay may also negatively impact the formation of the North Water Polynya, also called Pikialasorsuaq, which is an important biologically rich open water area that plays an essential role for Inuit communities (Figure 5b).
Warm winters, more rain
Climate models predict that in coming decades more Arctic precipitation will fall as rain instead of snow, both on sea ice and land. When rain falls on a snowpack in winter, it can refreeze, forming a hard icy layer. On land, caribou and muskoxen cannot break through this hard icy crust to forage. Icy layers can also form when air temperatures rise above freezing during winter and then fall below freezing. One such warm spell recently hit the Canadian Arctic in the area of Iqaluit, Nunavut, and local observers experienced rain. Unseasonably warm conditions lasted until the last week of January.
Further reading
Keil, P. et al. 2020. Multiple drivers of the North Atlantic warming hole. Nature Climate Change. doi:10.1038/s41558-020-0819-8.
Moore, G. W. K., Howell, S. E. L., Brady, M. et al. 2021. Anomalous collapses of Nares Strait ice arches leads to enhanced export of Arctic sea ice. Nature Communications 12, 1. doi:10.1038/s41467-020-20314-w.

