Sea ice continued its late-season summer decline through August at a near-average pace. Ice extent is still well above last year’s level, but below the 1981 to 2010 average. Open water was observed in the ice cover close to the North Pole, while in the Antarctic, sea ice has been at a record high the past few days.
Overview of conditions

Figure 1. Arctic sea ice extent for August 2013 was 6.09 million square kilometers (2.35 million square miles). The magenta line shows the 1981 to 2010 median extent for that month. The black cross indicates the geographic North Pole. Sea Ice Index data. About the data
Credit: National Snow and Ice Data Center
High-resolution image
Sea ice extent for August 2013 averaged 6.09 million square kilometers (2.35 million square miles). This was 1.13 million square kilometers (398,000 square miles) below the 1981 to 2010 average for August, but well above the level recorded last year, which was the lowest September extent in the satellite record. Ice extent this August was similar to the years 2008 to 2010. These contrasts in ice extent from one year to the next highlight the year-to-year variability attending the overall, long-term decline in sea ice extent.
Extent in the Beaufort and Chukchi seas has dropped below average, after near average conditions in July. The only region with average extent is the East Siberian Sea.
Conditions in context

Figure 2. The graph above shows Arctic sea ice extent as of September 4, 2013, along with daily ice extent data for the previous five years. 2013 is shown in light blue, 2012 in green, 2011 in orange, 2010 in light purple, 2009 in dark blue, and 2008 in dark purple. The gray area around the average line shows the two standard deviation range of the data. Sea Ice Index data.
Credit: National Snow and Ice Data Center
High-resolution image
Relatively cool conditions over the central Arctic Ocean continued, a pattern that has characterized this summer. Temperatures at the 925 hPa level in the high Arctic (north of Greenland to the North Pole) were 0.5 to 3 degrees Celsius (1 to 5 degrees Fahrenheit) below the 1981 to 2010 average. In comparison, temperatures in coastal areas of the Arctic were mostly near average, and temperatures in the Barents and Beaufort seas were about 2 degrees Celsius (4 degrees Fahrenheit) above average. The distribution of the temperature anomalies can be related to the sea level pressure pattern. Below-average sea level pressures were linked to cloudy and cool conditions near the North Pole and extending into the northern North Atlantic. In contrast, above-average pressures dominated the Eurasian coast.
August 2013 compared to previous years

Figure 3. Monthly August ice extent for 1979 to 2013 shows a decline of 10.6% per decade.
Credit: National Snow and Ice Data Center
High-resolution image
The seasonal decline of extent through the month of August was slightly above average at 56,400 square kilometers (21,800 square miles) per day, but more than a third slower than the record decline rate in August 2012. This year’s August extent was the sixth lowest in the 1979 to 2013 satellite record.
August 2013 ice extent was 1.38 million square kilometers (533,000 square miles) above the record low August extent in 2012. The monthly trend is –10.6% per decade relative to the 1981 to 2010 average.
Water near the pole
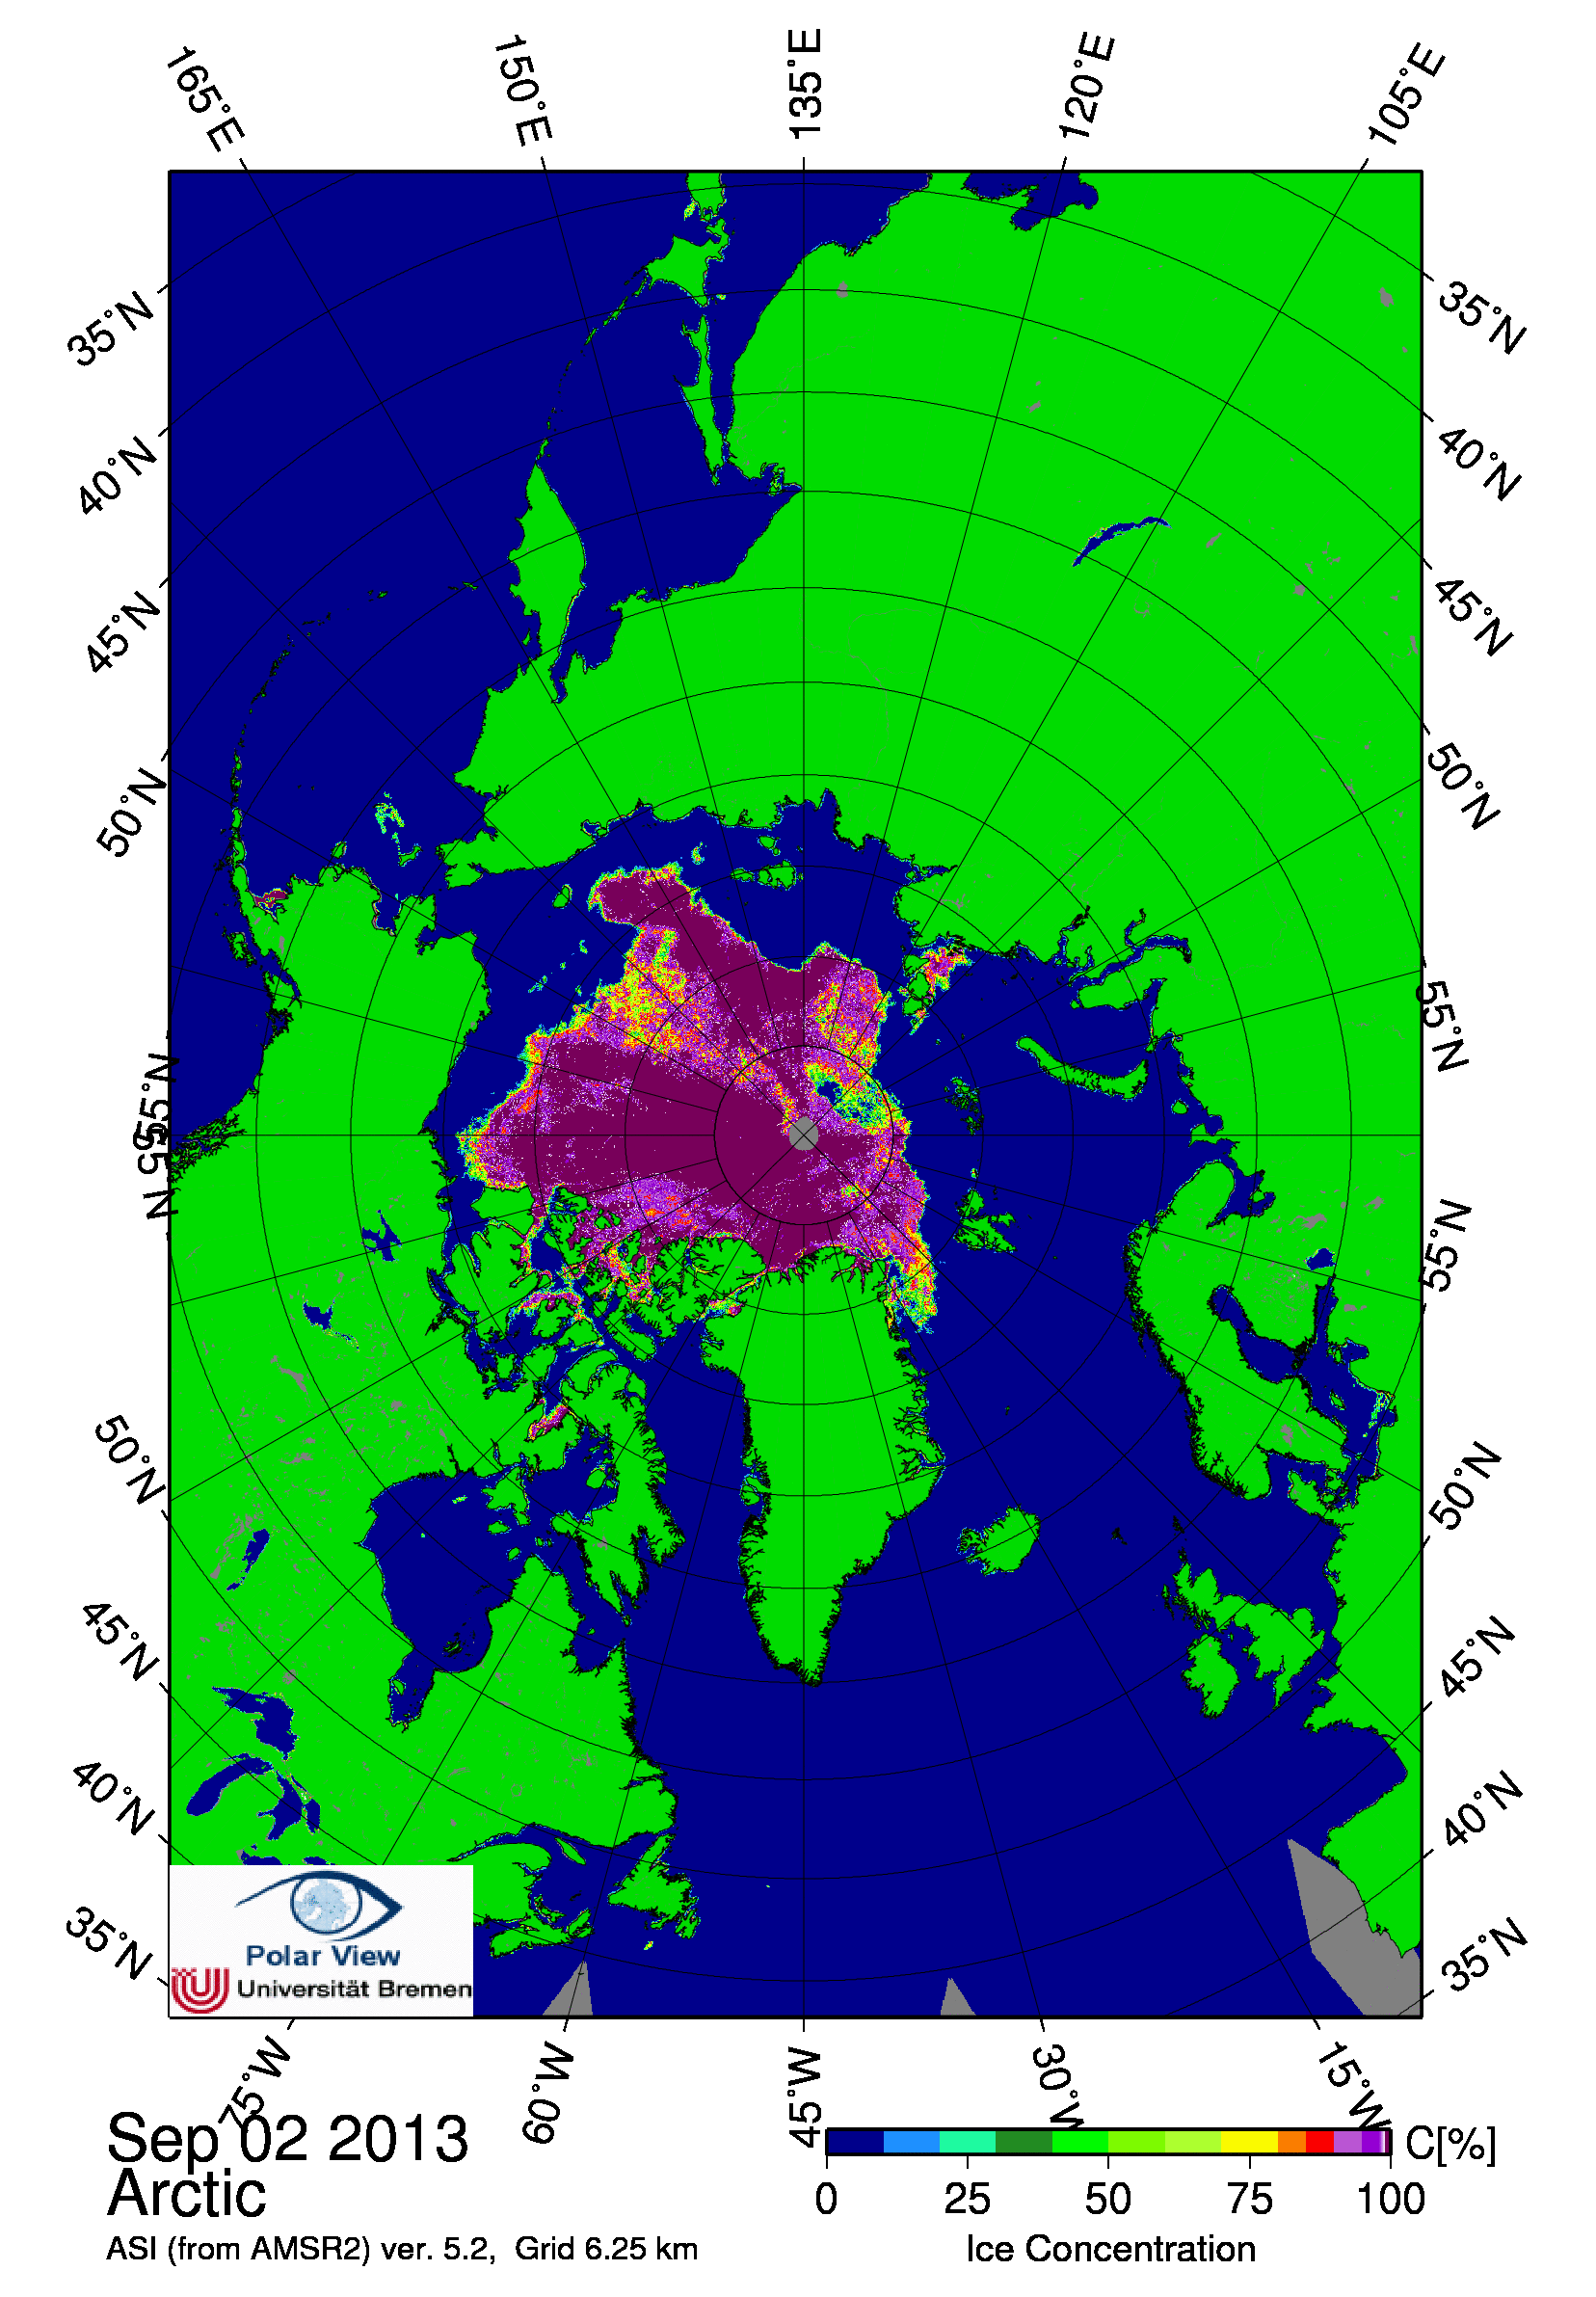
Figure 4. This image from the AMSR2 satellite instrument shows Arctic sea ice concentration for September 2, 2013. A dark blue area of apparent open water can be seen near the North Pole, surrounded by a low ice concentration area. The gray circle around the North Pole indicates where the instrument did not acquire data, due to its orbit.
Credit: NSIDC/University of Bremen
High-resolution image
Earlier this summer, there was considerable interest in seeing liquid water in the North Pole Environmental Observatory (NPEO) web cam. As explained in our August 7 post, that region was simply a shallow melt pond of water atop the ice and not an actual opening in the ice. Nevertheless, our August 19 post described an extensive region of low ice concentration located fairly close to the pole.
Now, a large hole (roughly 150 square kilometers or 58 square miles) of near-zero ice concentration appears to have opened up at about 87 degrees North latitude. Small areas of open water are common within the ice pack, even at the North Pole, as the ice pack shifts in response to winds and currents, resulting in cracks (called leads) in the ice. The current opening seen in our satellite imagery is much larger. In 2006, a larger polynya appeared in the Beaufort and Chukchi seas, but it was much farther south.
Melting ice from above and below
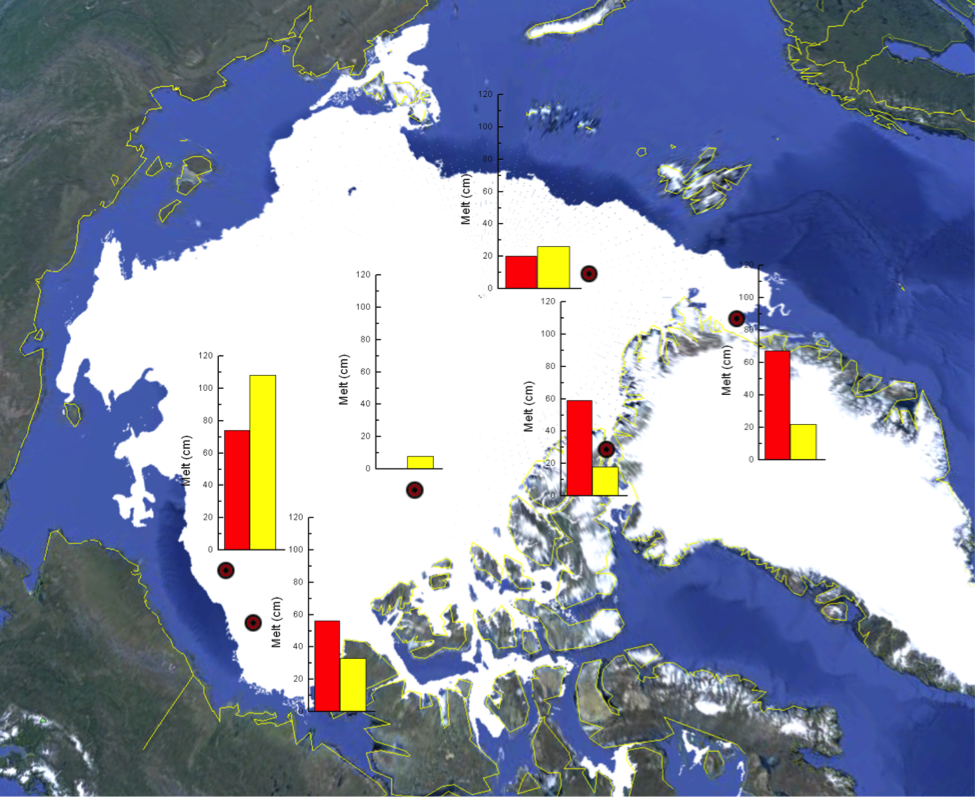
Figure 5. This map of the Arctic shows results from six ice mass balance buoys that operated throughout the summer of 2013. A red dot denotes each buoy position on August 28, 2013. The red bars indicate the total amount of summer surface melt and the yellow bars show bottom melt. The white background is the MASIE ice extent on August 28, 2013 mapped on Google Earth.
Credit: NSIDC courtesy Jackie Richter-Menge and Don Perovich/CRREL
High-resolution image
It may seem contradictory for a polynya-like opening to form near the pole while temperatures are lower than average, but it highlights the complex interplay between the ice, atmosphere, and ocean. Such openings in the ice occur two ways: through winds pushing the ice apart, or through melting. Both processes likely played a role in forming the current opening, but another key factor is a significant amount of thin, first-year ice in the region. This thin ice was more likely to melt completely than surrounding thicker ice. Heat from the ocean also contributes to melting of the ice from below, even though air temperatures have been below average in the region. Buoys that measure ice mass can provide information on surface and bottom melting.
During the summer of 2013 there were six ice mass balance buoys deployed in the Arctic over a wide area (red dots in Figure 5). The buoys were deployed in undeformed, multiyear ice, with a thickness between 2.2 and 3.5 meters (7 and 11 feet) before melt began. Data from the buoys show that the amount of surface ice melting ranged from 0 in the central Arctic, to 75 centimeters (30 inches) in the Beaufort Sea. Bottom melting varied from 8 to 108 centimeters (3 to 43 inches). The largest amount of bottom melting was observed at a buoy near the ice edge in the Beaufort Sea. This buoy had the largest total amount of melt, thinning from 339 centimeters (133 inches) in early June, to 157 centimeters (62 inches) on August 28. Ice thicknesses at the other buoys on August 28 ranged from 121 to 267 centimeters (48 to 105 inches). While bottom melting is continuing in some locations, most of this year’s surface melting has occurred. Data from the ice mass balance buoys are available at http://imb.crrel.usace.army.mil. (Thanks to Jackie Richter-Menge and Don Perovich at the Cold Regions Research and Engineering Laboratory [CRREL] for this part of the discussion.)

