Following a relatively cool summer, sea ice extent fell to a little over 5 million square kilometers (1.93 million square miles) over the first two weeks of September and is at or near the minimum extent for the year. NSIDC will announce the final minimum extent and date once it is confirmed.
Overview of conditions
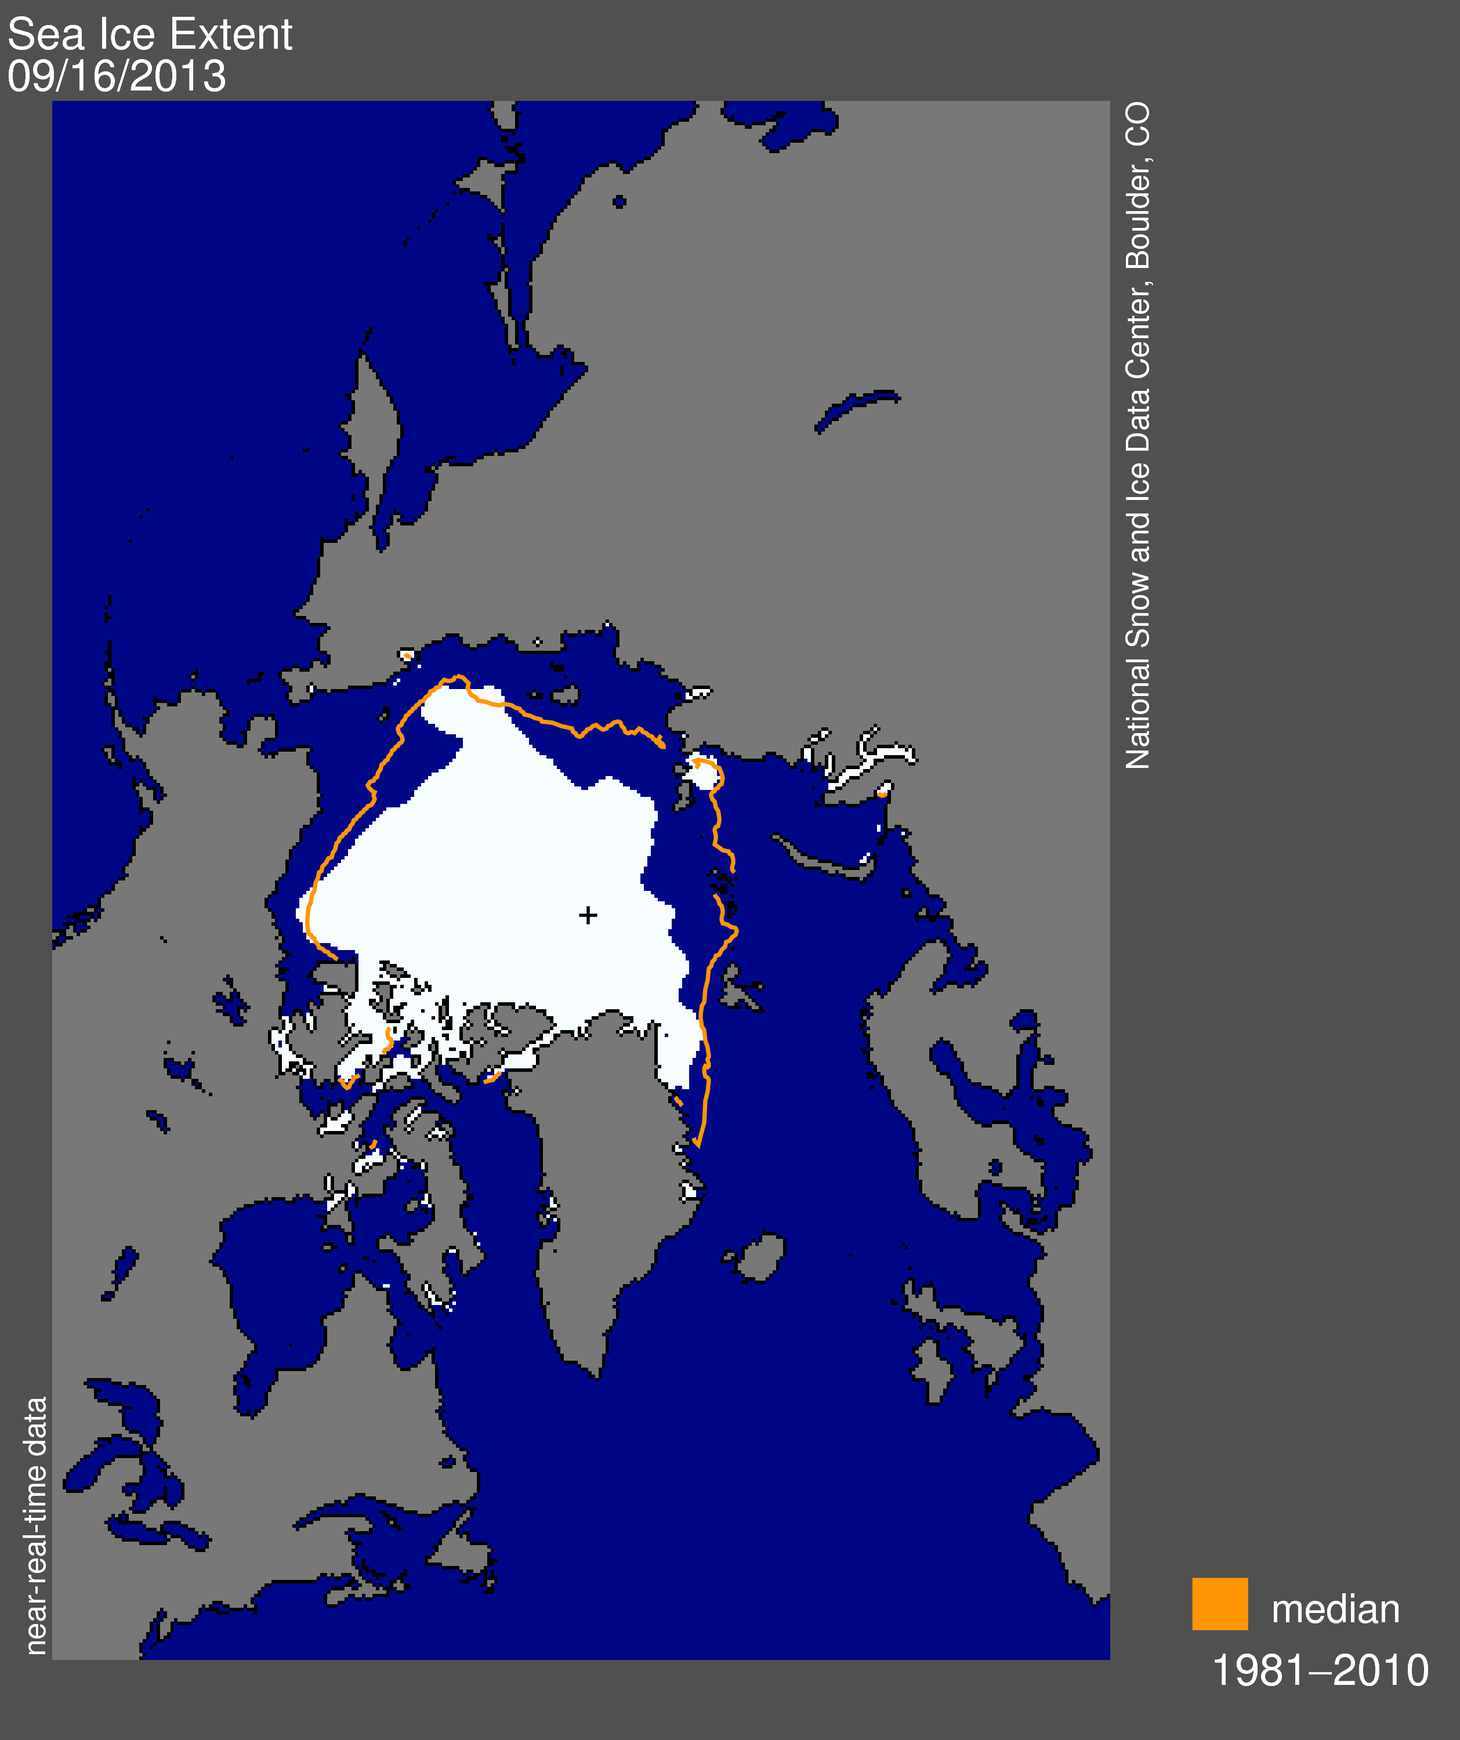
Figure 1. Arctic sea ice extent for September 16, 2013 was 5.10 million square kilometers (2.00 million square miles). The orange line shows the 1981 to 2010 median extent for that month. The black cross indicates the geographic North Pole. Sea Ice Index data. About the data
Credit: National Snow and Ice Data Center
High-resolution image
Arctic sea ice extent as of September 16, 2013 was 5.10 million square kilometers (2.00 million square miles). This is substantially more ice than observed on the same date last year, yet sea ice extent remains quite low compared to the long-term 1981 to 2010 average. As is typical for this time of year, winds or currents can compact or spread apart the ice, resulting in small daily fluctuations of the ice cover.
During the first two weeks of September, sea ice extent continued to decline in the East Siberian, Laptev, and Kara seas while staying essentially constant in the Beaufort and Chukchi seas since the beginning of September. The Northwest Passage has seen more extensive ice this summer since 2007 and is not open. On the Eurasian side of the Arctic, the Northern Sea Route appears to have opened up briefly in September.
Conditions in context

Figure 2. The graph above shows Arctic sea ice extent as of September 15, 2013, along with daily ice extent data for five previous years. 2013 is shown in blue, 2012 in green, 2011 in orange, 2010 in pink, 2009 in navy, and 2008 in purple. The 1981 to 2010 average is in dark gray. Sea Ice Index data.
Credit: National Snow and Ice Data Center
High-resolution image
Ice loss through the first two weeks of September was faster than average. Air temperatures at the 925 hPa level were 1 to 3 degrees Celsius (2 to 5 degrees Fahrenheit) higher than average over much of the Arctic Ocean the first part of the month, in stark contrast to most of the summer when cooler temperatures dominated. Below average temperatures were found in the Beaufort and Chukchi seas where ice growth began around the first week of the month.
Even though extent at the beginning of this summer was similar to last year, the melt season ended with considerably more ice. This is not surprising, as climate models consistently project that there will be large variations in summer ice extent from year to year. A cool summer can help to retain a thin layer of ice, increasing the overall ice extent. Conversely, a warm summer can help to remove much of the thin ice cover.
Cold summer over central Arctic and Greenland
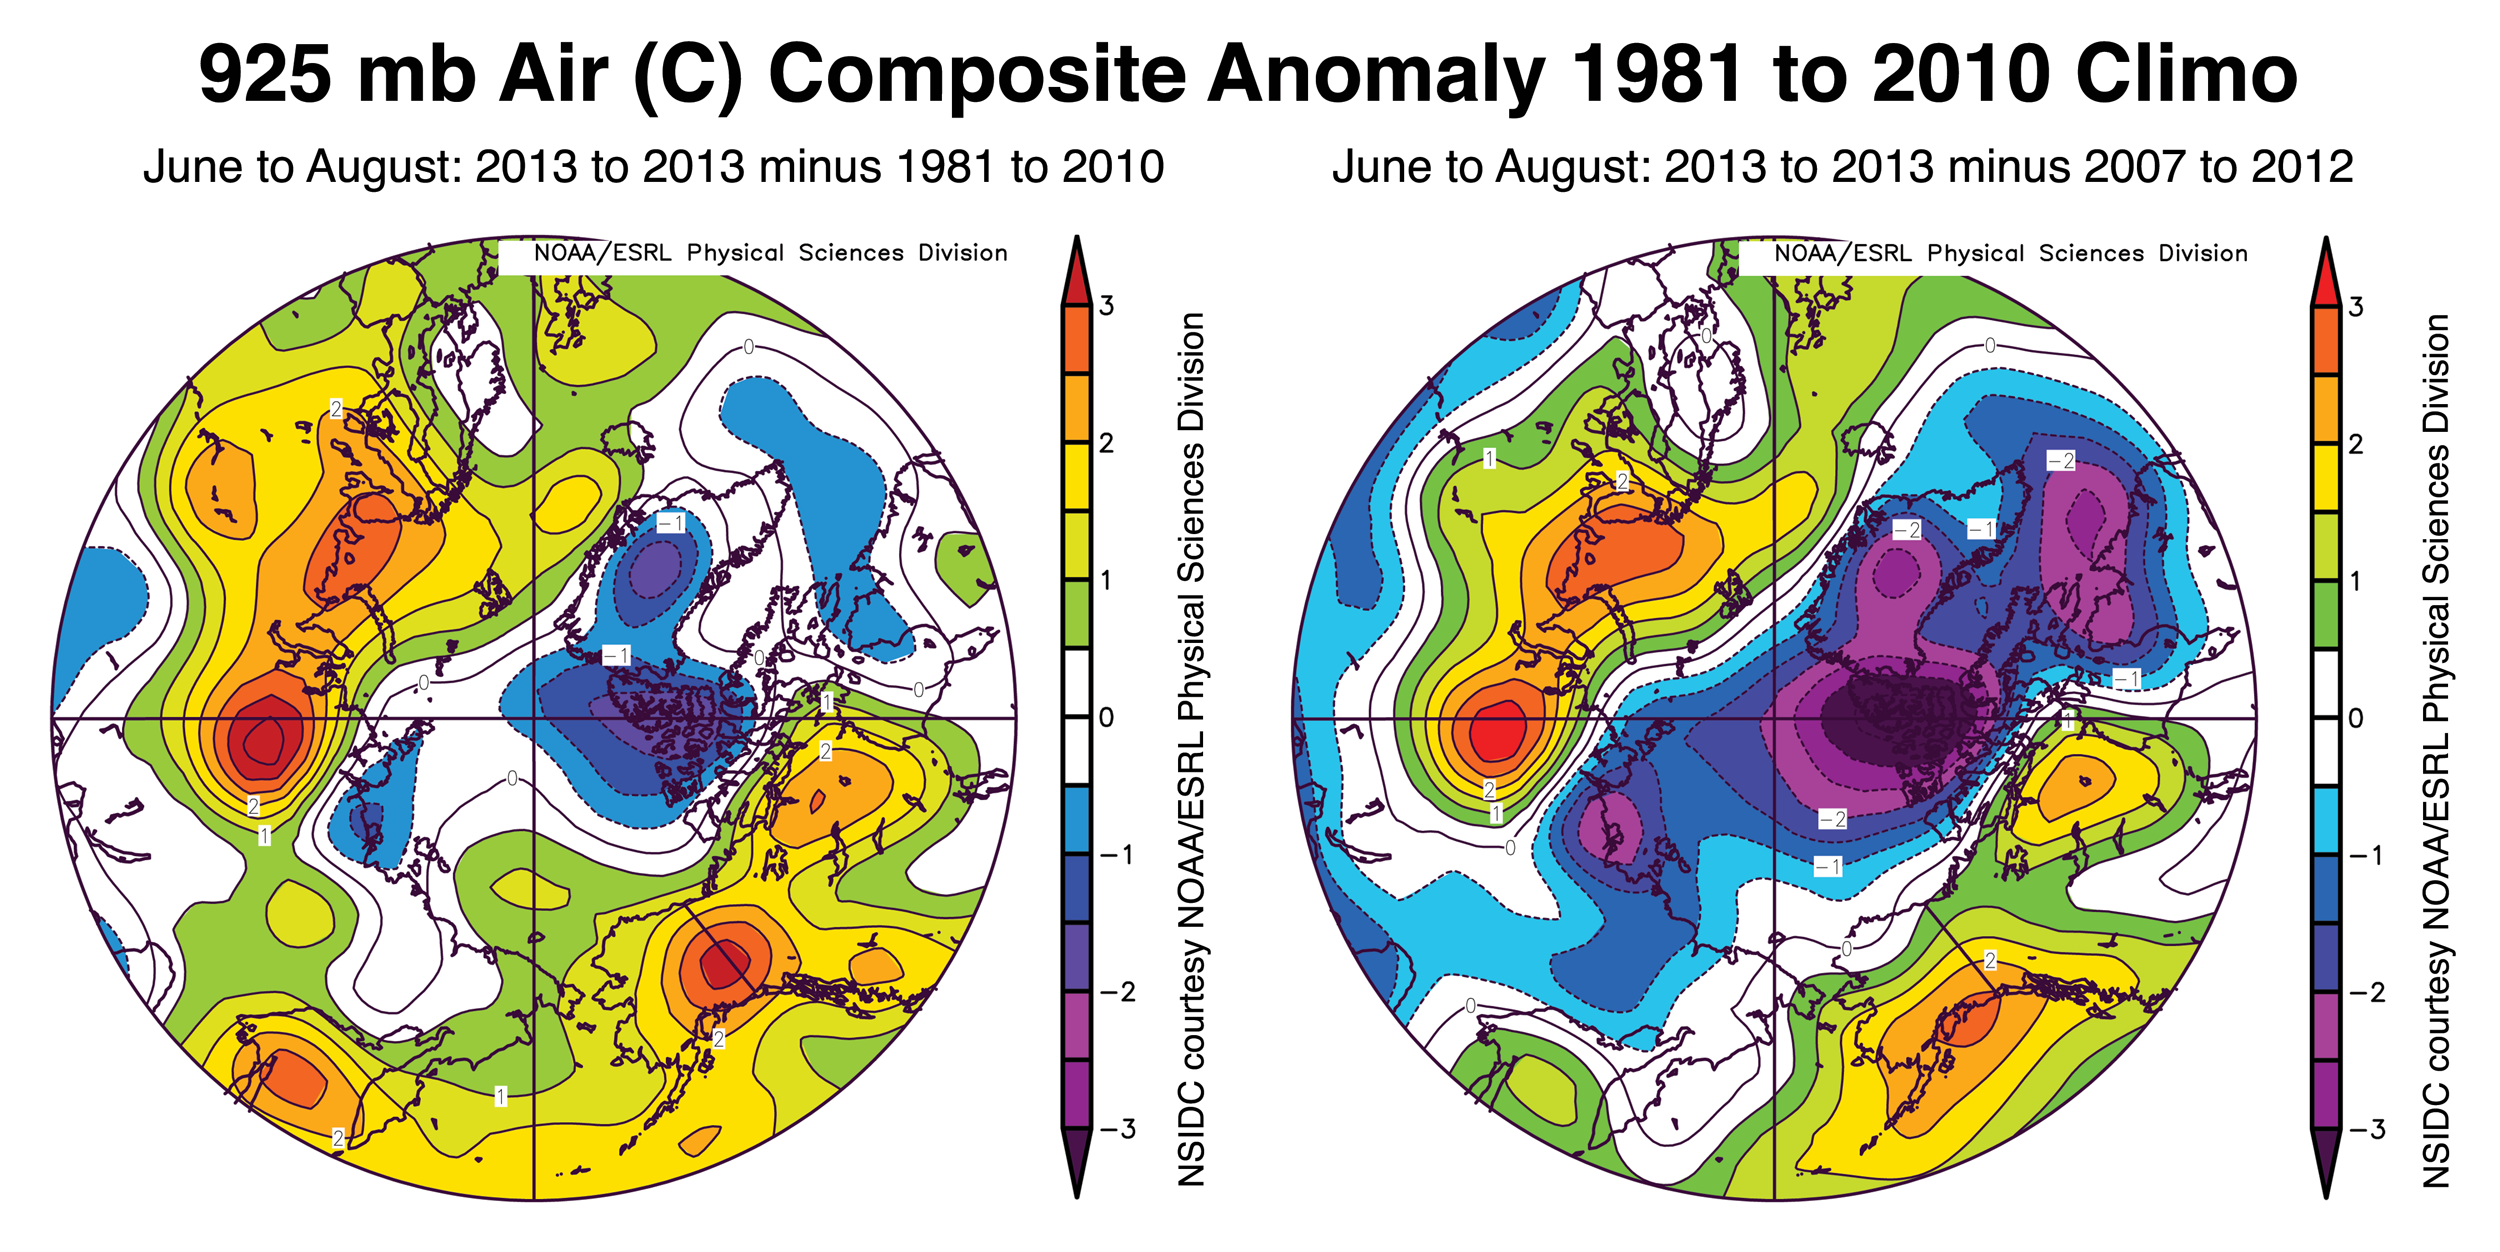
Figure 3: These figures show air temperature anomalies averaged from June, July, and August 2013 at the 925 hPa level, relative to the 1981 to 2010 average (left) and relative to the 2007 to 2012 average (right).
Credit: NOAA/ESRL Physical Sciences Division
High-resolution image
As a whole, air temperatures this summer have been below average over most of the central Arctic Ocean and Greenland, helping to slow down ice melting. Compared to the 1981 to 2010 average, air temperatures at the 925 hPa level have been -0.5 to -2.0 degrees Celsius (-0.9 to -3.6 degrees Fahrenheit) below average over central Greenland, north of Greenland and towards the pole, and over the Canadian Archipelago. Unusually low temperatures are also noted over the East Siberian Sea, where ice cover has remained near average throughout the summer.
The cool conditions that have prevailed this summer are even more remarkable when compared to the last six years, which have seen very low September sea ice extents. Compared to the 2007 to 2012 average, air temperatures at the 925 hPa level averaged over June, July and August were lower this summer throughout most of the Arctic by -0.5 to -3.5 degrees Celsius (-0.9 to -6.3 degrees Fahrenheit). The previous six summers have been dominated by high sea level pressure over the Beaufort Sea and Greenland, paired with low sea level pressure over Eurasia—a pattern that helps to transport warm air into the Arctic. In contrast, this summer was characterized by low sea level pressure over the central Arctic and Greenland. Cooler conditions have also led to less surface melting on the Greenland Ice Sheet.
Sea surface temperature trends
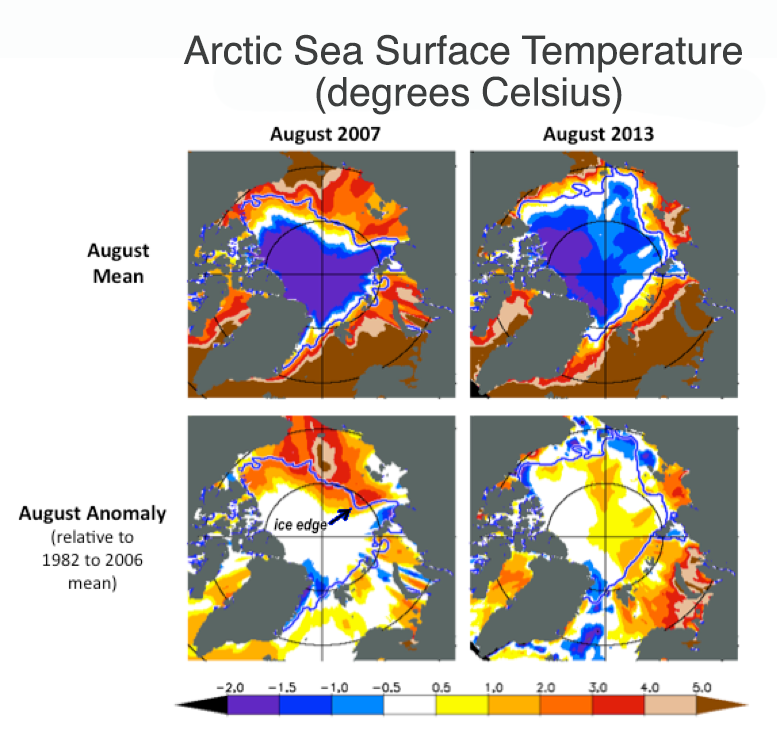
Figure 4: These maps show Arctic sea surface temperatures (top) and temperature anomalies (bottom) for August 2013, in degrees Celsius.
Credit: Michael Steele and Wendy Ermold, Polar Science Center, Applied Physics Lab, University of Washington
High-resolution image
Colleagues Michael Steele and Wendy Ermold at the University of Washington found that sea surface temperatures (SSTs) in the Arctic Ocean were above the 1982 to 2006 average during August, as has been the case since 2007. Sea ice retreat was later and not as extreme relative to recent years in the western Arctic (i.e., the Beaufort, Chukchi, and East Siberian seas) and as a result, SSTs were near the long-term average there. SSTs were well above average in the eastern Arctic (Laptev, Kara, and Barents seas). This can be linked to early ice retreat in the Laptev Sea. However, warm conditions in the southern Barents and Kara seas are likely influenced by advection of warm water from the south in the Norwegian Sea. Overall, for the period 2007 to 2013 there is a pattern of declining SSTs in the western Arctic, and increasing SSTs in the eastern Arctic.
Antarctic sea ice extent
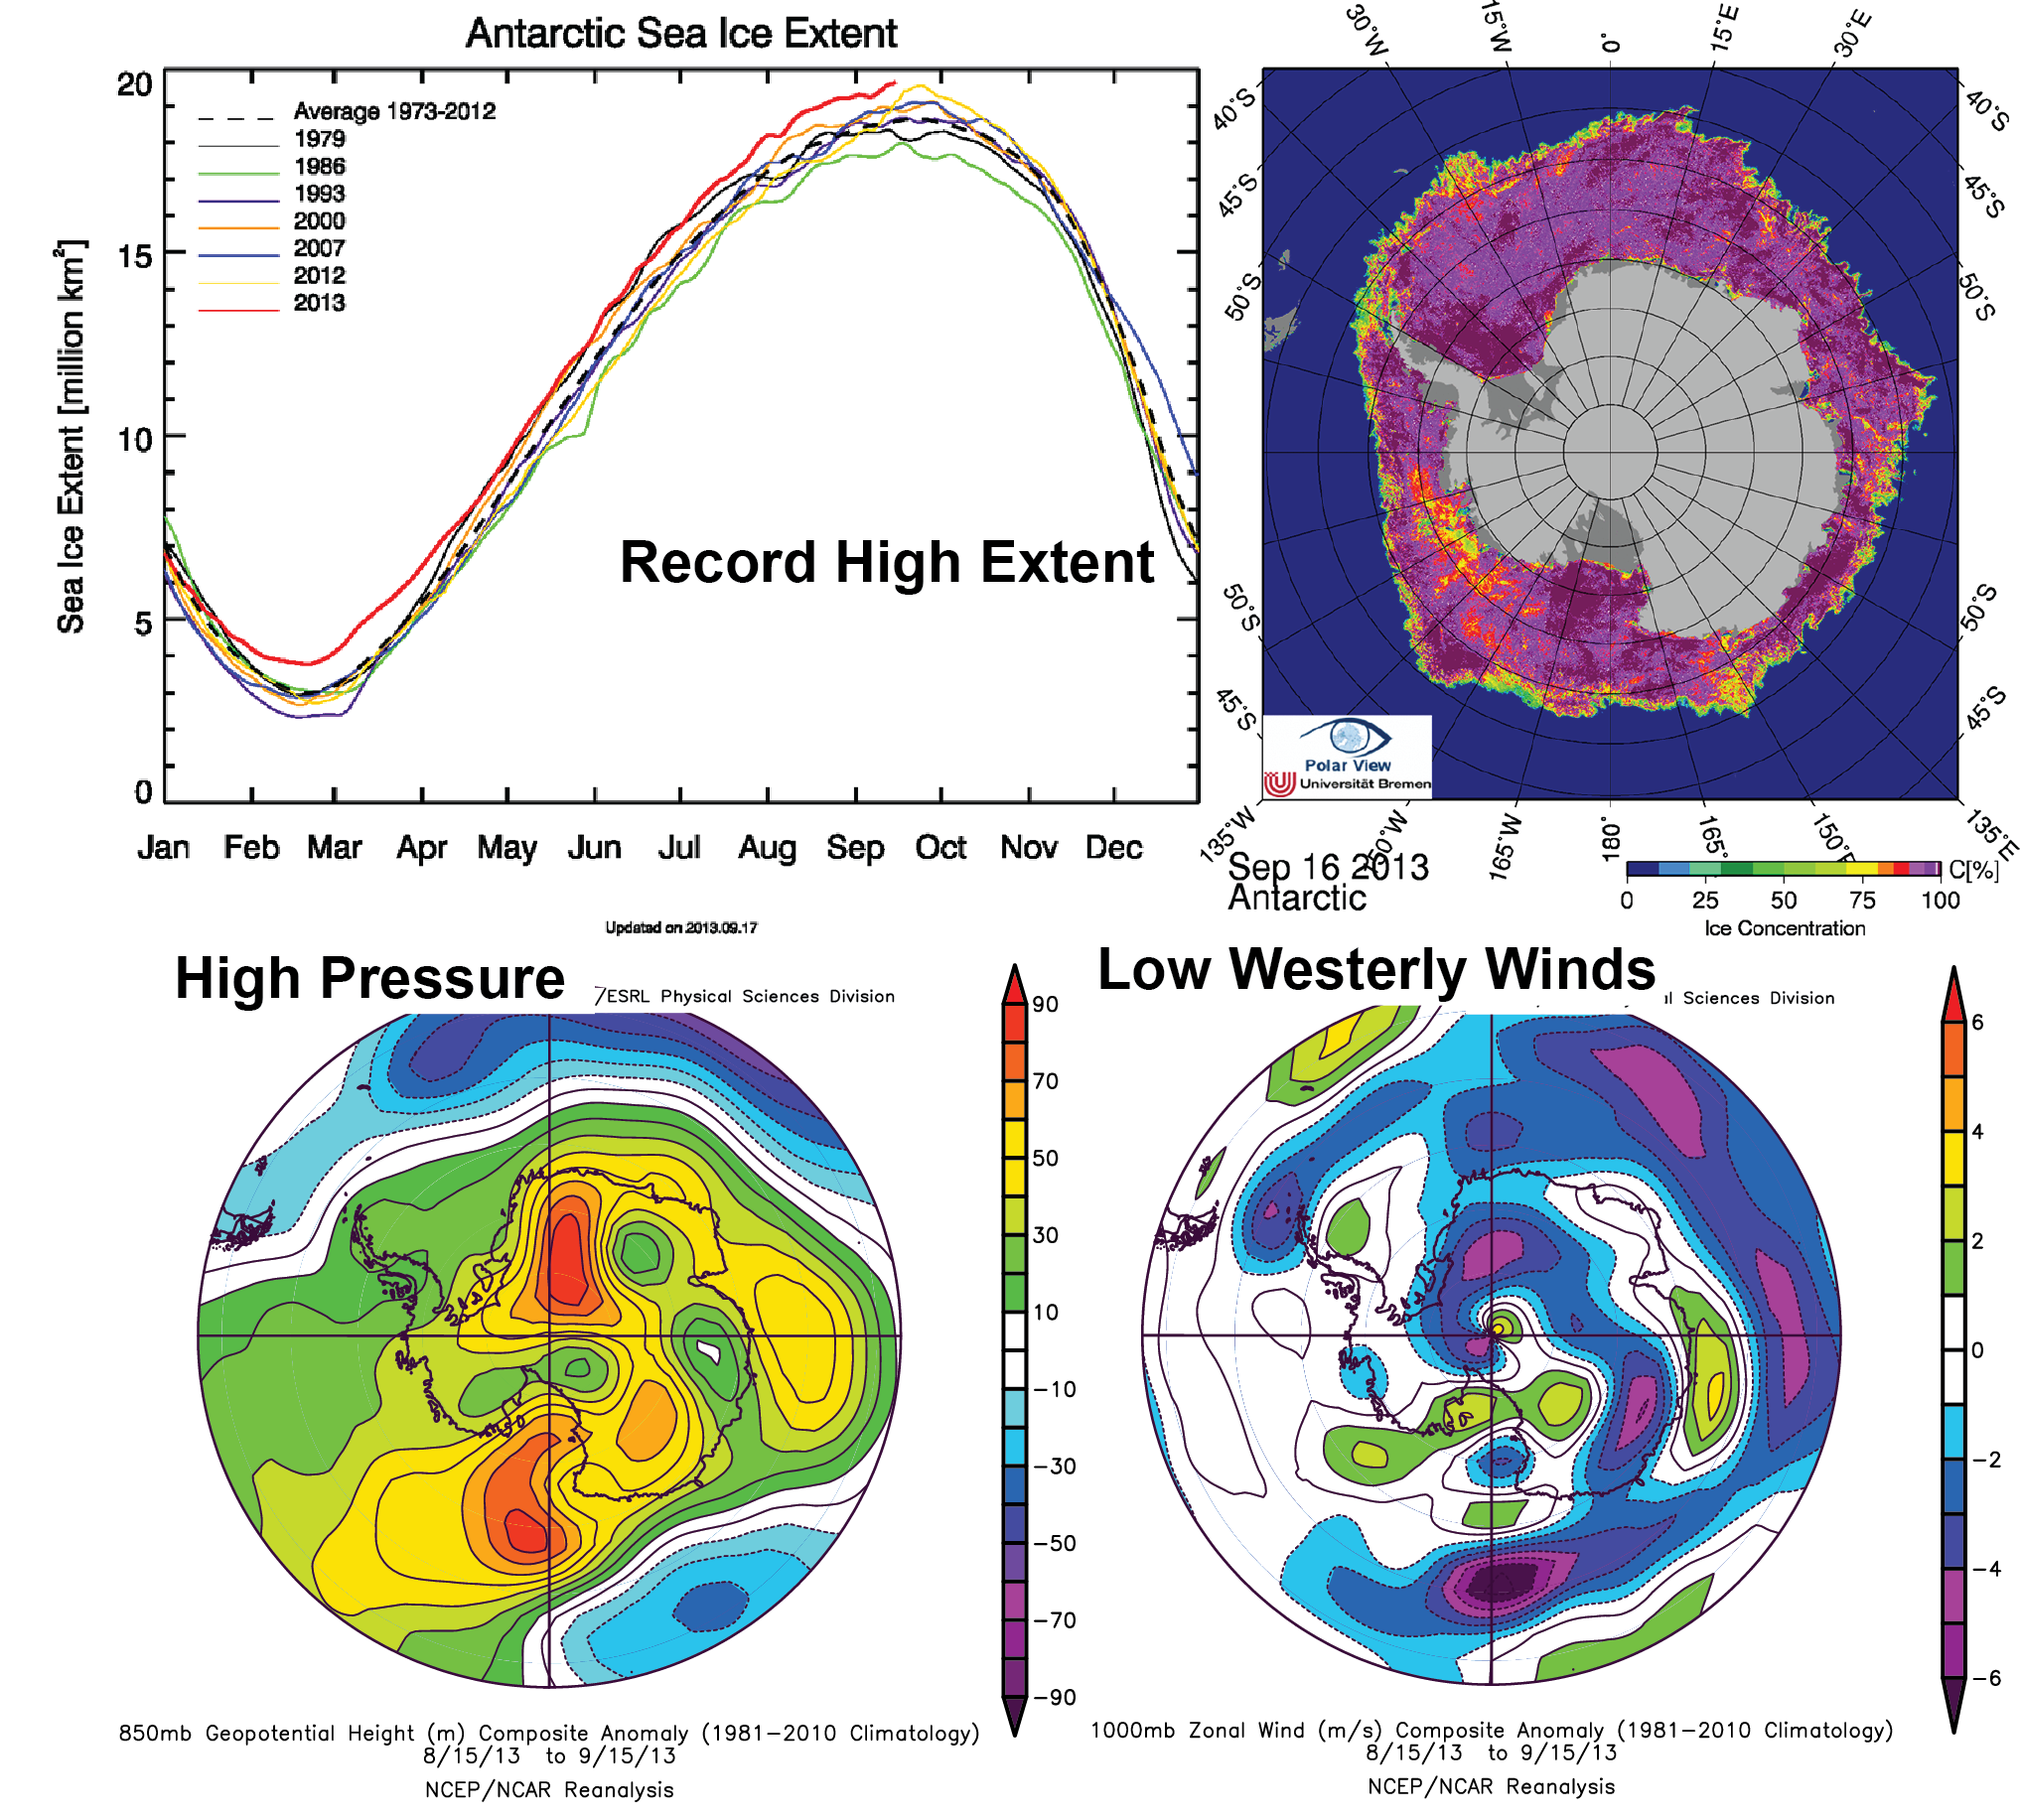
Figure 5. Sea ice extent data from high-resolution passive microwave data (top left and right), and climate data for the period August 15 to September 15, 2013 (bottom images). These images show Antarctic sea ice extent near the satellite-era record high set last year. The geopotential height at 850 millibars (lower left) is an indication of the relative air pressure at ~5000 feet (~1500 meters) above sea level. This shows an unusually broad area of high pressure encompassing the entire continent out to near the sea ice edge, and low pressure surrounding that outside the edge – the opposite of the general trend. This has greatly reduced the average westerly wind flow (shows as negative values in the zonal wind plot, lower right), making for light winds at the sea ice edge.
Credit: University of Bremen/AMSR2 (top images) and NOAA/ESRL Physical Sciences Division (bottom images).
High-resolution image
As ice extent approaches its summer minimum in the Arctic, the winter maximum is near for Antarctica. This year, as was the case in 2012, Antarctic sea ice extent is very high. As of September 16, the current extent is 19.45 million square kilometers (7.51 million square miles), a record for this date with respect to the 1979 to 2012 satellite era. This is about 3.9% above the average maximum extent for the 30-year comparison period 1981 to 2010. In contrast, this year’s Arctic summer minimum ice extent is approximately 30% below levels seen in the early 1980s, and the 2012 record low extent was around 60% below levels seen in the same period. This helps to highlight why scientists are more concerned by Arctic ice shrinkage than by Antarctic ice expansion.
Antarctic weather patterns in August were unusual. Contrary to a 50-year trend towards stronger westerly wind flow—a pattern associated with both ozone loss and increased heat-trapping gases in the atmosphere—August 2013 saw a period of very low westerly wind speed across the continent.
* Note: On September 19, 2013, we revised a sentence in this section for clarity. A sentence that originally read, “In contrast, this year’s Arctic summer minimum ice extent is approximately 30% below the 30-year period average, and the 2012 record low extent was nearly 60% below the average.” now reads, “In contrast, this year’s Arctic summer minimum ice extent is approximately 30% below levels seen in the early 1980s, and the 2012 record low extent was around 60% below levels seen in the same period.”

