Another warm month in the Arctic

High air temperatures observed over the Barents and Kara Seas for much of this past winter moderated in February. Overall, the Arctic remained warmer than average and sea ice extent remained at record low levels.

Overview of conditions

Figure 1. Arctic sea ice extent for February 2017 was 14.28 million square kilometers (5.51 million square miles). The magenta line shows the 1981 to 2010 median extent for that month. Sea Ice Index data. About the data||Credit: National Snow and Ice Data Center|High-resolution image

Figure 1. Arctic sea ice extent for February 2017 was 14.28 million square kilometers (5.51 million square miles). The magenta line shows the 1981 to 2010 median extent for the month. Sea Ice Index data. About the data

Credit: National Snow and Ice Data Center
High-resolution image

Arctic sea ice extent for February 2017 averaged 14.28 million square kilometers (5.51 million square miles), the lowest February extent in the 38-year satellite record. This is 40,000 square kilometers (15,400 square miles) below February 2016, the previous lowest extent for the month, and 1.18 million square kilometers (455,600 square miles) below the February 1981 to 2010 long term average.

Ice extent increased at varying rates, with faster growth during the first and third weeks, and slower growth during the second and fourth weeks. Most of the ice growth in February occurred in the Bering Sea, though extent in the Bering remained below average by the end of the month. Sea ice extent in the Sea of Okhotsk substantially decreased mid-month before rebounding to almost typical levels at the end of the month. Overall, however, the ice retreated in this region. Extent in the Barents and Kara Seas remained low through the month as is has all season, with little change in the ice edge location.

Conditions in context

Figure 2a. The graph above shows Arctic sea ice extent as of March 5, 2017, along with daily ice extent data for four previous years. 2016 to 2017 is shown in blue, 2015 to 2016 in green, 2014 to 2015 in orange, 2013 to 2014 in brown, and 2012 to 2013 in purple. The 1981 to 2010 median is in dark gray. The gray areas around the median line show the interquartile and interdecile ranges of the data. Sea Ice Index data. About the data||Credit: National Snow and Ice Data Center|High-resolution image

Figure 2a. The graph above shows Arctic sea ice extent as of March 5, 2017, along with daily ice extent data for four previous years. 2016 to 2017 is shown in blue, 2015 to 2016 in green, 2014 to 2015 in orange, 2013 to 2014 in brown, and 2012 to 2013 in purple. The 1981 to 2010 median is in dark gray. The gray areas around the median line show the interquartile and interdecile ranges of the data. Sea Ice Index data. About the data

Credit: National Snow and Ice Data Center
High-resolution image

Figure 2b. The plot shows Arctic air temperature differences at the 925 hPa level in degrees Celsius for February 2017. Yellows and reds indicate temperatures higher than the 1981 to 2010 average; blues and purples indicate temperatures lower than the 1981 to 2010 average.||Credit: NSIDC courtesy NOAA Earth System Research Laboratory Physical Sciences Division| High-resolution image

Figure 2b. The plot shows Arctic air temperature differences at the 925 hPa level in degrees Celsius for February 2017. Yellows and reds indicate temperatures higher than the 1981 to 2010 average; blues and purples indicate temperatures lower than the 1981 to 2010 average.

Credit: NSIDC courtesy NOAA Earth System Research Laboratory Physical Sciences Division
High-resolution image

Air temperatures at the 925 hPa level (approximately 2,500 feet above sea level) remained 2 to 5 degrees Celsius (4 to 9 degrees Fahrenheit) above average over the Arctic Ocean. The high air temperatures observed over the Barents and Kara Seas for much of this past winter moderated in February. February air temperatures over the Barents Sea ranged between 4 to 5 degrees Celsius (8 to 9 degrees Fahrenheit) above average, compared to 7 degrees Celsius (13 degrees Fahrenheit) above average in January. Recall that these January temperature extremes were associated with a series of strong cyclones entering the Arctic Ocean from the North Atlantic, drawing in warm air. Sea level pressure in February was nevertheless lower than average over much of the Arctic Ocean. Sea level pressure was higher than average over the Bering Sea and just north of Scandinavia.

February 2017 compared to previous years

Figure 3. Monthly February ice extent for 1979 to 2017 shows a decline of 3 percent per decade.||Credit: National Snow and Ice Data Center| High-resolution image

Figure 3. Monthly February ice extent for 1979 to 2017 shows a decline of 3 percent per decade.

Credit: National Snow and Ice Data Center
High-resolution image

The linear rate of decline for February is 46,900 square kilometers (18,100 square miles) per year, or 3 percent per decade.

Antarctic minimum extent

Figure 4a. The graph above shows Antarctic sea ice extent as of March 5, 2017, along with daily ice extent data for four previous years. 2016 to 2017 is shown in blue, 2015 to 2016 in green, 2014 to 2015 in orange, 2013 to 2014 in brown, and 2012 to 2013 in purple. The 1981 to 2010 median is in dark gray. The gray areas around the median line show the interquartile and interdecile ranges of the data. Sea Ice Index data.||Credit: National Snow and Ice Data Center|High-resolution image

Figure 4a. The graph above shows Antarctic sea ice extent as of March 5, 2017, along with daily ice extent data for four previous years. 2016 to 2017 is shown in blue, 2015 to 2016 in green, 2014 to 2015 in orange, 2013 to 2014 in brown, and 2012 to 2013 in purple. The 1981 to 2010 median is in dark gray. The gray areas around the median line show the interquartile and interdecile ranges of the data. Sea Ice Index data.

Credit: National Snow and Ice Data Center
High-resolution image

Figure 4b. This graph shows monthly ice extent for February plotted as a time series of percent differences with respect to the average over the period 1981 through 2010. The dotted gray line shows the linear trend. Sea Ice Index data. About the data||Credit: National Snow and Ice Data Center|High-resolution image

Figure 4b. This graph shows monthly ice extent for February, plotted as a time series of percent differences from the 1981 to 2010 average. The dotted gray line shows the linear trend. Sea Ice Index data. About the data

Credit: National Snow and Ice Data Center
High-resolution image

Antarctic sea ice is nearing its annual minimum extent and continues to track at record low levels for this time of year. On February 13, Antarctic sea ice extent dropped to 2.29 million square kilometers (884,000 square miles), setting a record lowest extent in the satellite era. The previous lowest extent occurred on February 27, 1997. By the end of February, extent had dropped even further to 2.13 million square kilometers (822,400 square miles). The record lows are not surprising, given Antarctic sea ice extent’s high variability. Just a few years back, extent in the region set record highs (Figure 4b).

Sea ice extent was particularly low in the Amundsen Sea, which remained nearly ice-free throughout February. Typically, sea ice in February extends at least a couple hundred kilometers along the entire coastline of the Amundsen. Near-average ice extent persisted in the Weddell Sea and in several sectors along the East Antarctic coast.

Continuity of the sea ice record

Figure 5. This chart shows the lifespans of current and future orbiting passive microwave sensors. ||Credit: Walt Meier, NASA| High-resolution image

Figure 5. This chart shows the lifespans of current and expected future orbiting passive microwave sensors.

Credit: W. Meier, NASA Goddard Space Flight Center Cryospheric Sciences Laboratory
High-resolution image

As noted last year, the sensor that NSIDC had been using for sea ice extent, the Special Sensor Microwave Imager and Sounder (SSMIS) on the Defense Meteorological Satellite Program (DMSP) F17 satellite, started to malfunction. In response, NSIDC switched to the SSMIS on the newer F18 satellite. Later, F17 recovered to normal function, though it recently started to malfunction again.

The DMSP series of sensors have been a stalwart of the sea ice extent time series, providing a continuous record since 1987. Connecting this to data from the earlier Scanning Multichannel Microwave Radiometer (SMMR) results in a continuous record starting in 1979 of high quality and consistency. However, with the issues of F17 and last year’s loss of the newest sensor, F19, grave concerns have arisen about the long-term continuity of the passive microwave sea ice record. Only two DMSP sensors are currently fully capable for sea ice observations: F18 and the older F16; these two sensors have been operating for over 7 and 13 years respectively, well beyond their nominal 5-year lifetimes.

The only other similar sensor currently operating is the Japan Aerospace Exploration Agency (JAXA) Advanced Microwave Scanning Radiometer 2 (AMSR2), which is approaching its 5-year design lifetime in May 2017. NSIDC is now evaluating AMSR2 data for integration into the sea ice data record if needed. Future satellite missions with passive microwave sensors are either planned or proposed by the U.S., JAXA, and ESA, but it is unlikely that a successor to the DMSP series and AMSR2 will be operational before 2022. This presents a growing risk of a gap in the sea ice extent record. Should such a gap occur, NSIDC and NASA would seek to fill the gap as much as possible with other types of sensors (e.g., visible or infrared sensors).

2017 ushers in record low extent

Record low daily Arctic ice extents continued through most of January 2017, a pattern that started last October. Extent during late January remained low in the Kara, Barents and Bering Seas. Southern Hemisphere extent also tracked at record low levels for January; globally, sea ice cover remains at record low levels.

Overview of conditions

extent map

Figure 1. Arctic sea ice extent for January 2017 was 13.38 million square kilometers (5.17 million square miles). The magenta line shows the 1981 to 2010 median extent for that month. Sea Ice Index data. About the data

Credit: National Snow and Ice Data Center
High-resolution image

Arctic sea ice extent for January 2017 averaged 13.38 million square kilometers (5.17 million square miles), the lowest January extent in the 38-year satellite record. This is 260,000 square kilometers (100,000 square miles) below January 2016, the previous lowest January extent, and 1.26 million square kilometers (487,000 square miles) below the January 1981 to 2010 long-term average.

Ice growth stalled during the second week of the month, and the ice edge retreated within the Kara and Barents Seas, and within the Sea of Okhotsk. After January 16, extent increased at a more rapid pace, but the rate of ice growth was still below average for January as a whole. For a few days towards the end of the month, the extent was slightly greater than recorded in 2006, a year which also saw many record low days in January, but by the 30th it was tracking below 2006. Through most of January the ice edge remained north of the Svalbard Archipelago, largely due to the inflow of warm Atlantic water along the western part of the archipelago. However, by the end of January, some ice was found to the northeast and northwest of Svalbard. At the end of January, ice extent remained well below average within the Kara, Barents, and Bering Seas.

Conditions in context

time series graph

Figure 2a. The graph above shows Arctic sea ice extent as of February 5, 2017, along with daily ice extent data for four previous years. 2016 to 2017 is shown in blue, 2015 to 2016 in green, 2014 to 2015 in orange, 2013 to 2014 in brown, and 2012 to 2013 in purple. The 1981 to 2010 average is in dark gray. The gray areas around the median line show the interquartile and interdecile ranges of the data. Sea Ice Index data.

Credit: National Snow and Ice Data Center
High-resolution image

Figure 2b. The plot shows Arctic air temperature difference from average, in degrees Celsius, for January 2017.

Credit: NSIDC courtesy NOAA/ESRL Physical Sciences Division
High-resolution image

January air temperatures at the 925 hPa level (approximately 2,500 feet above sea level) were above average over nearly all of the Arctic Ocean, continuing the pattern that started last autumn (Figure 2b). Air temperatures were more than 5 degrees Celsius (9 degrees Fahrenheit) above the 1981 to 2010 average over the northern Barents Sea and as much as 4 degrees Celsius (7 degrees Fahrenheit) above average in the northern Chukchi and East Siberian Seas. It was also unusually warm over northwestern Canada. Cooler than average conditions (up to 3 degrees Celsius, or 5 degrees Fahrenheit below average) prevailed over the northwest part of Russia and the northeast coast of Greenland.

Atmospheric circulation over the Arctic during the first three weeks of January was characterized by a broad area of below average sea level pressure extending over almost the entire Arctic Ocean. Higher-than-average sea level pressure dominated over the Gulf of Alaska and the North Atlantic Ocean south of Iceland. This set up warm southerly winds from both the northern North Atlantic and the Bering Strait areas, helping to explain the high January air temperatures over the Arctic Ocean. According to the analysis of NASA scientist Richard Cullather, the winter of 2015 to 2016 was the warmest ever recorded in the Arctic in the satellite data record. Whether the winter of 2016 to 2017 will end up warmer remains to be seen; conditions are typically highly variable. For example, during the last week of January, the area of low pressure shifted towards the Siberian side of the Arctic. In the northern Laptev Sea, pressures fell to more than 20 hPa below the 1981 to 2010 average. This was associated with a shift towards cooler conditions over the Arctic Ocean, which may explain why ice extent towards the end of the month rose above levels recorded in 2006.

January 2017 compared to previous years

trend graph

Figure 3. Monthly January ice extent for 1979 to 2017 shows a decline of 3.2 percent per decade.

Credit: National Snow and Ice Data Center
High-resolution image

Through 2017, the linear rate of decline for January is 47,400 square kilometers (18,300 square miles) per year, or 3.2 percent per decade.

Amundsen Sea nearly free of ice

S_daily_extent_hires

Figure 4. Antarctic sea ice extent for February 5, 2017 shows the Amundsen Sea nearly free of ice. The orange line shows the 1981 to 2010 median extent for that day. Sea Ice Index data. About the data

Credit: National Snow and Ice Data Center
High-resolution image

Extent is tracking at records low levels in the Southern Hemisphere, where it is currently summer. As shown in this plot for February 5, this is primarily due to low ice extent within the Amundsen Sea, where only a few scattered patches of ice remain. By contrast, extent in the Weddell Sea is now only slightly below average. This pattern is consistent with persistent above average air temperatures off western Antarctica.

Further reading

Cullather, R. I., Y.-K. Lim, L. N. Boisvert, L. Brucker, J. N. Lee, and S. M. J. Nowicki. 2016. Analysis of the warmest Arctic winter, 2015-2016. Geophysical Research Letters,43, doi:10.1002/2016GL071228.

Low sea ice extent continues in both poles

Sea ice in the Arctic and the Antarctic set record low extents every day in December, continuing the pattern that began in November. Warm atmospheric conditions persisted over the Arctic Ocean, notably in the far northern Atlantic and the northern Bering Sea. Air temperatures near the Antarctic sea ice edge were near average. For the year 2016, sea ice extent in both polar regions was at levels well below what is typical of the past several decades.

Overview of conditions

Figure 1. Arctic sea ice extent for December 2016 was 12.10 million square kilometers (4.67 million square miles). The magenta line shows the 1981 to 2010 median extent for that month. The black cross indicates the geographic North Pole.

Figure 1. Arctic sea ice extent for December 2016 was 12.10 million square kilometers (4.67 million square miles). The magenta line shows the 1981 to 2010 median extent for that month. The black cross indicates the geographic North Pole. Sea Ice Index data. About the data

Credit: National Snow and Ice Data Center
High-resolution image

Arctic sea ice extent for December 2016 averaged 12.10 million square kilometers (4.67 million square miles), the second lowest December extent in the satellite record. This is 20,000 square kilometers (7,700 square miles) above December 2010, the lowest December extent, and 1.03 million square kilometers (397,700 square miles) below the December 1981 to 2010 long-term average.

The rate of ice growth for December was 90,000 square kilometers (34,700 square miles) per day. This is faster than the long-term average of 64,100 square kilometers (24,700 square miles) per day. As a result, extent for December was not as far below average as was the case in November. Ice growth for December occurred primarily within the Chukchi Sea, Kara Sea, and Hudson Bay—areas that experienced a late seasonal freeze-up. Compared to the record low for the month set in 2010, sea ice for December 2016 was less extensive in the Kara, Barents, and East Greenland Seas, and more extensive in Baffin and Hudson Bays.

Conditions in context

Figure 2a. The graph above shows Arctic sea ice extent as of January 2, 2017, along with daily ice extent data for four previous years. 2016 to 2017 is shown in blue, 2015 to 2016 in green, 2014 to 2015 in orange, 2013 to 2014 in brown, and 2012 to 2013 in purple. The 1981 to 2010 average is in dark gray. The gray area around the average line shows the two standard deviation range of the data.

Figure 2a. The graph above shows Arctic sea ice extent as of January 2, 2017, along with daily ice extent data for four previous years. 2016 to 2017 is shown in blue, 2015 to 2016 in green, 2014 to 2015 in orange, 2013 to 2014 in brown, and 2012 to 2013 in purple. The 1981 to 2010 average is in dark gray. The gray area around the average line shows the two standard deviation range of the data. Sea Ice Index data.

Credit: National Snow and Ice Data Center
High-resolution image

Figure 2b. This plot shows air temperature difference from average for December 2016. Air temperatures at the 925 hPa level (approximately 2,500 feet above sea level) were more than 3 degrees Celsius (5 degrees Fahrenheit) above the 1981 to 2010 average over the central Arctic Ocean and northern Barents Sea, and as much as 5 degrees Celsius (9 degrees Fahrenheit) above average over the Chukchi Sea.

Figure 2b. This plot shows air temperature difference from average for December 2016. Air temperatures at the 925 hPa level (approximately 2,500 feet above sea level) were more than 3 degrees Celsius (5 degrees Fahrenheit) above the 1981 to 2010 average over the central Arctic Ocean and northern Barents Sea, and as much as 5 degrees Celsius (9 degrees Fahrenheit) above average over the Chukchi Sea.

Credit: NSIDC courtesy NOAA/ESRL Physical Sciences Division
High-resolution image

Air temperatures at the 925 hPa level (approximately 2,500 feet above sea level) were more than 3 degrees Celsius (5 degrees Fahrenheit) above the 1981 to 2010 average over the central Arctic Ocean and northern Barents Sea, and as much as 5 degrees Celsius (9 degrees Fahrenheit) above average over the Chukchi Sea. Repeated warm air intrusions occurred over the Chukchi and Barents Seas, continuing the pattern seen in November.

In contrast, central Russia and northern British Columbia experienced temperatures 3 to 5 degrees Celsius (5 to 9 degrees Fahrenheit) below average (Figure 2b). Atmospheric circulation over the Arctic in December was characterized by a broad area of lower-than-average pressure over Greenland and the North Pole, extending across the Arctic Ocean to eastern Siberia, and another region of low pressure over the Ural Mountains. Higher-than-average pressure dominated Europe and the Gulf of Alaska. This set up the very warm southerly winds from both the northern North Atlantic and the Bering Strait areas, pushing Arctic air temperatures to unusually high levels for brief periods in early December and near Christmas.

December 2016 compared to previous years

Figure 3. Monthly December ice extent for 1979 to 2016 shows a decline of 3.4 percent per decade.

Figure 3. Monthly December ice extent for 1979 to 2016 shows a decline of 3.4 percent per decade.

Credit: National Snow and Ice Data Center
High-resolution image

Through 2016, the linear rate of decline for December is 44,500 square kilometers (17,200 square miles) per year, or 3.4 percent per decade.

While daily extents for December 2016 were at record lows, based on the method employed by NSIDC, the monthly average extent for December 2016 was slightly higher than that recorded for December 2010, the record low December in the satellite record. The monthly average extent for the month of December is higher than the month’s average of daily extents because of the way in which the Sea Ice Index algorithm calculates the monthly extent. The algorithm calculates the monthly average total extent from the monthly average gridded concentration field. Thus, when sea ice is retreating or advancing at a high rate over the course of the month, as was the case for December 2016, the Sea Ice Index monthly average can yield a larger extent than from simply averaging daily extent values. See the Sea Ice Index documentation for further information.

2016 year in review

Figure 4. Arctic temperatures at the 925 hPa level (about 2,500 feet above sea level) over the period January to December of 2016 were above average over nearly the entire Arctic region and especially over the Arctic Ocean. By contrast, air temperatures over the Antarctic region for the same period were above average in some areas, such as the Antarctic Peninsula and near the pole, but below average in others.

Figure 4. Arctic temperatures at the 925 hPa level (about 2,500 feet above sea level) over the period January to December of 2016 were above average over nearly the entire Arctic region and especially over the Arctic Ocean. By contrast, air temperatures over the Antarctic region for the same period were above average in some areas, such as the Antarctic Peninsula and near the pole, but below average in others.

Credit: NSIDC courtesy NOAA/ESRL Physical Sciences Division
High-resolution image

Average annual sea ice extent in both polar regions was low in 2016. Throughout the year, a wave of new record lows were set for both daily and monthly extent. Record low monthly extents were set in the Arctic in January, February, April, May, June, October, and November; and in the Antarctic in November and December.

For the Arctic, the year opened with daily sea ice extent at near record low levels. Sea ice extent in March tied with 2015 for the lowest maximum in the 37-year satellite period. Ice extent was as much as 500,000 square kilometers (193,000 square miles) below any previous year in the record through most of mid-May to early June. However, the pace of decline returned to near-average rates by July, and the end-of-summer minimum sea ice extent, recorded on September 10, eventually tied for second lowest with 2007 (2012 remains the lowest in the satellite time series by more than 600,000 square kilometers or 232,000 square miles).

That September 2016 did not see a new record low is likely due to the unusually stormy atmospheric pattern that set up over the Arctic Ocean in the summer. Storm after storm moved into the central Arctic Ocean, including a pair of very deep low pressure systems in late August. While a stormy pattern will tend to chew up the ice cover, it also spreads the ice out to cover a larger area and typically brings cloudy and, in summer, relatively cool conditions, inhibiting melt. Sometimes these deep lows act to reduce extent by mixing warm ocean waters upwards, but at present there is no compelling evidence that this occurred in 2016.

In October, a pattern of warm air intrusions from the North Atlantic began. This pattern combined with unusually high sea surface temperatures over the Barents and Kara Seas and helped to keep Arctic sea ice extent at low levels for November and December. In the middle of November there was even a several-day period when Arctic sea ice extent decreased. Unusually warm conditions and record low daily sea ice extent levels continued through the end of the year. The unusually high sea ice surface temperatures reflect a shift in ocean circulation, enhancing the import of warm, Atlantic-derived waters into the Arctic Ocean.

In the Southern Hemisphere, overall sea ice extent shifted from near-average over the first half of the year to sharply below average in mid-August. This initiated a period of near-record, and then extreme record low extents that persisted until late in the year. While the Antarctic seasonal sea ice minimum was unremarkable (slightly earlier, and slightly lower, than the 37-year average), the sea ice maximum occurred early (August 31), followed by a period of rapid ice extent decline. By November, extent was more than 2 million square kilometers (772,000 square miles) below the 1981 to 2010 average extent. In combination with the low Arctic sea ice extent for November, this produced a remarkably low global sea ice total.

The cause of the rapid drop in Antarctic sea ice in the second half of 2016 remains elusive. Significant changes in Southern Ocean wind patterns were observed in August, September, and November, but air temperatures and ocean conditions were not highly unusual.

Sea ice cover in Chukchi Sea depends on Bering Strait inflow

Figure 5. This figure shows time series of the Julian dates of seasonal retreat and advance of sea ice in the Chukchi Sea. The trends in retreat and advance (show by the thin solid lines) are related to climate warming. The variations about the trends line are strongly related to variability in the Bering Strait heat inflow. ||Credit: Serreze, M. C., et al. 2016. Journal of Geophysical Research | High-resolution image

Figure 5. This figure shows time series of the Julian dates of seasonal retreat and advance of sea ice in the Chukchi Sea. The trends in retreat and advance (show by the thin solid lines) are related to climate warming. The variations about the trends line are strongly related to variability in the Bering Strait heat inflow.

Credit: Serreze, M. C., et al. 2016. Journal of Geophysical Research

High-resolution image

A recent study by NSIDC scientists Mark Serreze, Julienne Stroeve, and Alexander Crawford, along with University of Washington scientist Rebecca Woodgate, demonstrates strong links between seasonal sea ice retreat and advance in the Chukchi Sea and the inflow of ocean heat into the region through the Bering Strait. The Chukchi Sea region is important as a focus for resource exploration, and vessels transiting the Arctic Ocean must inevitably pass through it. The Chukchi Sea is also part of the seasonal migration route for Bowhead whales that supports subsistence hunting by local indigenous communities.

Serreze and colleagues looked at time series of the date of retreat and advance in which linear trends related to general warming were removed. They found that 68 percent of the variance in the date that ice retreats from the continental shelf break in the Chukchi Sea in spring can be explained by fluctuations in the April through June Bering Strait oceanic heat inflow. The Bering Strait heat inflow data comes from a mooring located within the strait maintained by the University of Washington. They also found that 67 percent of the variance for the date at which ice advances back to the shelf break in autumn and winter can be related to the combined effects of the July through September Bering Strait inflow and the date of ice retreat. When seasonal ice retreat occurs early, low-albedo open water areas are exposed early, which gain a lot of energy from the sun. With more heat in the upper ocean, autumn ice growth is delayed. These relationships with the Bering Strait inflow and ocean heat uptake are superimposed upon the overall trends due to a warming climate. While these relationships lay a path forward to improving seasonal predictions of ice conditions in the region, developing an operational prediction scheme would require more timely acquisition of Bering Strait heat inflow data than is presently possible.

Global sea ice tracking far below average

Figure 6. This time series of daily global sea ice extent (Arctic plus Antarctic) shows global extent tracking below the 1981 to 2010 average. The lower axis of the graph shows month of the year, ticked at the first day of the month

Figure 6a. This time series of daily global sea ice extent (Arctic plus Antarctic) shows global extent tracking below the 1981 to 2010 average. The X axis shows the month of the year, aligned with the first day of the month. Sea Ice Index data.

Credit: NSIDC
High-resolution image

Figure 6b. Waiting for caption. Lorem ipsum. ||Credit: National Snow and Ice Data Center| High-resolution image

Figure 6b. This graph shows daily global sea ice difference from average, relative to the 1981 to 2010 reference period in square kilometers for the satellite record from 1979 through 2016

Credit: National Snow and Ice Data Center
High-resolution image

Figure 6c. Waiting for caption. Lorem ipsum. ||Credit: National Snow and Ice Data Center| High-resolution image

Figure 6c. This graph shows daily sea ice difference from average in units of the standard deviation (based on 1981-2010 variation from the average) for this period.

Credit: National Snow and Ice Data Center
High-resolution image

Global sea ice (Arctic plus Antarctic) continues to track at record low levels in the satellite record, but the deviation from average has moderated compared to what was observed in November. This reflects a December pattern of faster-than-average growth in the Arctic, and slightly slower-than average sea ice extent decline in the Southern Ocean. The gap between the 1981 to 2010 average and the 2016 combined ice extent for December now stands at about 3.0 million square kilometers (1.16 million square miles), down from a peak difference of just over 4 million square kilometers (1.50 million square miles) in mid-November. This globally combined low ice extent is a result of largely separate processes in the two hemispheres.

Changes to our graphics for 2017

 Figure 7. This comparison shows the changes that will be made to NSIDC time series graphs.

Figure 7. This comparison shows the changes that will be made to NSIDC time series graphs.

Credit: NSIDC
High-resolution image

NSIDC is transitioning the sea ice extent time series graphs to show interquartile and interdecile ranges, with the median extent value, in place of standard deviations and the average values. Standard deviations are most useful with data that are clustered towards the average, or “normally distributed” like a bell curve, with few outliers. Sea ice extent data, however, has become skewed due to the strong downward trend in ice extent, with a wider spread of values and more values falling at the low end of the range. Interquartile and interdecile ranges, along with the median value, are better for presenting data with these characteristics. The interquartile and interdecile ranges more clearly show how the data are distributed and can better distinguish outliers, and so provide a better view of the variability of the data.

Further reading

Serreze, M. C., A. Crawford, J. C. Stroeve, A. P. Barrett, and R. A. Woodgate. 2016. Variability, trends and predictability of seasonal sea ice retreat and advance in the Chukchi Sea. Journal of Geophysical Research, 121, doi:10.1002/2016JC011977.

Sea ice hits record lows

Average Arctic sea ice extent for November set a record low, reflecting unusually high air temperatures, winds from the south, and a warm ocean. Since October, Arctic ice extent has been more than two standard deviations lower than the long-term average. Antarctic sea ice extent quickly declined in November, also setting a record low for the month and tracking more than two standard deviations below average during the entire month. For the globe as a whole, sea ice cover was exceptionally low.

Overview of conditions

sea ice extent map

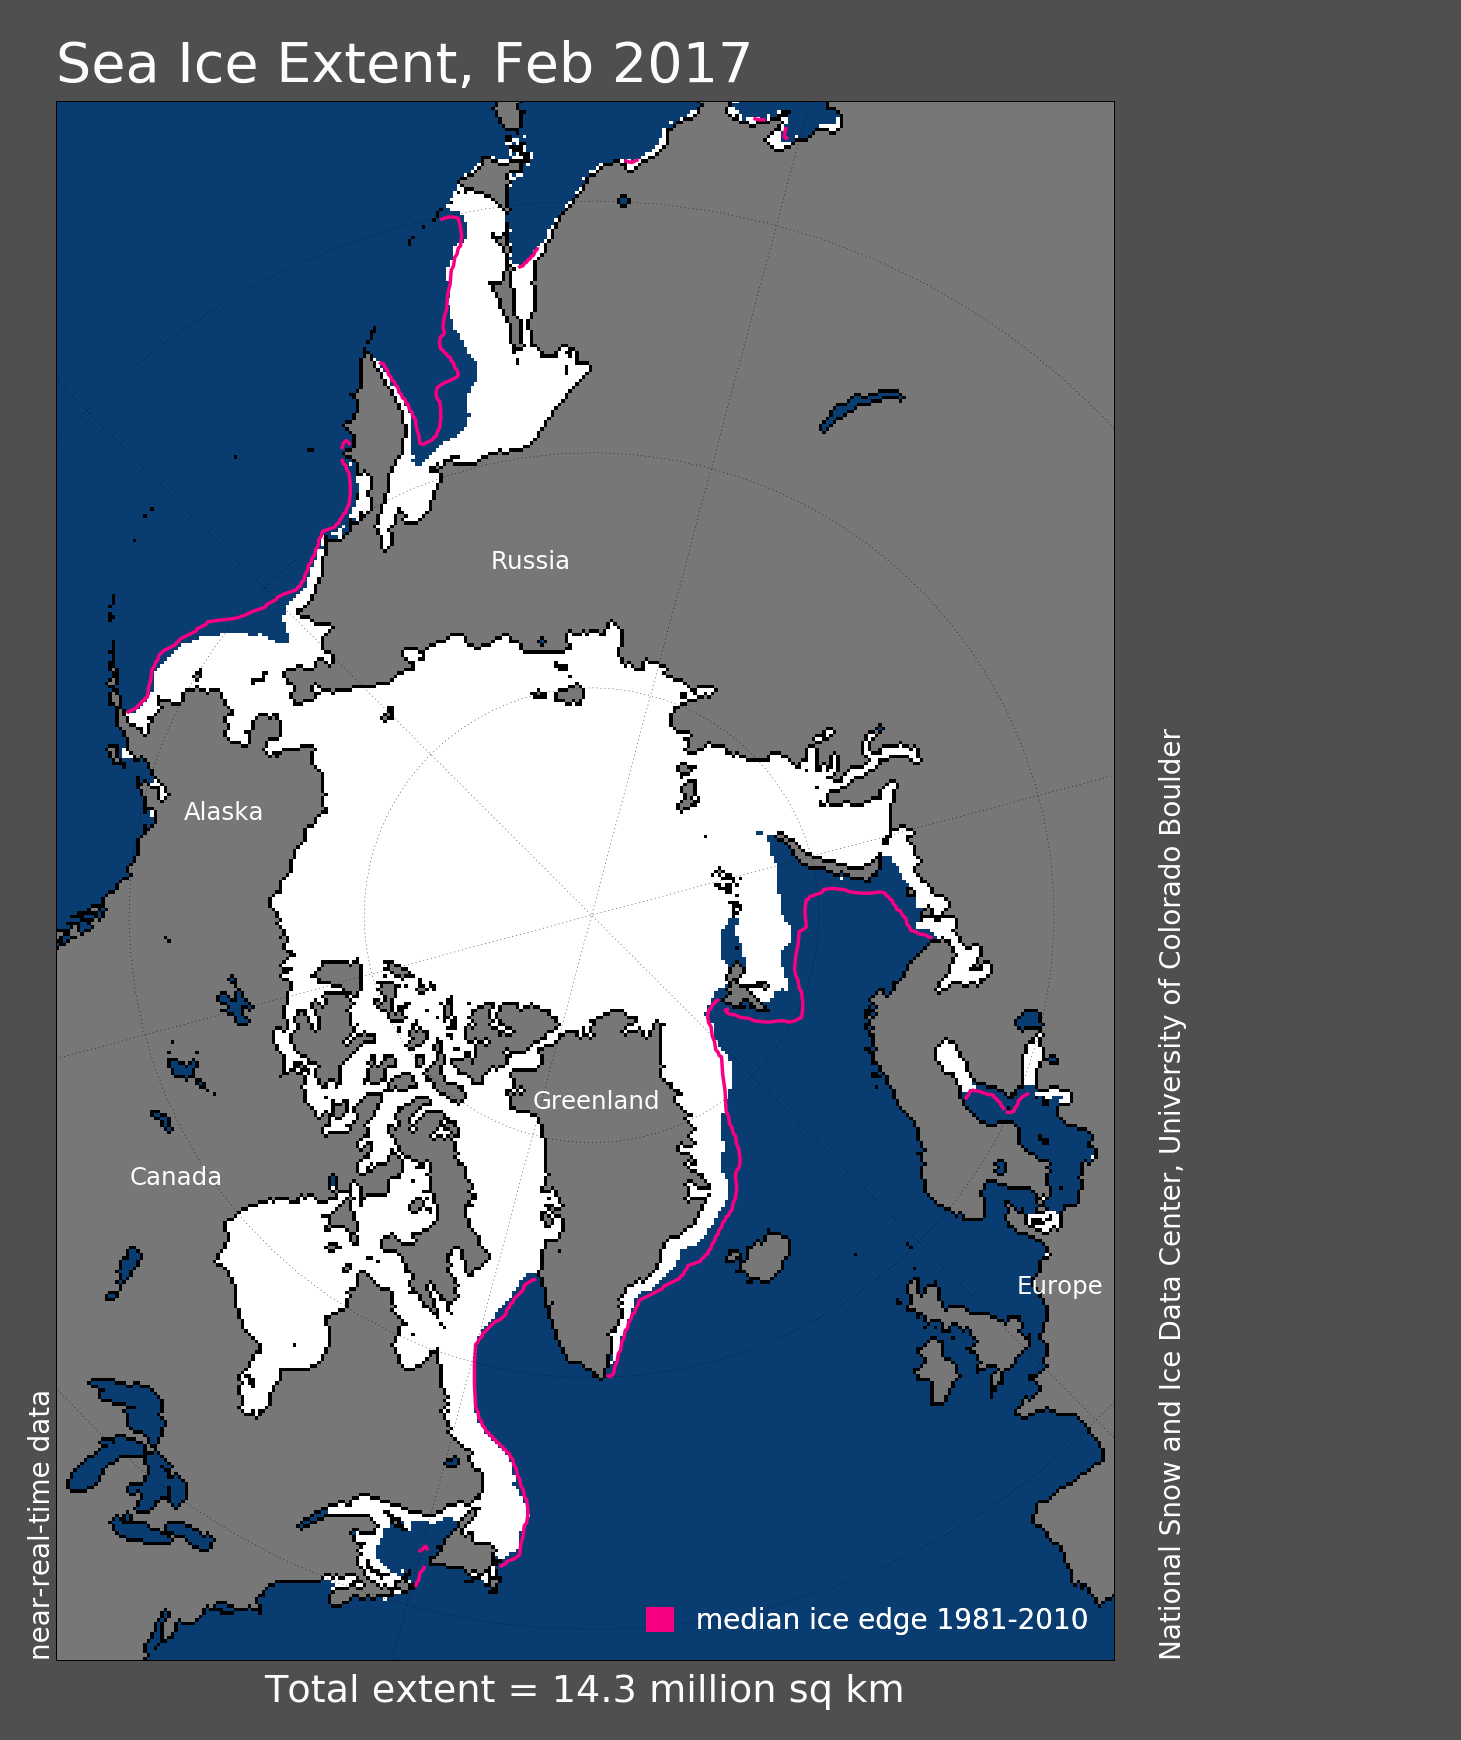
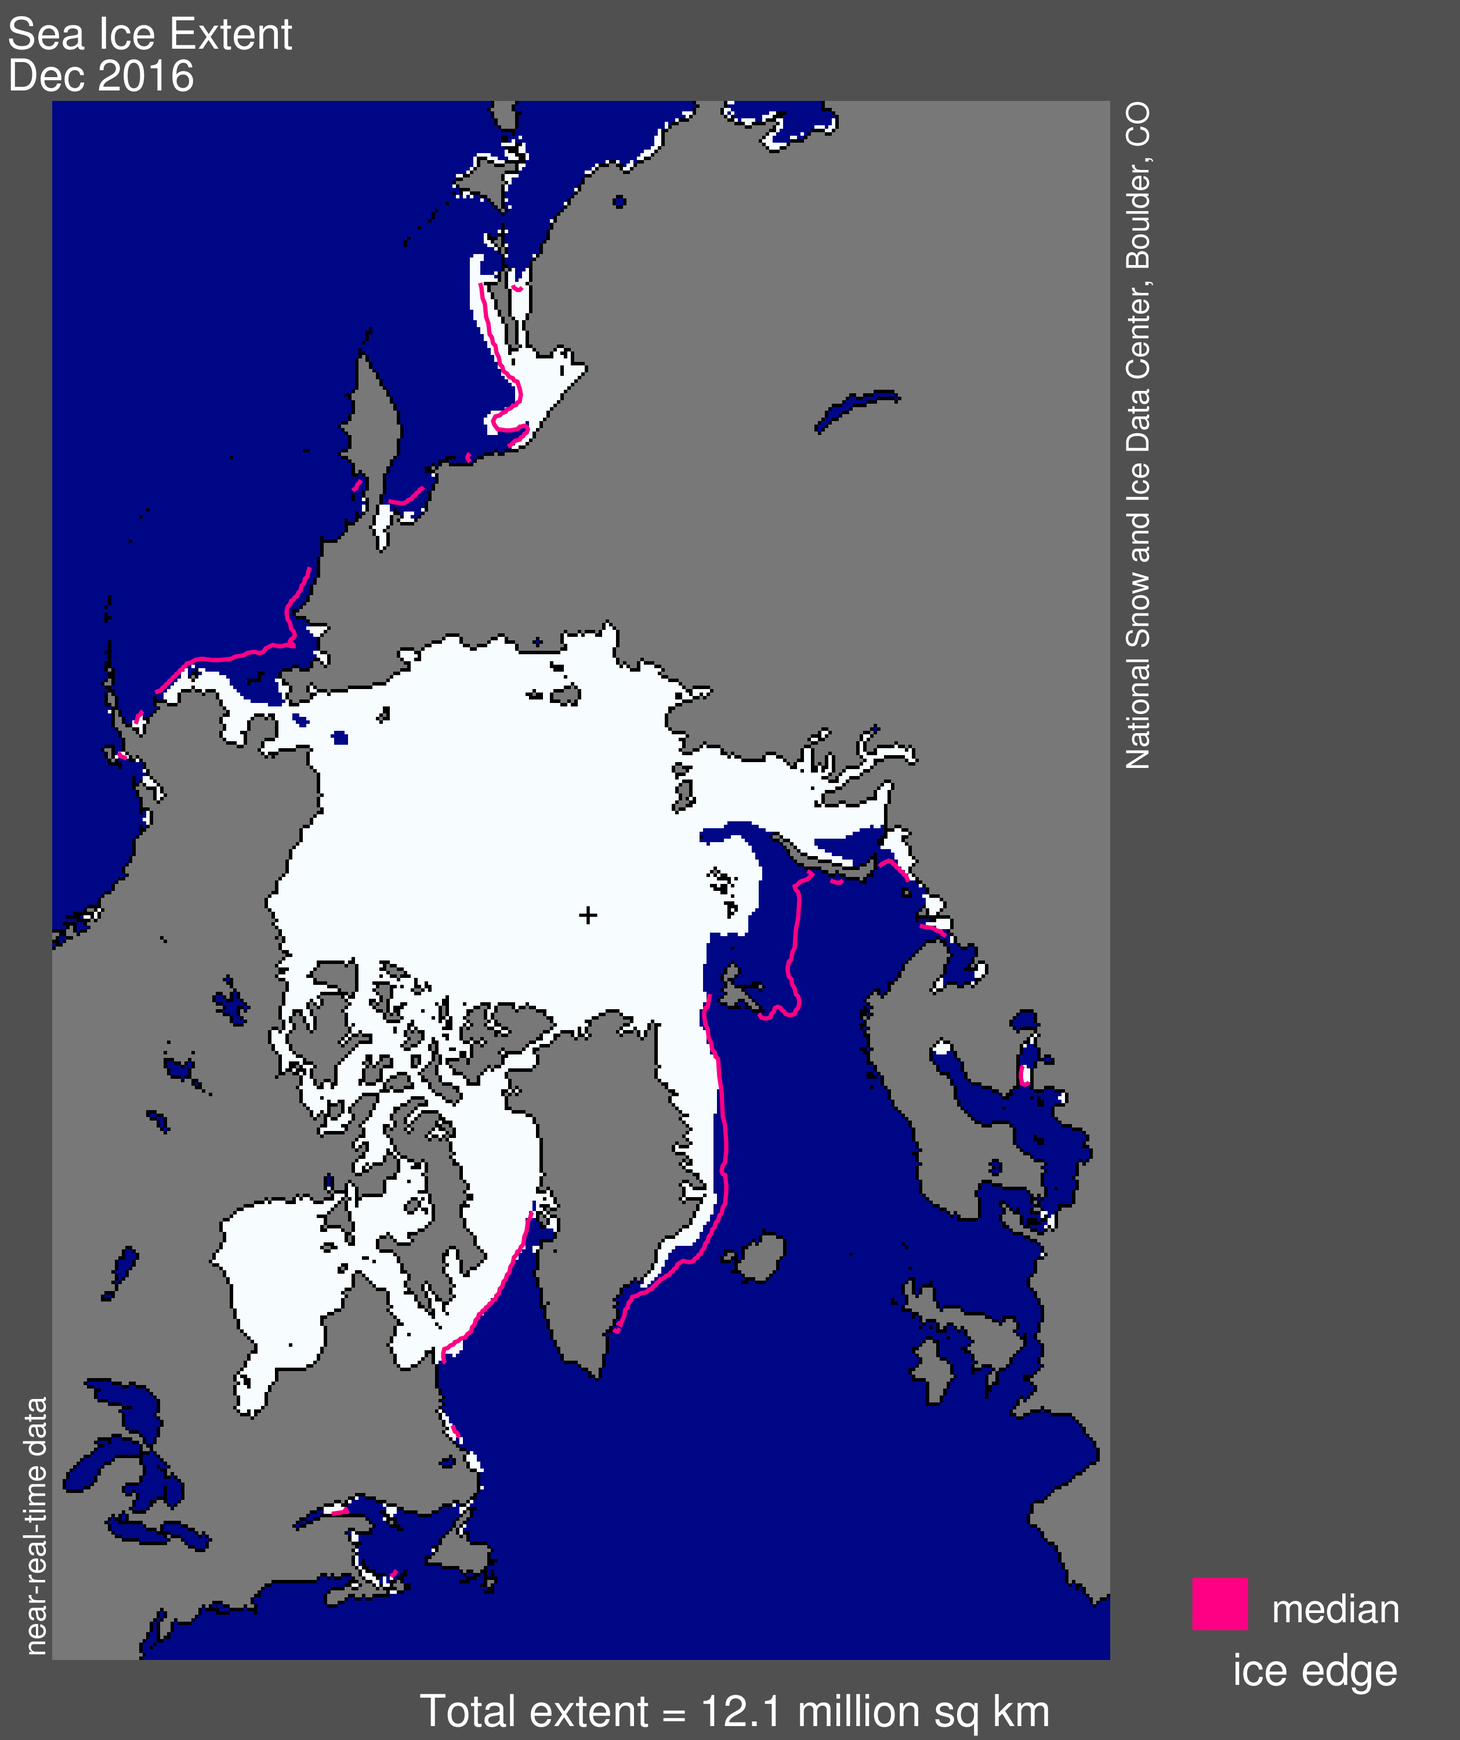
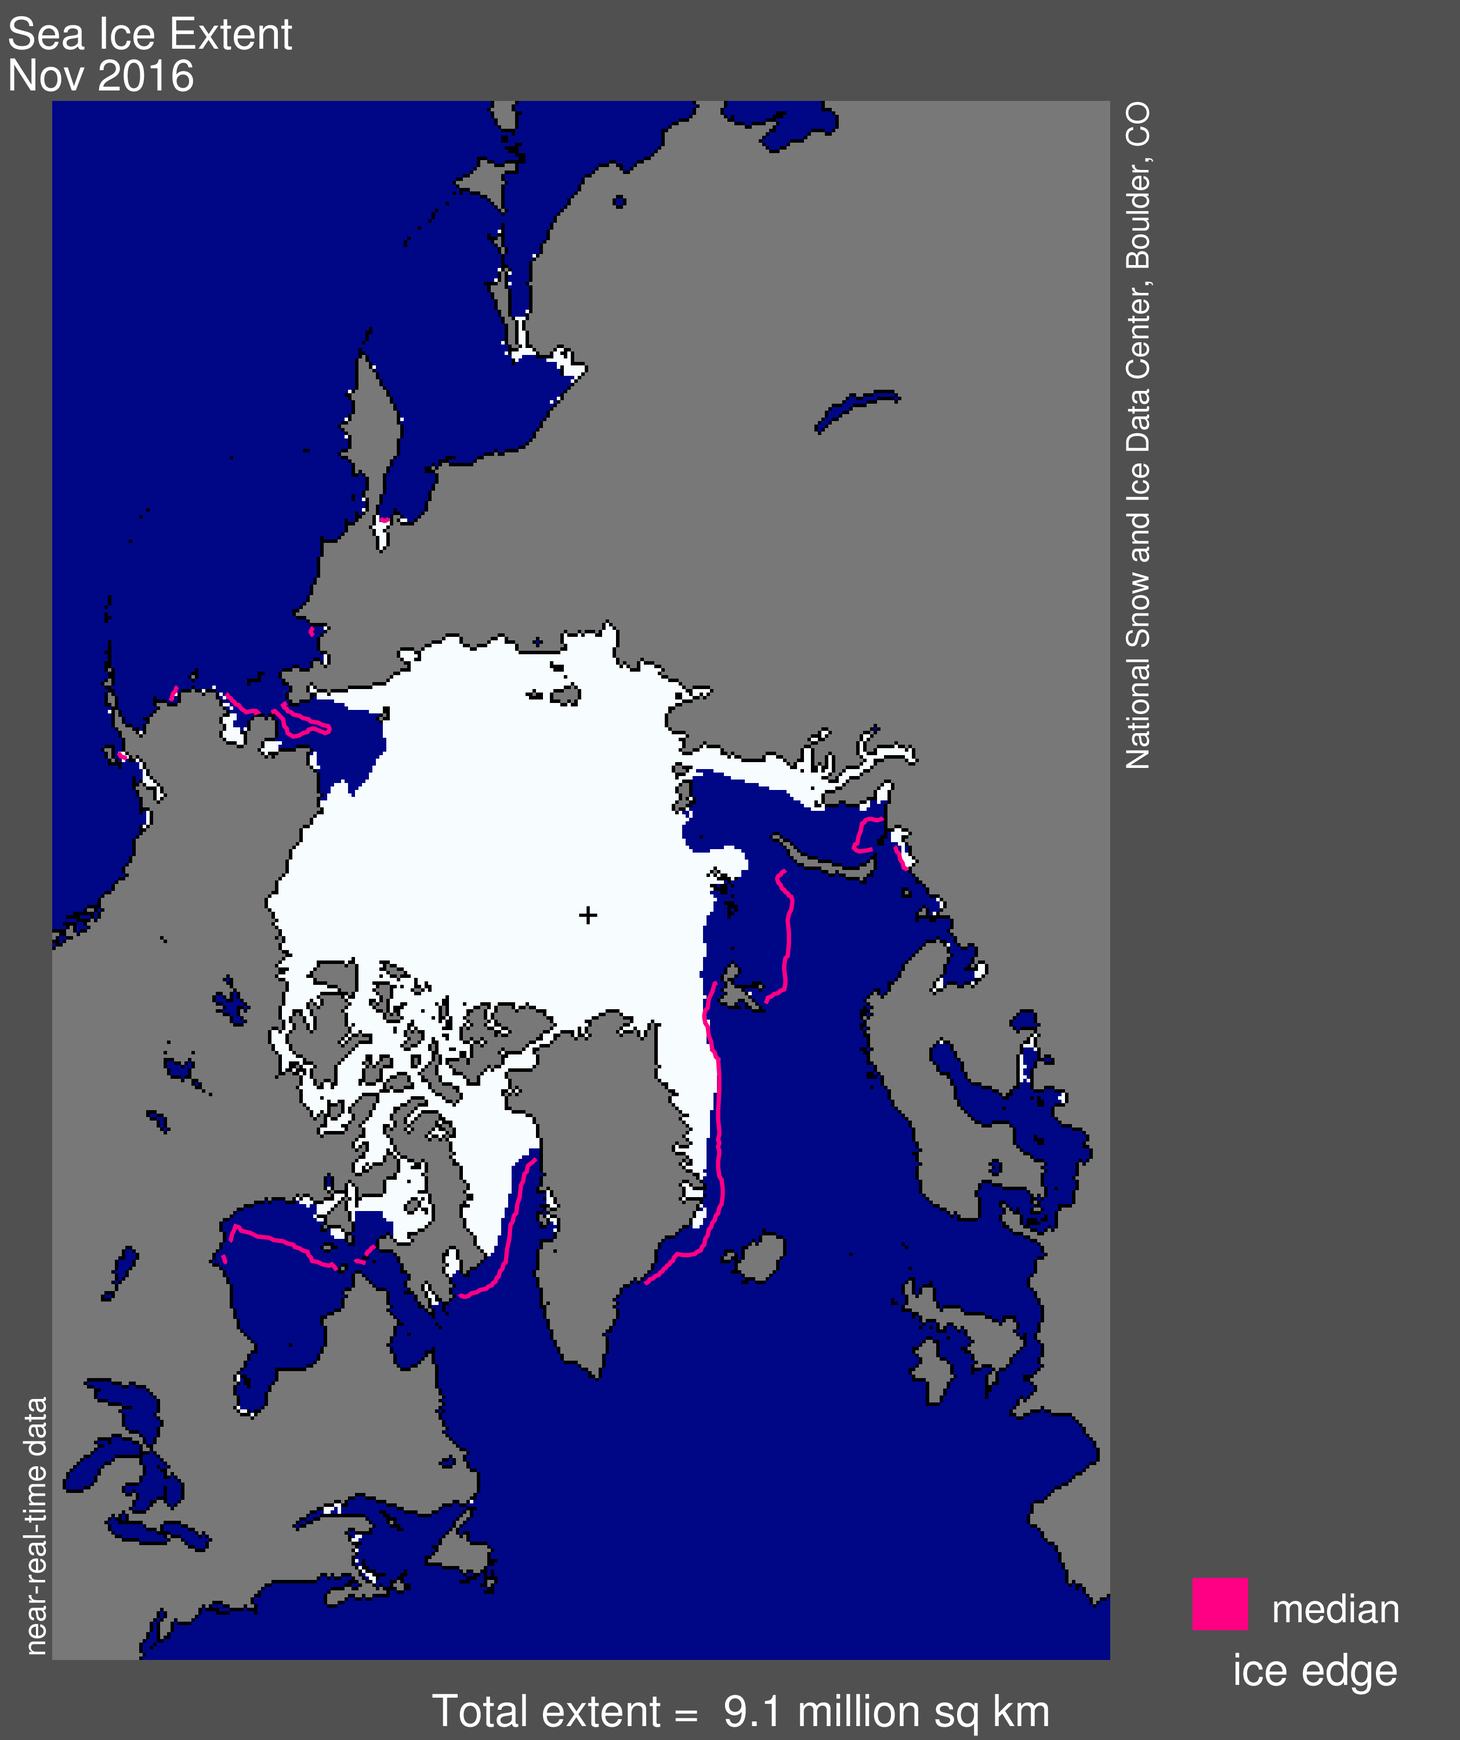
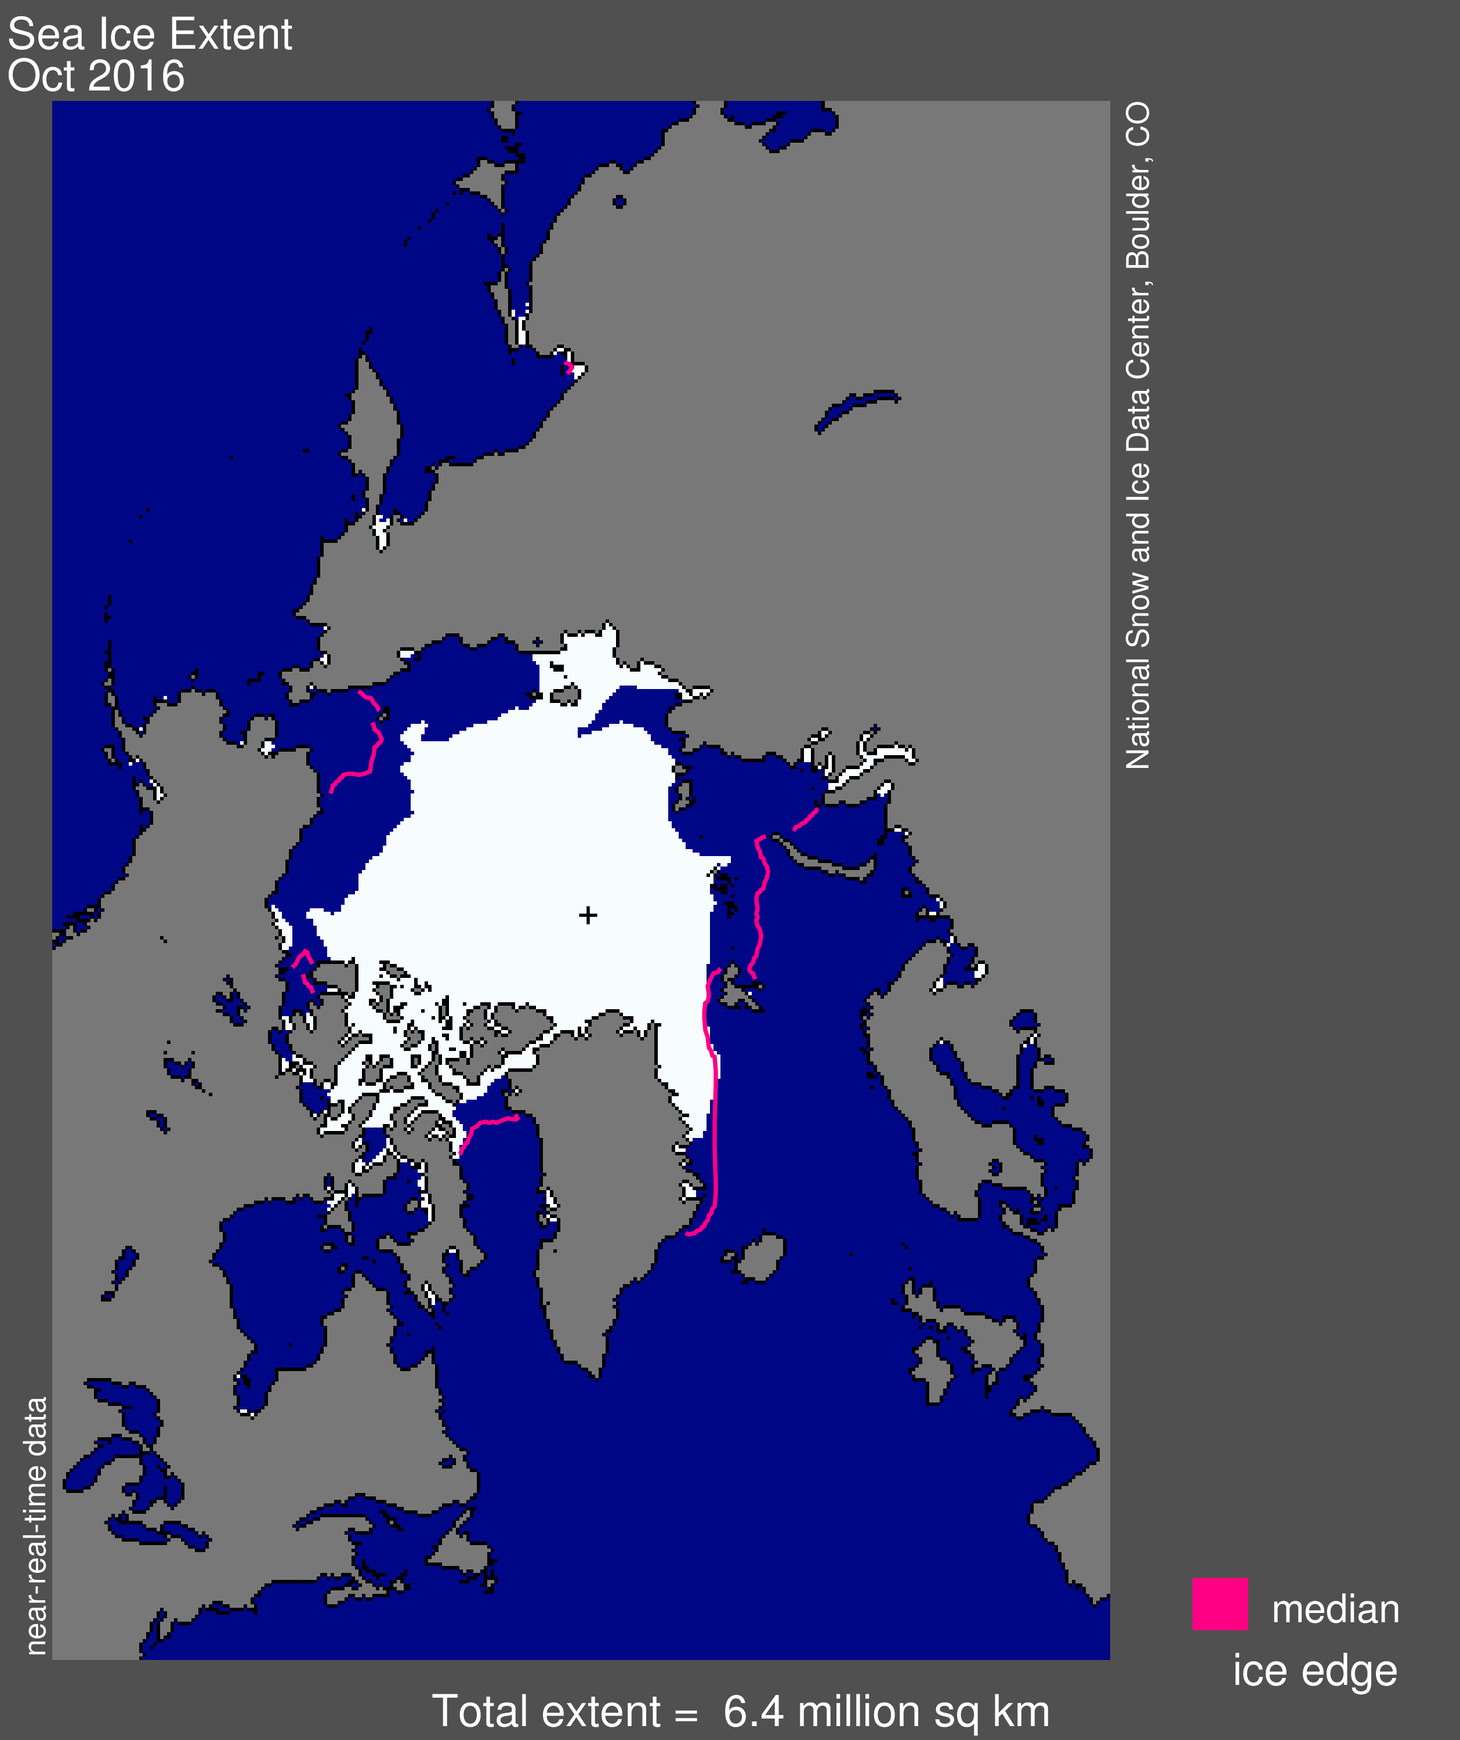
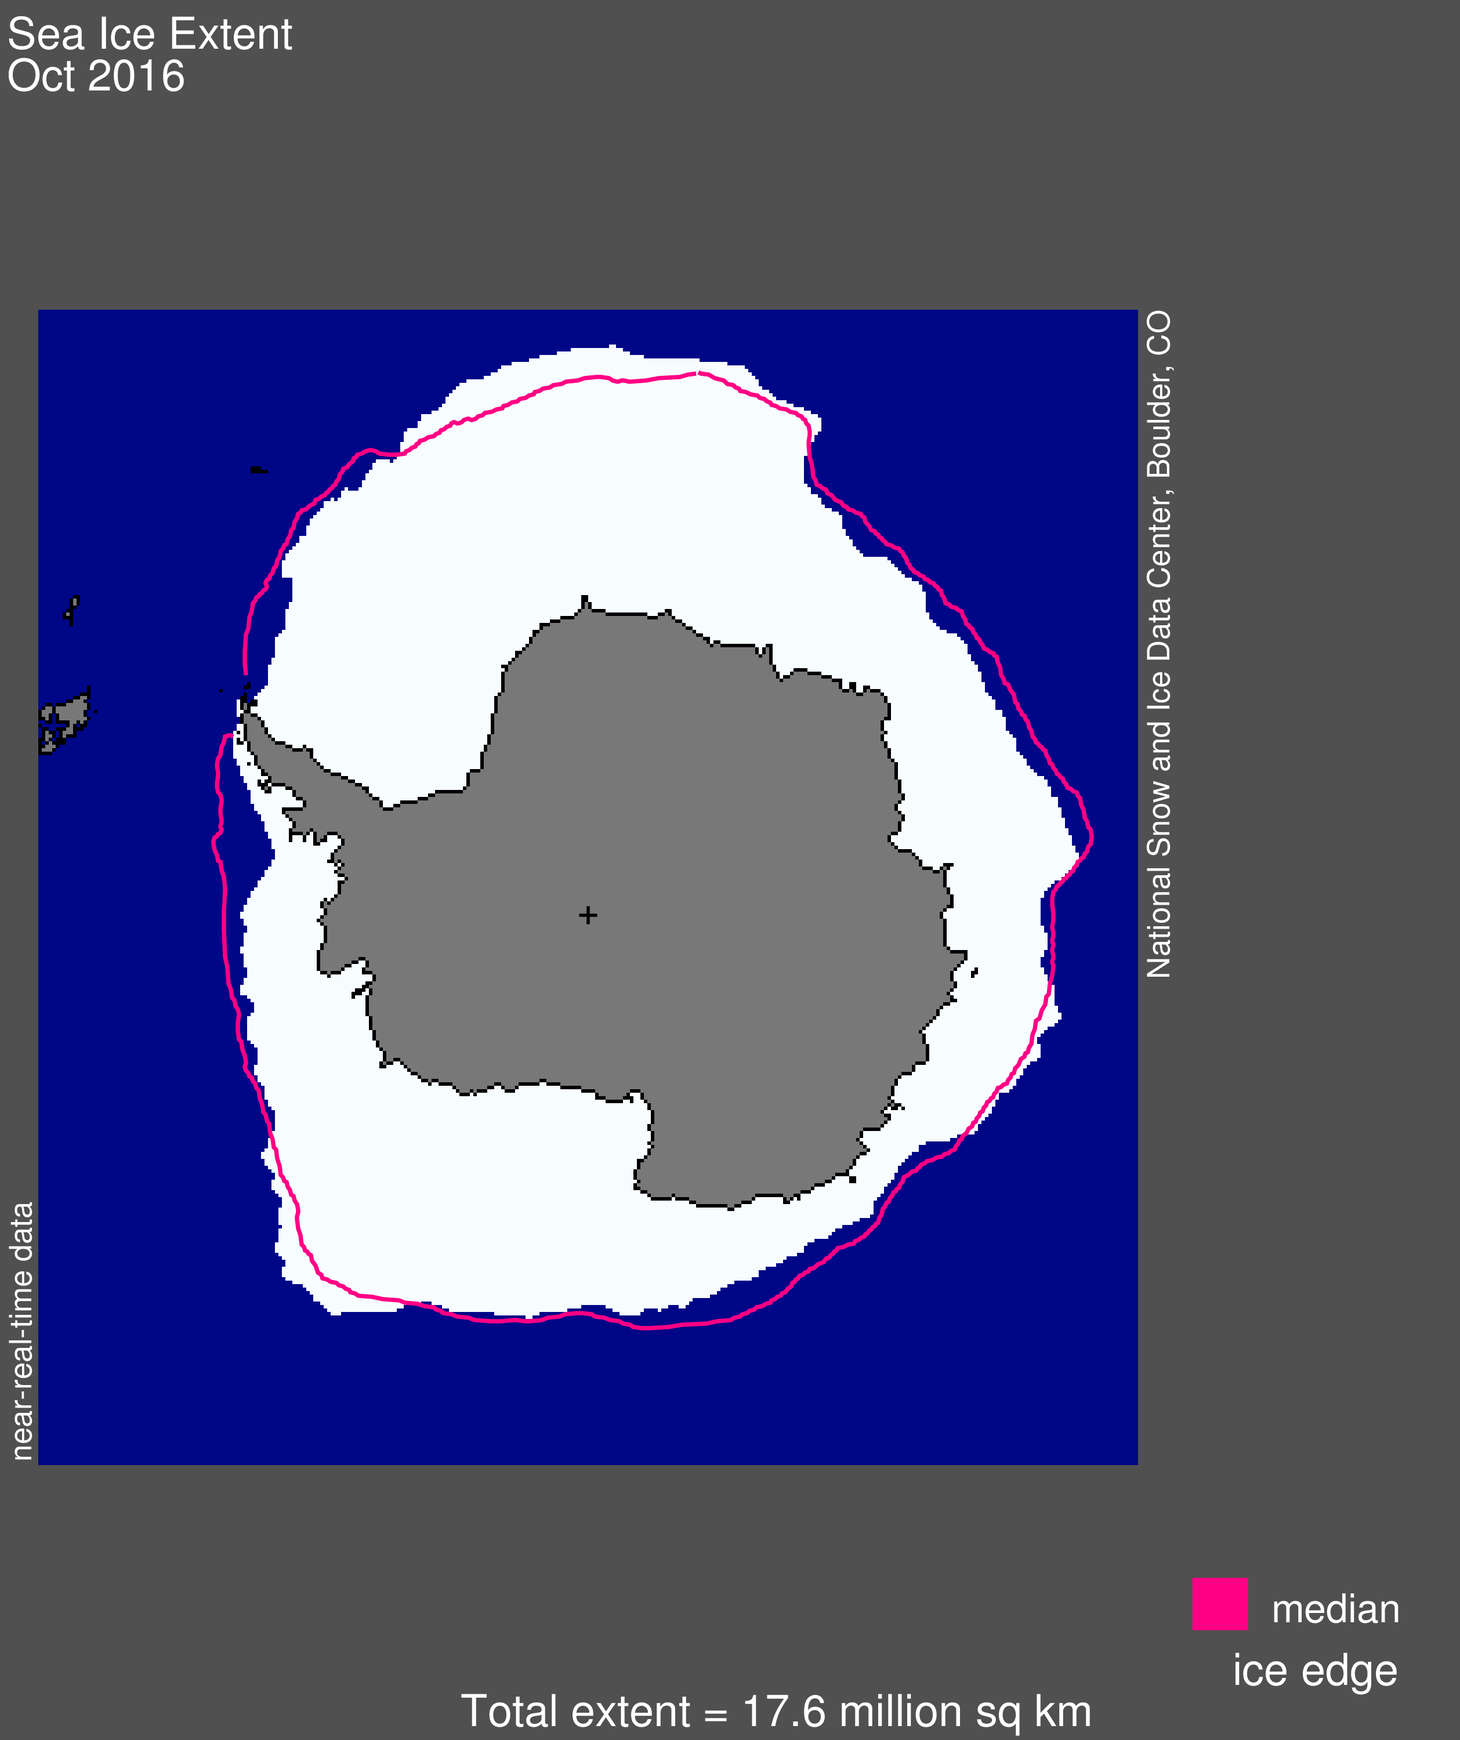
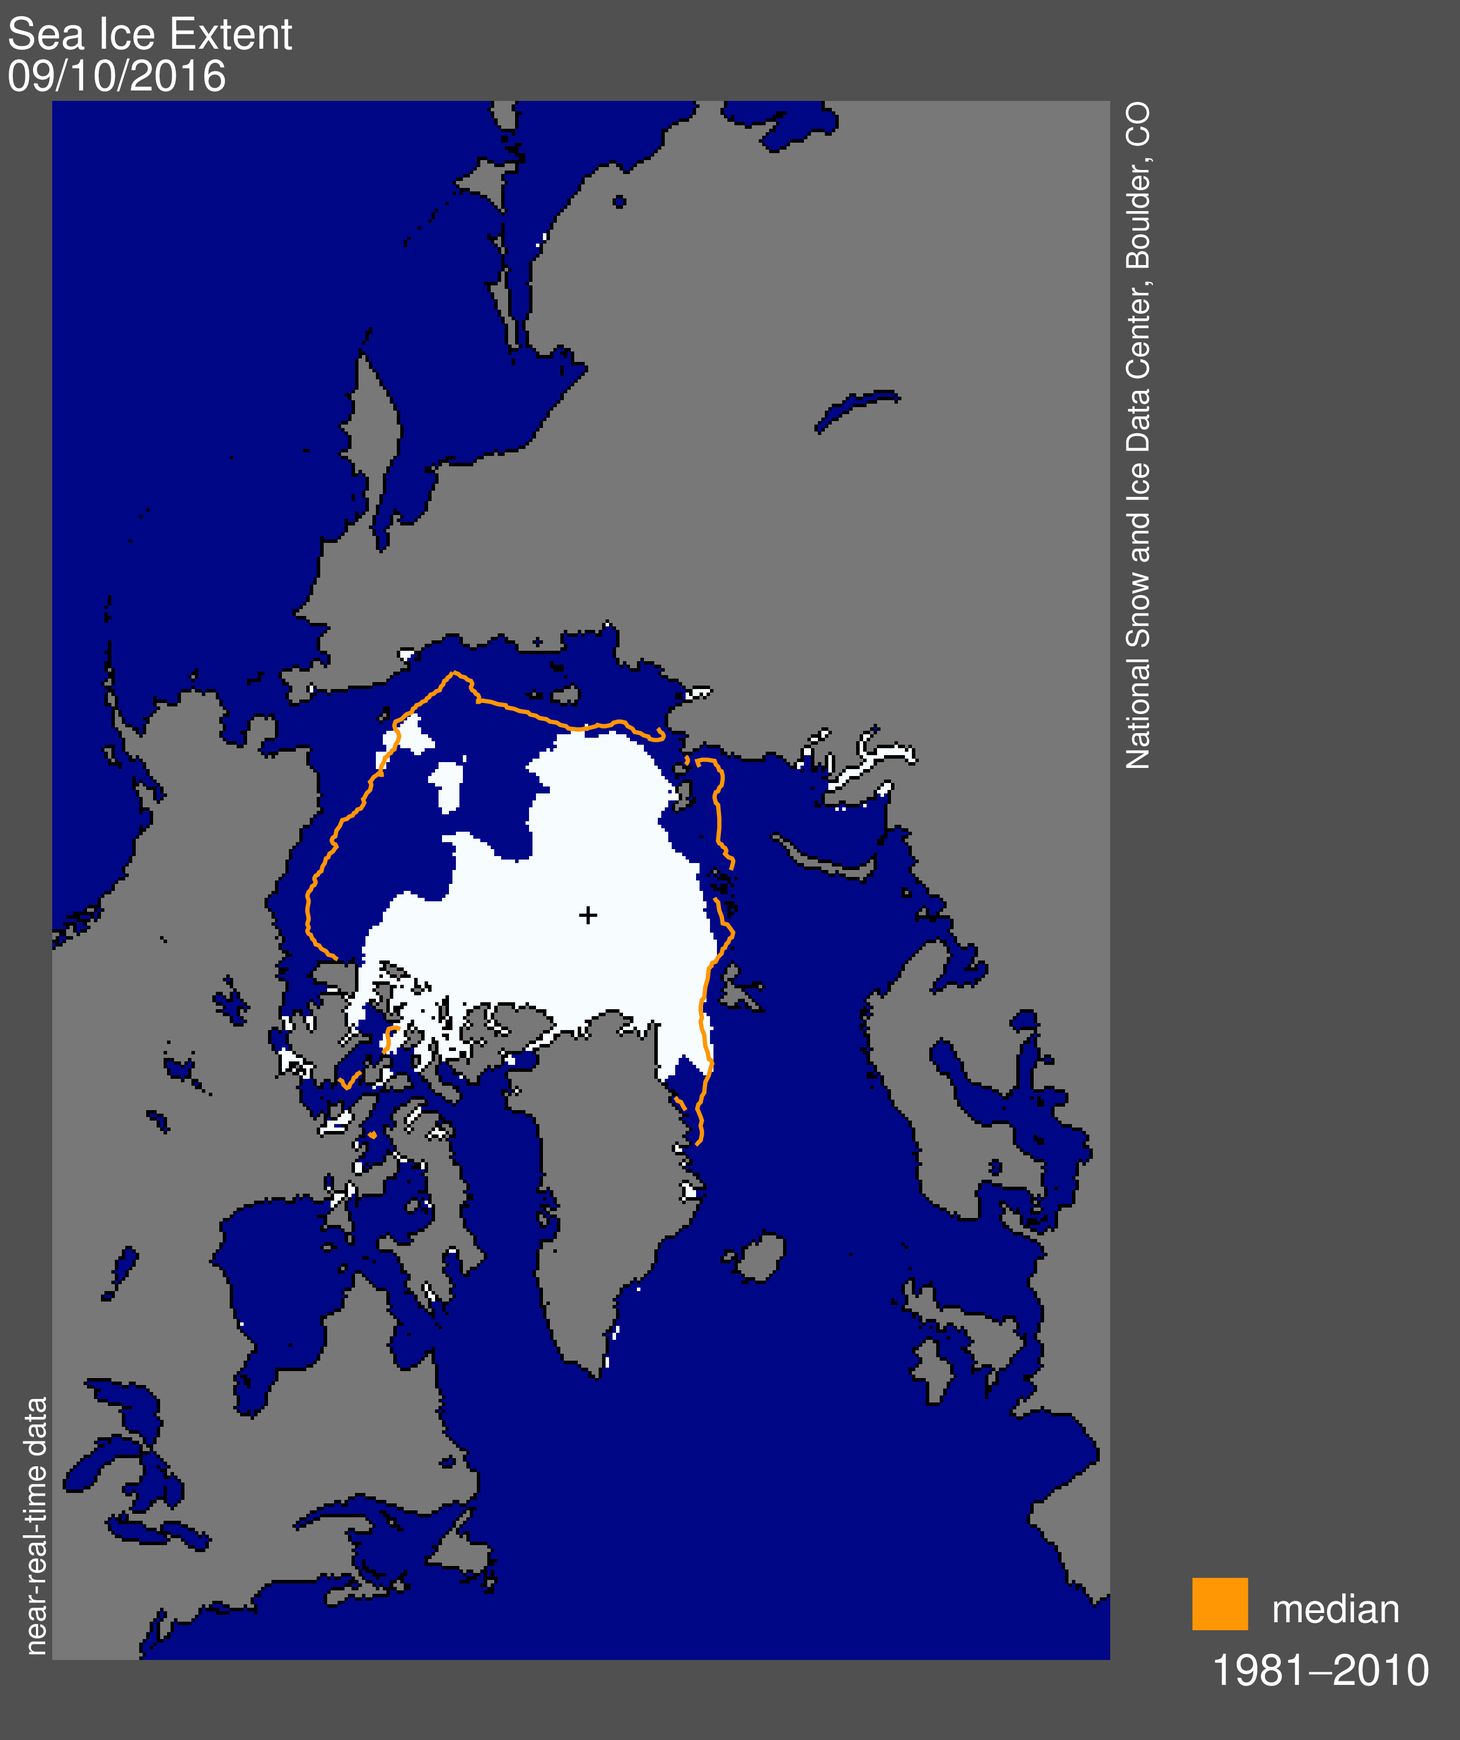
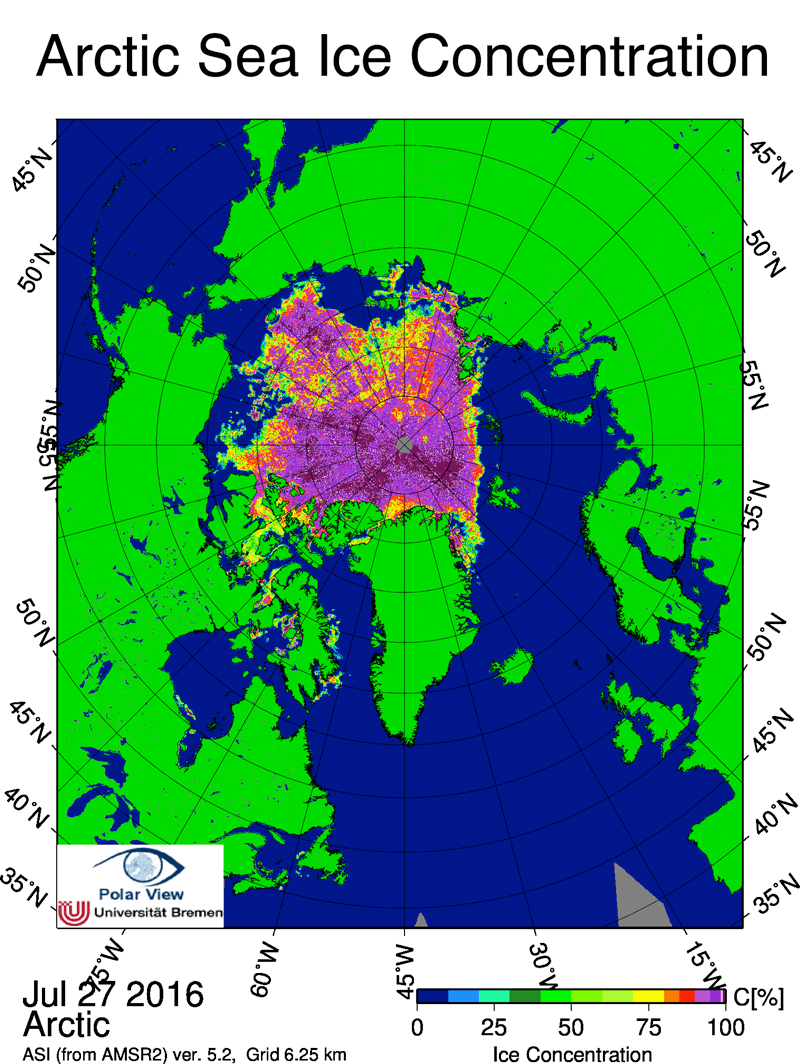
Figure 1. Arctic sea ice extent for November 2016 was 9.08 million square kilometers (3.51 million square miles). The magenta line shows the 1981 to 2010 median extent for the month. The black cross indicates the geographic North Pole. Sea Ice Index data. About the data

Credit: National Snow and Ice Data Center
High-resolution image

In November 2016, Arctic sea ice extent averaged 9.08 million square kilometers (3.51 million square miles), the lowest November in the satellite record. This is 800,000 square kilometers (309,000 square miles) below November 2006, the previous lowest November, and 1.95 million square kilometers (753,000 square miles) below the 1981 to 2010 long-term average for November. For the month, ice extent was 3.2 standard deviations below the long-term average, a larger departure than observed in September 2012 when the Arctic summer minimum extent hit a record low.

At this time of year, air temperatures near the surface of the Arctic Ocean are generally well below freezing, but this year has seen exceptional warmth. The overall rate of ice growth this November was 88,000 square kilometers (34,000 square miles) per day, a bit faster than the long-term average of 69,600 square kilometers (26,900 square miles) per day. However, for a brief period in the middle the month, total extent actually decreased by 50,000 square kilometers, or 19,300 square miles—an almost unprecedented occurrence for November over the period of satellite observations. A less pronounced and brief retreat of 14,000 square kilometers (5,400 square miles) occurred in 2013.

Ice growth during November as a whole occurred primarily within the Beaufort, Chukchi and East Siberian Seas, as well as within Baffin Bay. Ice extent slightly retreated in the Barents Sea for the month. Compared to the previous record low for the month set in 2006, sea ice was less extensive in the Kara, Barents, East Greenland, and Chukchi Seas, and more extensive in Baffin Bay this year.

Conditions in context

sea ice extent plot

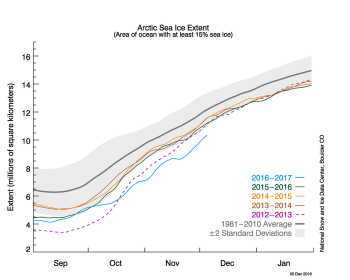
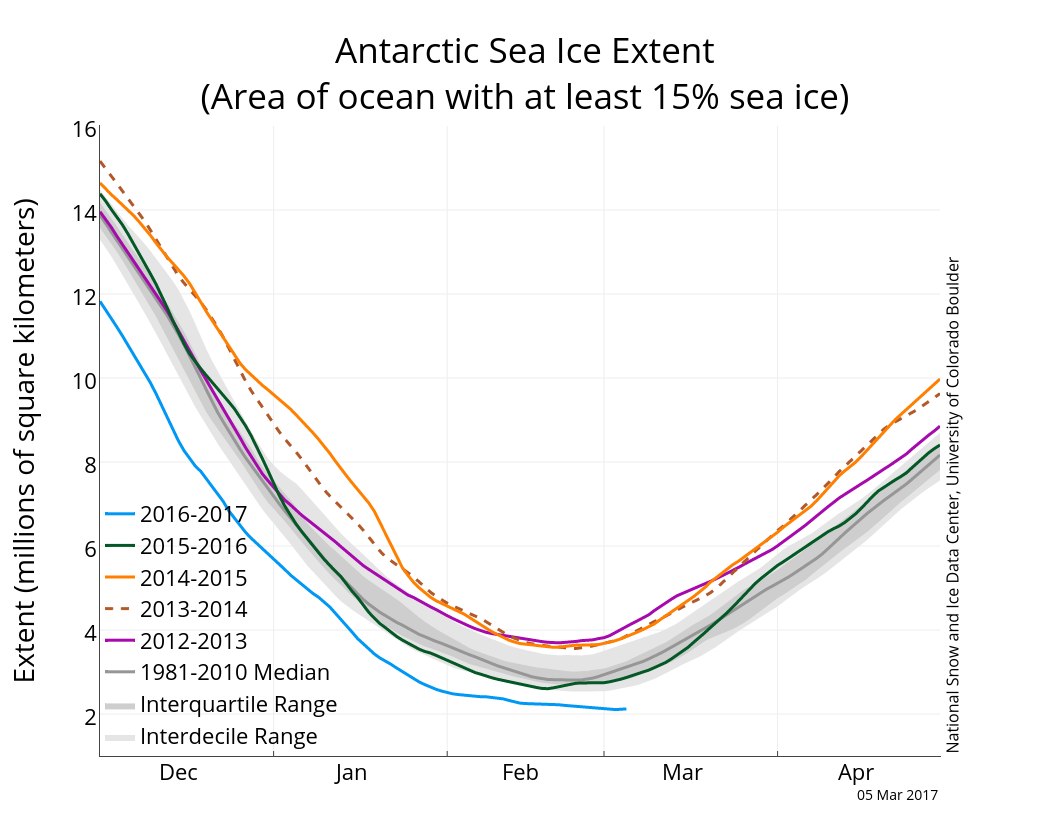
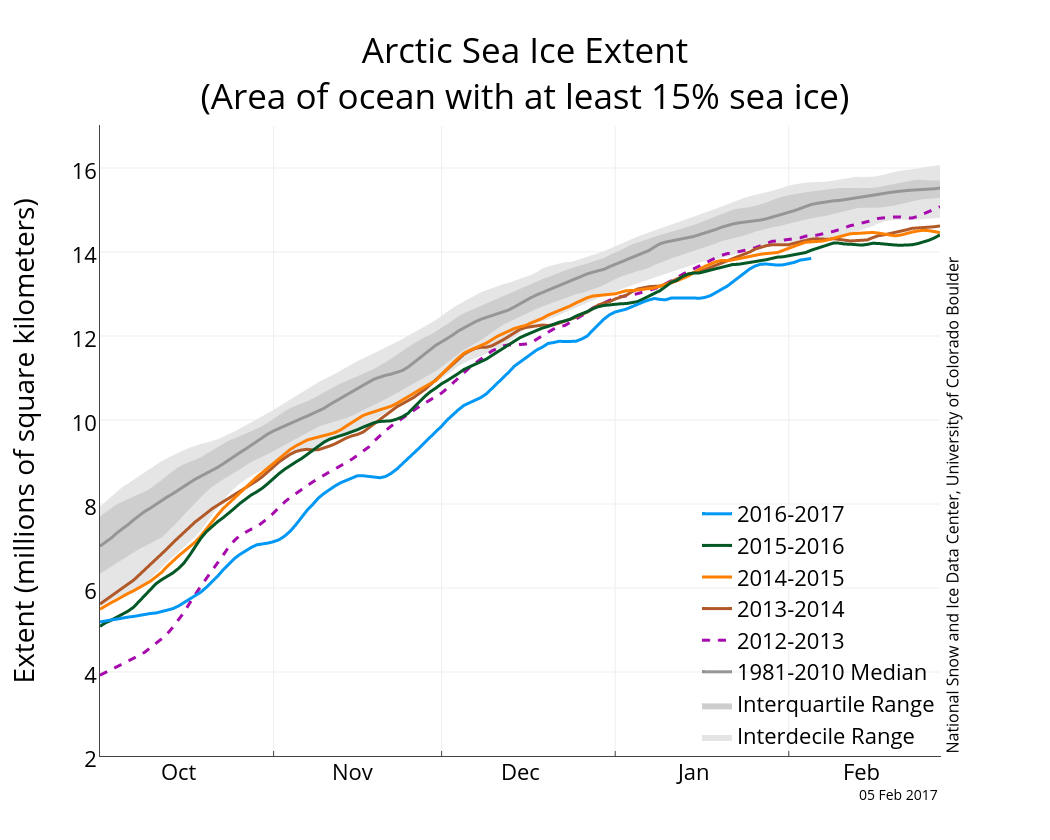
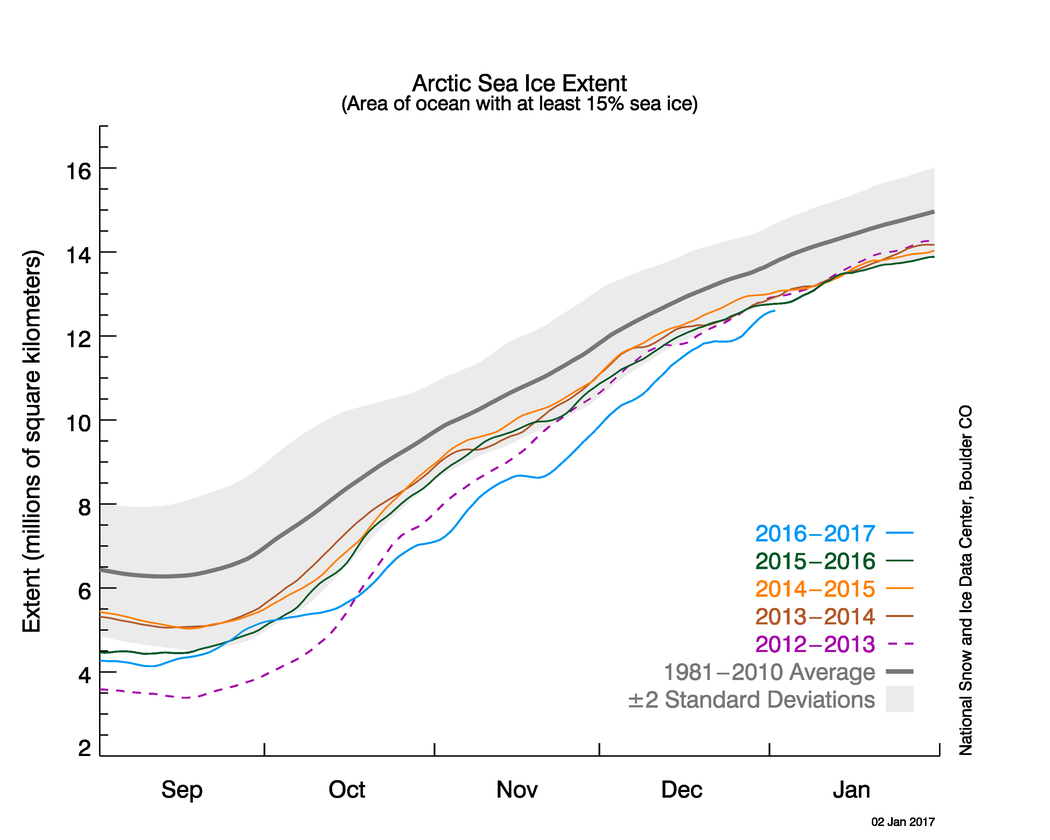
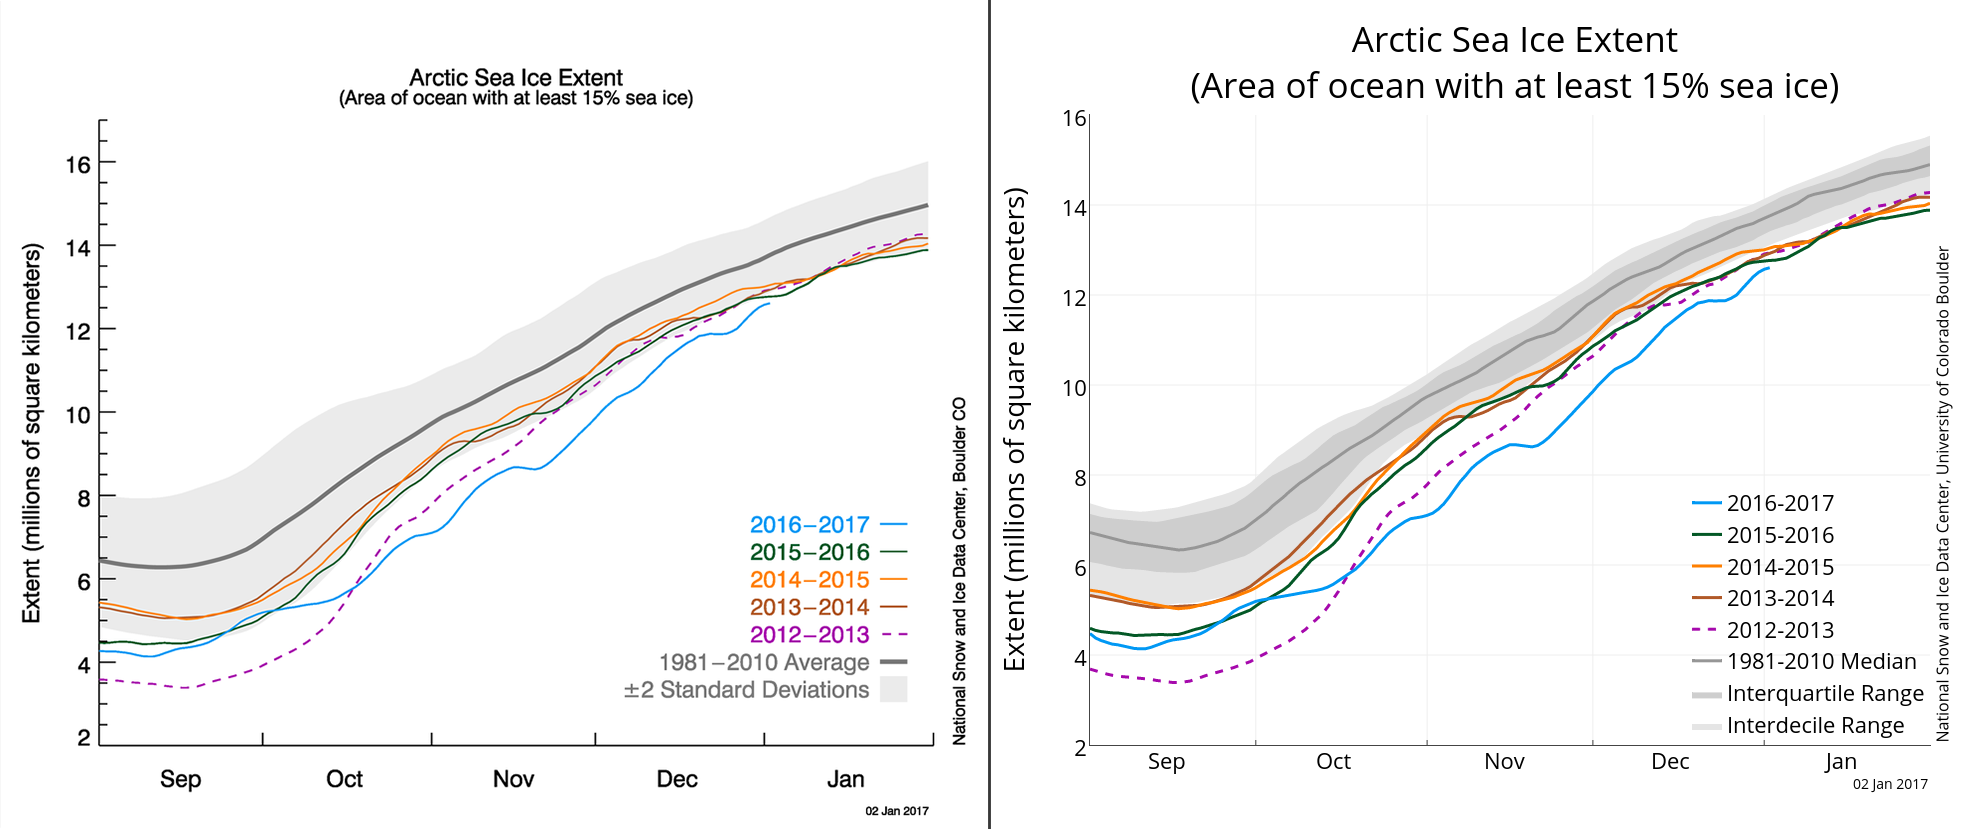
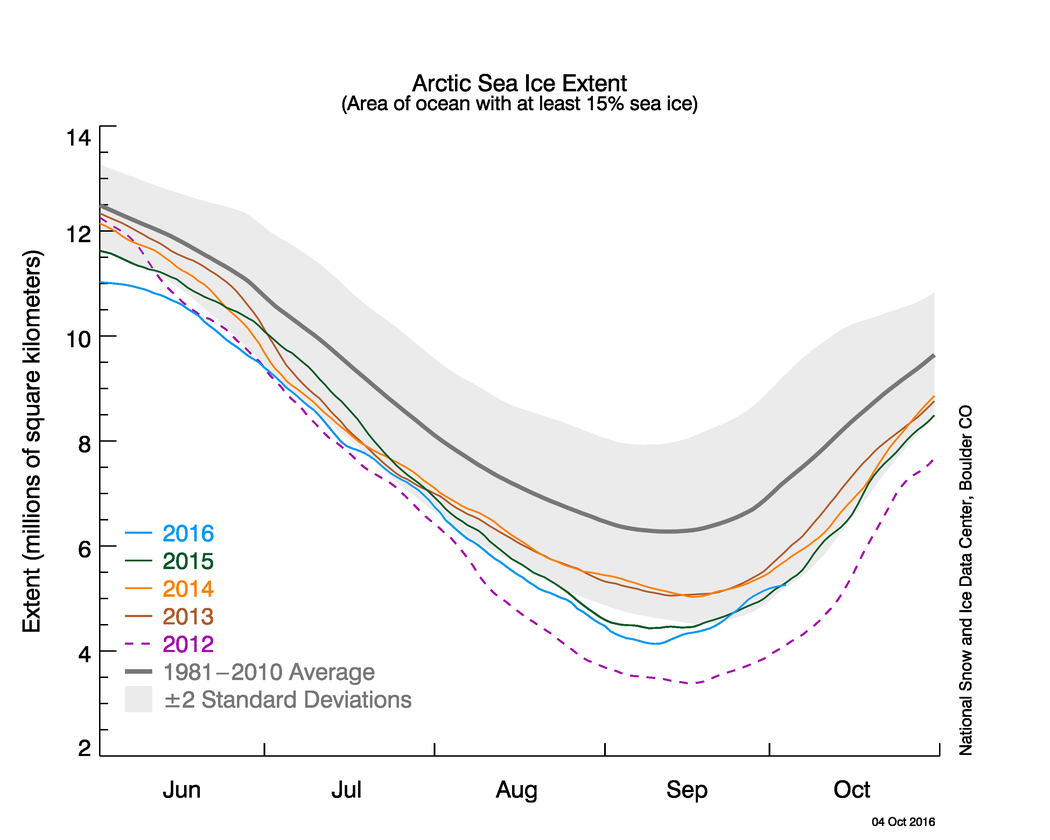
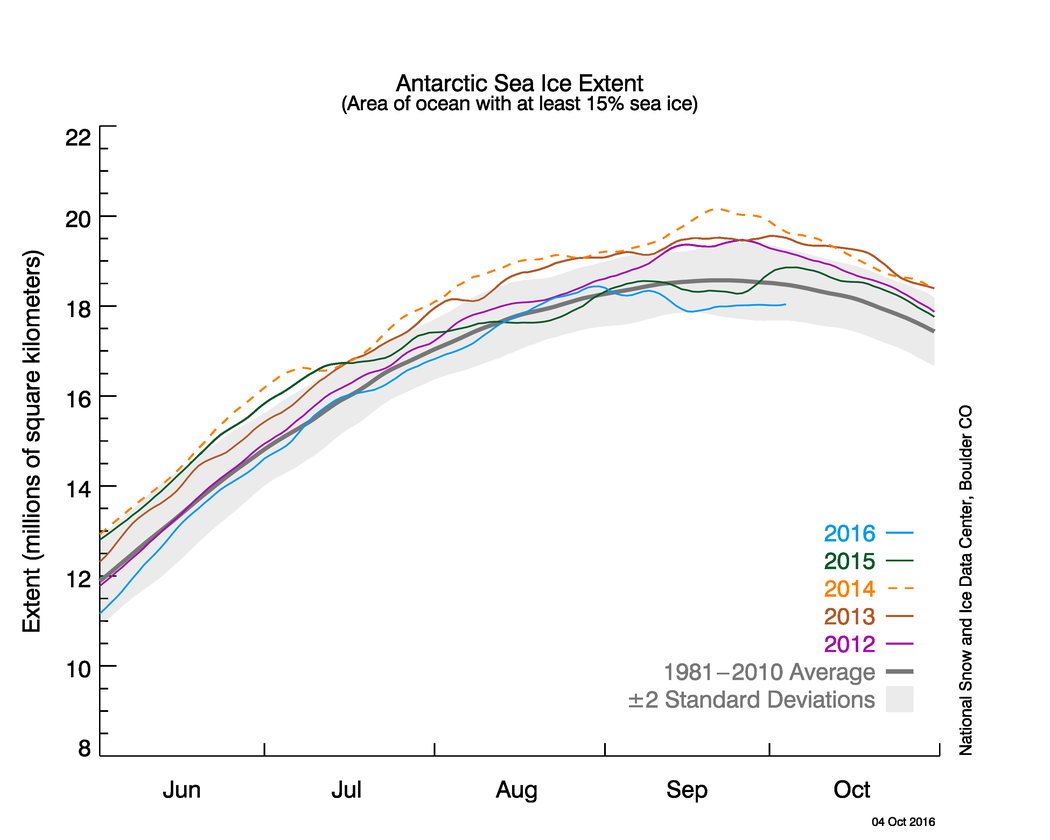
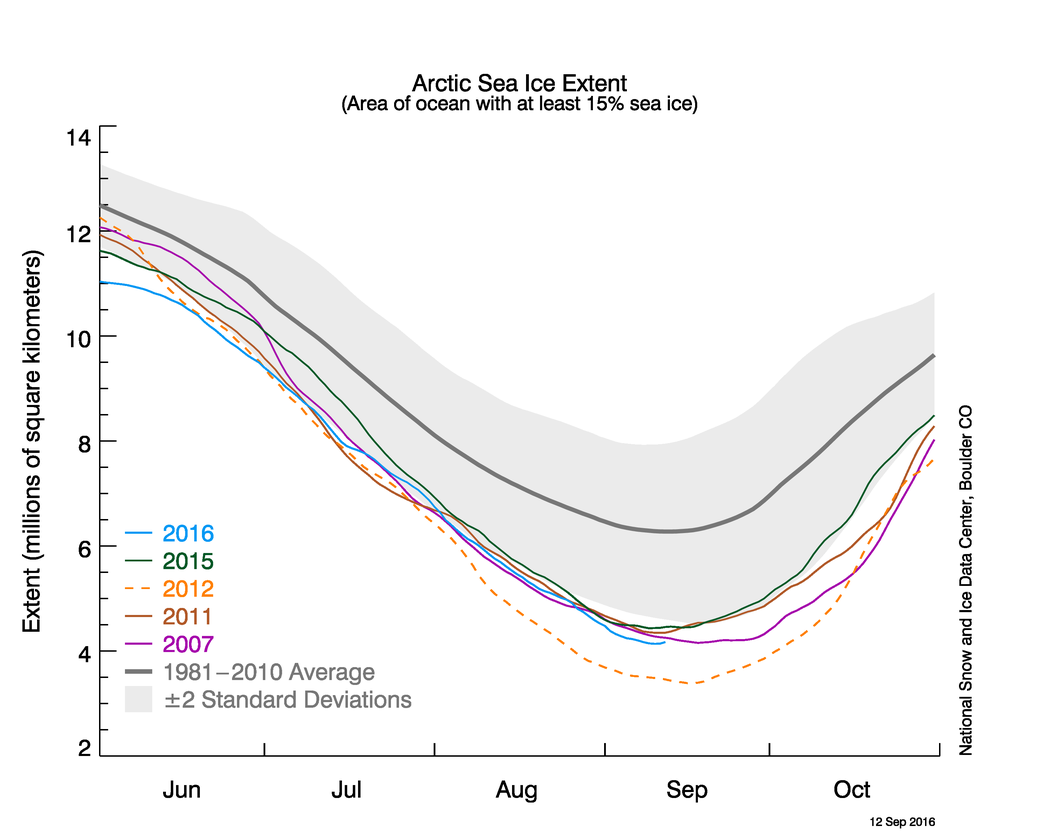
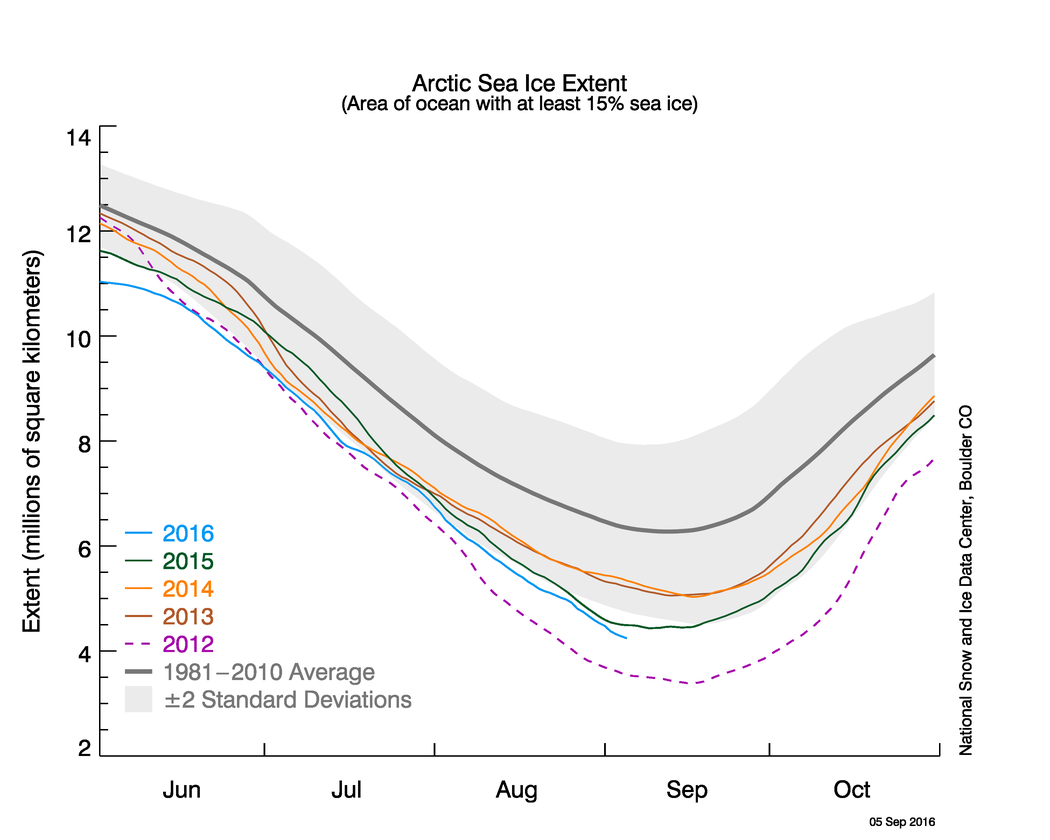
Figure 2a. The graph above shows daily Arctic sea ice extent as of December 5, 2016, along with daily ice extent data for four previous years. 2016 is shown in blue, 2015 in green, 2014 in orange, 2013 in brown, and 2012 in purple. The 1981 to 2010 average is in dark gray. The gray area around the average line shows the two standard deviation range of the data. Sea Ice Index data.

Credit: National Snow and Ice Data Center
High-resolution image

air temperature plot

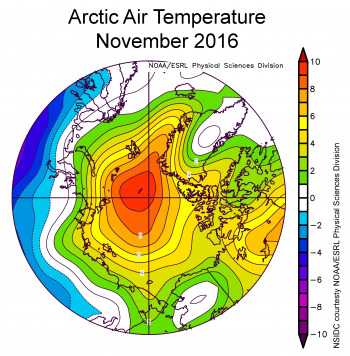
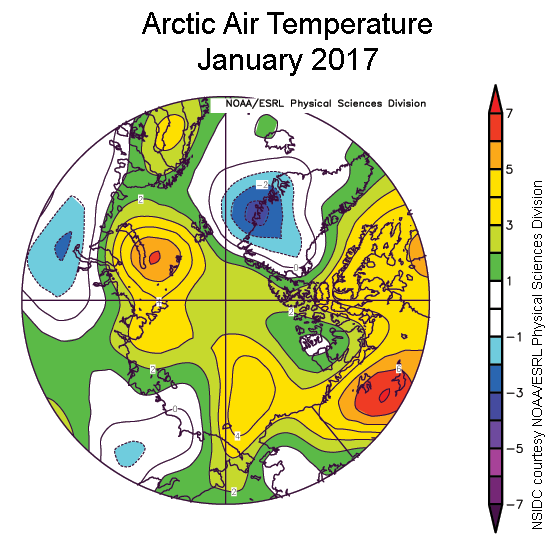
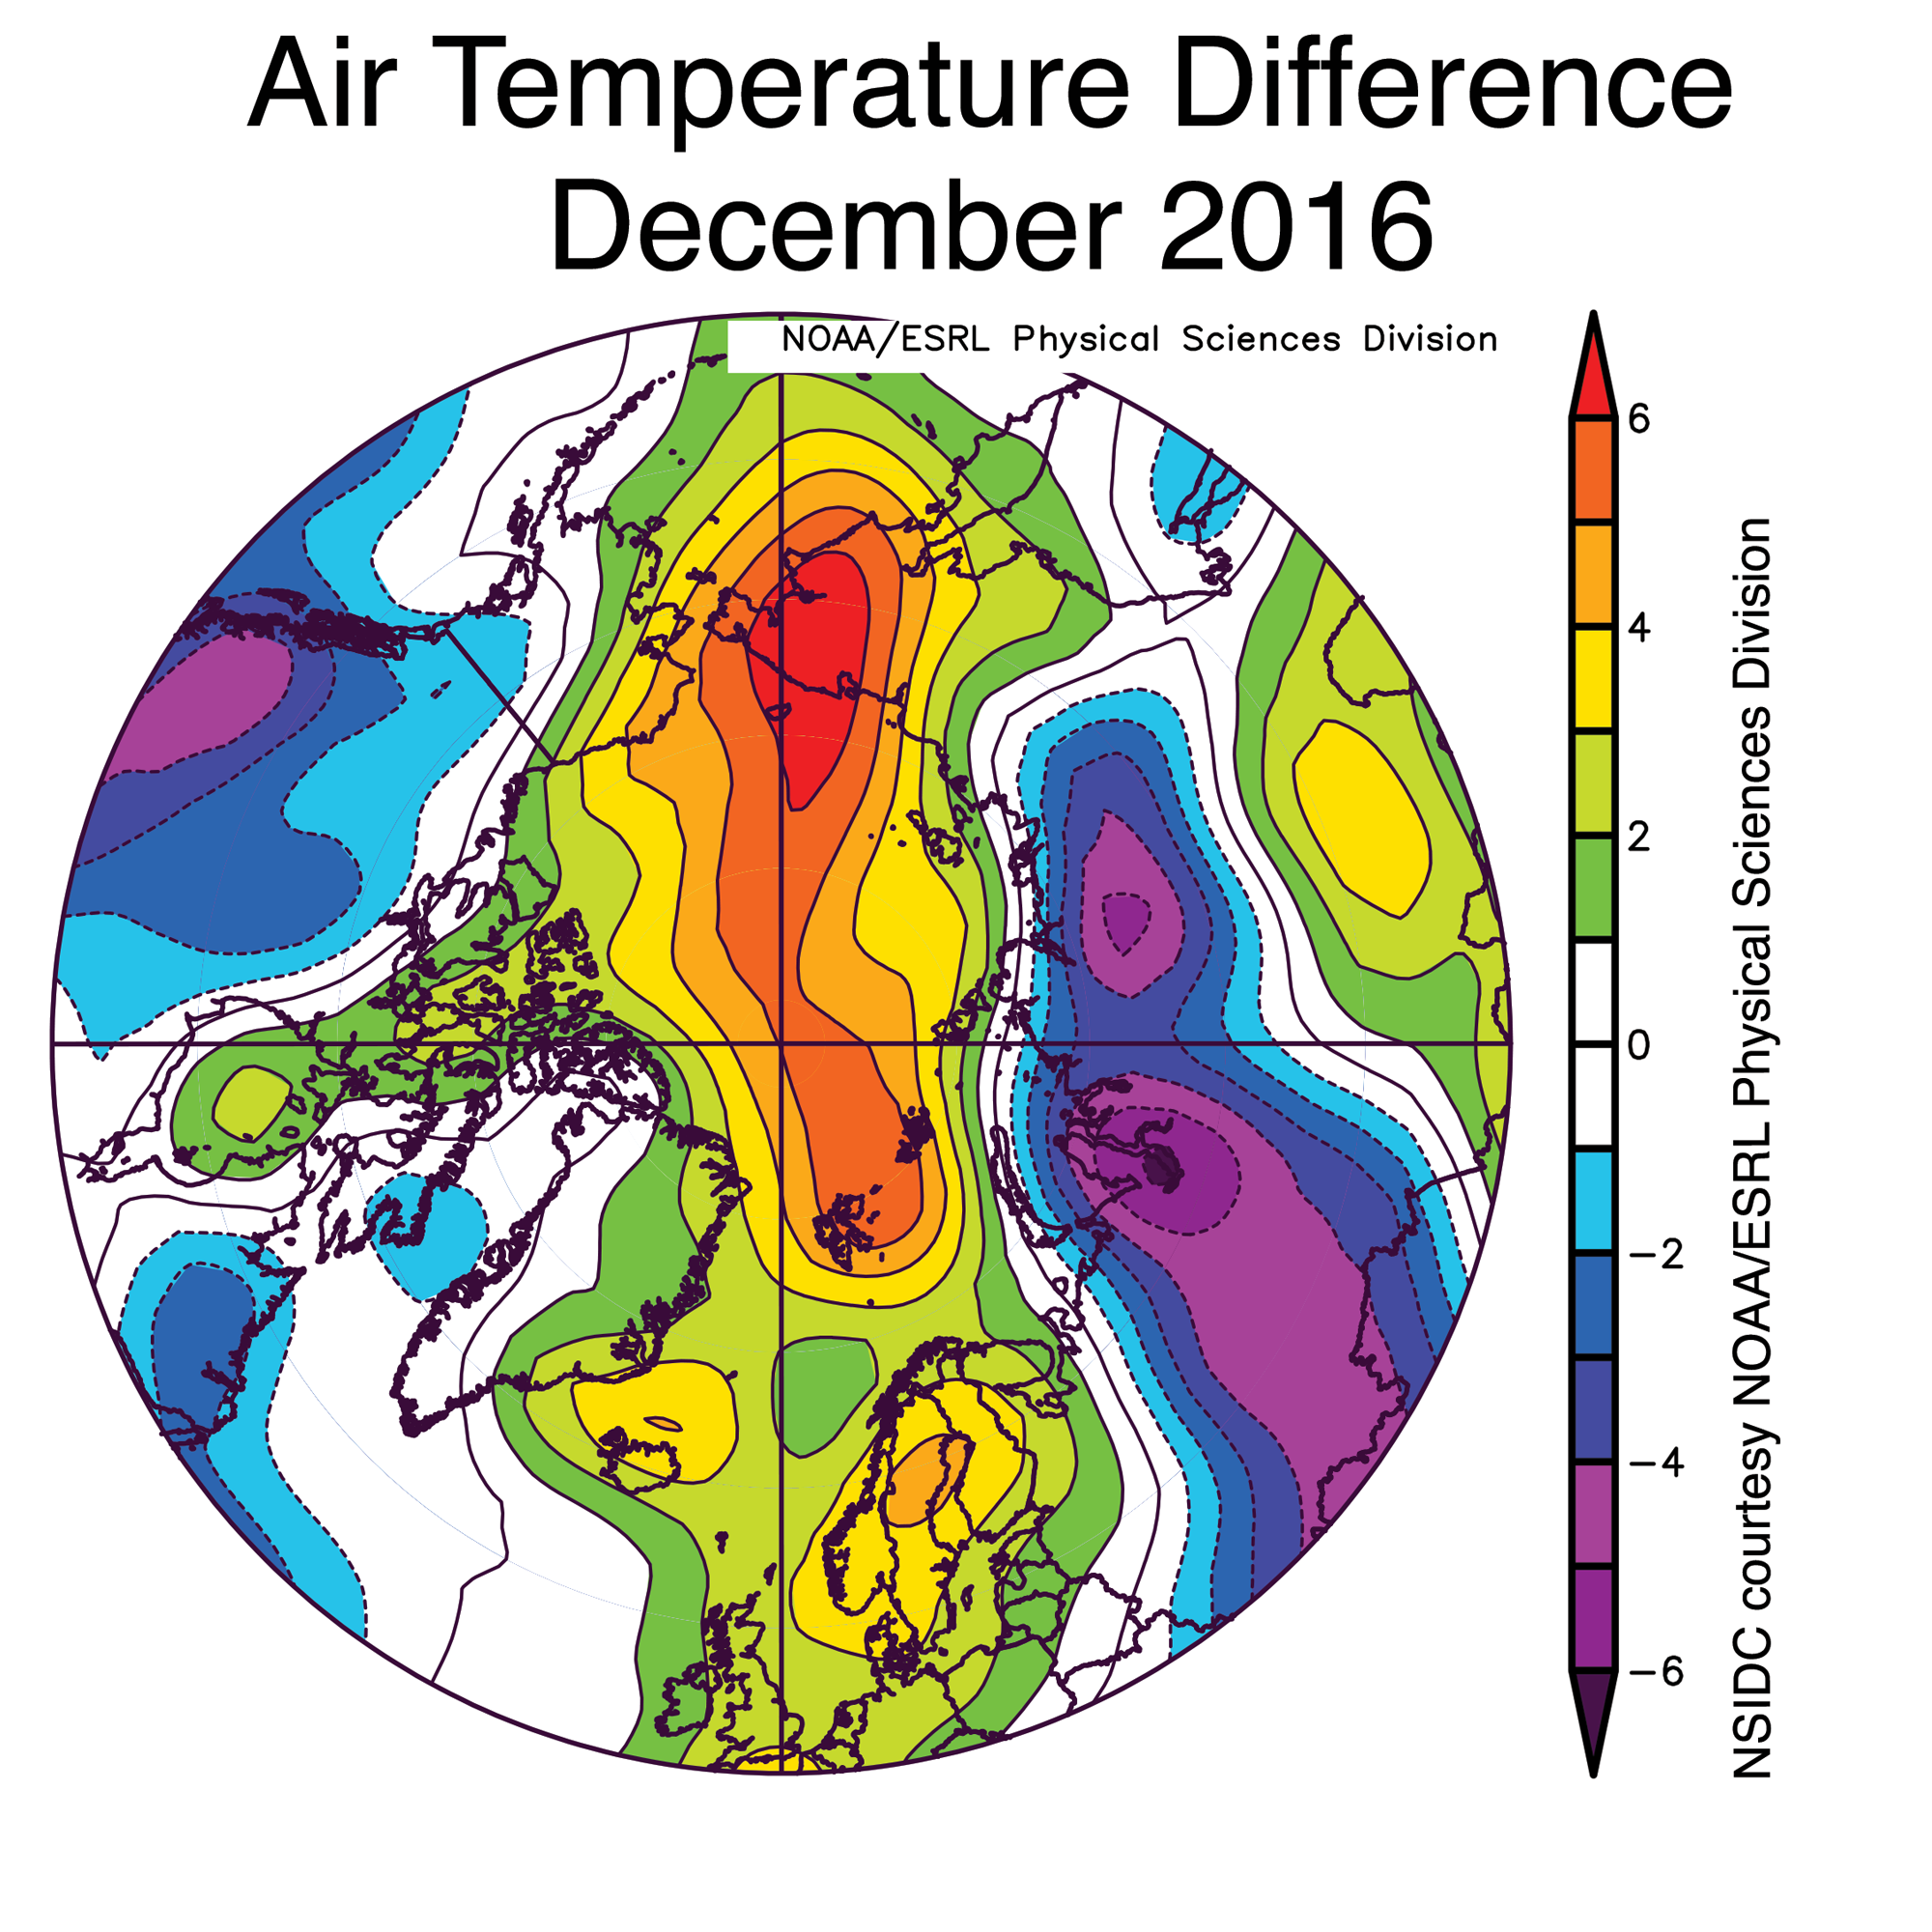
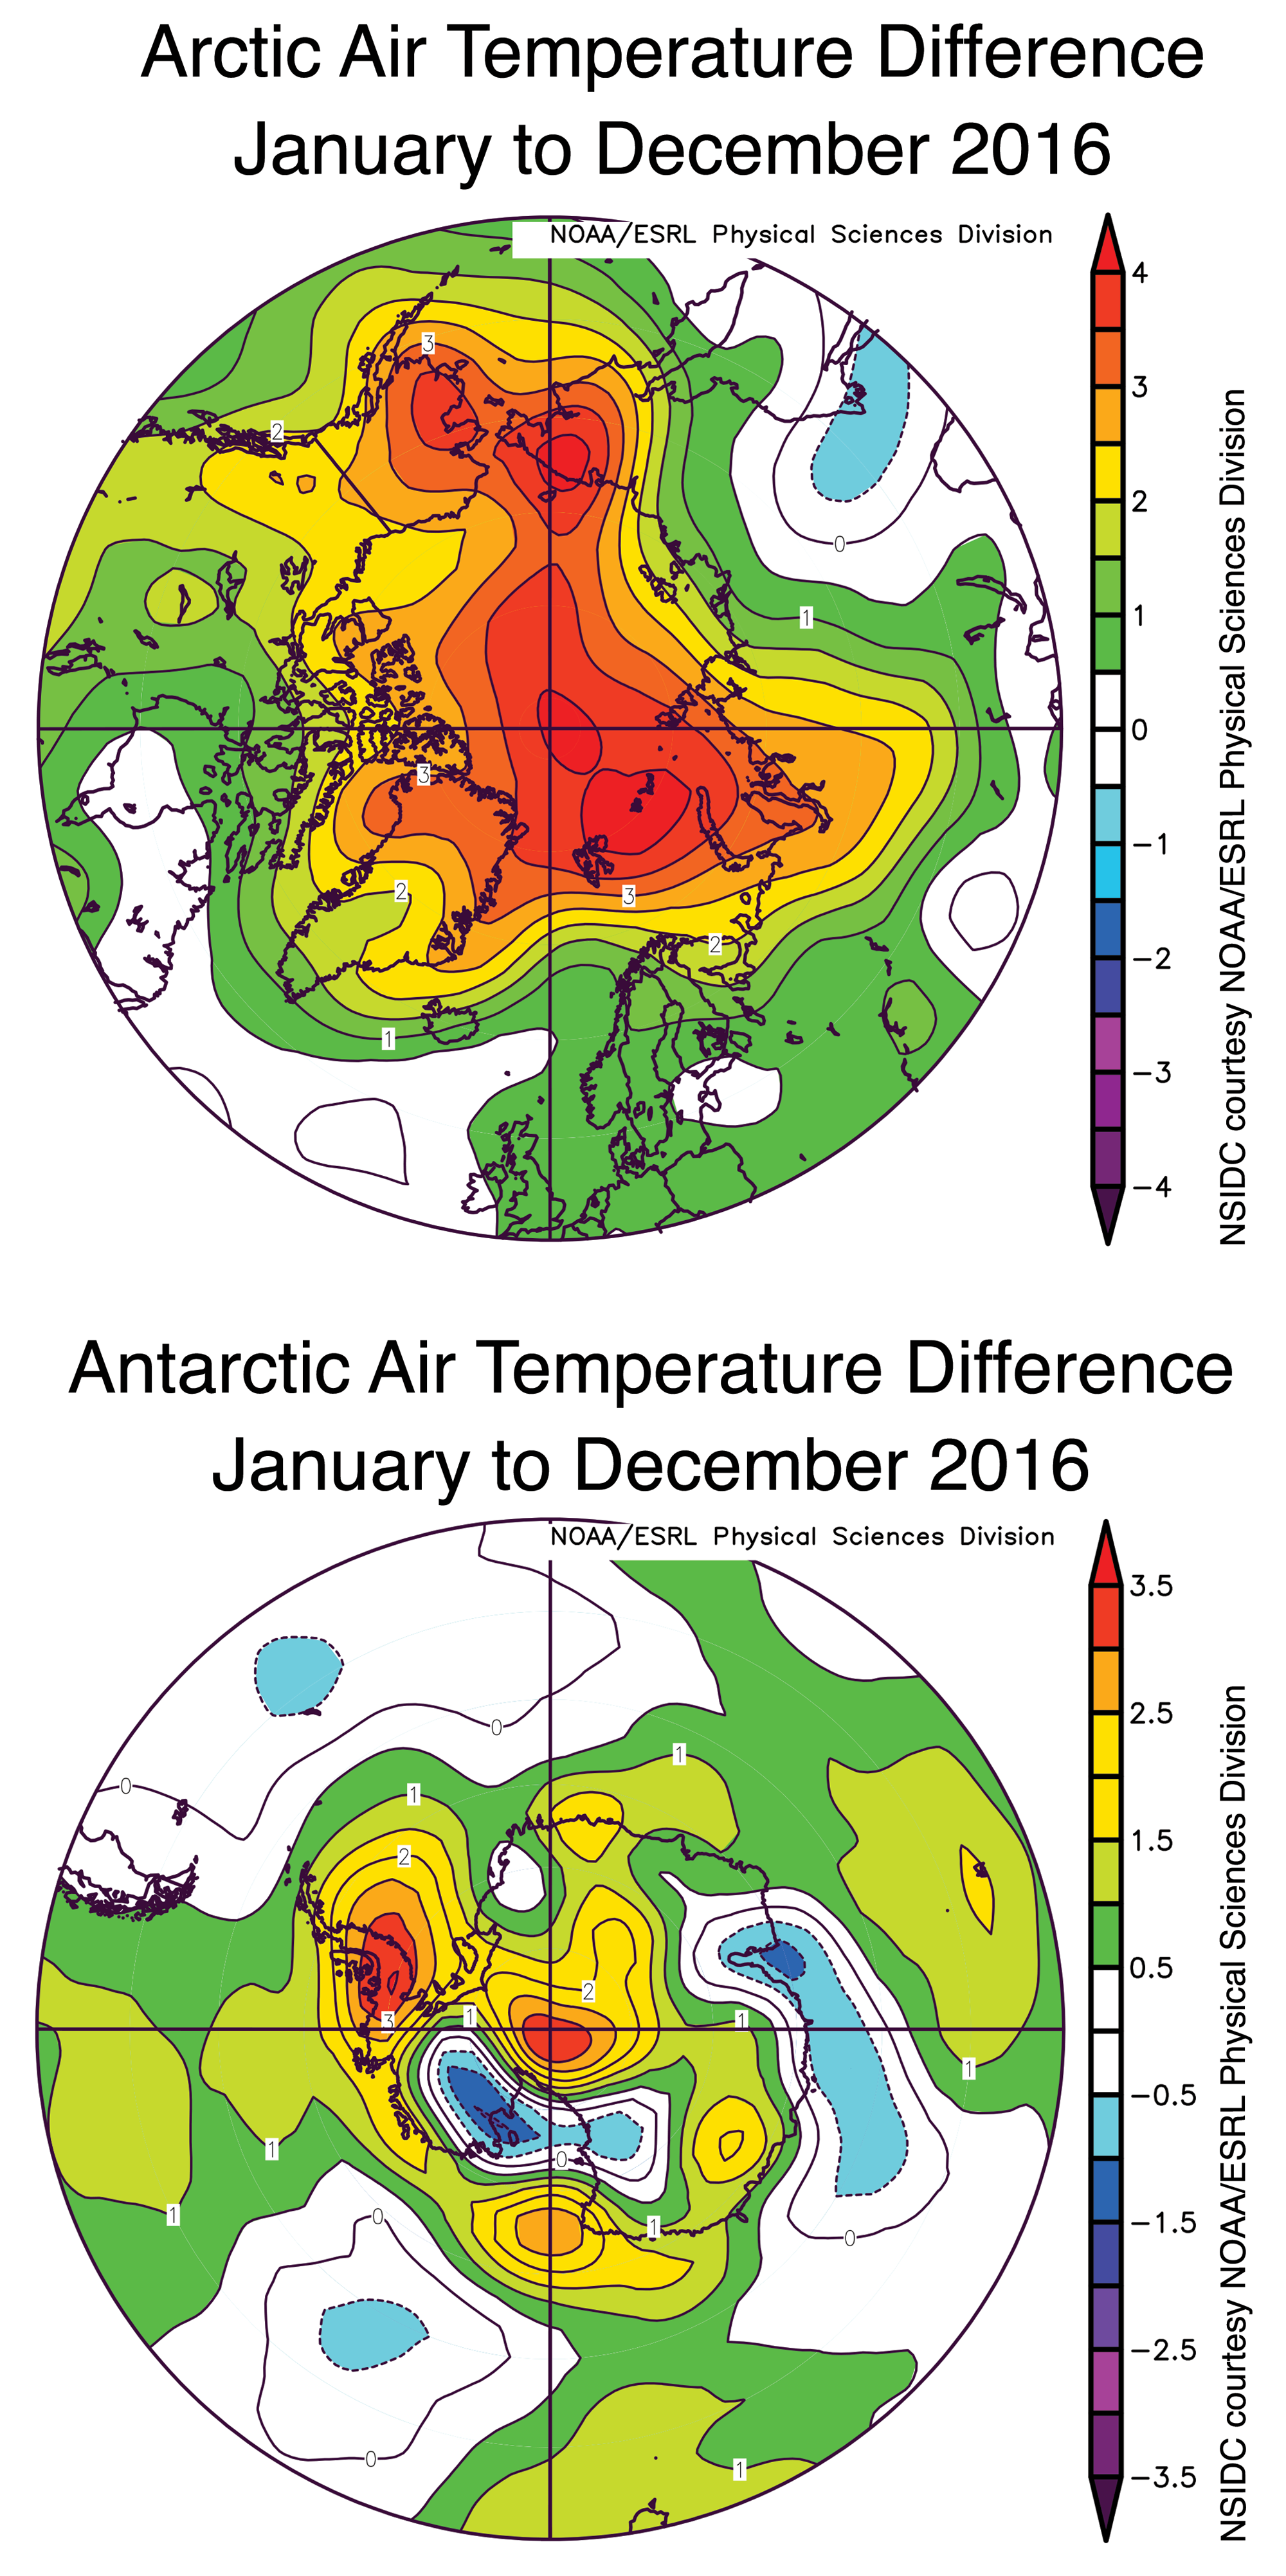
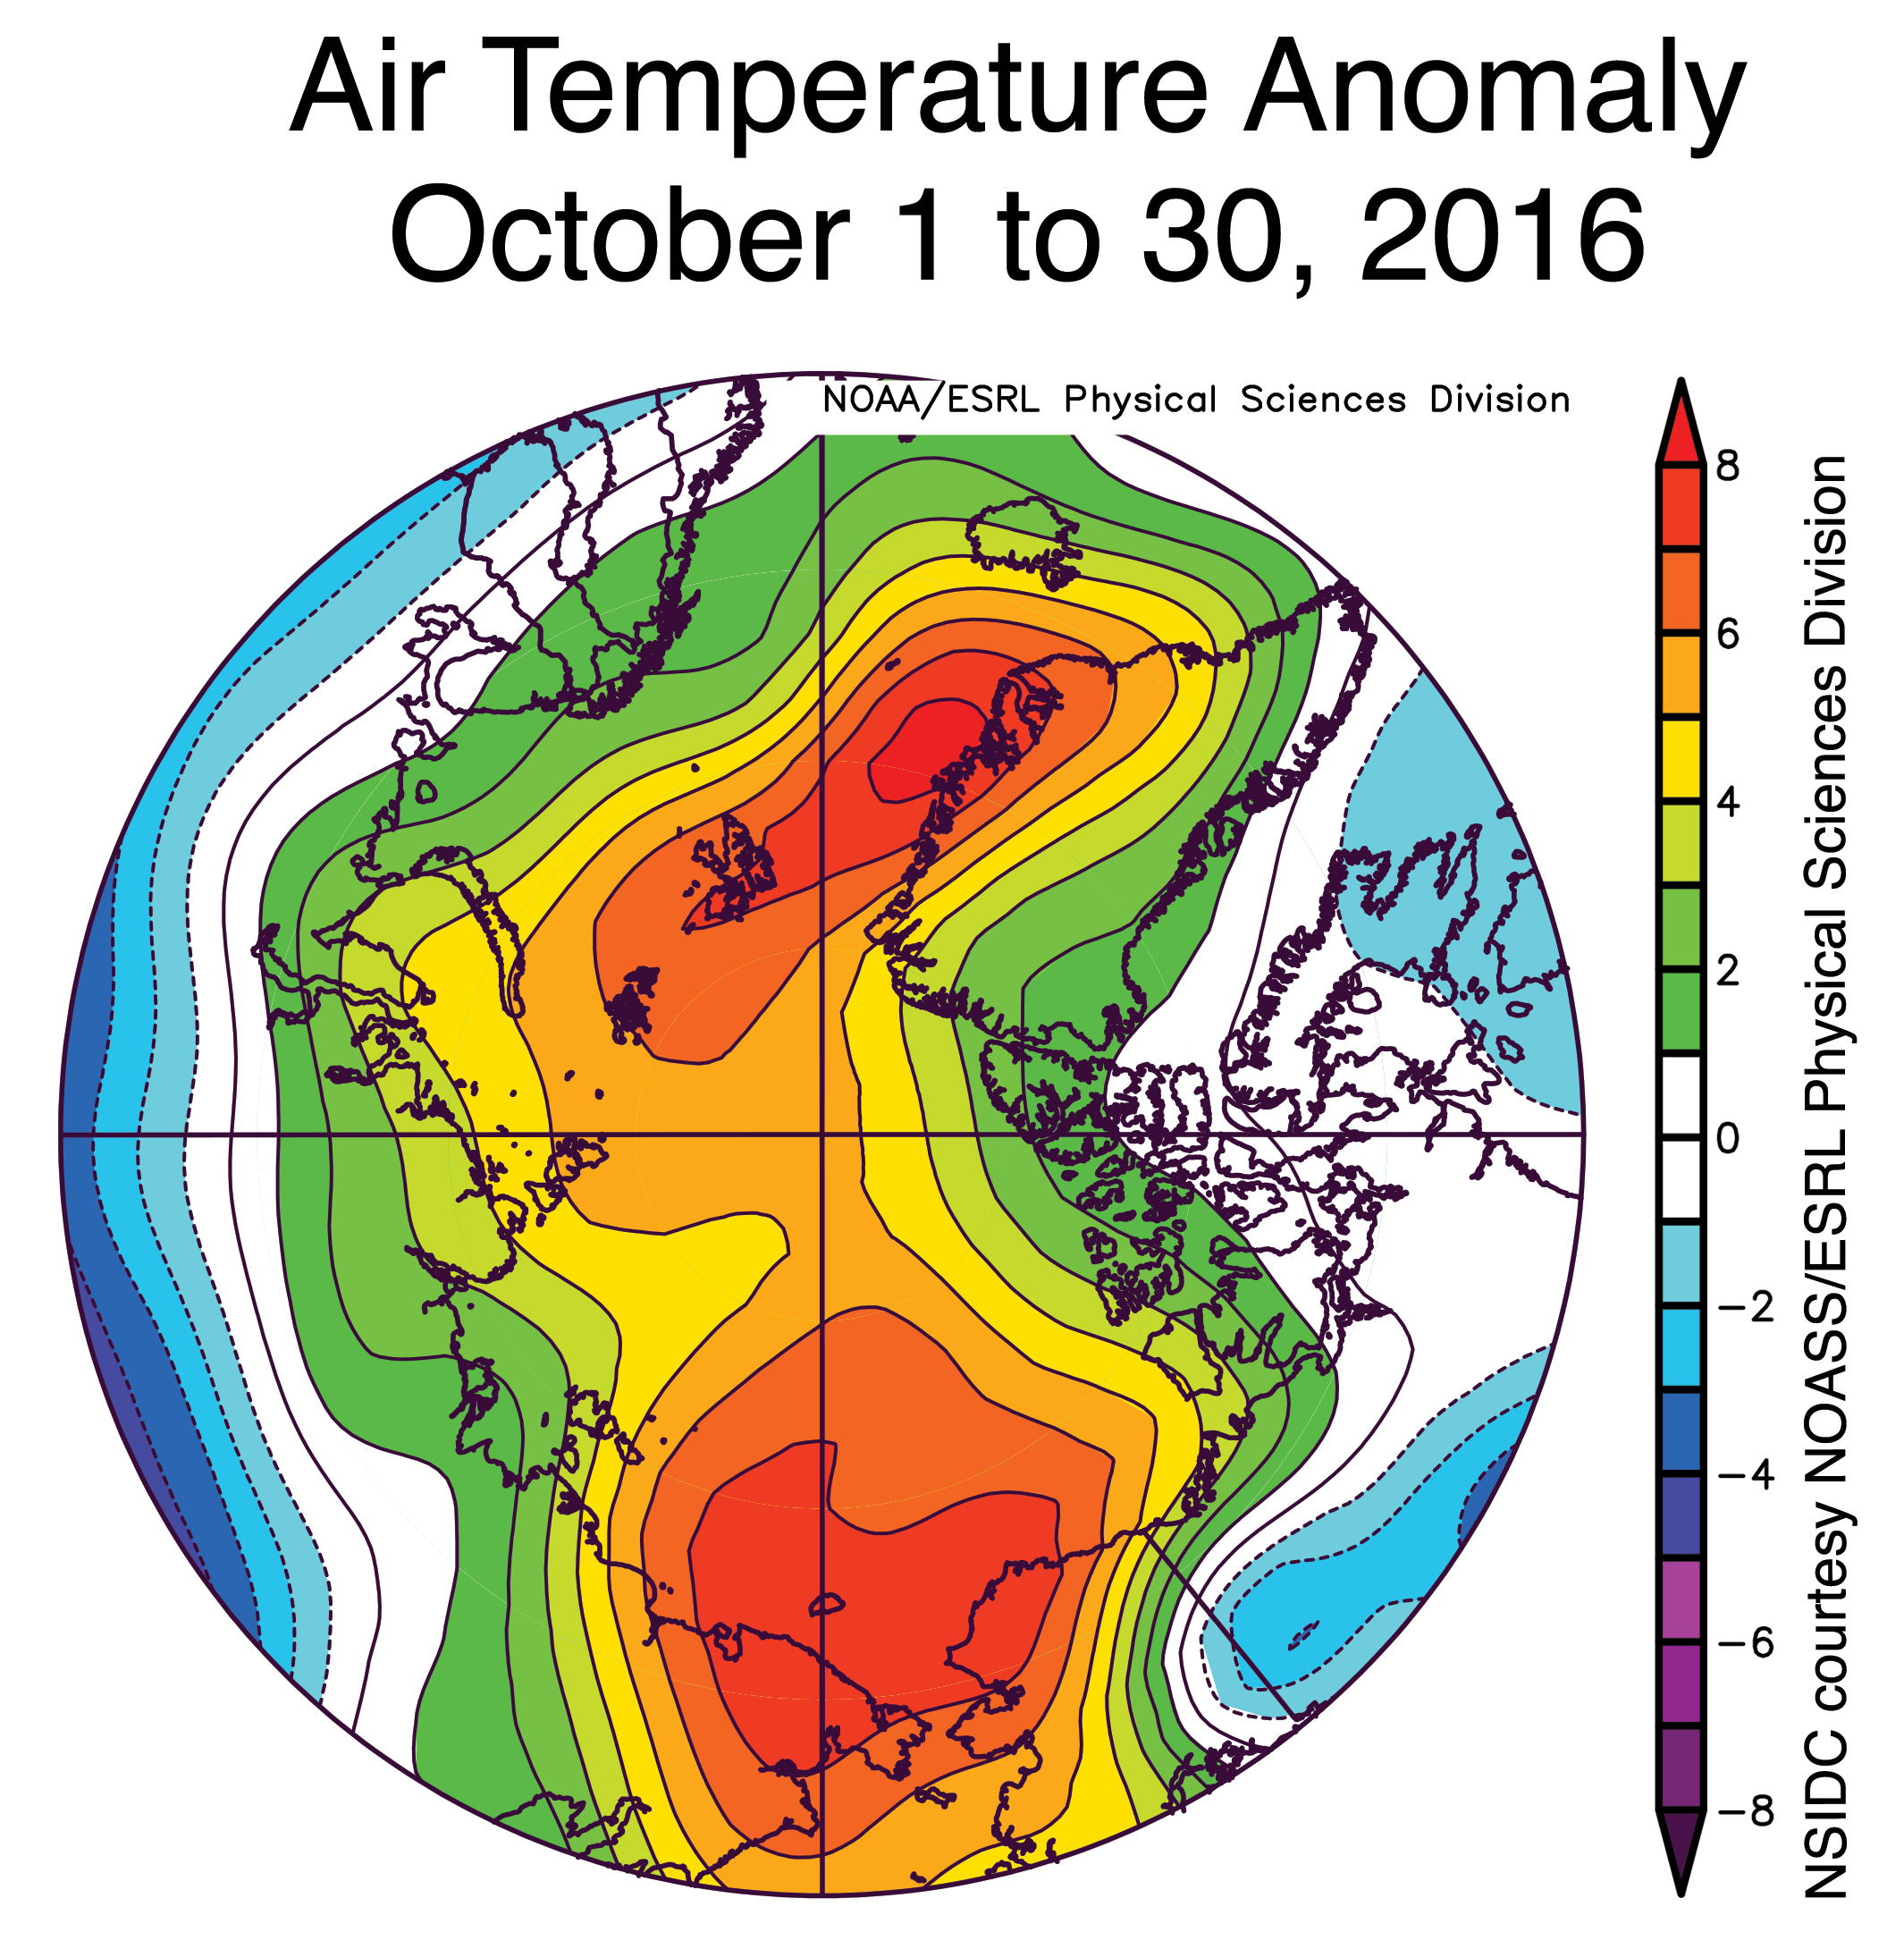
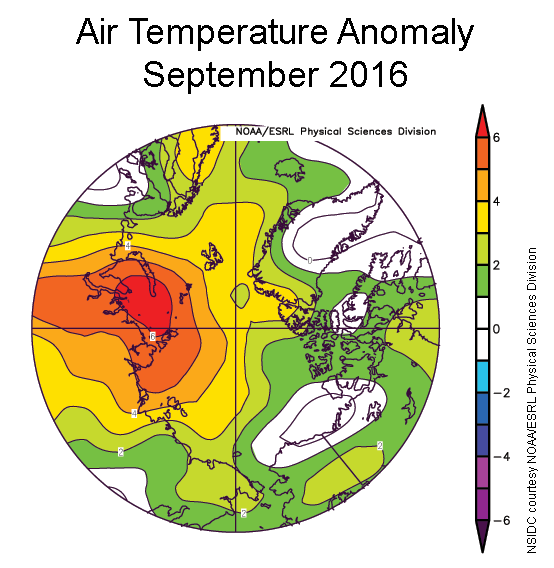
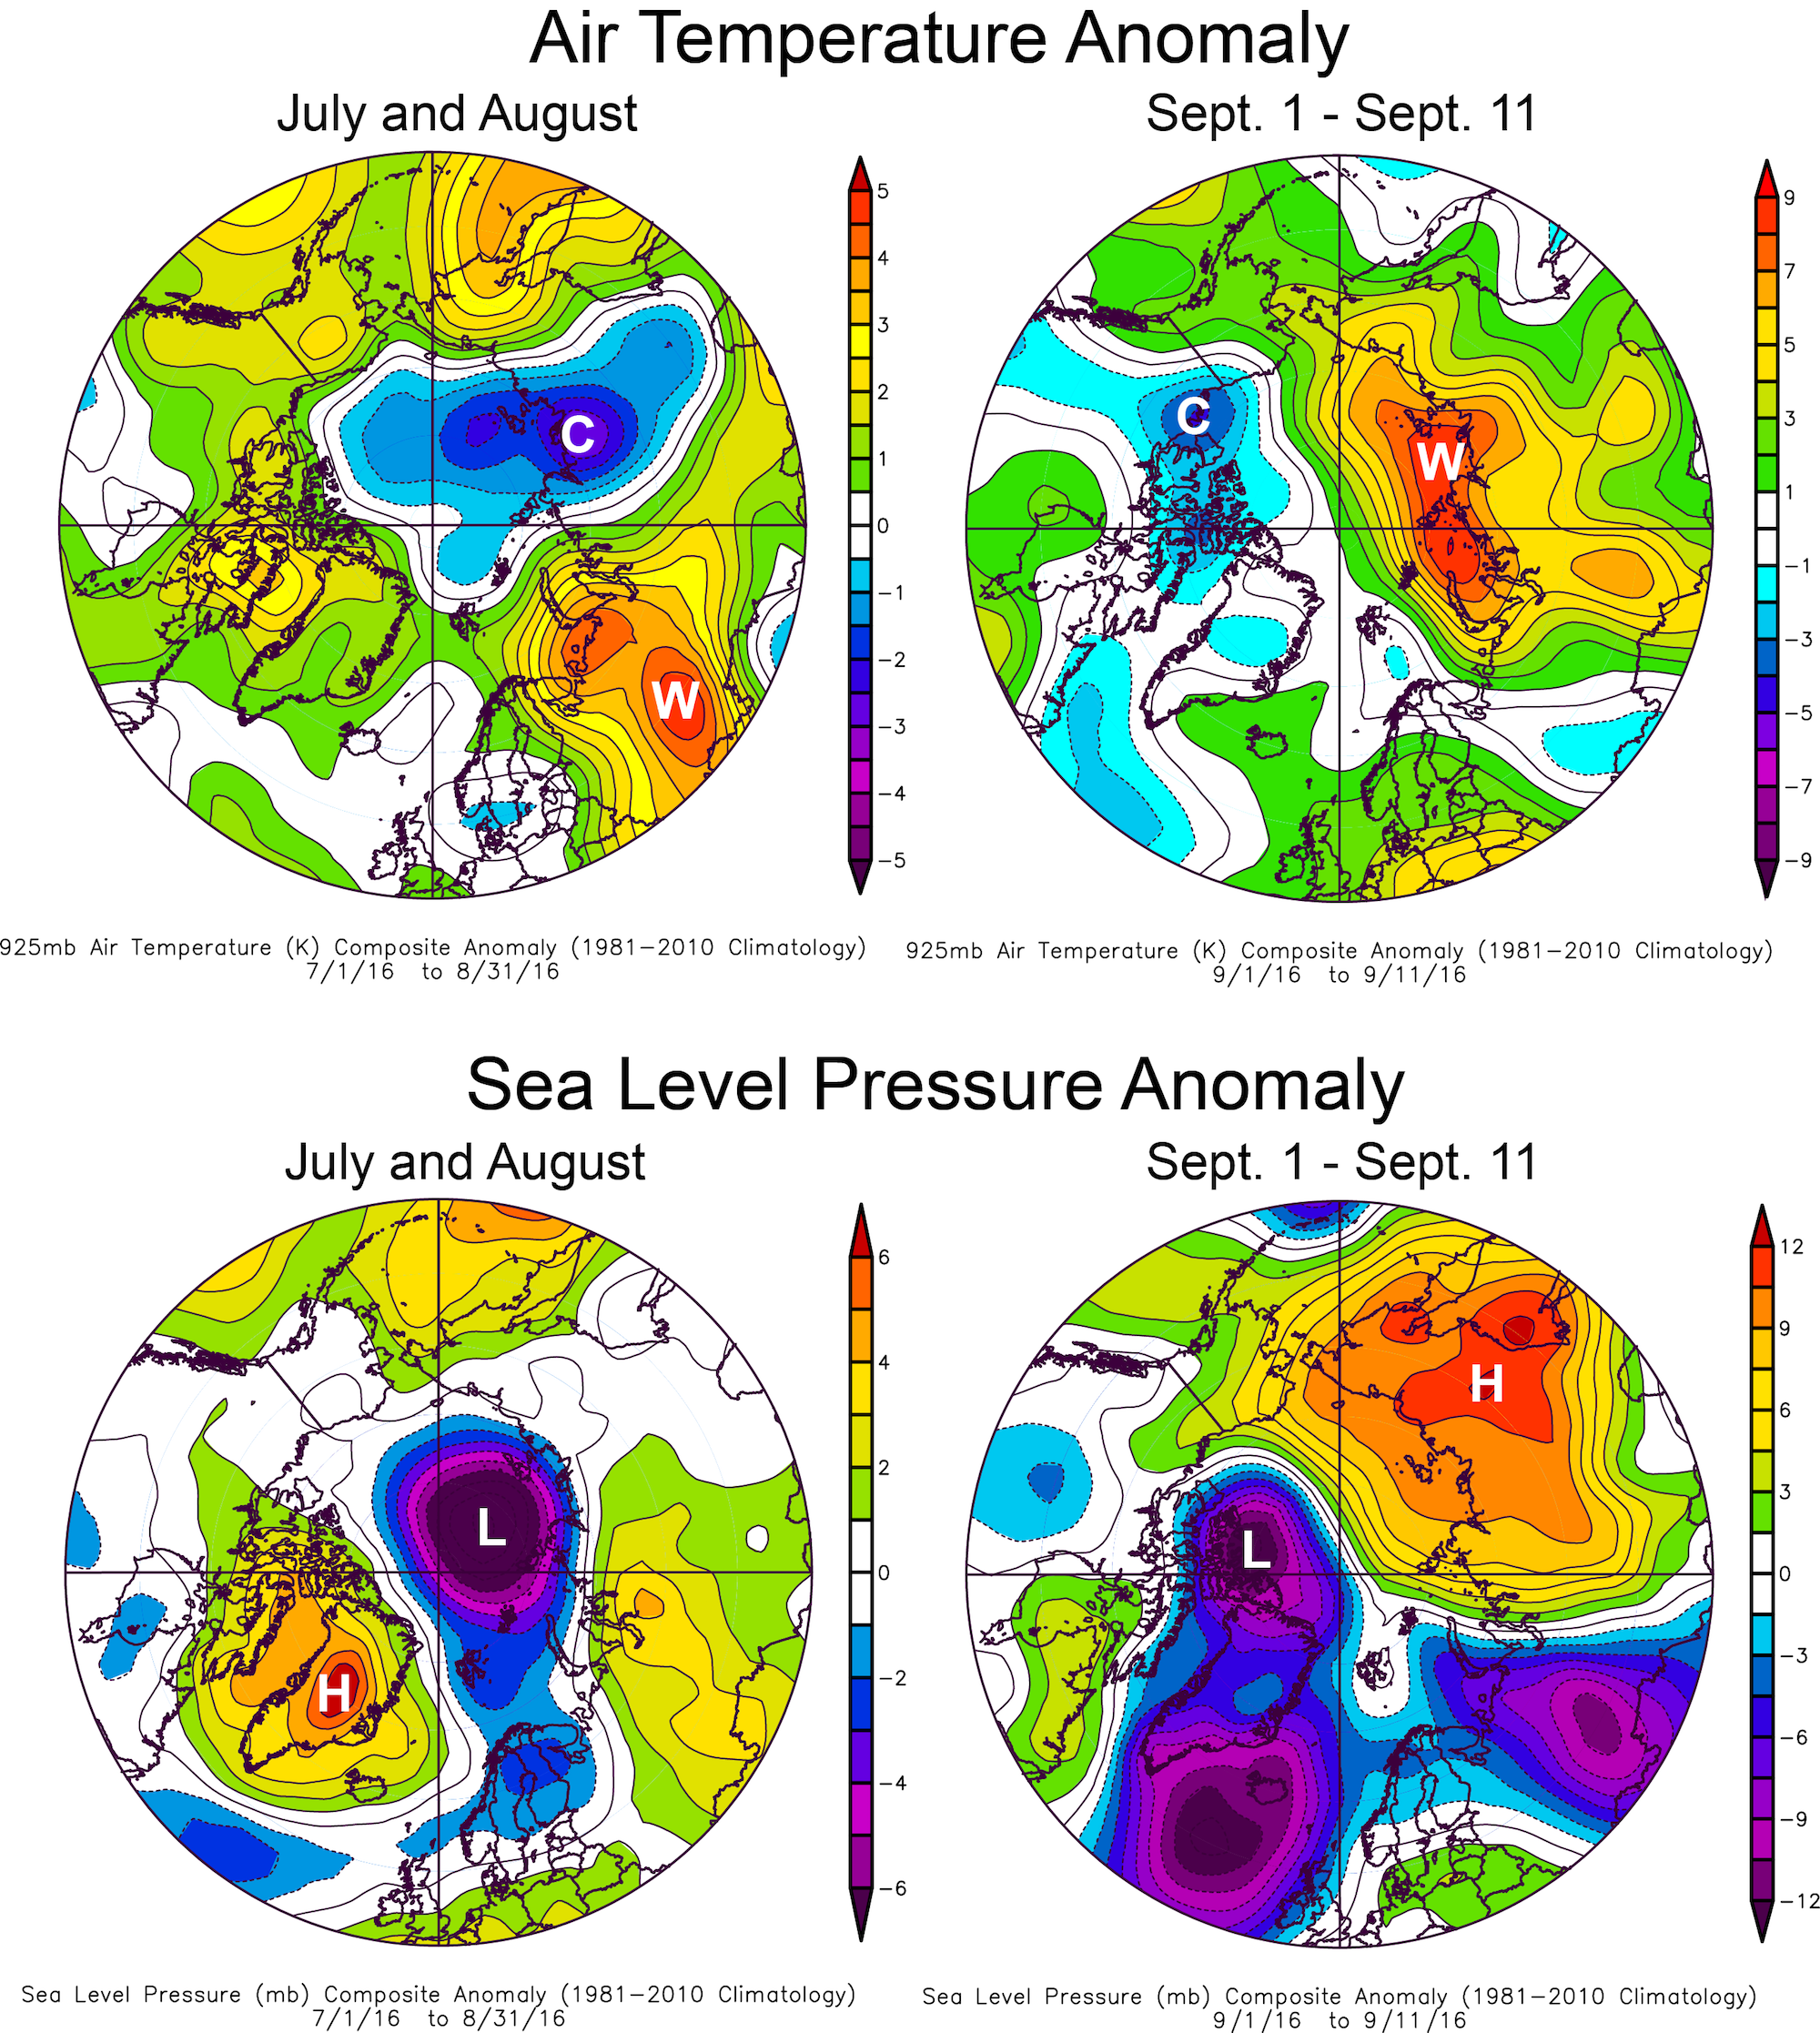
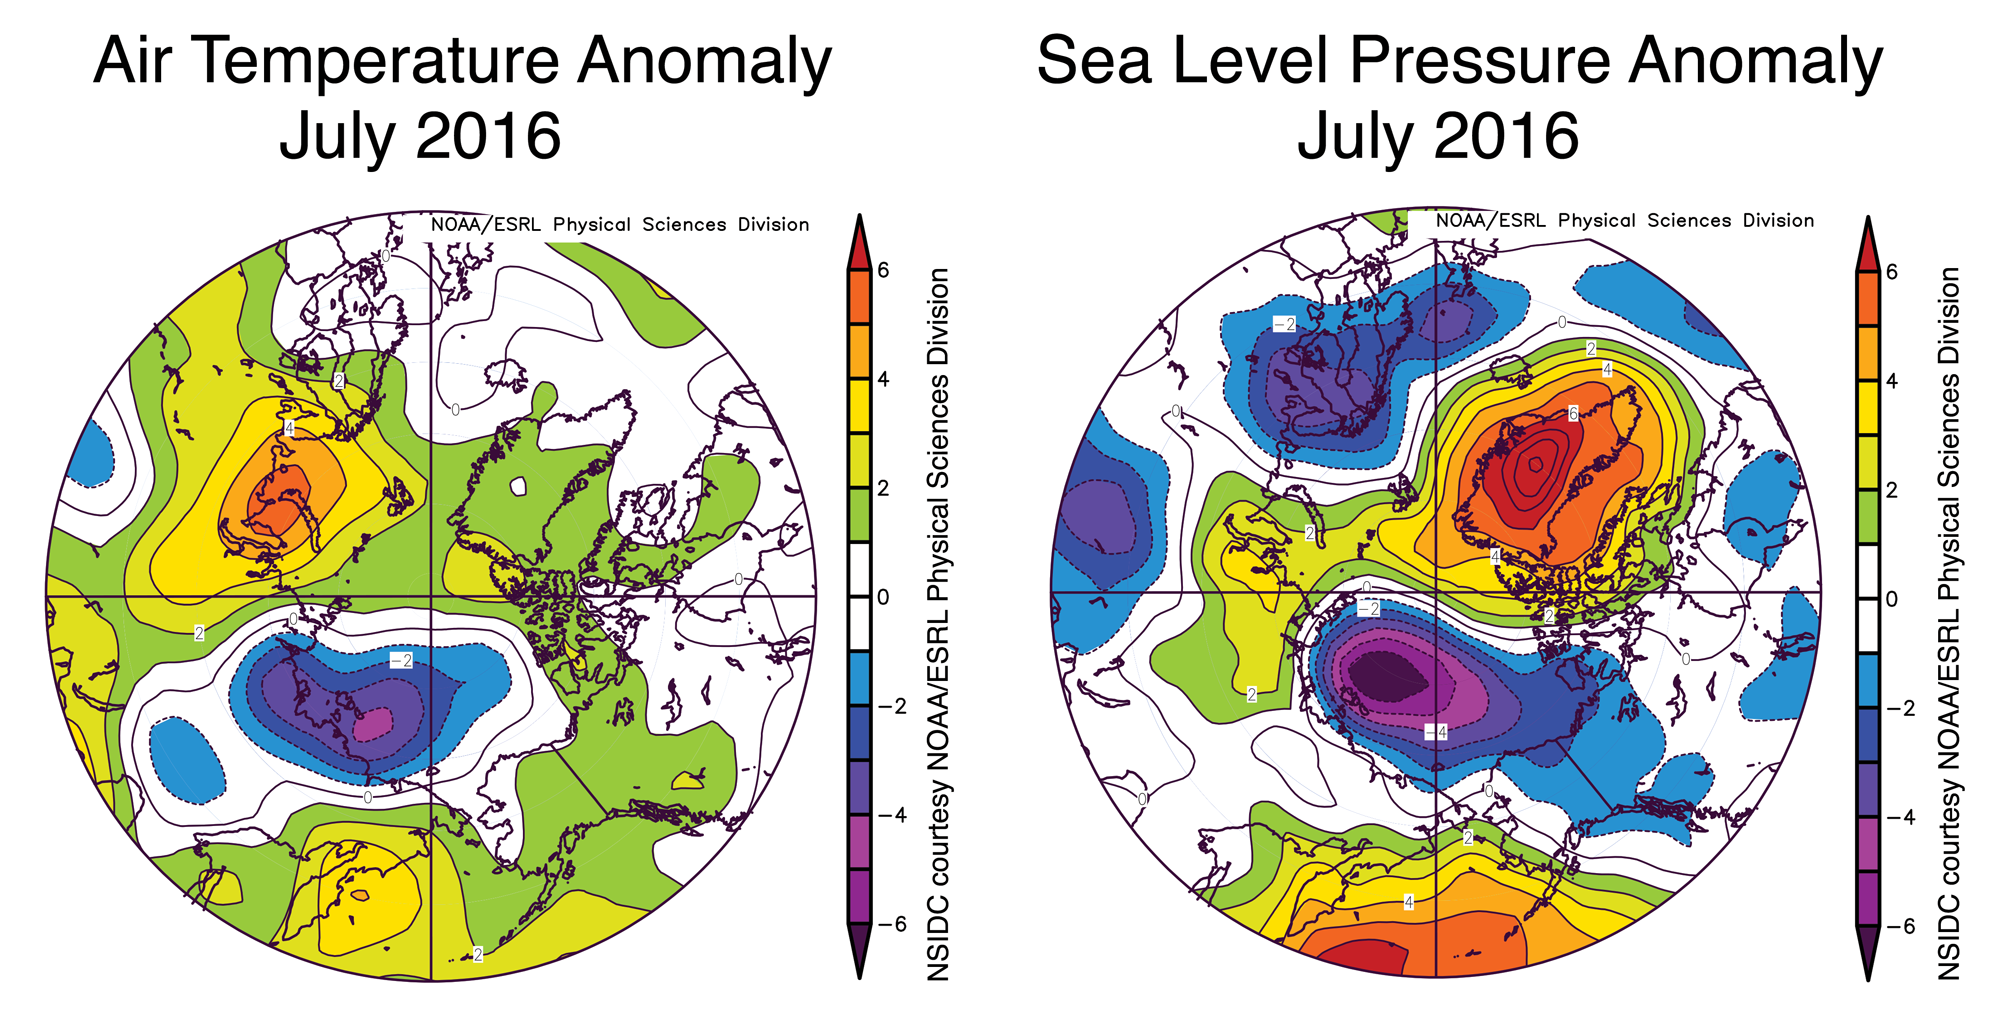
Figure 2b. This plot shows air temperature difference from average in the Arctic for November 2016. Air temperatures at the 925 hPa (approximately 2,500 feet) level in the atmosphere were above the 1981 to 2010 average over the entire Arctic Ocean and, locally up to 10 degrees Celsius (18 degrees Fahrenheit) above average near the North Pole. This is in sharp contrast to northern Eurasia, where temperatures were up to 4 to 8 degrees Celsius (7 to 14 degrees Fahrenheit) below average.

Credit: NSIDC courtesy NOAA/ESRL Physical Sciences Division
High-resolution image

Continuing the warm Arctic pattern seen in October, November air temperatures were far above average over the Arctic Ocean and Canada. Air temperatures at the 925 hPa level (about 2,500 feet above sea level) were above the 1981 to 2010 average over the entire Arctic Ocean and, locally up to 10 degrees Celsius (18 degrees Fahrenheit) above average near the North Pole. This is in sharp contrast to northern Eurasia, where temperatures were as much as 4 to 8 degrees Celsius (7 to 14 degrees Fahrenheit) below average (Figure 2b). Record snow events were reported in Sweden and across Siberia early in the month.

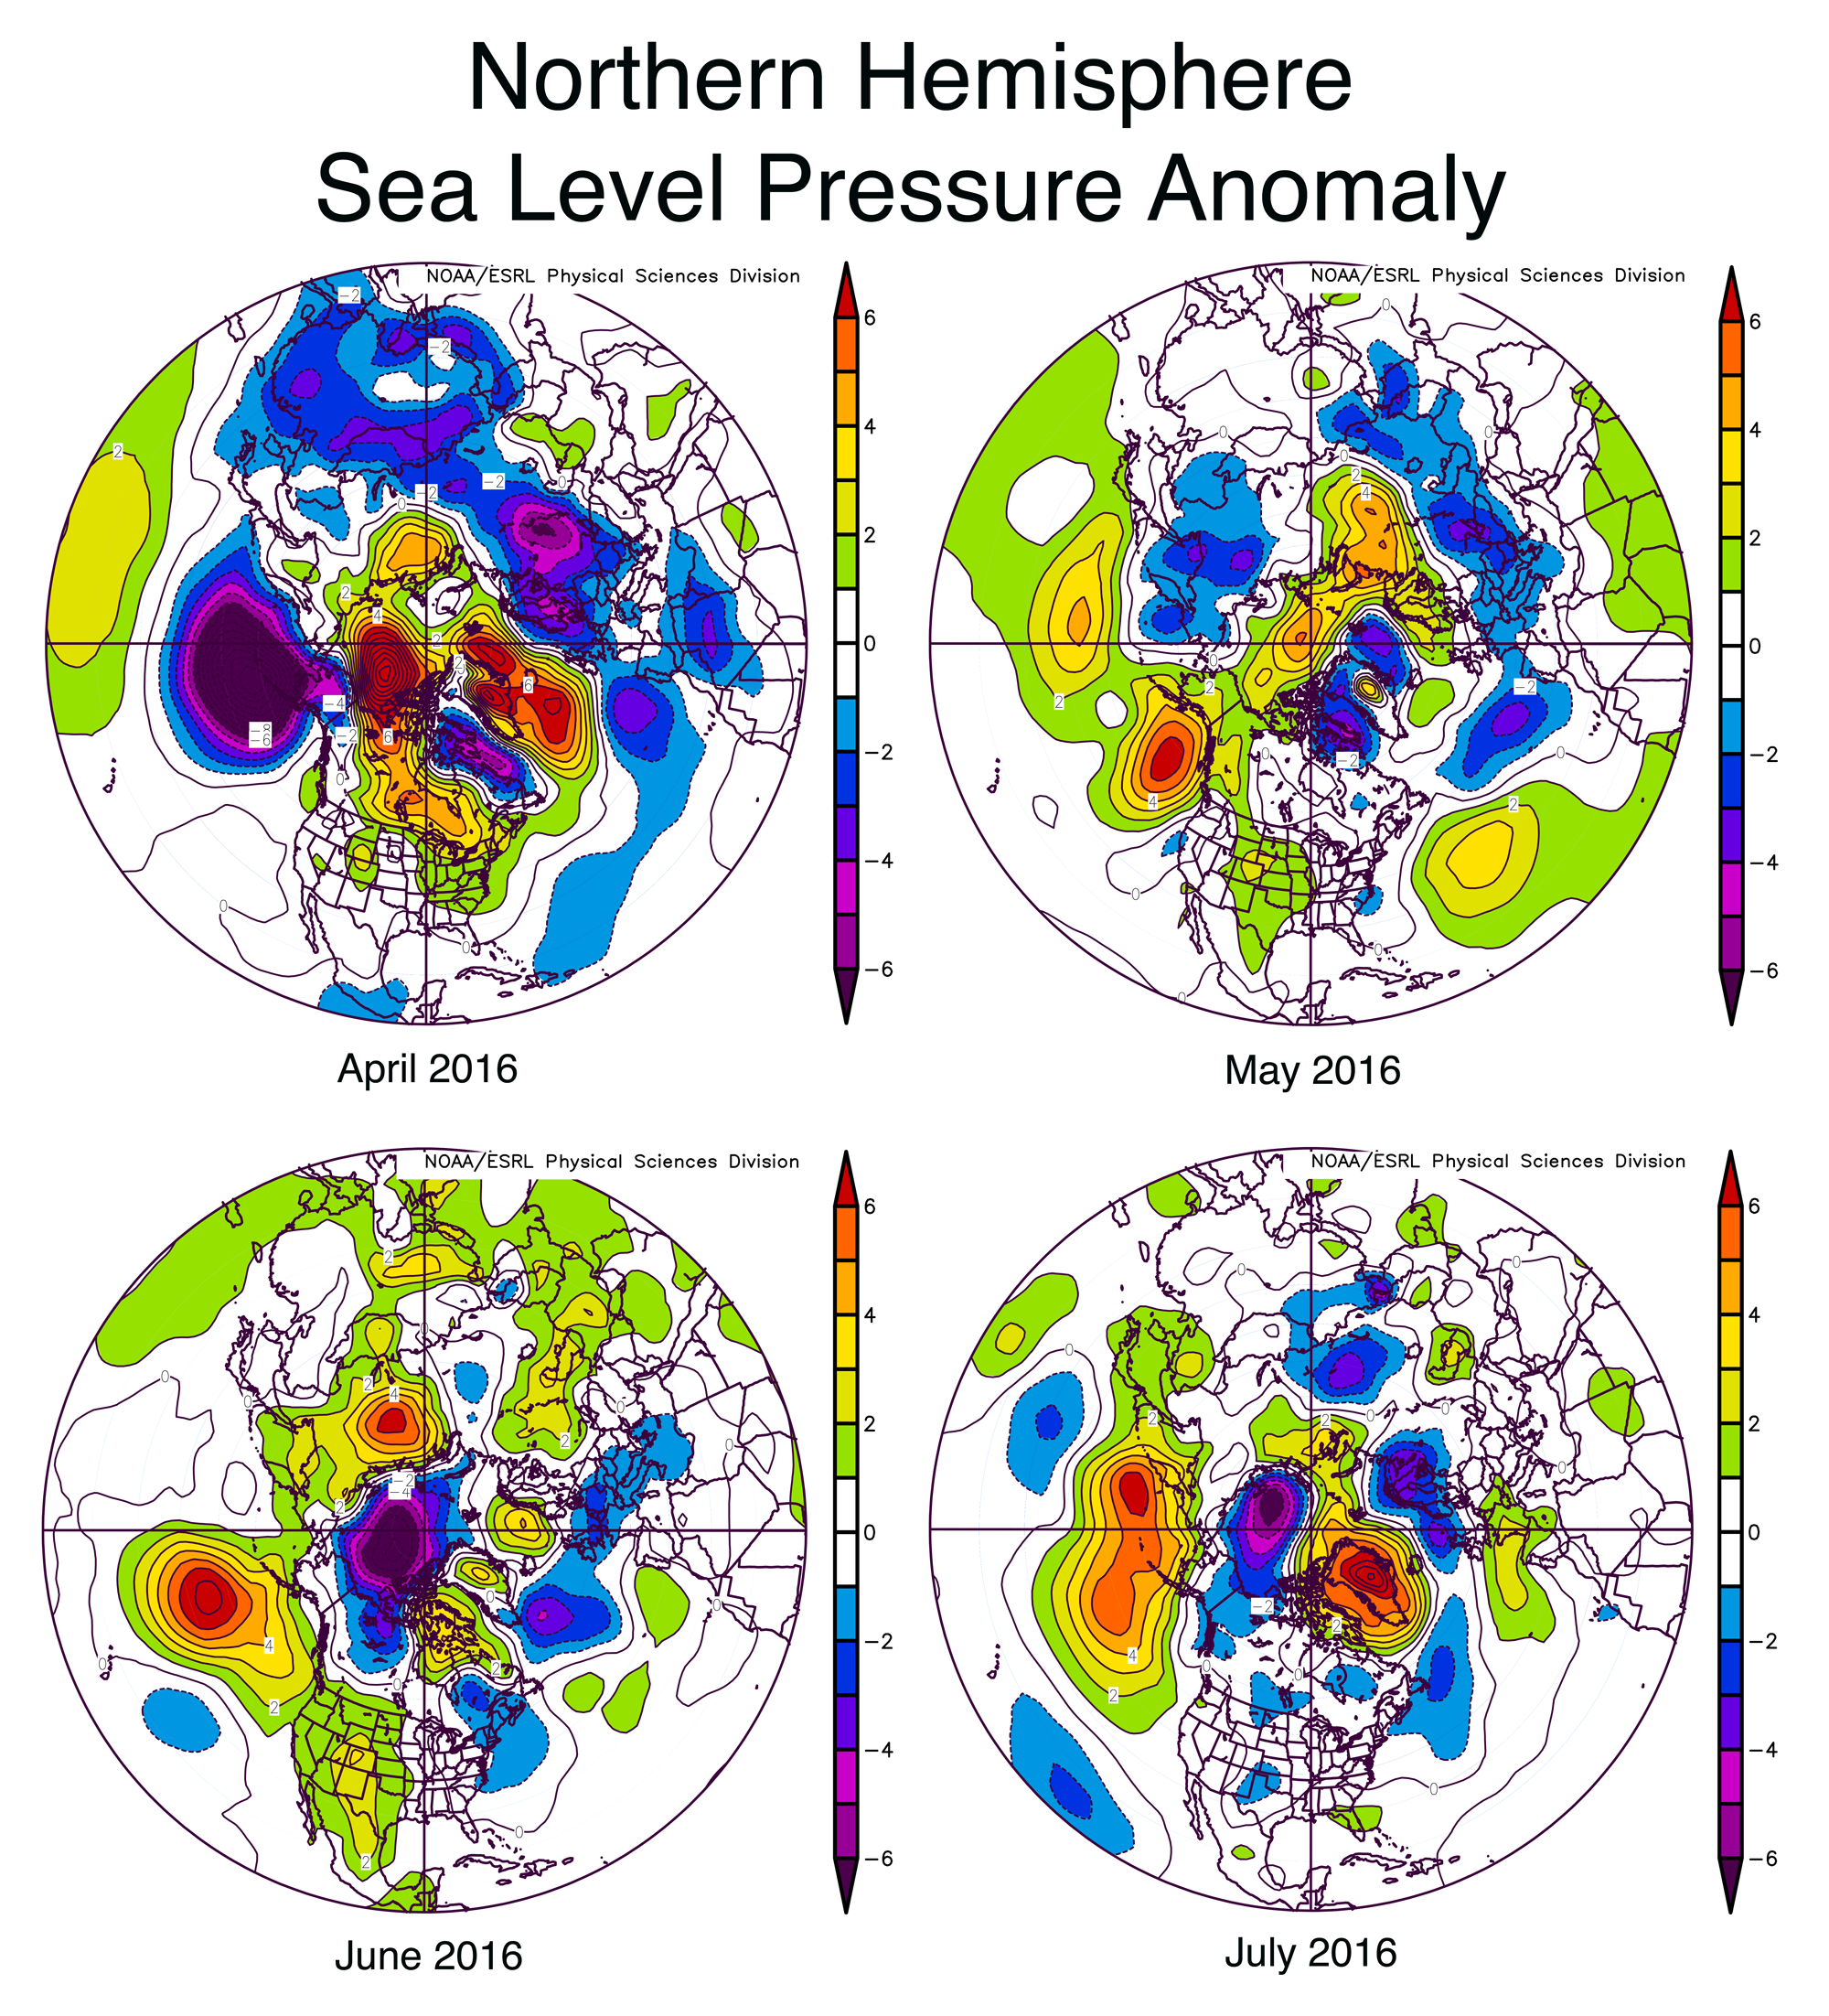
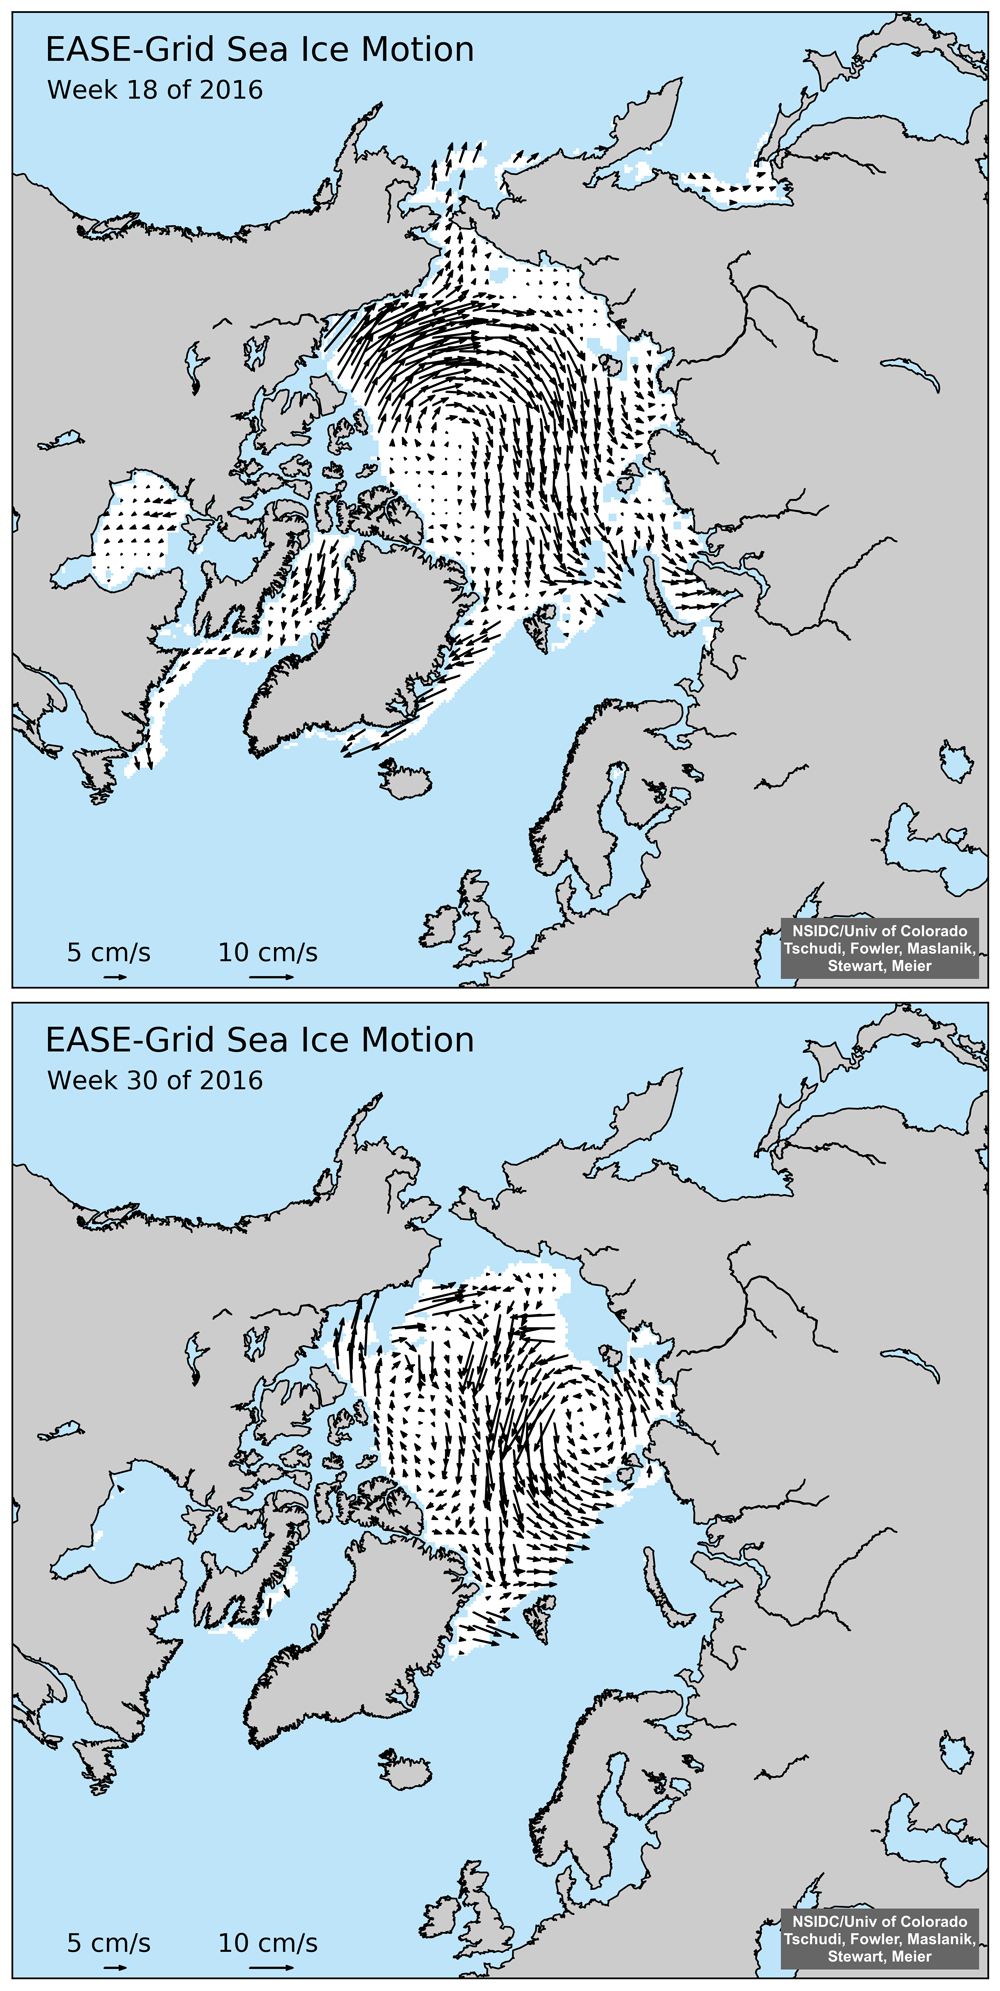
In autumn and winter, the typical cyclone path is from Iceland, across the Norwegian Sea and into the Barents Sea. This November, an unusual jet stream pattern set up, and storms instead tended to enter the Arctic Ocean through Fram Strait (between Svalbard and Greenland). This set up a pattern of southerly wind in Fram Strait, the Eurasian Arctic and the Barents Sea and accounts for some of the unusual warmth over the Arctic Ocean. The wind pattern also helped push the ice northwards and helps to explain why sea ice in the Barents Sea retreated during November.

Sea surface temperatures in the Barents and Kara Seas remained unusually high, which also helped prevent ice formation. These high sea surface temperatures are a result of warm Atlantic water circulating onto the Arctic continental shelf seas.

November 2016 compared to previous years

extent trend graph

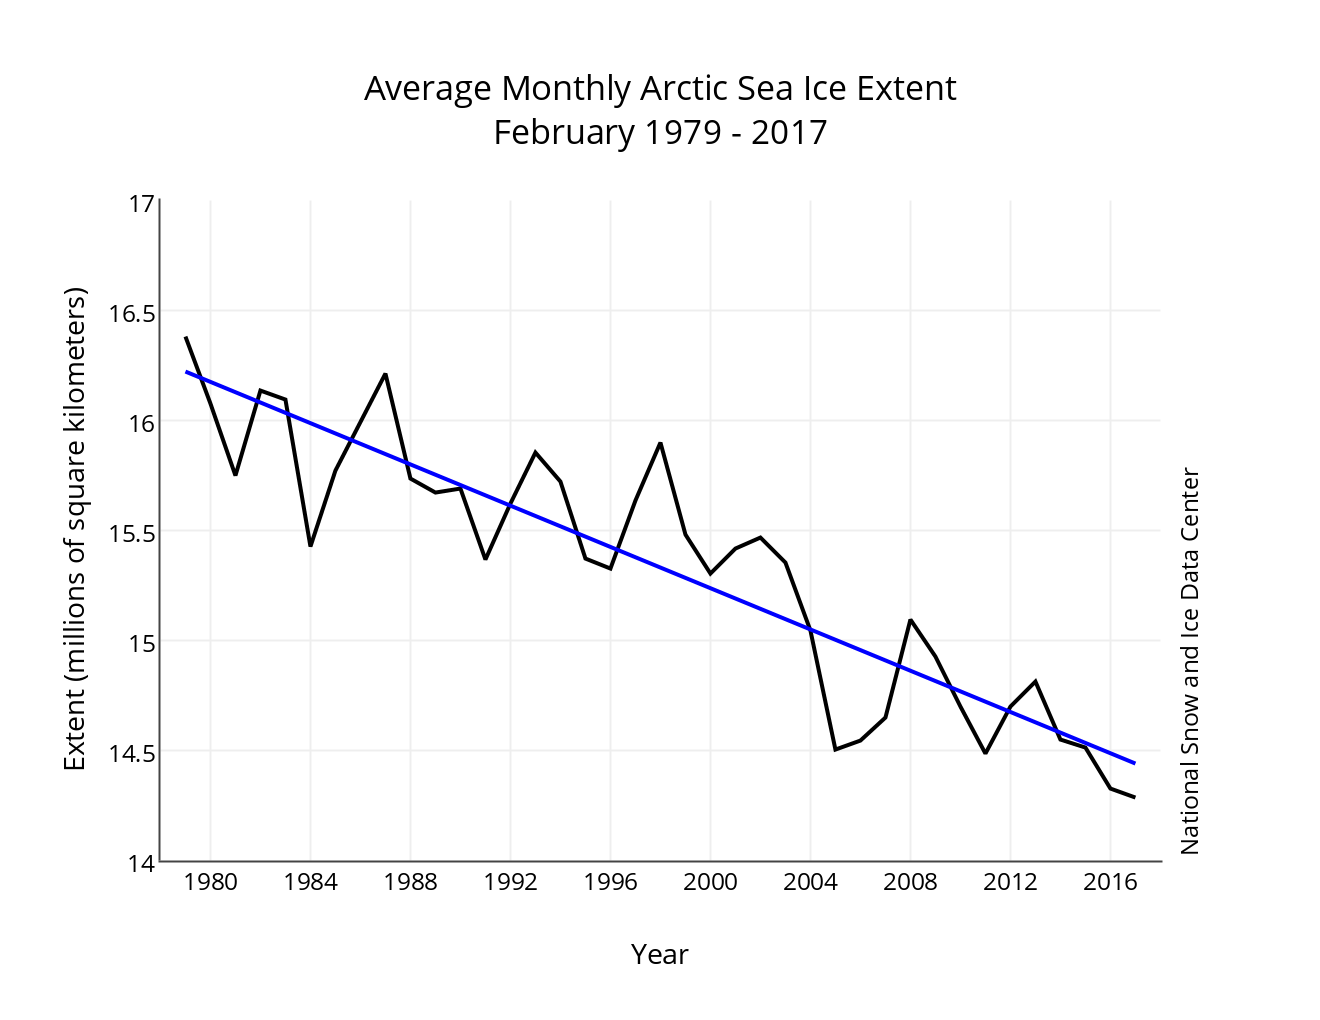
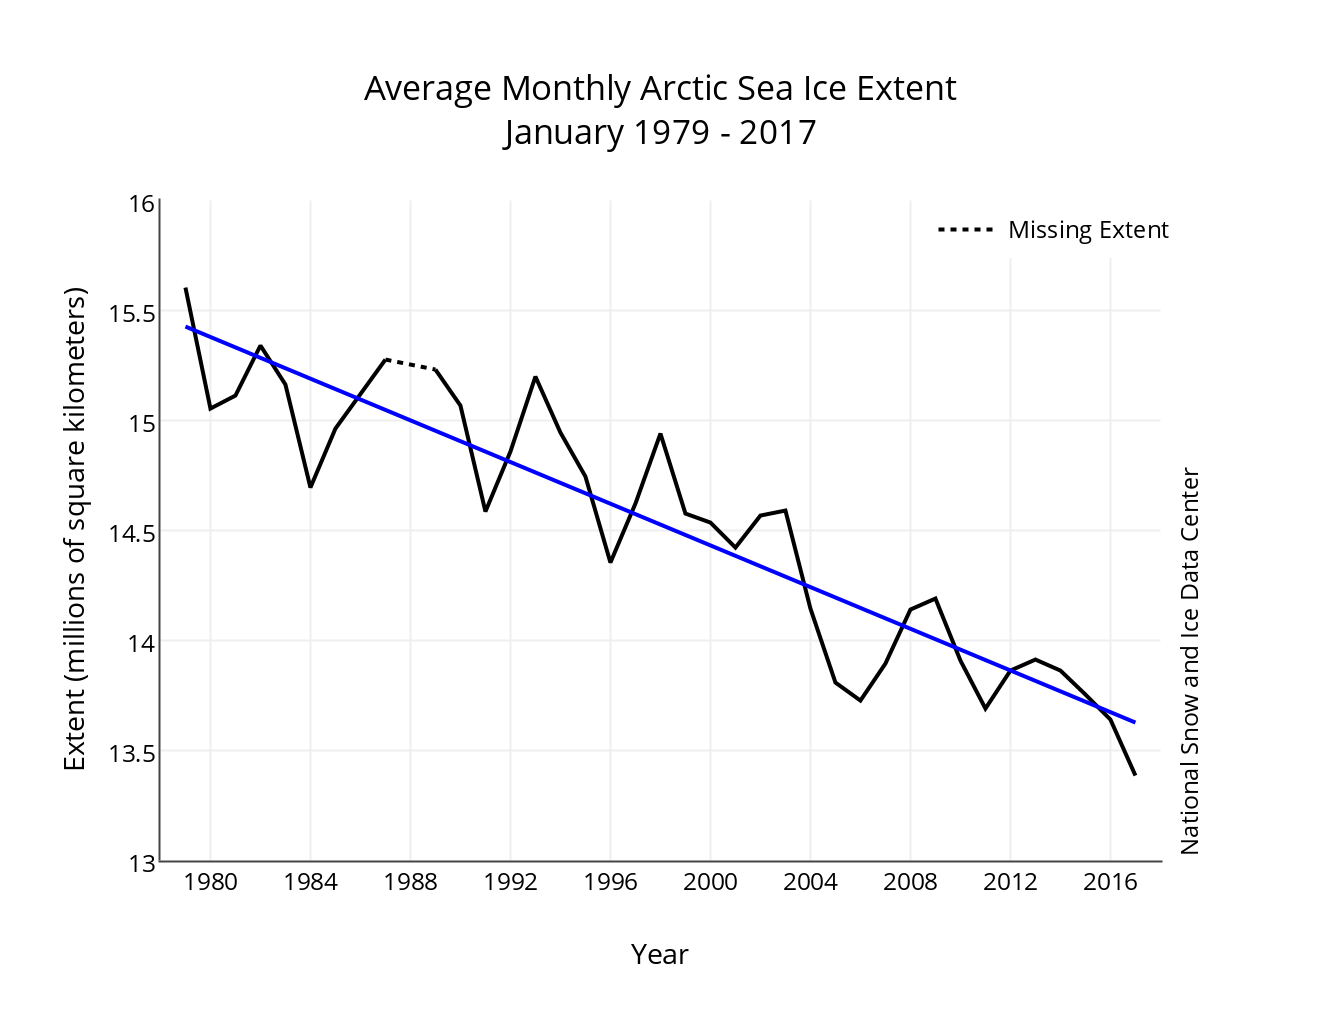
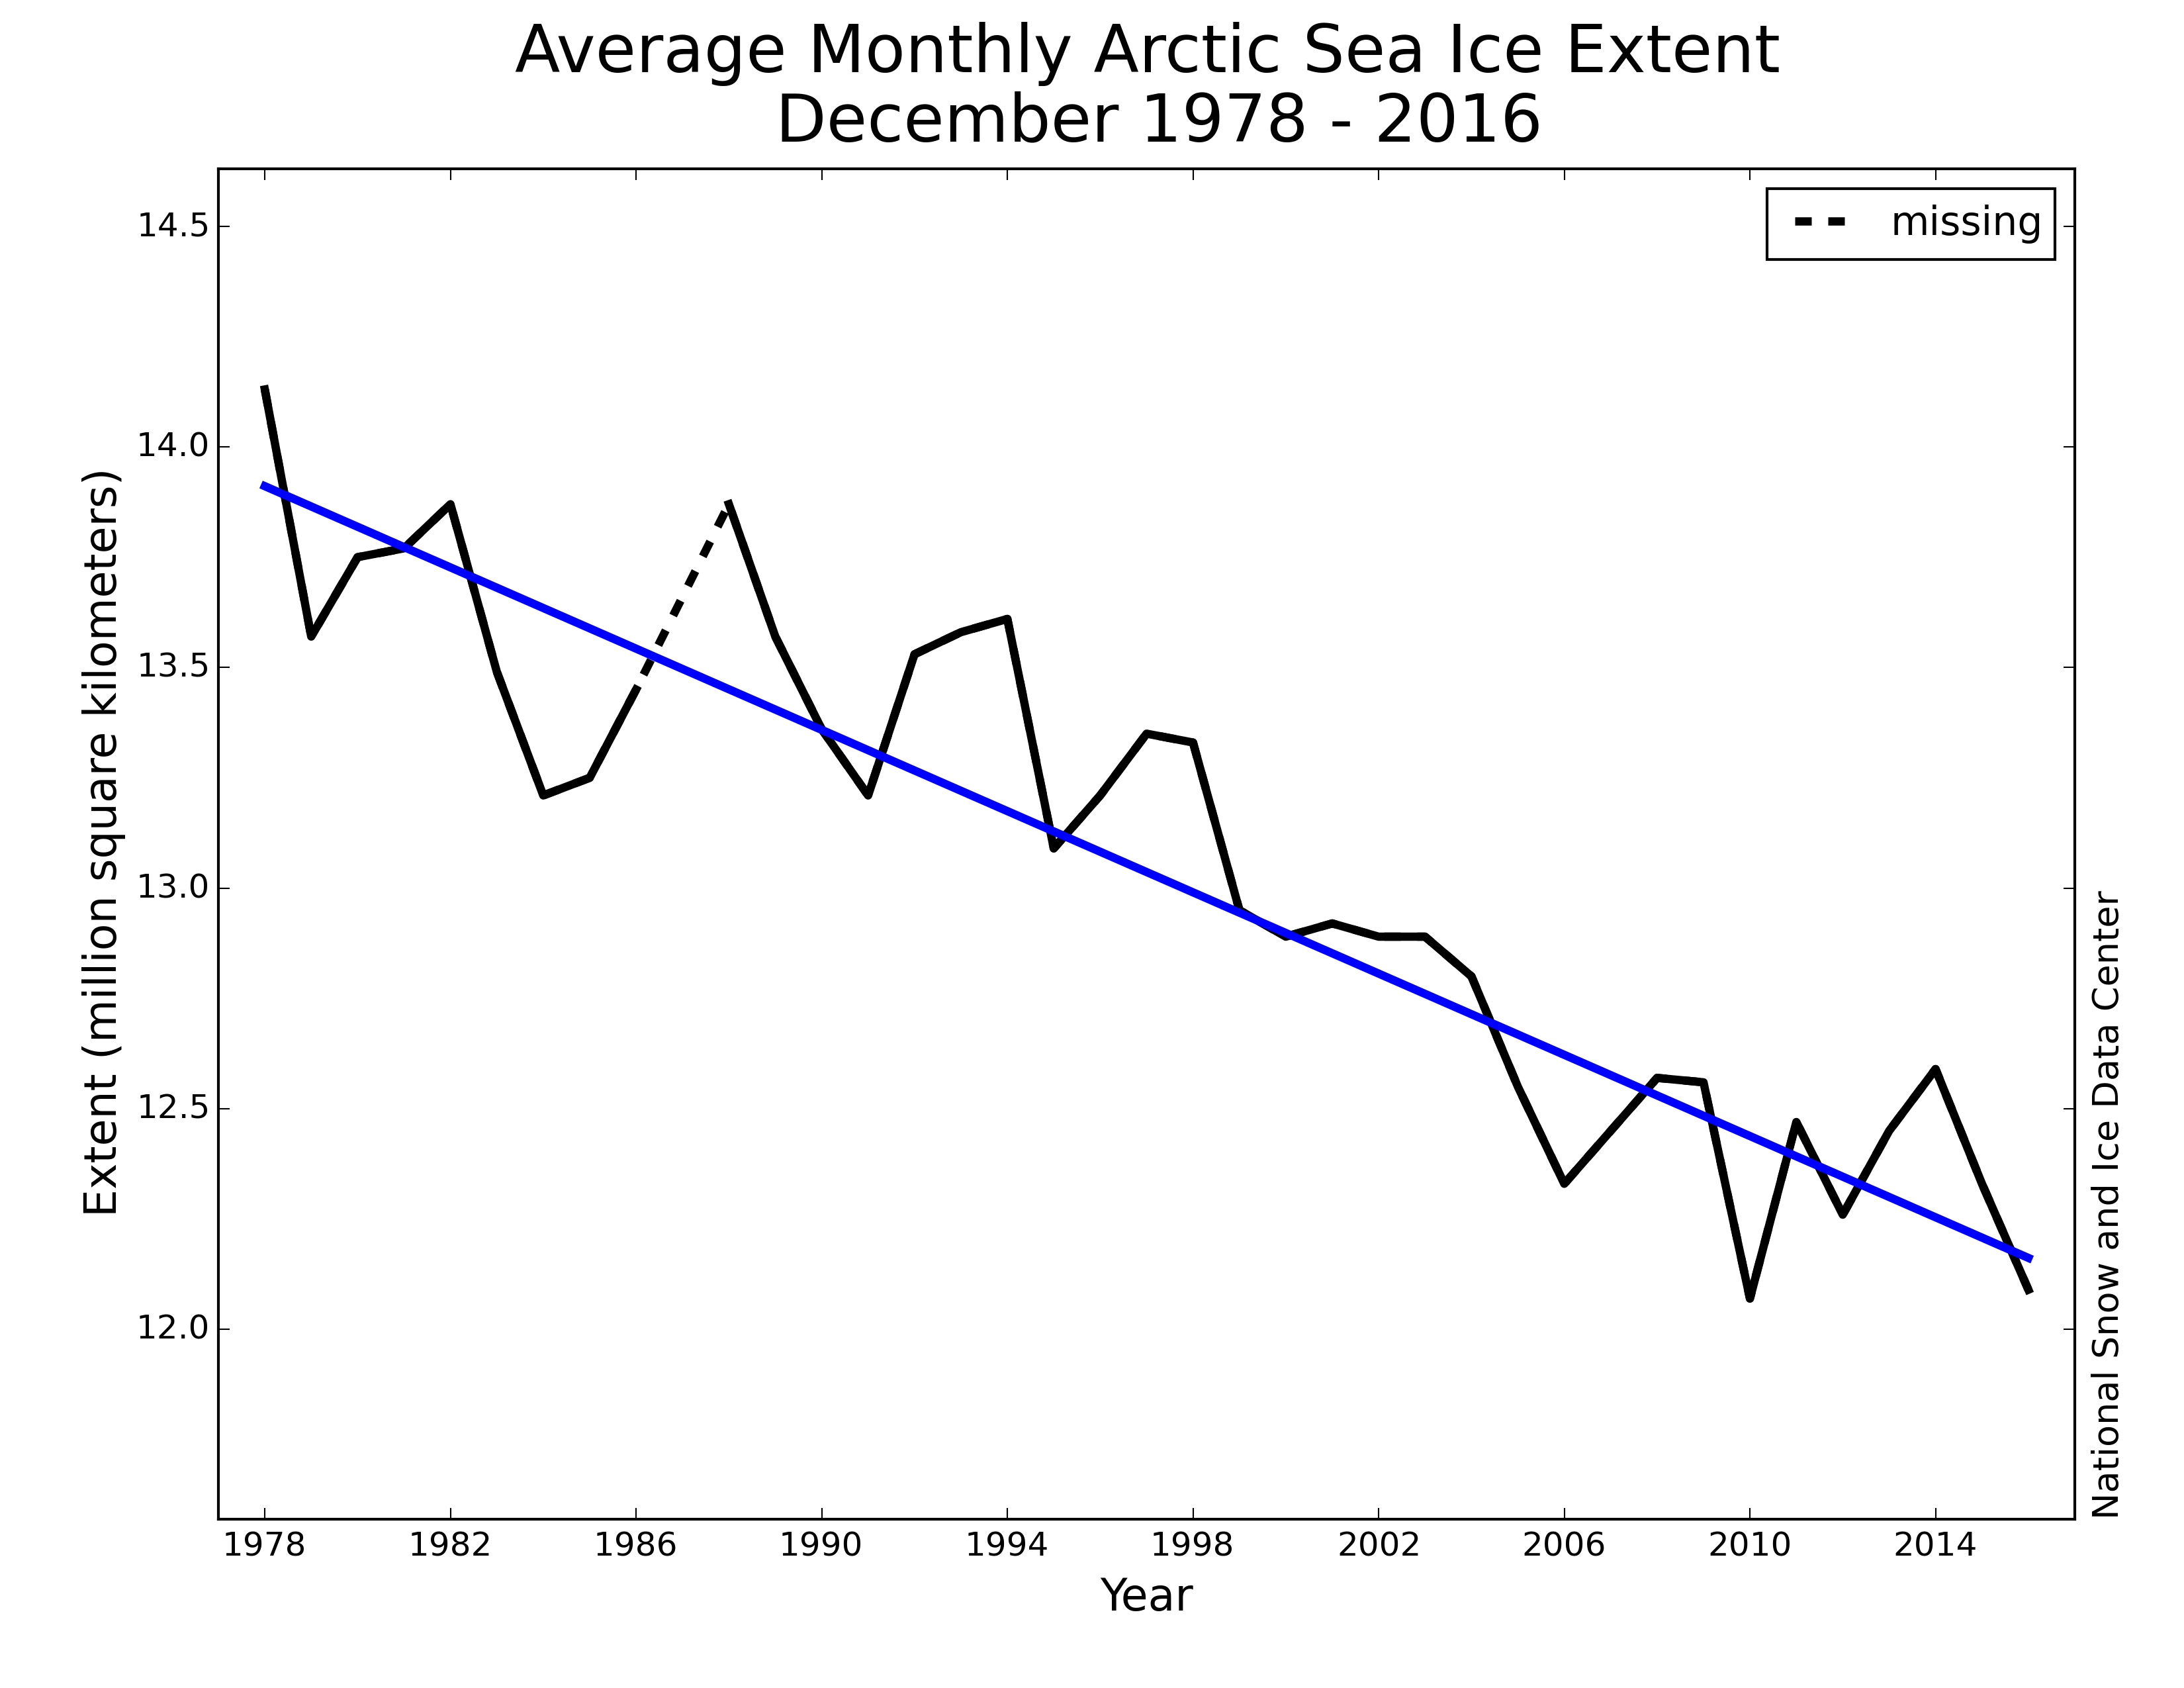
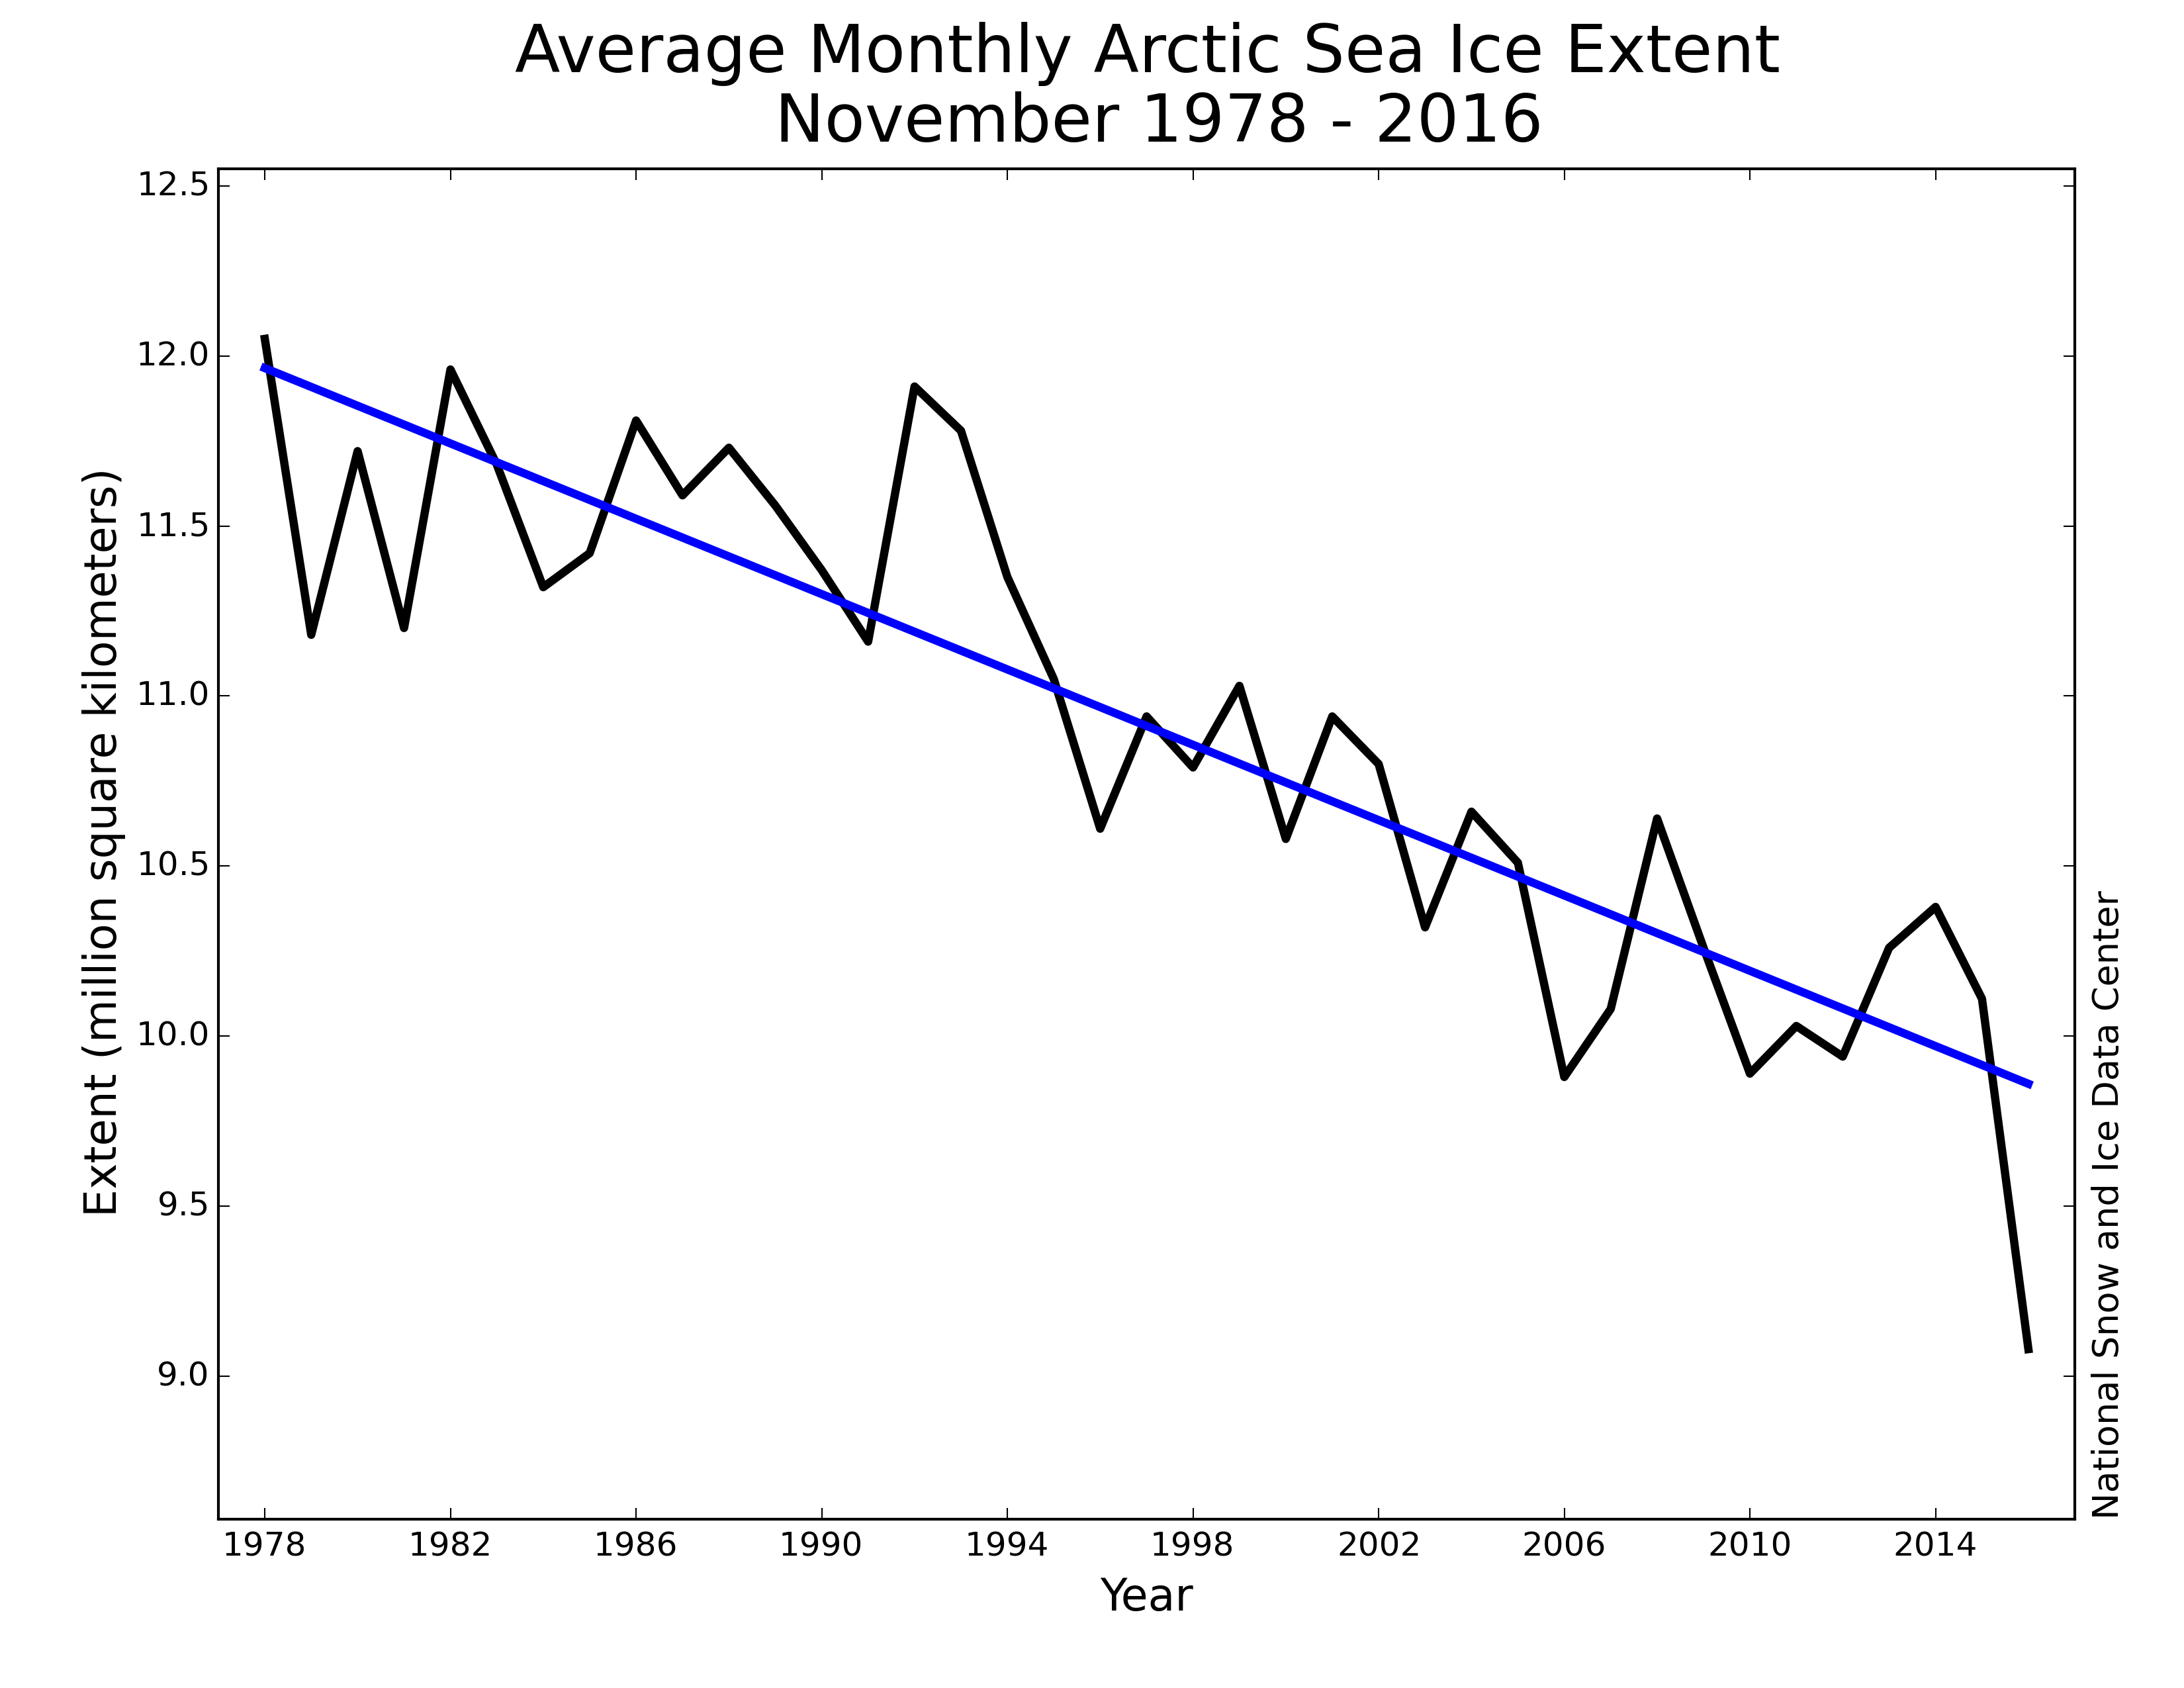
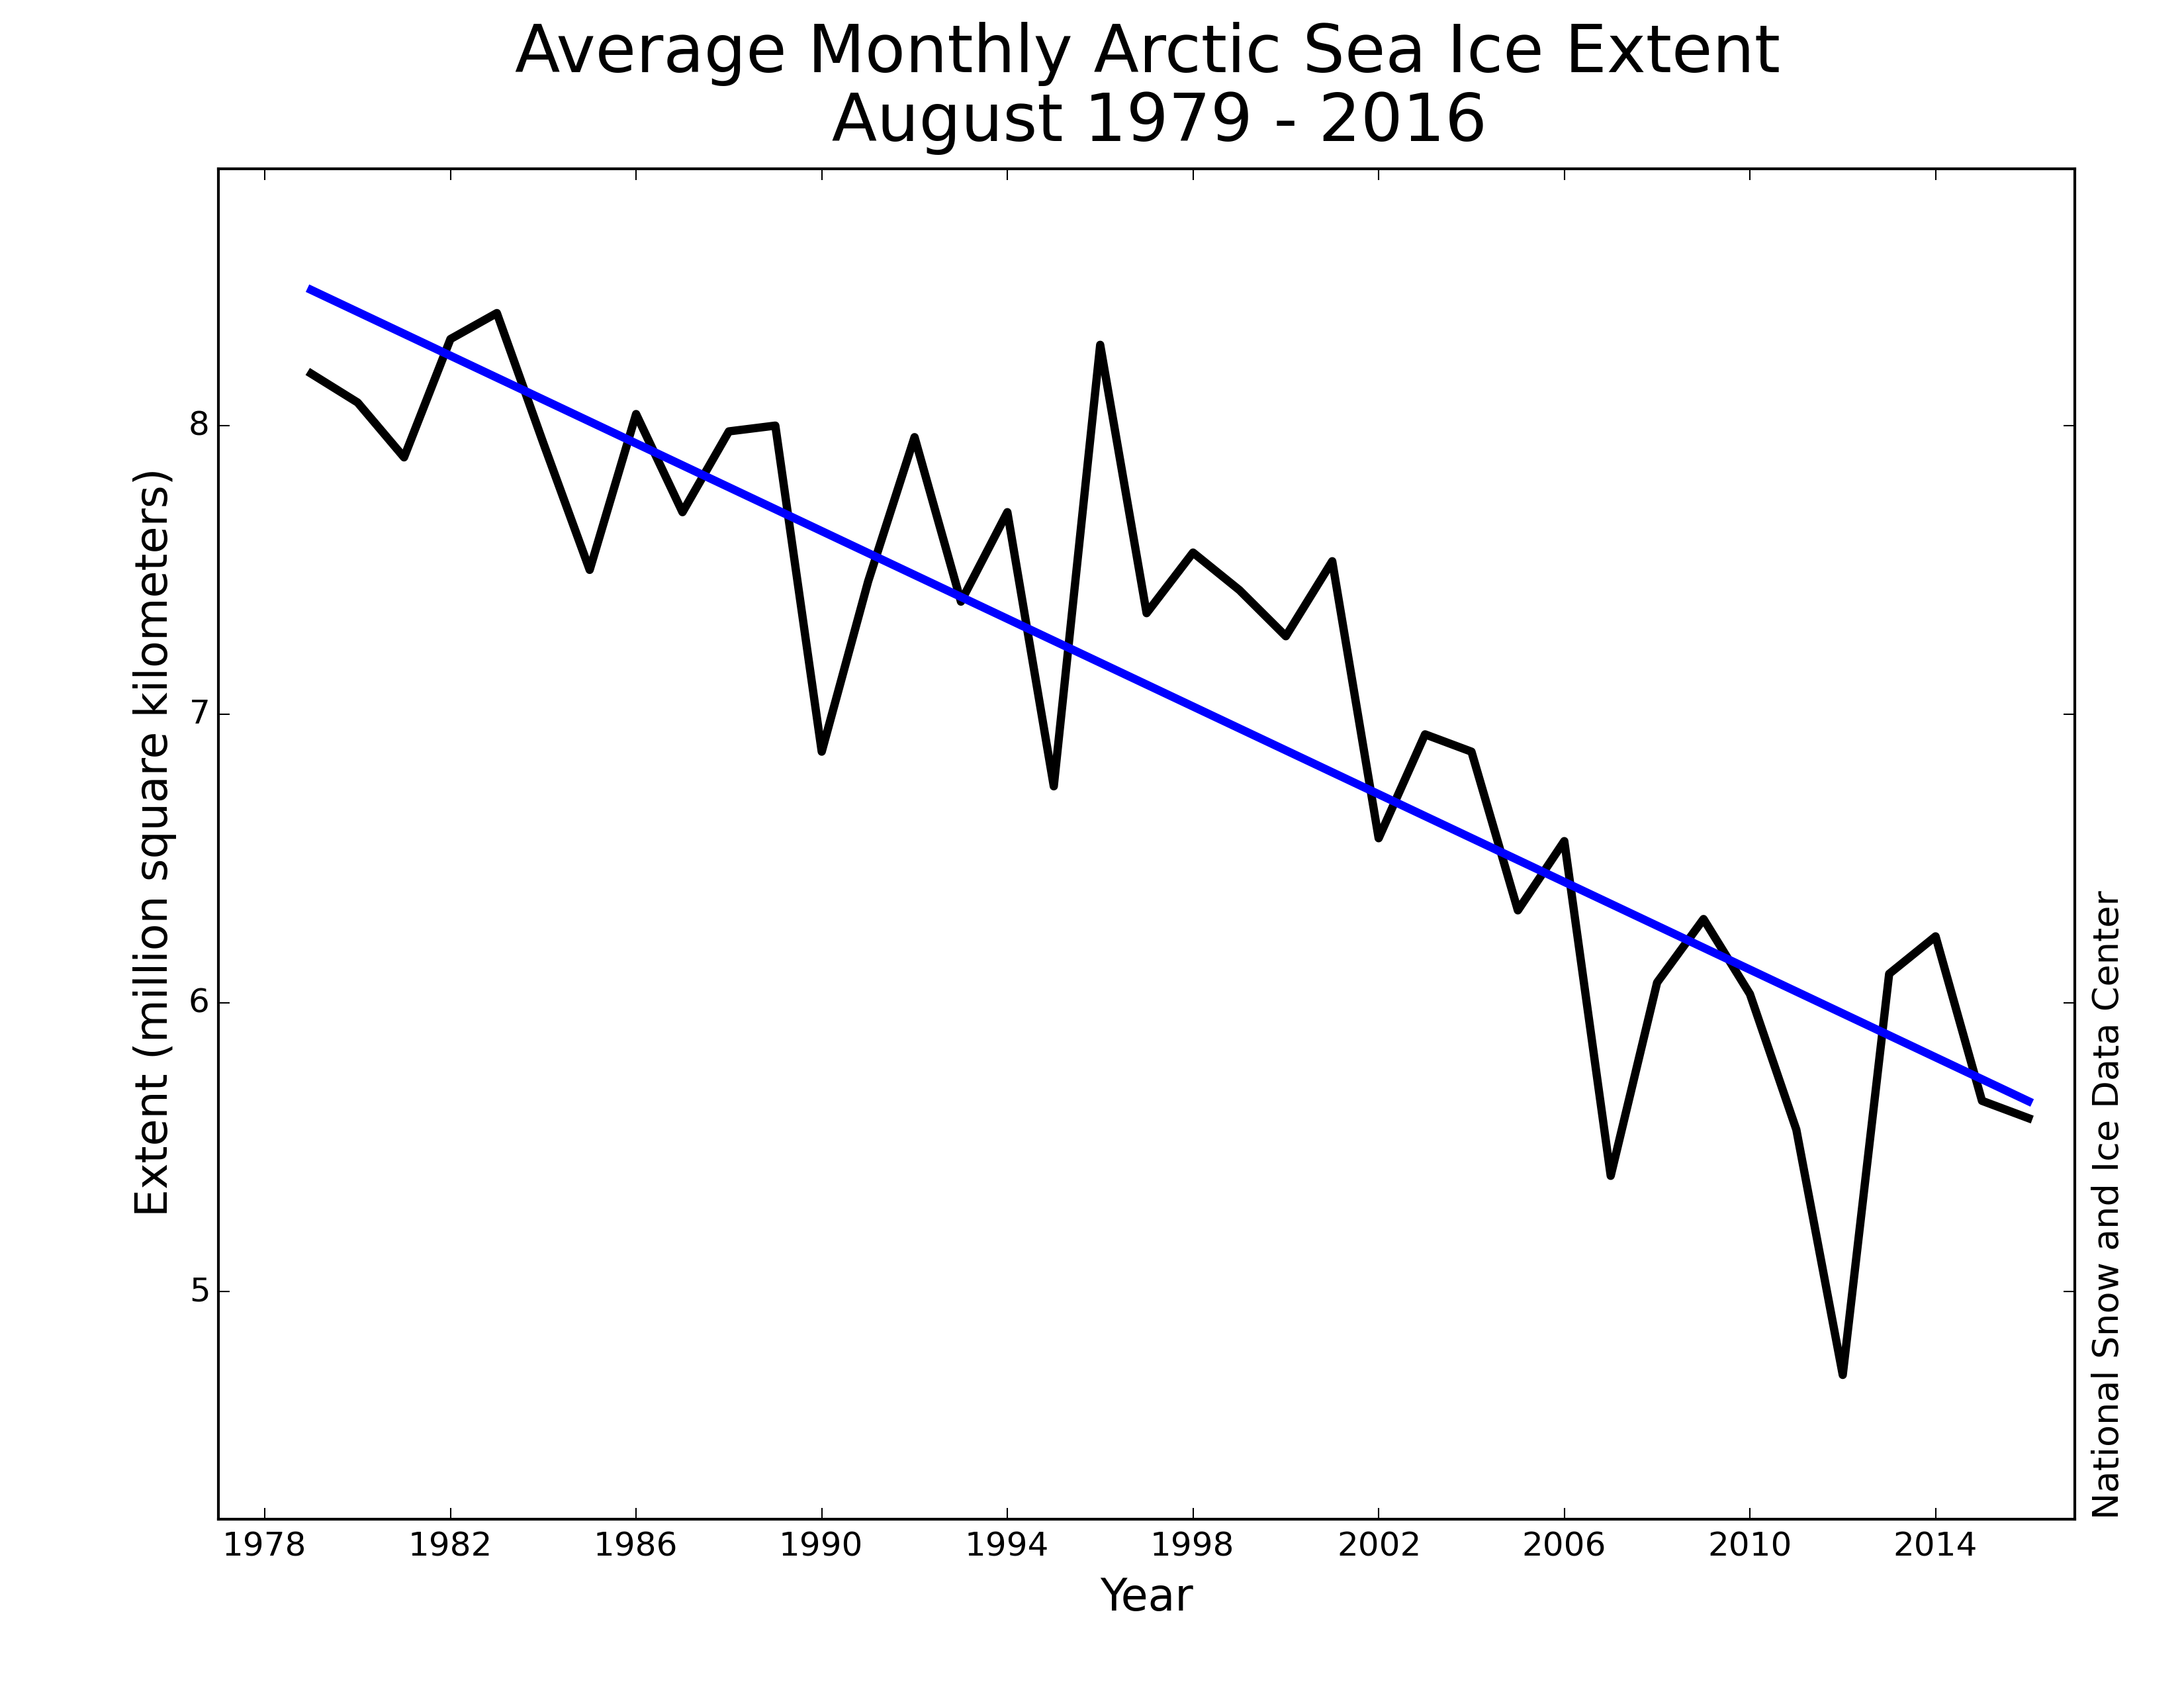
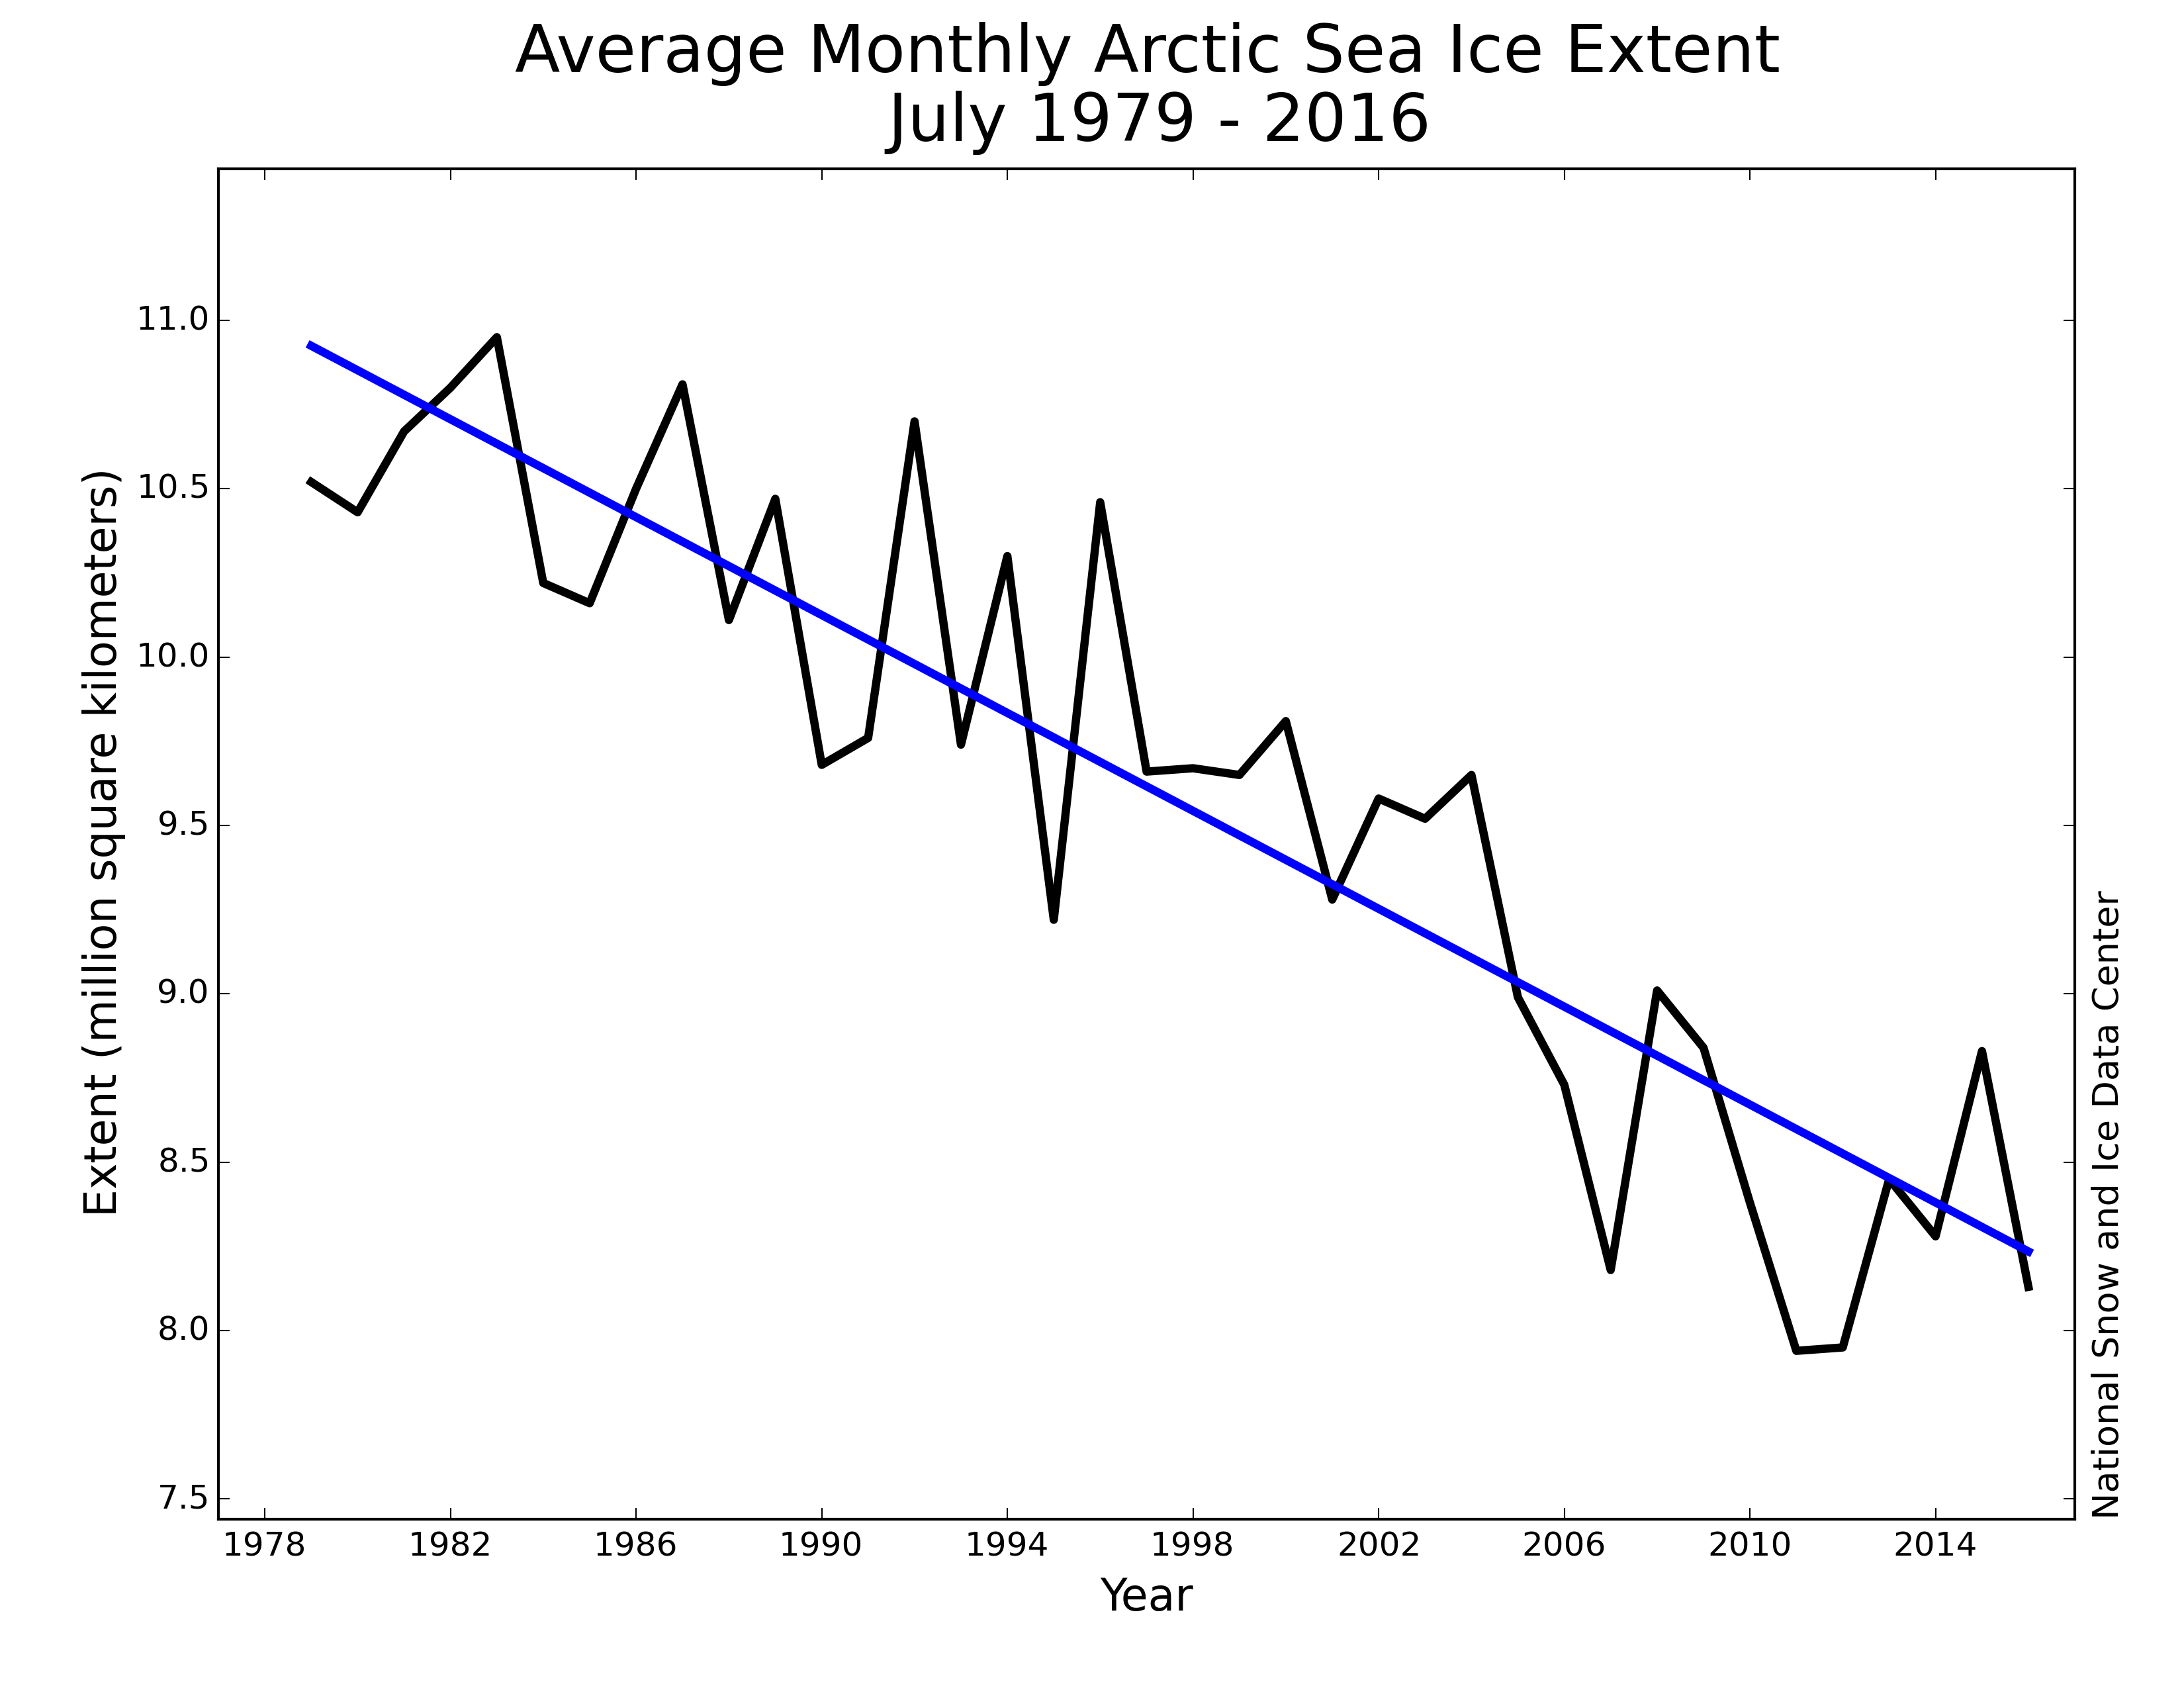
Figure 3. Monthly November ice extent for 1979 to 2016 shows a decline of 5.0 percent per decade.

Credit: National Snow and Ice Data Center
High-resolution image

Through 2016, the linear rate of decline for November is 55,400 square kilometers (21,400 square miles) per year, or 5.0 percent per decade.

Warm Arctic delays ice formation in Svalbard’s fjords

temperature plot

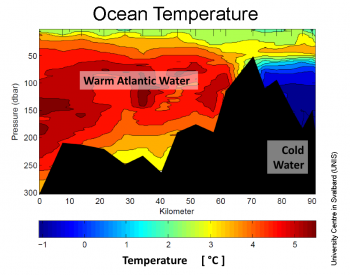
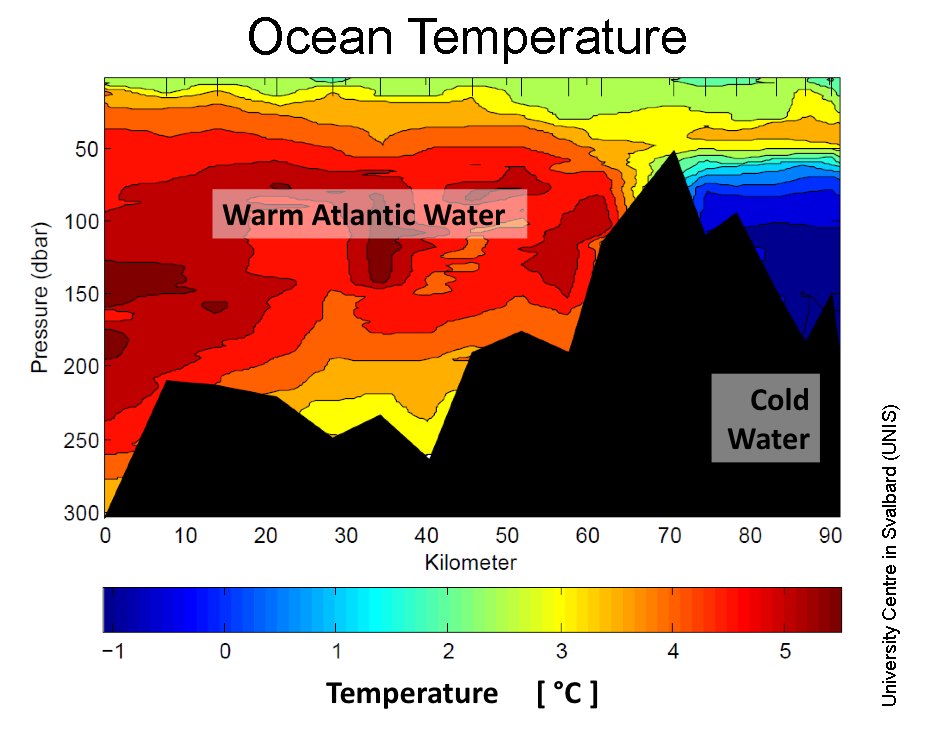
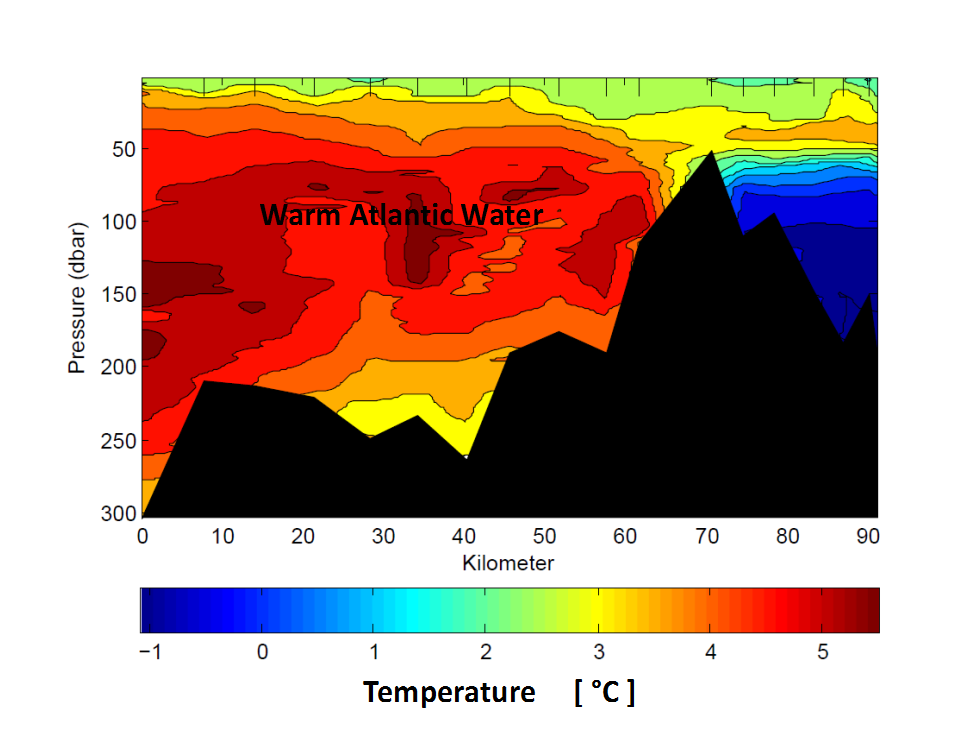
Figure 4a. This plot shows ocean temperature by depth (y axis, in decibars; a decibar is approximately one meter) along a transect (x axis, in kilometers) from the outer continental shelf to the inner parts of Isfjorden, the largest fjord in the Svalbard archipelago, for mid November 2016. (Areas in black show the undersea topography.) Atlantic Water is as warm as 5 degrees Celsius (41 degrees Fahrenheit) and the surface layer still about 2 degrees Celsius (36 degrees Fahrenheit). The surface layer would normally have cooled to the salinity adjusted freezing point at (-1.8 degrees Celsius, 29 degrees Fahrenheit) at this time of year, enabling sea ice formation.

Credit: University Centre in Svalbard
High-resolution image

ocean current map

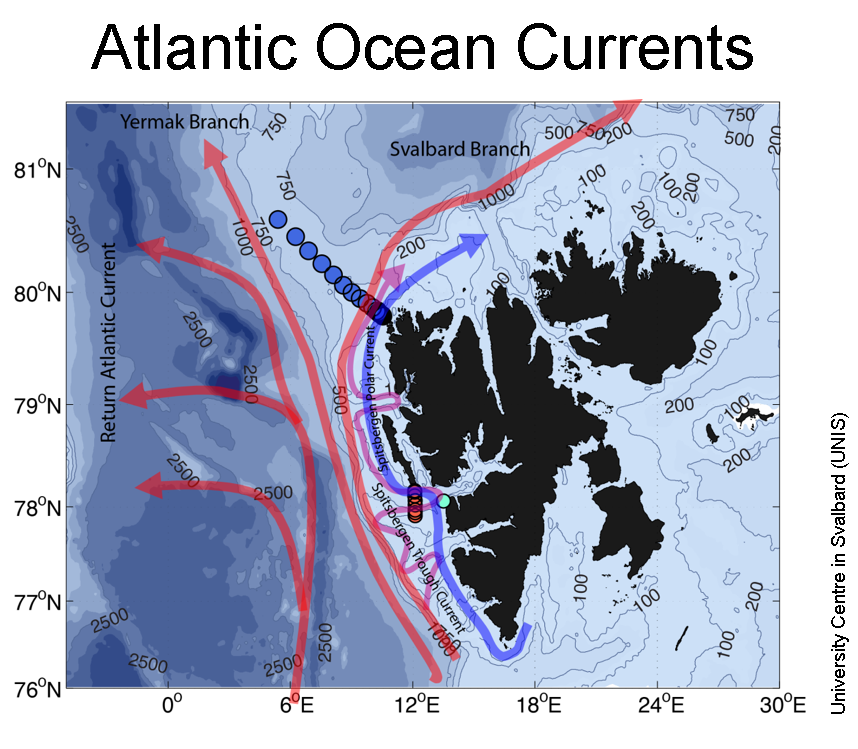
Figure 4b. The West Spitsbergen Current consists of three branches (red arrows) that transport warm and salty Atlantic Water northward: the Return Atlantic Current (westernmost branch), the Yermak Branch and the Svalbard Branch. The Spitsbergen Trough Current (purple) transports Atlantic Water from the Svalbard Branch into the troughs indenting the shelf along Svalbard. Since 2006, changes in atmospheric circulation have resulted in more warm Atlantic Water reaching these fjords. The blue and red circles on the figure indicate locations where hydrographic data were collected.

Credit: University Centre in Svalbard (UNIS)
High-resolution image

photo of moon

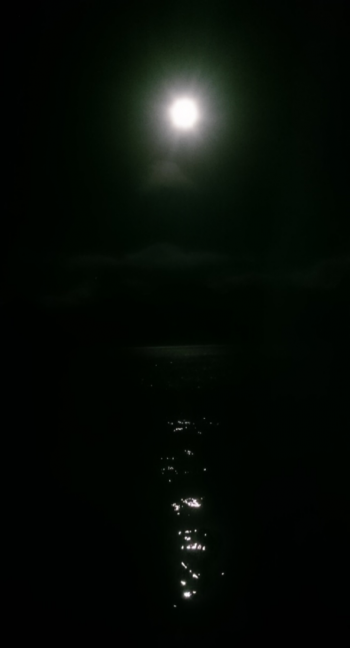
Figure 4c. An inky-black polar night—but no cooling. The moon is the only source of light in the Arctic now, and here shines over open water in Isfjorden, the largest fjord in the Svalbard archipelago, in mid-November 2016.

Credit: Lars H. Smedsrud
High-resolution image

In the Svalbard archipelago, sea ice usually begins to form in the inner parts of the fjords in early November. This November, however, no sea ice was observed. Throughout autumn, the wind pattern transported warm and moist air to Svalbard, leading to exceptionally high air temperatures and precipitation, which fell as rain.

Atmospheric and oceanic conditions in the fjord system were assessed by students from the University Centre in Svalbard. They noted an unusually warm ocean surface layer about 4 degrees Celsius (7 degrees Fahrenheit) above the salinity-adjusted freezing point (Figure 4a). Coinciding with exceptionally high air temperatures over Svalbard during autumn, the water has hardly cooled at all, and it is possible that no sea ice will form this winter.

The above average ocean temperatures arose in part from changes in ocean currents that bring warm and salty Atlantic Water into the fjords. As the warm Gulf Stream moves east, it becomes the branching North Atlantic Drift. One small branch is named the West Spitsbergen Current (Figure 4b). This current flows along the continental shelf on the west coast of Svalbard and is one mechanism for transporting heat towards the fjords. Since 2006, changes in atmospheric circulation have resulted in more Atlantic water reaching these fjords, reducing sea ice production in some and stopping ice formation entirely in others.

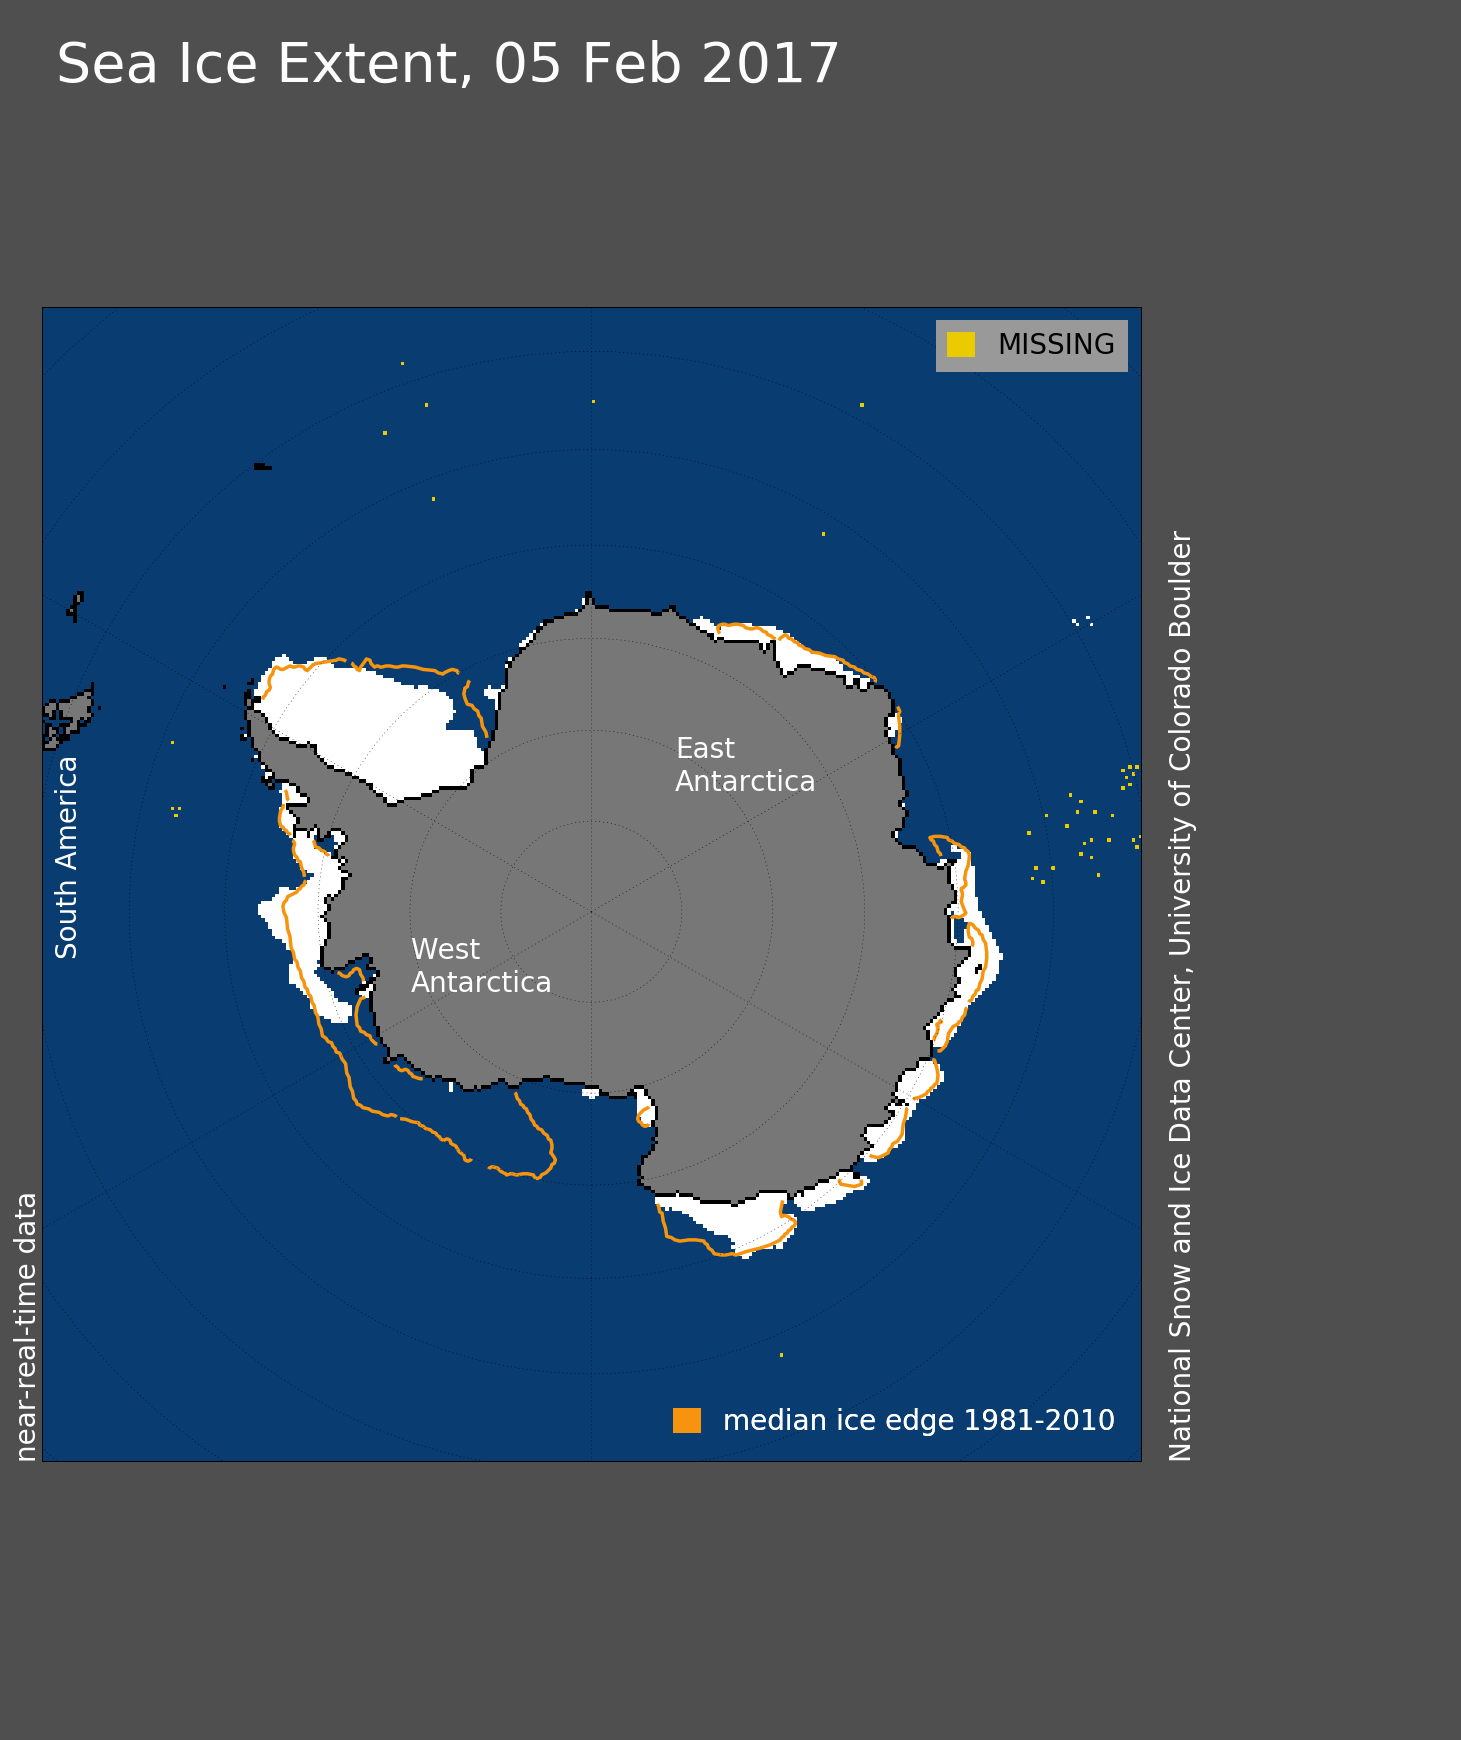
Antarctic sea ice continues to track well below average

ice trend graph

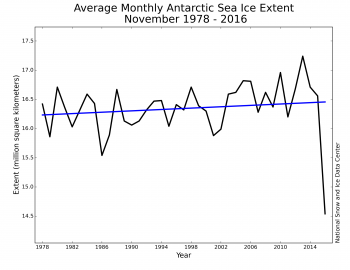
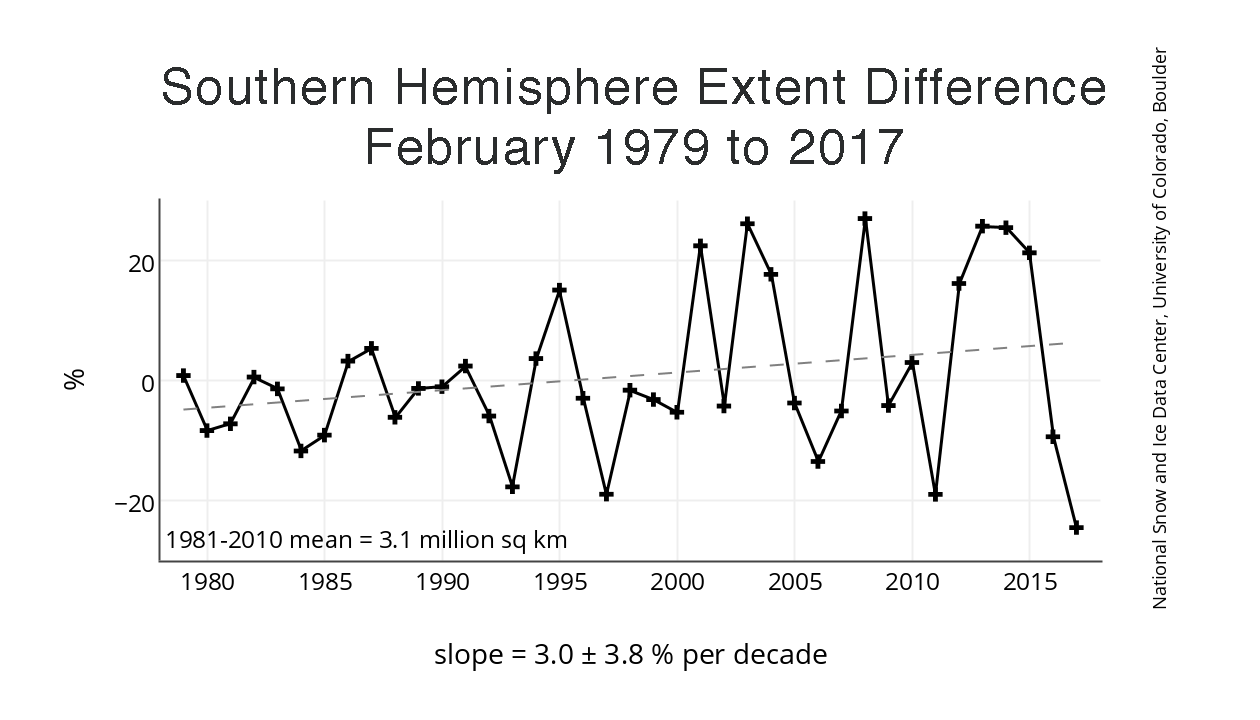
Figure 5a. Monthly November Antarctic sea ice extent for 1979 to 2016 shows an increase of 0.36 percent per decade.

Credit: National Snow and Ice Data Center
High-resolution image

air temperature plot

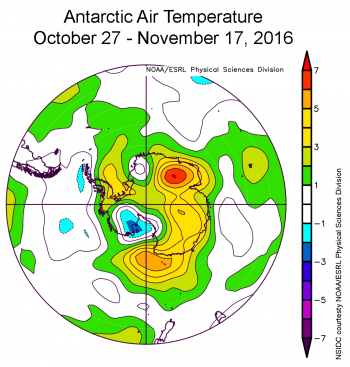
Figure 5b. This plot shows air temperature difference from average in the Antarctic for October 27 to November 17, 2016. Air temperatures at the 925 hPa level (approximately 2,500 feet) during the period of rapid sea ice decline in Antarctica (October 27 through November 17) were 2 to 4 degrees Celsius (4 to 7 degrees Fahrenheit) above average near the sea ice edge.

Credit: NSIDC courtesy NOAA/ESRL Physical Sciences Division
High-resolution image

ice concentration anomaly plot

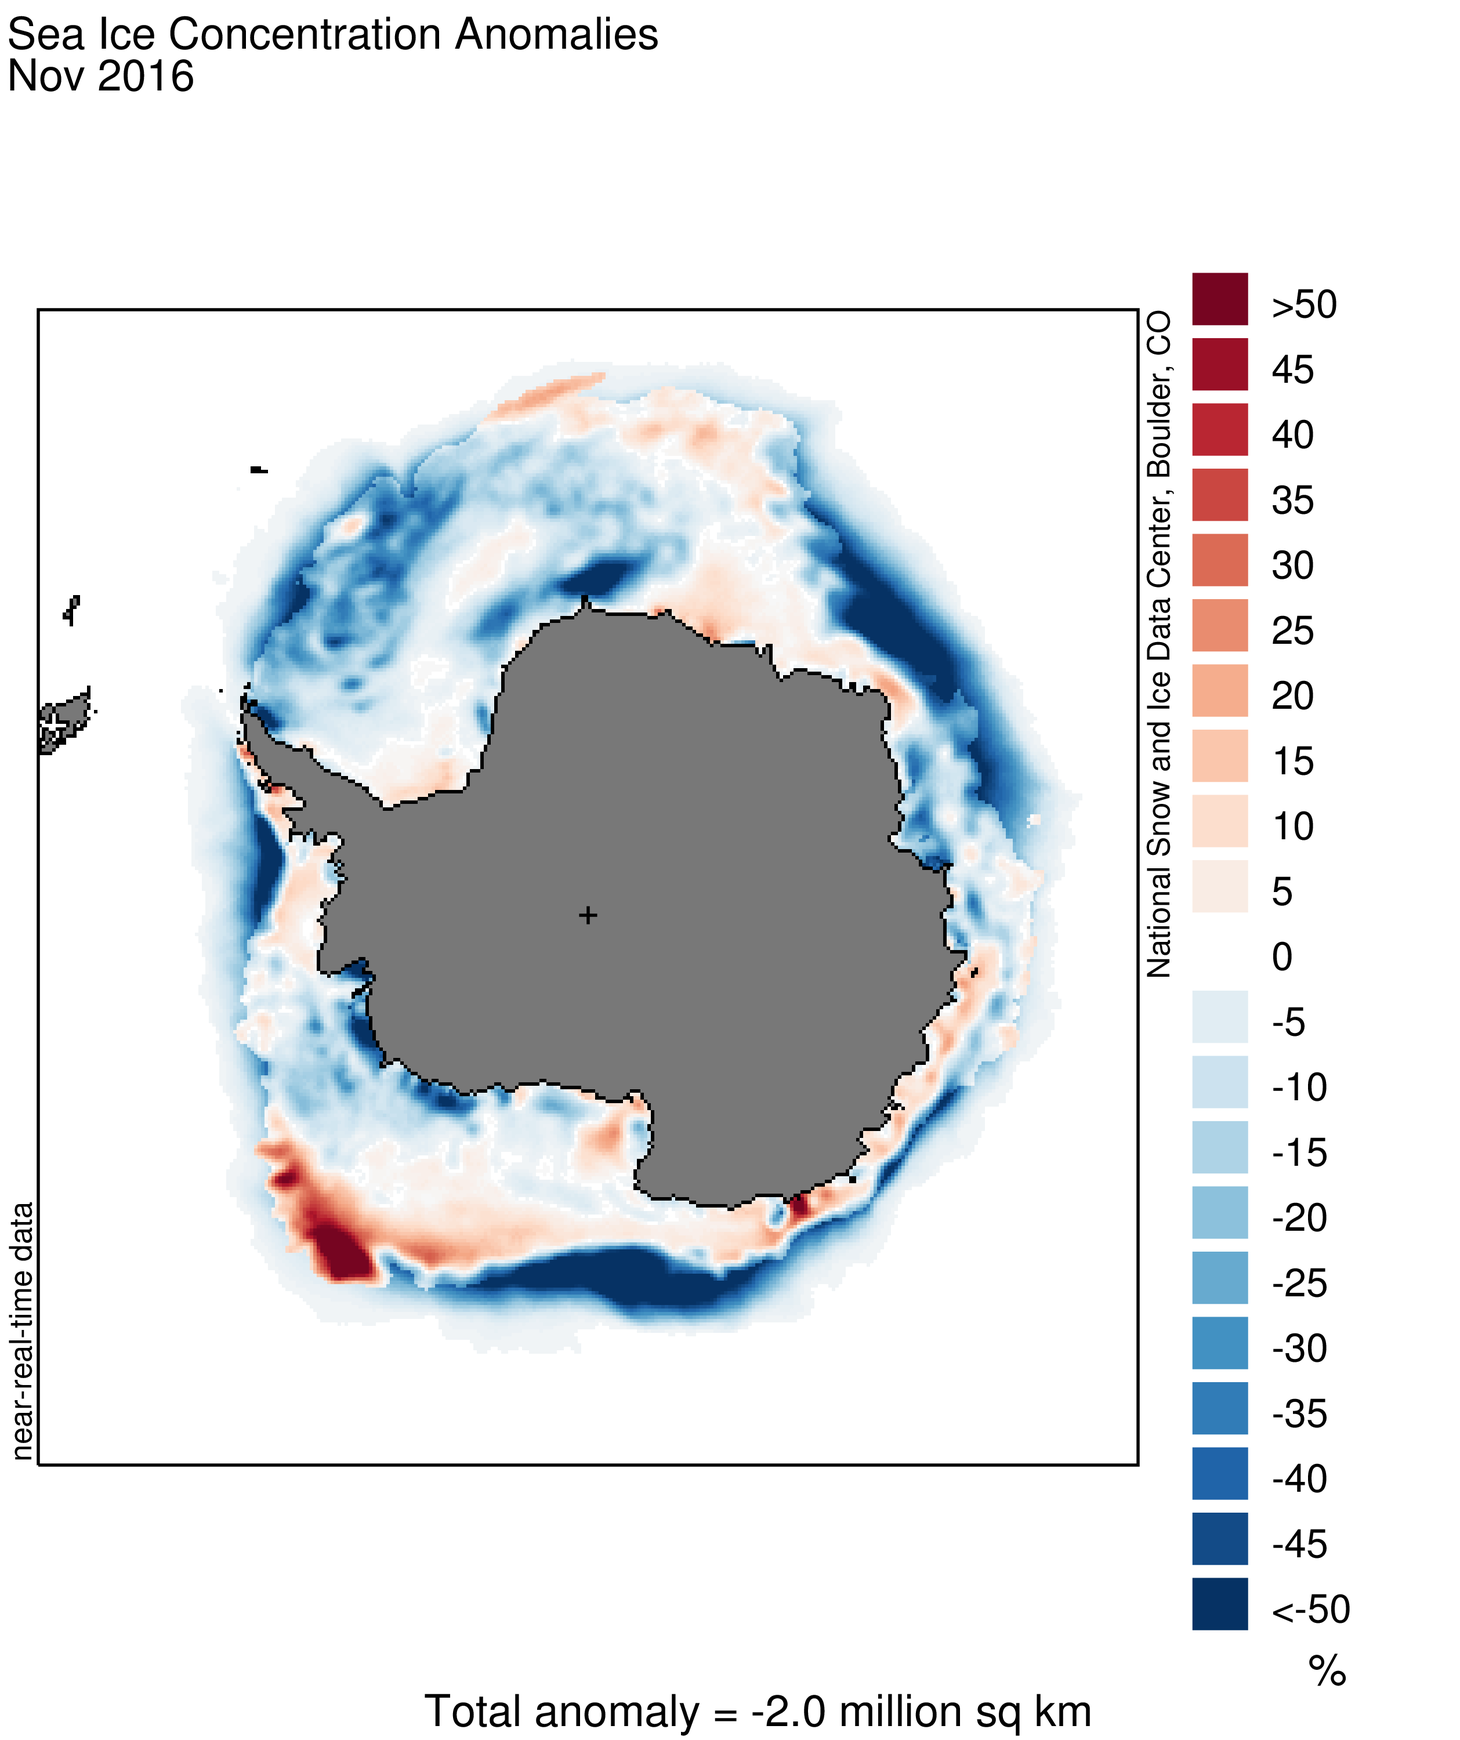
Figure 5c. This map of sea ice concentration difference from average for November 2016 shows very low ice extent in three areas of the ice edge (near the Antarctic Peninsula, near the western Ross Sea and Wilkes Land, and near Enderby Land) as well as extensive areas of lower-than-average concentration within the interior ice pack in the Weddell Sea, Amundsen Sea, and near the Amery Ice Shelf. Sea Ice Index data.

Credit: National Snow and Ice Data Center
High-resolution image

This year, Antarctic sea ice reached its annual maximum extent on August 31, much earlier than average, and has since been declining at a fairly rapid pace, tracking more than two standard deviations below the 1981 to 2010 average. This led to a new record low for the month of November over the period of satellite observations (Figure 5a). Average extent in November was 14.54 million square kilometers (5.61 million square miles). This was 1.0 million square kilometers (386,000 square miles) below the previous record low of 15.54 million square kilometers (6.00 million square miles) set in 1986 and 1.81 million square kilometers (699,000 square miles) below the 1981 to 2010 average.

For the month, Antarctic ice extent was 5.7 standard deviations below the long-term average. This departure from average was more than twice as large as the previous record departure from average, set in November 1986.

Ice extent is lower than average on both sides of the continent, particularly within the Indian Ocean and the western Ross Sea, but also to a lesser extent in the Weddell Sea and west of the Antarctic Peninsula in the eastern Bellingshausen Sea. Moreover, several very large polynyas (areas of open water within the pack) have opened in the eastern Weddell and along the Amundsen Sea and Ross Sea coast.

Air temperatures at the 925 mbar level were 2 to 4 degrees Celsius (4 to 7 degrees Fahrenheit) above average near the sea ice edge during late October and early November, corresponding to the period of rapid sea ice decline (Figure 5b).

The entire austral autumn and winter (since March 2016) was characterized by generally strong west to east winds blowing around the continent. This was associated with a positive phase of the Southern Annular Mode, or SAM. This pattern tends to push the ice eastward, but the Coriolis force acting in the ice adds a component of northward drift. During austral spring (September, October and November), the SAM index switched from strongly positive (+4 in mid-September, a record) to negative (-2.8 in mid-November). When the westerly wind pattern broke down in November, winds in several areas of Antarctica started to blow from the north. Over a broad area near Wilkes Land, the ice edge was pushed toward the continent. Areas with southward winds were also located between Dronning Maud Land and Enderby Land, and near the Antarctic Peninsula. This created three regions where ice extent quickly became much less extensive than usual (Figure 5c), reflected in the rapid decline in extent for the Antarctic as a whole. Interspersed with the areas of compressed sea ice and winds from the north, areas of south winds produced large open water areas near the coast, creating the polynyas.

Arctic sea ice loss linked to rising anthropogenic CO2 emissions

co2 plot

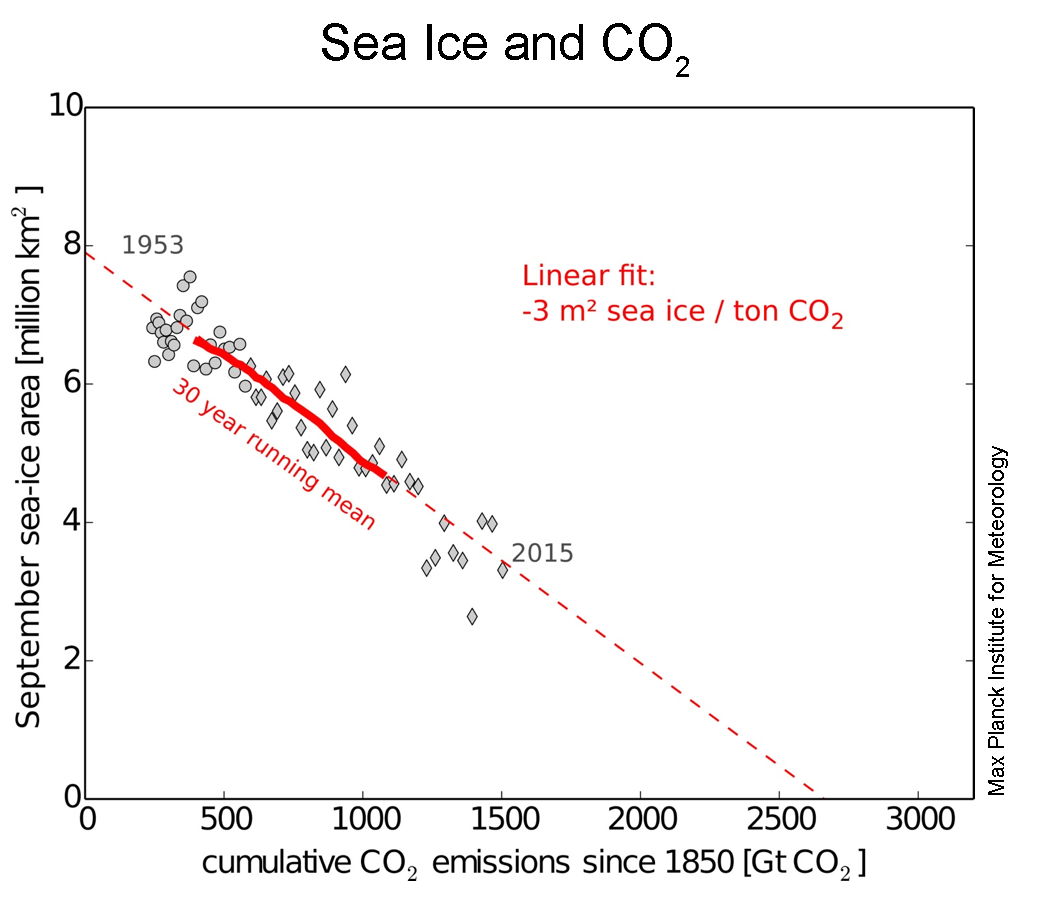
Figure 6. This plot shows the relationship between September sea ice extent (1953 to 2015) and cumulative CO2 emissions since 1850. Grey diamonds represent the individual satellite data values; circles represent pre-satellite era values; the solid red line shows the 30-year running average. The dotted red line indicates the linear relationship of 3 square meters per metric ton of CO2.

Credit: D. Notz, Max Planck Institute for Meteorology High-resolution image

A new study published in the journal Science links Arctic sea ice loss to cumulative CO2 emissions in the atmosphere through a simple linear relationship (Figure 6). Researchers conducting the study, including NSIDC scientist Julienne Stroeve, examined this linear relationship based on observations from the satellite and pre-satellite era since 1953, and in climate models. The observed relationship is equivalent to a loss of 3 square meters (32 square feet) for every metric ton of CO2 added to the atmosphere, compared the average from all the climate models of 1.75 square meters (19 square feet). This smaller value, or lower sensitivity, from the models is consistent with findings that the models tend to be generally conservative relative to observations in regard to how fast the Arctic has been losing its summer ice cover. The observed rate of ice loss per metric ton of CO2 allows individuals to more easily grasp their contribution to Arctic sea ice loss.

Global sea ice far below average

sea ice extent plot

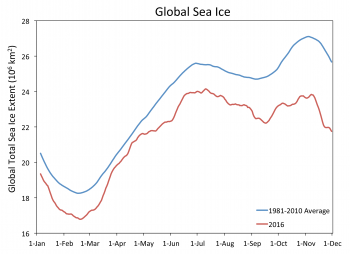
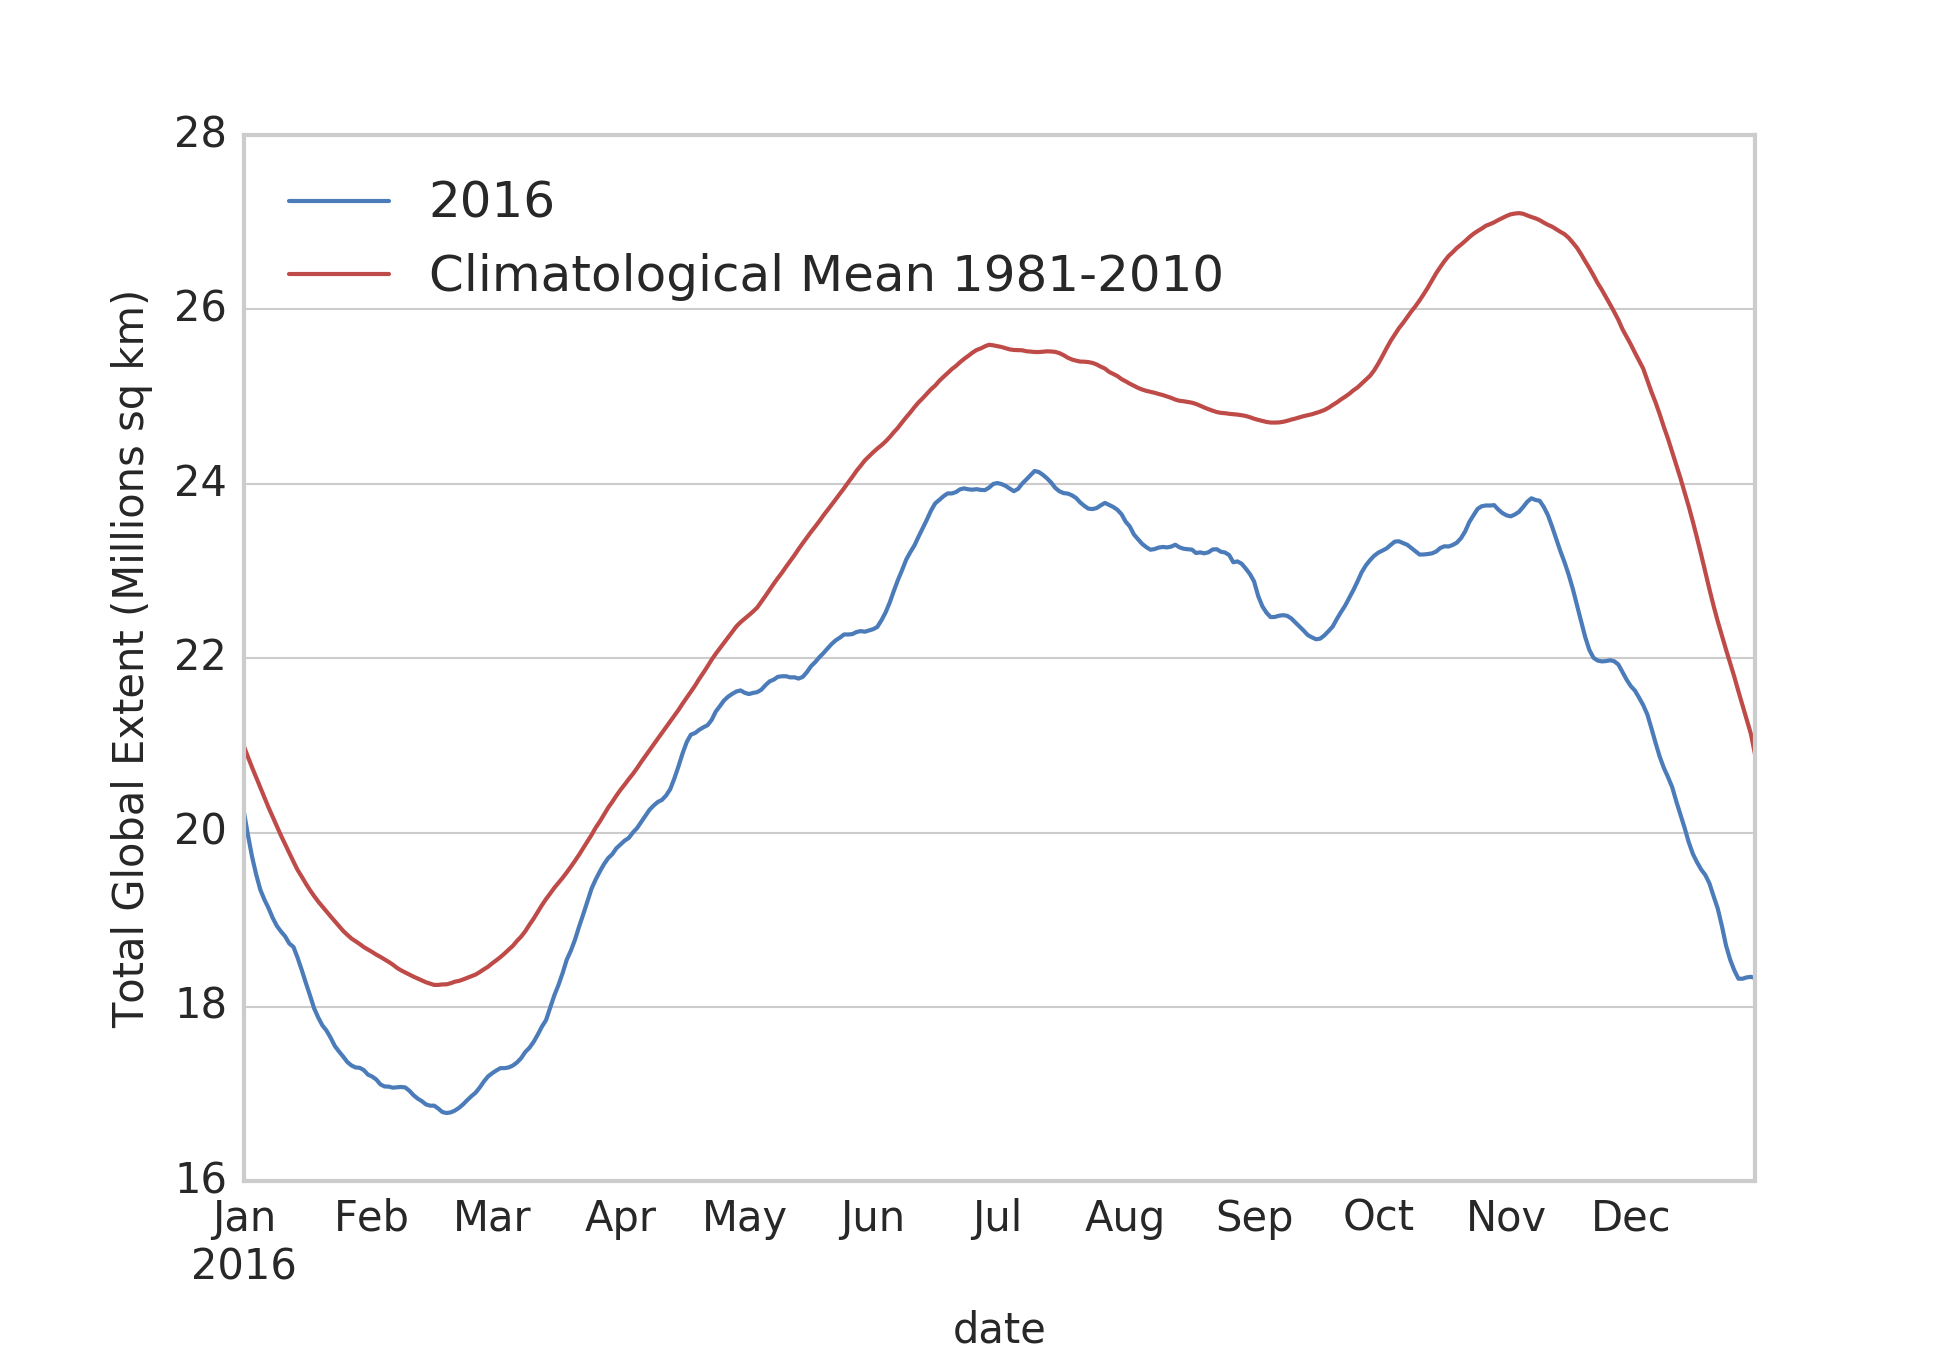
Figure 7. This time series of daily global sea ice extent (Arctic plus Antarctic, month and first day of month on the x axis) shows global extent tracking below the 1981 to 2010 average. Sea Ice Index data.

Credit:W. Meier, NASA Cryospheric Sciences, GSFC
High-resolution image

As a result of both Arctic and Antarctic sea ice currently tracking at record low levels, global ice extent near November’s end stood at 7.3 standard deviations below average (Figure 7). However, the processes governing the evolution of sea ice in both hemispheres is a result of different atmospheric and oceanic processes and geographies and it unlikely that record low conditions in the two hemispheres are connected. Also, it is not especially instructive to assess a global sea ice extent because the seasons are opposite in the two hemispheres. In November the Arctic is in its ice growth season while Antarctic is losing ice. Antarctic sea ice as a whole has slightly increased over the past four decades (but with the last two austral winters having average and below average extent, respectively). The slight overall increase in Antarctic ice over the satellite record can be broadly linked to wind patterns that have helped to expand the ice cover towards the north (towards the equator).

NASA Operation IceBridge completes its 2016 Antarctic campaign

sea ice photo

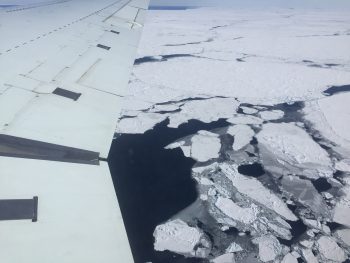
Figure 8. This photograph from Operation IceBridge shows broken floes of sea ice floating in the Weddell Sea. A large area of open water can be seen on the horizon.

Credit: J. Beitler/National Snow and Ice Data Center
High-resolution image

In October, four NSIDC personnel accompanied the NASA Operation IceBridge campaign on its airborne surveys over Antarctica. The campaign completed a total of 24 flights over the continent in October and November, covering sea ice, land ice, ice shelves, and glaciers as Antarctica headed into its austral summer. Missions surveyed sea ice in the Weddell and Bellinghausen Seas with instruments that measure both sea ice extent and thickness. These measurements add to a time series of data that measures changes in sea ice and helps researchers assess the future trajectory of the ice pack and its impact on the climate. Visual observations from the flights confirmed that areas in the Bellingshausen Sea that are typically covered in sea ice were open water this year.

One of this year’s missions flew over a massive rift in the Antarctic Peninsula’s Larsen C Ice Shelf. Ice shelves are the floating parts of ice streams and glaciers, and they buttress the grounded ice behind them; when ice shelves collapse, the ice behind accelerates toward the ocean, where it then adds to sea level rise. Larsen C neighbors a smaller ice shelf that disintegrated in 2002 after developing a rift similar to the one now growing in Larsen C.

The IceBridge scientists measured the Larsen C fracture to be about 70 miles long, more than 300 feet wide and about a third of a mile deep. The crack completely cuts through the ice shelf but it does not go all the way across it. Once it does, it will produce an iceberg roughly the size of the state of Delaware.

The mission of Operation IceBridge is to collect data on changing polar land and sea ice and maintain continuity of measurements between NASA’s Ice, Cloud and Land Elevation Satellite (ICESat) missions. The original ICESat mission ended in 2009, and its successor, ICESat-2, is scheduled for launch in 2018. Operation IceBridge, which began in 2009, is currently funded until 2019. The planned overlap with ICESat-2 will help scientists validate the satellite’s measurements.

Further reading

Nilsen, F., Skogseth, R., Vaardal-Lunde, J., and Inall, M. 2016. A simple shelf circulation model: Intrusion of Atlantic Water on the West Spitsbergen Shelf. J. Physical Oceanography, 46, 1209-1230. doi:10.1175/JPO-D-15-0058.1

Notz, D. and J. Stroeve. 2016. Observed Arctic sea-ice loss directly follows anthropogenic CO2 emission. Science, 11 Nov 2016: Vol. 354, Issue 6313, pp. 747-750. doi:10.1126/science.aag2345.

Parkinson, C. 2014. Global sea ice coverage from satellite data: Annual cycle and 35-year trends. Journal of Climate, December 2014. doi:10.1175/JCLI-D-14-00605.1.

References

Fetterer, F., K. Knowles, W. Meier, and M. Savoie. 2016, updated daily. Sea Ice Index, Version 2. Boulder, Colorado USA. NSIDC: National Snow and Ice Data Center. doi:10.7265/N5736NV7.


Sluggish ice growth in the Arctic

After a quick initial freeze-up during the second half of September, ice growth slowed substantially during early October. On October 20, 2016, Arctic sea ice extent began to set new daily record lows for this time of year. After mid-October, ice growth returned to near-average rates, but extent remained at record low levels through late October. High sea surface temperatures in open water areas were important in limiting ice growth. October air temperatures were also unusually high, and this warmth extended from the surface through a considerable depth of the atmosphere.

Overview of conditions

Figure 1. Arctic sea ice extent for October 2016 was 6.40 million square kilometers (2.5 million square miles). The magenta line shows the 1981 to 2010 median extent for that month.

Figure 1. Arctic sea ice extent for October 2016 was 6.40 million square kilometers (2.5 million square miles). The magenta line shows the 1981 to 2010 median extent for that month. The black cross indicates the geographic North Pole. Sea Ice Index data. About the data

Credit: National Snow and Ice Data Center
High-resolution image

In October 2016, Arctic sea ice extent averaged 6.40 million square kilometers (2.5 million square miles), the lowest October in the satellite record. This is 400,000 square kilometers (154,400 square miles) lower than October 2007, the second lowest October extent, and 690,000 square kilometers (266,400 square miles) lower than October 2012, the third lowest. The average extent was 2.55 million square kilometers (980,000 square miles) below the October 1981 to 2010 long-term average.

As of early November, extent remains especially low within the Beaufort, Chukchi, East Siberian, and Kara Seas. Since the beginning of October, ice growth occurred primarily in the Laptev Sea, stretching from the New Siberian Islands towards the coast. Little ice growth occurred in the Kara and Barents Seas, while ice extent increased in the Chukchi and Beaufort Seas.

Conditions in context

Figure 2a. The graph above shows Arctic sea ice extent as of November 1, 2016, along with daily ice extent data for four previous years. 2016 is shown in blue, 2015 in green, 2014 in orange, 2013 in brown, and 2012 in purple. The 1981 to 2010 average is in dark gray. The gray area around the average line shows the two standard deviation range of the data

Figure 2a. The graph above shows Arctic sea ice extent as of November 1, 2016, along with daily ice extent data for four previous years. 2016 is shown in blue, 2015 in green, 2014 in orange, 2013 in brown, and 2012 in purple. The 1981 to 2010 average is in dark gray. The gray area around the average line shows the two standard deviation range of the data. Sea Ice Index data.

Credit: National Snow and Ice Data Center
High-resolution image

Figure 2b. Sea surface temperatures were unusually high over the Chukchi and Beaufort seas, as well as the Barents and Kara seas along the Eurasian coast, helping to limit ice growth. This figure shows conditions on October 25, 2016.

Figure 2b. Sea surface temperatures (SSTs) in October were unusually high over the Chukchi and Beaufort Seas, as well as the Barents and Kara Seas along the Eurasian coast, helping to limit ice growth. This figure shows SSTs on October 25, 2016.

Credit: Climate Change Institute/University of Maine
High-resolution image

Figure 2c. Air temperatures at the 925 hPa level were usually high over the Beaufort and Chukchi seas and the East Greenland Sea (up to 8 degrees Celsius or 14 degrees Fahrenheit above average).

Figure 2c. Air temperatures at the 925 hPa level were usually high over the Beaufort and Chukchi Seas and the East Greenland Sea (up to 8 degrees Celsius or 14 degrees Fahrenheit above average).

Credit: NSIDC courtesy NOAA Earth System Research Laboratory Physical Sciences Division
High-resolution image

Figure 2d. This latitude by height cross section shows that for the Arctic as a whole, air temperatures were above average not just at or near the surface but through a deep later of the atmosphere. This manifest the combined effects of high sea surface temperatures in open water areas and the effects of atmospheric circulation drawing warm air into the region.

Figure 2d. This latitude by height cross section shows that for the Arctic as a whole, air temperatures were above average not just at and near the surface but through a deep layer of the atmosphere. This resulted from the combined effects of high sea surface temperatures in open water areas and the effects of atmospheric circulation drawing warm air into the region.

Credit: NSIDC courtesy NOAA Earth System Research Laboratory Physical Sciences Division
High-resolution image

After an early rapid freeze-up in late September, the rate of ice growth slowed in the first half of October. From October 1 to 15, ice extent increased only 378,000 square kilometers (146,000 square miles), less than a third of the 1981 to 2010 average gain for that period. By October 31, Arctic sea ice extent stood at 7.07 million square kilometers (2.73 million square miles), the lowest extent in the satellite record for that date.

A primary culprit behind the slow growth is that sea surface temperatures in the Beaufort and Chukchi Seas, the Barents and Kara Seas along the Eurasian coast, as well as the East Siberian Sea, were above average. The open water areas in the highest latitudes at the date of the minimum in September had only recently formed and there was little input of solar radiation so far north. So those waters were just above the freezing point. When the atmosphere cooled in September, ice formed rapidly. However, further south, the sea ice had retreated far earlier in the season and a lot of solar energy was absorbed through the summer. This ocean heat inhibited the growth of ice in these regions. Finally toward the end of October, the surface ocean heat began to dissipate, triggering ice formation. However, even by October 25, sea surface temperatures were above average in these areas (Figure 2b).

The atmospheric circulation also played a role. October air temperatures at the 925 hPa level (about 2,500 feet above sea level) were unusually high over most of the Arctic Ocean (Figure 2c), especially over the Beaufort and Chukchi Seas and over the East Greenland Sea (up to 8 degrees Celsius or 14 degrees Fahrenheit above the 1981 to 2010 average). In part, these high temperatures resulted from high sea surface temperatures over the open water areas. However, unusually high sea level pressure centered over northern Scandinavia brought southerly winds from the East Siberian and Barents Seas, contributing to high air temperatures in these regions. In turn, unusually low pressure on the Pacific side centered roughly over the western Bering Sea brought southerly winds over the Beaufort and Chukchi Seas, contributing to unusually high air temperature there. The combined effects of the high sea surface temperatures and atmospheric circulation led to a pattern in which for the Arctic, unusual warmth in October extended from the surface through a deep layer of the atmosphere (Figure 2d).

As noted in our post last month, the Arctic is losing it’s oldest and thickest ice. A new animation from NASA Goddard’s Scientific Visualization Studio shows this loss over the past 30 years. 

October 2016 compared to previous years

Figure 3. Monthly October ice extent for 1979 to 2016 shows a decline of 7.4 percent per decade.||Credit: National Snow and Ice Data Center| High-resolution image

Figure 3. Monthly October ice extent for 1979 to 2016 shows a decline of 7.4 percent per decade.

Credit: National Snow and Ice Data Center
High-resolution image

Through 2016, the linear rate of decline for October is 66,400 square kilometers or (25,600 square miles) per year, or 7.4 percent per decade.

Antarctic sea ice dropping

Figure 4. Antarctic sea ice extent for October 2016 was 17.6 million square kilometers (6.8 million square miles). The magenta line shows the 1981 to 2010 median extent for that month. The black cross indicates the geographic South Pole.

Figure 4. Antarctic sea ice extent for October 2016 was 17.6 million square kilometers (6.8 million square miles). The magenta line shows the 1981 to 2010 median extent for that month. The black cross indicates the geographic South Pole. Sea Ice Index data. About the data

Credit: National Snow and Ice Data Center
High-resolution image

After a reaching its maximum extent unusually early and then following a period of relatively unchanging overall extent, Antarctic sea ice extent started to decline in earnest. Daily sea ice extent levels have been at second lowest in the satellite record since October 20 and below the two standard deviation range. Only the 1986 austral spring extent is lower. Ice extent is particularly low on both sides of the Antarctic Peninsula. The rapid early reduction in sea ice cover in this region may create favorable conditions for the break up of the eastern Peninsula ice shelves at the end of austral summer. Similar sea ice trends and weather conditions were present during the spring seasons preceding past ice shelf retreats (e.g., 2001 to 2002). Extensive open water, created by the downsloping fosters warmer air and surface melting, and allows longer-period ocean waves to reach the ice front of the ice shelves. Other areas of reduced sea ice cover are the Southern Ocean north of Dronning Maud Land, and the area west of the Ross Sea and north of Wilkes Land.

Rapid ice growth follows the seasonal minimum, rapid drop in Antarctic extent

Since reaching its seasonal minimum on September 10 of 4.14 million square kilometers (1.60 million square miles), Arctic sea ice extent has increased at a rapid rate. Antarctic ice extent saw a sharp decline during the first half of September.

Overview of conditions

extent map

Figure 1. Arctic sea ice extent for September 2016 was 4.72 million square kilometers (1.82 million square miles). The magenta line shows the 1981 to 2010 median extent for that month. The black cross indicates the geographic North Pole. Sea Ice Index data. About the data

Credit: National Snow and Ice Data Center
High-resolution image

Arctic sea ice extent during September 2016 averaged 4.72 million square kilometers (1.82 million square miles), the fifth lowest in the satellite record. Average September extent was 1.09 million square kilometers (421,000 square miles) above the record low set in 2012, and 1.82 million square kilometers (703,000 square miles) below the 1981 to 2010 long-term average. Extent remains especially low in the Beaufort, Chukchi and East Siberian Seas. The Northern Sea Route along the Russian coast appears to still be open, but the southern Northwest Passage route (Amundsen’s route) appears to be closed.

Conditions in context

Figure 2. The graph above shows Arctic sea ice extent as of October 4, 2016, along with daily ice extent data for four previous years. 2016 is shown in blue, 2015 in green, 2014 in orange, 2013 in brown, and 2012 in purple. The 1981 to 2010 average is in dark gray. The gray area around the average line shows the two standard deviation range of the data. Sea Ice Index data.

Credit: National Snow and Ice Data Center
High-resolution image

air pressure plot

Figure 2b. This plot shows Arctic sea level pressure difference from average for September 2016. Yellows and reds indicate higher than average pressures; blues and purples indicate lower than average pressures.

Credit: NSIDC courtesy NOAA/ESRL Physical Sciences Division
High-resolution image

Figure 2c. This plot shows Arctic air temperature (at the 925 hPA level) difference from average for September 2016. Yellows and reds indicate higher than average temperatures; blues and purples indicate lower than average temperatures.

Credit: NSIDC courtesy NOAA/ESRL Physical Sciences Division
High-resolution image

As of October 1, Arctic sea ice extent stood at 5.19 million square kilometers (2.00 million square miles), which is an increase of 1.05 million square kilometers (405,000 square kilometers) from the seasonal minimum of 4.14 million square kilometers (1.60 million square miles) recorded on September 10. Compared to some other years, the growth rate since the seasonal minimum has been quite rapid. The ice growth has been predominantly in the central Arctic Ocean and the East Siberian Sea sector. There has been little ice growth in the Laptev and Kara Seas, and ice has actually retreated in the Barents Sea.

September saw a shift in weather patterns. The summer of 2016 was characterized by unusually low pressure over the central Arctic Ocean, west of the dateline. While low pressure was still a dominant feature of September, the center of low pressure shifted towards North America, and a center of high pressure strengthened over north central Eurasia (Figure 2b). Conditions under the high pressure region were quite warm; temperatures at the 925 hPa level were up to 6 degrees Celsius (11 degrees Fahrenheit) above the 1981 to 2010 average (Figure 2c).

September 2016 compared to previous years

trend graph

Figure 3. Monthly September ice extent for 1979 to 2016 shows a decline of 13.3% per decade.

Credit: National Snow and Ice Data Center
High-resolution image

Through 2016, the linear rate of decline for September is 87,200 square kilometers (33,700 square miles) per year, or 13.3 percent per decade. While the absolute seasonal minimum for 2016 was tied with 2007 as second lowest, the average extent for the month of September 2016 of 4.72 million square kilometers (1.82 million square miles) ends up being fifth lowest in the satellite record, behind both 2012 and 2007. This reflects the rapid growth of ice following the seasonal minimum recorded on September 10.

Antarctic sea ice reaches winter maximum on a record early date

Figure 4. The graph above shows Antarctic sea ice extent as of October 4, 2016, along with daily ice extent data for four previous years. 2016 is shown in blue, 2015 in green, 2014 in orange, 2013 in brown, and 2012 in purple. The 1981 to 2010 average is in dark gray. The gray area around the average line shows the two standard deviation range of the data. Sea Ice Index data.

Credit: National Snow and Ice Data Center
High-resolution image

Antarctic sea ice extent reached 18.44 million square kilometers (7.12 million square miles) on August 31, 2016, and this appears to be the maximum extent for this year. This is the earliest maximum in the satellite record since 1979, and the first time the maximum has occurred in August. The maximum was 240,000 square kilometers (93,000 square miles) greater than the average extent for this date of 18.20 million square kilometers (7.03 million square miles). It is the tenth lowest maximum extent on record. On average, the maximum occurs much later (September 23 to 24).

The early maximum appears to be the result of an intense wind pattern in September, spanning nearly half of the continent from the Wilkes Land area to the Weddell Sea, and centered on the Amundsen Sea. Stronger than average low pressure in this area, coupled with high pressure near the Falkland Islands, and near the southern tip of New Zealand in the Pacific Ocean, created two regions of persistent northwesterly winds. Sea ice extent decreased in the areas where the northwesterly winds reached the ice front.

A comparison of sea ice extent from the date of the maximum (August 31) and the last day of September (one month later) shows that sea ice extent decreased through the month along a broad region west and east of the Antarctic Peninsula. It also decreased on the other side of the continent north of Wilkes Land. By comparison, this was partly offset by increases in the northern Amundsen Sea and north of Dronning Maud Land.

The 2016 Arctic melt season in review

sum_slp_2016

Figure 5a. This plot shows Arctic sea level pressure difference from average for June, July, and August 2016. Yellows and reds indicate higher than average pressures; blues and purples indicate lower than average pressures.

Credit: NSIDC courtesy NOAA/ESRL Physical Sciences Division
High-resolution image

sum_temp_2016

Figure 5b. This plot shows Arctic air temperature (at the 925 hPA level) difference from average for June, July, and August 2016. Yellows and reds indicate higher than average temperatures; blues and purples indicate lower than average temperatures.

Credit: NSIDC courtesy NOAA/ESRL Physical Sciences Division
High-resolution image

The winter of 2015/2016 was extremely warm over the Arctic Ocean. The maximum sea ice extent in March set a new low in the satellite record, barely beating out March 2015. Extent for the month of March as a whole ended up second lowest on record. In April, problems with the F-17 sensor forced a temporary cessation of sea ice updates until data from the newer F-18 satellite could be brought online. Data from other sources documented that during this time, ice was still tracking very low. The months of May and June set more record lows in ice extent.

Although the onset of surface melt was early over much of the Arctic Ocean, as the melt season progressed, a pattern of stormy weather set up. This ended up being a very persistent pattern; as averaged from June through August, sea level pressure was much lower than average over the central Arctic Ocean (Figure 5a), and air temperatures over most of the ocean were average or below average (Figure 5b). Such conditions have been previously shown to limit summer ice loss, and by the early August it became clear that a new record low for September extent was not in the offing. Two very strong storms crossed the central Arctic Ocean in August. In 2012, a strong storm contributed to accelerated ice loss, but this year, the overall influence of the storms remains unclear.

Despite the generally unfavorable weather conditions, the seasonal minimum of 4.14 million square kilometers (1.60 million square miles), reached on September 10, ended up in a statistical tie with 2007 as the second lowest in the satellite record. While previous analyses have shown that there is little correlation between the seasonal maximum extent and the season minimum extent, in large part because of the strong impacts of summer weather patterns, it is likely that the 2016 melt season started with a lot of fairly thin ice. This may help to explain why, despite summer weather unfavorable to sea ice loss, extent at the seasonal minimum ended up tied for second lowest.

Sea ice age

sea ice age still image

Figure 6. This image shows sea ice age for the week of the 2016 sea ice minimum. The bar chart shows the extent of each multi-year age category (in millions of square kilometers); the green lines on the bar chart are the high values in the satellite record for the minimum week.

Credit: NASA Scientific Visualization Studio
High-resolution image

Age is another indicator of the state of sea ice because older ice is generally thicker ice (Tschudi et al., 2016). As mentioned in previous posts, there has been an overall decline in ice age, particularly the oldest ice types—ice that has been in the Arctic for more than four years. Near-real-time updates (which are preliminary) indicate that at this year’s minimum, only 106,000 square kilometers (41,000 square miles) of 4+ year old ice remained, or 3.1 percent of the total ice extent. This is in stark contrast to the mid-1980s when over 2 million square kilometers (33 percent, or 772,000 square miles) of the summer minimum extent was composed of old ice that had survived at least four summer melt seasons.

Reference

Tschudi, M.A., J.C. Stroeve, and J.S. Stewart. 2016. Relating the age of Arctic sea ice to its thickness, as measured during NASA’s ICESat and IceBridge campaigns. Remote Sensing, 8, 457, doi:10.3390/rs8060457.

2016 ties with 2007 for second lowest Arctic sea ice minimum

Arctic sea ice appears to have reached its seasonal minimum extent for 2016 on September 10. A relatively rapid loss of sea ice in the first ten days of September has pushed the ice extent to a statistical tie with 2007 for the second lowest in the satellite record. September’s low extent followed a summer characterized by conditions generally unfavorable for sea ice loss.

Please note that this is a preliminary announcement. Changing winds or late-season melt could still reduce the Arctic ice extent, as happened in 2005 and 2010. NSIDC scientists will release a full analysis of the Arctic melt season, and discuss the Antarctic winter sea ice growth, in early October.

Overview of conditions

Figure 1. Arctic sea ice extent for September 10, 2016 was 4.14 million square kilometers (1.60 million square miles). The orange line shows the 1981 to 2010 median extent for that day.

Figure 1. Arctic sea ice extent for September 10, 2016 was 4.14 million square kilometers (1.60 million square miles). The orange line shows the 1981 to 2010 median extent for that day. The black cross indicates the geographic North Pole. Sea Ice Index data. About the data

Credit: National Snow and Ice Data Center
High-resolution image

On September 10, Arctic sea ice extent stood at 4.14 million square kilometers (1.60 million square miles). This appears to have been the lowest extent of the year and is tied with 2007 as the second lowest extent on record. This year’s minimum extent is 750,000 square kilometers (290,000 square miles) above the record low set in 2012 and is well below the two standard deviation range for the 37-year satellite record. Satellite data show extensive areas of open water in the Beaufort and Chukchi seas, and in the Laptev and East Siberian seas.

During the first ten days of September, the Arctic lost ice at a faster than average rate. Ice extent lost 34,100 square kilometers (13,200 square miles) per day compared to the 1981 to 2010 long-term average of 21,000 square kilometers (8,100 square miles) per day. The early September rate of decline also greatly exceeded the rate observed for the same period in 2012 (19,000 square kilometers, or 7,340 square miles, per day). Recent ice loss has been most pronounced in the Chukchi Sea. This may relate to the impact of two strong cyclones that passed through the region during August.

Satellite passive microwave data and images from the Moderate Resolution Imaging Spectroradiometer (MODIS) suggest that the southern Northwest Passage routes are still open. While the passive microwave data show that the Northern Sea route is open, MODIS data reveal a narrow band of scattered sea ice blocking the passage near the Taymyr Peninsula.

Conditions in context

Figure 2a. The graph shows Arctic sea ice extent as of September 12, 2016, along with daily ice extent data for four other record low years. 2016 is shown in blue, 2015 in green, 2012 in orange, 2011 in brown, and 2007 in purple. The 1981 to 2010 average is in dark gray. The gray area around the average line shows the two standard deviation range of the data. Sea Ice Index data.||Credit: National Snow and Ice Data Center|High-resolution image

Figure 2a. The graph shows Arctic sea ice extent as of September 12, 2016, along with daily ice extent data for four other record low years. 2016 is shown in blue, 2015 in green, 2012 in orange, 2011 in brown, and 2007 in purple. The 1981 to 2010 average is in dark gray. The gray area around the average line shows the two standard deviation range of the data. Sea Ice Index data.

Credit: National Snow and Ice Data Center
High-resolution image

Figure 2b. This plot shows Arctic air temperature anomalies at the 925 hPa level in degrees Celsius and sea level pressure anomalies for two periods: July 1 to August 31, and September 1 through September 11. Yellows and reds indicate higher than average temperatures and pressure; blues and purples indicate lower than average temperatures and pressure.

Figure 2b. This plot shows Arctic air temperature anomalies at the 925 hPa level in degrees Celsius and sea level pressure anomalies for two periods: July 1 to August 31, and September 1 through September 11. Yellows and reds indicate higher than average temperatures and pressure; blues and purples indicate lower than average temperatures and pressure.

Credit: NSIDC courtesy NOAA Earth System Research Laboratory Physical Sciences Division
High-resolution image

Weather in early September was warm along the Siberian coast (up to 9 degrees Celsius or 16 degrees Fahrenheit above average), with high pressure over the same region and strong winds across the central Arctic. However, as discussed in previous posts, weather over the Arctic Ocean this past summer has been generally stormy, cool, and cloudy—conditions that previous studies have shown to generally limit the rate of summer ice loss. That September ice extent nevertheless fell to second lowest in the satellite record is hence surprising. Averaged for July through August, air temperatures at the 925 hPa level (about 2,500 feet above sea level) were 0.5 to 2 degrees Celsius (1 to 4 degrees Fahrenheit) below the 1981 to 2010 long-term average over much of the central Arctic Ocean, and near average to slightly higher than average near the North American and easternmost Siberian coasts. Reflecting the stormy conditions, sea level pressures were much lower than average in the central Arctic during these months.

Why did extent fall to a tie for second lowest with 2007? The 2016 Arctic melt season started with a record low maximum extent in March, and sea ice was measured at record low monthly extents well into June. Computer models of ice thickness, and maps of sea ice age both indicated a much thinner ice pack at the end of winter. Statistically, there is little relationship between May and September sea ice extents after removing the long-term trend, indicating the strong role of summer weather patterns in controlling sea ice loss. However, the initial ice thickness may play a significant role. As noted in our mid-August post, the upper ocean was quite warm this summer and ocean-driven melting is important during late summer. The science community will be examining these issues in more detail in coming months.

Ice loss primarily in the northern Chukchi Sea

Figure 4. This figure compares Arctic sea ice extent for September 1 (orange) and September 10 (blue), with overlap areas in purple.

Figure 4. This figure compares Arctic sea ice extent for September 1 (orange) and September 10 (blue), with overlap areas in purple.

Credit: National Snow and Ice Data Center
High-resolution image

The late season ice loss appears to have been greatest in an extended area of patchy ice reaching from the eastern Beaufort Sea to the northern Chukchi Sea. This is in the area influenced by the two strong cyclones discussed in our August posts—the strong winds appear to have compacted the ice cover and may have led to an upward mixing of warm ocean water.


Second opinion

Figure 5. This graph compares Arctic sea ice extent trends from August 15 to September 10 for the years 2007 (F-17), 2012 (F-17), and 2016 (F-17 and F-18). The NSIDC Sea Ice Index currently uses data from the F-18 satellite.

Figure 5. This graph compares Arctic sea ice extent trends from August 15 to September 10 for the years 2007 (F-17), 2012 (F-17), and 2016 (F-17 and F-18). The NSIDC Sea Ice Index currently uses data from the F-18 satellite.

Credit: W. Meier, NASA GSFC, NSIDC
High-resolution image

The Defense Meteorological Satellite Program (DMSP) F-17 satellite, which NSIDC ceased to use in May as its primary source for sea ice extent due to erratic data, has since re-stabilized and is providing more consistent day-to-day readings. While NSIDC will continue to use the DMSP F-18 satellite for data processing, it is instructive to examine the F-17 record. Early September extent from the F-17 record is slightly higher than from F-18. Both sensors indicate that the minimum extent for 2016 is slightly lower than the 2007 minimum, which was 4.15 million square kilometers (1.60 million square miles) and reached on September 18. However, the measurement accuracy is about ±25,000 square kilometers (±9,600 square miles) for a five-day trailing average daily extent measurement. This means that at the present levels, 2016 is a statistical tie for second lowest sea ice extent.

Previous minimum Arctic sea ice extents

Table 1.   Previous minimum Arctic sea ice extents
 YEAR MINIMUM ICE EXTENT DATE
IN MILLIONS OF SQUARE KILOMETERS IN MILLIONS OF SQUARE MILES
2007 4.15 1.60 Sept. 18
2008 4.59 1.77 Sept. 20
2009 5.12 1.98 Sept. 13
2010 4.62 1.78 Sept. 21
2011 4.34 1.67 Sept. 11
2012 3.39 1.31 Sept. 17
2013 5.06 1.95 Sept. 13
2014 5.03 1.94 Sept. 17
2015 4.43 1.71 Sept. 9
2016 4.14 1.60 Sept. 10
1979 to 2000 average 6.70 2.59 Sept. 13
1981 to 2010 average 6.22 2.40 Sept. 15

Ten lowest minimum Arctic sea ice extents (satellite record, 1979 to present)

Table 2.  Ten lowest minimum Arctic sea ice extents (satellite record, 1979 to present)
 RANK  YEAR MINIMUM ICE EXTENT DATE
IN MILLIONS OF SQUARE KILOMETERS IN MILLIONS OF SQUARE MILES
1 2012 3.39 1.31 Sept. 17
2


2016

2007

4.14

4.15

1.60

1.60

Sept. 10

Sept. 18

3 2011 4.34 1.67 Sept. 11
4 2015 4.43 1.71 Sept. 9
5 2008 4.59 1.77 Sept. 20
6 2010 4.62 1.78 Sept. 21
7 2014 5.03 1.94 Sept. 17
8 2013 5.06 1.95 Sept. 13
9 2009 5.12 1.98 Sept. 13
10 2005 5.32 2.05 Sept. 22

Note that the dates and extents of the minima have been re-calculated from what we posted in previous years. In June 2016, NSIDC transitioned to using data from the DMSP F-18 satellite, due to issues with the F-17 satellite. Data beginning April 1, 2016 are from F-18. In July 2016, Sea Ice Index data were updated to Version 2. These changes do not significantly affect sea ice trends and year-to-year comparisons, but in some instances users may notice small changes in values from the previous version of the data. Details on the changes are discussed in the Sea Ice Index documentation.

October 19, 2016: We revised the title for Table 2 from “Ten lowest minimum Arctic sea ice extents (1981 to 2010 average)” to “Ten lowest minimum Arctic sea ice extents (satellite record, 1979 to present)”


Arctic sea ice nears its minimum extent for the year

Throughout August, Arctic sea ice extent continued to track two or more standard deviations below the long-term average. The month saw two very strong storms enter the central Arctic Ocean from along the Siberian coast. In the Antarctic, ice extent remained near average.

Overview of conditions

sea ice extent map

Figure 1. Arctic sea ice extent for August 2016 was 5.60 million square kilometers (2.16 million square miles). The magenta line shows the 1981 to 2010 median extent for that month. The black cross indicates the geographic North Pole. Sea Ice Index data. About the data

Credit: National Snow and Ice Data Center
High-resolution image

Average sea ice extent for August 2016 was 5.60 million square kilometers (2.16 million square miles), the fourth lowest August extent in the satellite record. This is 1.03 million square kilometers below the 1981 to 2010 average for the month and 890,000 square kilometers (344,000 square miles) above the record low for August set in 2012. As of September 5, sea ice extent remains below average everywhere except for a small area within the Laptev Sea. Ice extent is especially low in the Beaufort Sea and in the East Siberian Sea. With about two weeks of seasonal melt yet to go, it is unlikely that a new record low will be reached. However, since August 26, total sea ice extent is already lower than at the same time in 2007 and is currently tracking as the second lowest daily extent on record. In addition, during the first five days of September the ice cover has retreated an additional 288,000 square kilometers (111,000 square miles) as the tongue of sea ice in the Chukchi Sea has started to disintegrate.

Conditions in context

sea ice extent graph

Figure 2a. The graph above shows Arctic sea ice extent as of September 5, 2016, along with daily ice extent data for four previous years. 2016 is shown in blue, 2015 in green, 2014 in orange, 2013 in brown, and 2012 in purple. The 1981 to 2010 average is in dark gray. The gray area around the average line shows the two standard deviation range of the data. Sea Ice Index data.

Credit: National Snow and Ice Data Center
High-resolution image

ice concentration map

Figure 2b. The map shows Arctic sea ice concentration from the AMSR2 satellite instrument for September 5, 2016. Light blues and greens in ocean areas indicate areas of low ice concentration. The grey circle at the North Pole indicates where the satellite does not collect data, due to its orbit.

Credit: National Snow and Ice Data Center/University of Bremen
High-resolution image

The average ice loss rate through August was 75,000 square kilometers per day (29,000 square miles), compared to the long-term 1981 to 2010 average of 57,300 square kilometers per day (22,100 square miles per day), and a rate of 89,500 square kilometers per day for 2012 (34,500 square miles per day). Total ice extent loss in August was 2.34 million square kilometers (904,000 square miles).

Air temperatures at the 925 hPa level were 1 to 3 degrees Celsius (2 to 5 degrees Fahrenheit) below average for a large area stretching from the northern Kara Sea, through the Laptev Sea, and into north-central Eurasia. Temperatures elsewhere over the Arctic Ocean were near average. Reflecting the generally stormy pattern through the month, sea level pressures were well below average (as much as 10 hPa) over the central and eastern Arctic Ocean. Two very strong cyclones entered the central Arctic Ocean in August from along the Siberian coast, bringing strong winds. On August 16, the central pressure of the first cyclone dropped to 968 hPa, nearly rivaling the storm in early August 2012 that attained a minimum central pressure of 966 hPa. On 22 August, the second storm started moving to the central Arctic Ocean along a similar track, and on August 23, attained a central pressure of 970 hPa.

Past studies have shown that stormy summers tend to end up with more sea ice at the end of the melt season than summers with high pressure over the central Arctic Ocean, primarily because stormy summers are both fairly cool and the wind pattern tends to spread the ice out. However, the impact of strong individual storms may be different—the 2012 event appears to have temporarily boosted ice loss by breaking up the ice cover, with the wave action tending to mix warmer waters from below to hasten melt. It may also be that, as the ice cover thins, its response to storms is changing.

It indeed appears that the August 2016 storms helped to break up the ice and spread it out, contributing to the development of several large embayments and polynyas. Some of this ice divergence likely led to fragmented ice being transported into warmer ocean waters, hastening melt. Whether warmer waters from below were mixed upwards to hasten melt remains to be determined, but as discussed below, these storms were associated with very high wave heights.

August 2016 compared to previous years

sea ice trend graph

Figure 3. Monthly August ice extent for 1979 to 2016 shows a decline of 10.4 percent per decade.

Credit: National Snow and Ice Data Center
High-resolution image

Arctic sea ice extent averaged for August 2016 was the fourth lowest in the satellite data record. Through 2016, the linear rate of decline for August is 10.4 percent per decade.

Cyclones, ocean wave heights, and ice retreat

wave height maps

Figure 4. This series of plots shows significant wave height (in meters, indicated by color scale) in the western Arctic Ocean during the 2016 Arctic cyclone, from August 14 to August 16, 2016, as predicted by a numerical wave model (WAVEWATCH III), run at the Naval Research Laboratory (NRL). The solid red lines correspond to the analysis ice concentrations (25 percent, 50 percent and 75 percent) used as input for the wave model. White arrows indicate wave direction. This hindcast uses two time-varying inputs: 10-meter wind vectors from the atmospheric model NAVGEM (Navy Global Environmental Model, Hogan et al. 2014) run at the Fleet Numerical Meteorology and Oceanography Center (FNMOC), and analyses of ice concentrations (also produced at FNMOC) from passive microwave radiometer data (SSM/I). The wave model is run on a polar stereographic grid with a resolution of approximately 18 kilometers.

Credit: Erick Rogers, Naval Research Laboratory
High-resolution image

Large waves are common at high latitudes; 10-meter wave heights (33 feet) are not unusual for the Nordic Seas, and 15-meter wave heights (49 feet) can occur in the high latitudes of the Southern Ocean. However, large waves are a relatively new feature of the western Arctic Ocean. The height of waves is in part determined by surface wind speed, as well as the fetch (distance over open water that the wind can travel) and the duration of a wind event. A moderate sea ice cover damps ocean waves by absorbing and dispersing the wave energy through jostling of the ice floes against one another. A dense ice pack cover acts as a shield between the ocean and the surface wind, preventing wave formation.

In the latter half of the twentieth century, 4 to 6 meter waves (13 to 20 feet) rarely occurred in the western Arctic Ocean, but with more open water they have become more frequent, especially when strong storms enter the Arctic Ocean in late summer or early autumn. During the first of the two August cyclones discussed above, waves up to 5.9 meters (19 feet) were predicted. This occurred during the early part of the cyclone’s lifecycle (1800 UTC August 14), in the eastern Kara Sea. Further east, north of the New Siberian Islands, wave heights were estimated as high as 4.3 meters (14 feet) late on August 15. In this region, the waves were directly incident on the ice edge. In response, the ice edge retreated following the 4.3 meter waves on August 15.

Northwest Passage update

Figure 5. The time series shows total sea ice area for selected years and the 1981-2010 average within the northern route of the Northwest Passage. The cyan line shows 2016 and other colors show ice conditions in different years. Data are from the Canadian Ice Service.

Credit: Stephen Howell, Environment and Climate Change Canada
High-resolution image

The Northwest Passage refers to the fabled shortcut between the Atlantic and Pacific through the Canadian Archipelago. However, it is not one route. There is a northern, deep-water route through the Parry Channel, entered from the west through the M’Clure Strait and a shallower southern route, known as Amundsen’s route. Sea ice in the Parry Channel route has shown a sharp decline since the middle of July, but the channel is still not entirely ice free. Considerable ice remains in the western (M’Clure Strait) region and there are lesser amounts in the eastern regions. This is mostly (~80 percent) multiyear ice. Low ice years in the Parry Channel are typically the result of early summer breakup associated with high sea level pressure over the Beaufort Sea and Canada Basin that displace the Arctic Ocean pack ice away from the western entrance. Conversely, low sea level pressure anomalies over the Beaufort Sea and Canada Basin keep the Arctic Ocean pack ice up against the western entrance. This has been the case for much of the 2016 melt season. The southern (Amundsen’s) route is open but it is still uncertain whether the northern route will open in the coming weeks.

Even during mild ice years, thick multiyear ice is typically advected into these routes during the summer months. Multiyear ice is a significant obstacle for ships. Nevertheless, taking advantage of mild sea ice conditions, the 68,000-ton Crystal Serenity set sail from Anchorage, Alaska on August 16 for its 32-day journey through the Northwest Passage via Amundsen’s route. This is the largest ship thus far to navigate the Northwest Passage and is accompanied by an icebreaker ship and two helicopters. The ship sailed through the Northwest Passage in less than three weeks—52 times faster than Amundsen’s nearly three-year voyage.

On the other side of the Arctic, the Northern Sea Route appears mostly ice free.

Further reading

Collins, C. O., W. E. Rogers, A. Marchenko and A. V. Babanin. 2015. In situ measurements of an energetic wave event in the Arctic marginal ice zone. Geophysical Research Letters, 42, doi:10.1002/2015GL063063.

Haas, C., and S. E. L. Howell. 2015. Ice thickness in the Northwest Passage. Geophysical Research Letters, 42, 7673–7680, doi:10.1002/2015GL065704.

Hogan, T., et al. 2014. The Navy Global Environmental Model, Oceanography, 27(3), 116-125.

Howell, S. E. L., T. Wohlleben, M. Dabboor, C. Derksen, A. Komarov and L. Pizzolato. 2013. Recent changes in the exchange of sea ice between the Arctic Ocean and the Canadian Arctic Archipelago. Journal of Geophysical Research, 118, 3595–3607, doi:10.1002/jgrc.20265.

Thomson, J., and W. E. Rogers. 2014. Swell and sea in the emerging Arctic Ocean, Geophysical Research Letters 41, doi:10.1002/2014GL059983.

Thomson, J. et al. 2016. Emerging trends in the sea state of the Beaufort and Chukchi seas, Ocean Modelling 105, doi:10.1016/j.ocemod.2016.02.009.

Late summer in the Arctic, sea ice melt continues

As of August 14, Arctic sea ice extent is tracking third lowest in the satellite record. The southern route through the Northwest Passage appears to be largely free of ice. Despite a rather diffuse ice cover in the Chukchi Sea, it is unlikely that Arctic sea ice extent this September will fall below the record minimum set in 2012.

Overview of conditions

Figure 1. Arctic sea ice extent for August 14, 2016 was 5.61 million square kilometers (2.17 million square miles). The orange line shows the 1981 to 2010 median extent for that day

Figure 1. Arctic sea ice extent for August 14, 2016 was 5.61 million square kilometers (2.17 million square miles). The orange line shows the 1981 to 2010 median extent for that day. The black cross indicates the geographic North Pole. Sea Ice Index data. About the data

Credit: National Snow and Ice Data Center
High-resolution image

As of August 14, Arctic sea ice extent was 5.61 million square kilometers (2.17 million square miles). This is the third lowest extent in the satellite record for this date and slightly below the two standard deviation range. So far this month the rate of loss has been faster than average and has declined at a rate similar to that observed for 2012.

Ice loss has progressed quite rapidly in the Beaufort and Chukchi seas, where broken up ice floes are starting to melt away. However, large, thick multiyear ice floes persist in several areas; it remains to be seen if they will survive the melt season. A wedge of open water has also penetrated northward from the East Siberian Sea, yet ice remains extensive in the Laptev Sea, blocking the Northern Sea Route. Ice extent continues to be low in the Kara, Barents, and East Greenland seas. The southern (Amundsen’s) route through the Northwest Passage appears open in Advanced Scanning Microwave Radiometer 2 (AMSR2) data. However, data in visible wavelengths from the NASA Moderate Resolution Imaging Spectroradiometer (MODIS) instrument still show some ice.

Conditions in context

Figure 2. The graph above shows Arctic sea ice extent as of August 14, 2016, along with daily ice extent data for four previous years.

Figure 2. The graph above shows Arctic sea ice extent as of August 14, 2016, along with daily ice extent data for four previous years. 2016 is shown in blue, 2015 in green, 2014 in orange, 2013 in brown, and 2012 in purple. The 1981 to 2010 average is in dark gray. The gray area around the average line shows the two standard deviation range of the data. Sea Ice Index data.

Credit: National Snow and Ice Data Center
High-resolution image

Ice loss from August 1 to 14 was faster than average, at 87,400 square kilometers (33,800 square miles) per day, and near the rates observed in 2012. Nevertheless, as has been the pattern this summer, atmospheric conditions through the first half of August have been generally cloudy and cool. Air temperatures at the 925 hPa level were 1 to 3 degrees Celsius (2 to 5 degrees Fahrenheit) below the 1981 to 2010 long-term average over the eastern part of the Arctic Ocean and near average elsewhere. The cool and cloudy conditions reflect a pattern of low atmospheric pressure over the Laptev and Kara seas.

As of August 16, a strong storm (central pressure of 968 hPa) was located over the Central Arctic Ocean at about 85 degrees North, near the dateline. The extent to which this strong storm will affect sea ice conditions remains to be seen.

Ocean heat continues ice melt

Figure 3. The map shows average ocean sea surface temperature (SST) and sea ice concentration for August 7, 2016. SST is measured by satellites using thermal emission sensors, which produce a global data adjusted by comparison with ship and buoy data. Sea ice concentration is derived from the NSIDC sea ice concentration near-real-time data. Also shown are drifting buoy temperatures at the ocean surface (colored circles); gray circles indicate that temperature data from the buoys are not available. ||Credit: M. Steele, Polar Science Center/University of Washington| High-resolution image

Figure 3. The map shows average ocean sea surface temperature (SST) and sea ice concentration for August 7, 2016. SST is measured by satellites using thermal emission sensors, which produce global data adjusted after comparison with ship and buoy data. Sea ice concentration is derived from NSIDC sea ice concentration near-real-time data. Also shown are drifting buoy temperatures at the ocean surface (colored circles); gray circles indicate that temperature data from the buoys are not available.

Credit: M. Steele, Polar Science Center/University of Washington
High-resolution image

The Arctic atmosphere is cooling now as the sun dips lower in the sky. However, sea ice loss will continue throughout August due primarily to melt from the ocean heat that has accumulated over the summer. Early ice retreat has allowed the ocean to warm, both from absorption of the sun’s energy and from northward-flowing warm water in the Chukchi Sea to the west of Alaska and in the Barents Sea to the north of Norway. Unusually strong ocean warming occurred in northern Baffin Bay (between northern Canada and Greenland), the Beaufort Sea (north of northwestern Canada and Alaska), the East Siberian Sea (north of far eastern Siberia), and the Barents and Kara seas (north of western Eurasia).

What is quite unusual this year is the early ice retreat and resulting ocean warming in the western Beaufort Sea and in the western East Siberian Sea. The extent of warming to the north of these two seas is also unusual, as well as the extent of this warming to the north. These two areas typically melt out later in the season, when atmospheric heating rates have declined from their mid-summer peak. Thus the exposed ocean warms, but not all that much. This pattern was true during the record-setting year of 2012, when by the end of summer, these areas were substantially cooler than surrounding seas that had melted out earlier.

This year, however, the melt out was early and extensive enough that the ocean has already warmed substantially in these two areas. More sea ice retreat is probable in the western Beaufort and East Siberian seas as well as areas in the coming weeks. But what about the ocean’s response? Some warm water might move northward via ocean currents and contribute to ice melt. However, further dramatic ocean surface warming is unlikely, given that the atmosphere is already cooling, especially in far northern latitudes.

Ice loss rates indicate little chance for a record low this year

Figure 4. The graph above shows projections of ice extent from August 14 through September 30 based on previous years’ observed retreat rates appended to the August 14, 2016 ice extent.

Figure 4. The graph above shows projections of ice extent from August 14 through September 30 based on previous years’ observed retreat rates appended to the August 14, 2016 ice extent.

Credit: W. Meier/NASA GSFC
High-resolution image

While there are still three to four weeks to go in the melt season, a new record low this September is highly unlikely. A simple projection method developed by Walt Meier at the NASA Goddard Space Flight Center uses daily ice loss rates from previous years to estimate possible trajectories of ice extent through the rest of the melt season.

This approach yields a range of minimum values based on how sea ice loss progressed in previous years. By selecting from an average of multiple years, or using loss rates from a specific previous year, the method yields an estimate of the likely range of the minimum sea ice extent. As of August 14, using daily ice loss rates based on the 2006 to 2015 average yields an average projected 2016 minimum extent of 4.33 million square kilometers (1.67 million square miles). Using the slowest (recent) August to September decline, which occurred in 2006, yields a 2016 minimum of 4.76 million square kilometers (1.84 million square miles). Using the fastest rate of decline, from 2012, yields a 2016 minimum extent of 4.06 million square kilometers (1.57 million square miles). These two years bracket a reasonable range of expected 2016 minima. It is possible that this year will have decline rates that fall outside the range of previous years. However, this approach indicates that it is very unlikely that 2016 will have a minimum below 2012’s value of 3.39 million square kilometers (1.31 million square miles). A projection from August 1 was submitted to the Sea Ice Outlook.

Further reading

Lindsay, R.W. 1998. Temporal variability of the energy balance of thick Arctic pack ice, Journal of Climate, doi:10.1175/15200442(1998)011<0313:TVOTEB>2.0.CO;2.

Steele, M. and W. Ermold. 2015. Loitering of the retreating sea ice edge in the Arctic seas, Journal of Geophysical Research, doi:10.1002/2015JC011182.

Steele, M., J. Zhang, and W. Ermold. 2010. Mechanisms of summertime upper Arctic Ocean warming and the effect on sea ice melt, Journal of Geophysical Research, doi:10.1029/2009JC005849.

A cool and stormy Arctic in July

An extensive area of lower than average temperatures in the Central Arctic and the Siberian coast, attended by persistent low pressure systems in the same region, led to slightly slower than average sea ice decline through the month. The stormy pattern contributed to a dispersed and ragged western Arctic ice pack for July, with several polynyas beginning to form late in the month. A new record low September ice extent now appears to be unlikely.

Overview of conditions

Figure 1. Arctic sea ice extent for July 2016 was 8.13 million square kilometers (3.14 million square miles). The magenta line shows the 1981 to 2010 median extent for that month. The black cross indicates the geographic North Pole. Sea Ice Index data. About the data||Credit: National Snow and Ice Data Center|High-resolution image

Figure 1. Arctic sea ice extent for July 2016 averaged 8.13 million square kilometers (3.14 million square miles). The magenta line shows the 1981 to 2010 median extent for that month. The black cross indicates the geographic North Pole. Sea Ice Index data. About the data

Credit: National Snow and Ice Data Center
High-resolution image

Arctic sea ice extent for July averaged 8.13 million square kilometers (3.14 million square miles), the third lowest July extent in the satellite record. This makes July only the second month so far this year that did not have a record low extent. July’s extent is 190,000 square kilometers (73,000 square miles) above the previous record low set in 2011, and 1.65 million square kilometers (637,000 square miles) below the 1981 to 2010 long-term average.

Ice extent continues to be far below average in the Kara and Barents seas, as it has been throughout the winter and spring. Extent also remains well below average in the Beaufort Sea, but in the Laptev and East Siberian seas, sea ice extent is near average.

Conditions in context

Figure 2a. The graph above shows Arctic sea ice extent as of August 1, 2016, along with daily ice extent data for four previous years. 2016 is shown in blue, 2015 in green, 2014 in orange, 2013 in brown, and 2012 in purple. The 1981 to 2010 average is in dark gray. The gray area around the average line shows the two standard deviation range of the data. Sea Ice Index data.||Credit: National Snow and Ice Data Center|High-resolution image

Figure 2a. The graph above shows Arctic sea ice extent as of August 1, 2016, along with daily ice extent data for four previous years. 2016 is shown in blue, 2015 in green, 2014 in orange, 2013 in brown, and 2012 in purple. The 1981 to 2010 average is in dark gray. The gray area around the average line shows the two standard deviation range of the data. Sea Ice Index data.

Credit: National Snow and Ice Data Center
High-resolution image

Figure 2b. The plot above shows July 2016 Arctic air temperature anomalies at the 925 hPa level in degrees Celsius and sea level pressure anomalies. Yellows and reds indicate higher than average temperatures and pressure; blues and purples indicate lower than average temperatures and pressure.

Figure 2b. The plot above shows July 2016 Arctic air temperature anomalies at the 925 hPa level in degrees Celsius and sea level pressure anomalies. Yellows and reds indicate higher than average temperatures and pressure; blues and purples indicate lower than average temperatures and pressure.

Credit: NSIDC courtesy NOAA Earth System Research Laboratory Physical Sciences Division
High-resolution image

The rate of ice loss during July 2016 was slightly below average at 83,800 square kilometers (32,400 square miles) per day. The 1981 to 2010 average rate of ice loss for July is 86,800 square kilometers (33,500 square miles) per day.

Warm conditions with temperatures at the 925 hPa level of 1 to 2 degrees Celsius (2 to 4 degrees Fahrenheit) above average graced the northernmost coasts of Alaska, Canada, and Greenland, but the thick sea ice that is typical of this region is unlikely to melt out. Very warm conditions continued in the Kara and Barents seas, with temperatures as much as 3 to 6 degrees Celsius (5 to 11 degrees Fahrenheit) above average, consistent with the retreat of the ice cover to the northern edge of the Svalbard, Franz Josef, and New Siberian Islands. However, the main feature of the climate conditions for the month was a large area of below-average pressure centered over the Laptev Sea, and associated cooler than average conditions in the same area (1 to 4 degrees Celsius or 2 to 7 degrees Fahrenheit). This continues the pattern seen in June, with conditions unfavorable to pronounced sea ice retreat: cloudy and cool, with winds that tend to disperse the ice and increase its extent, rather than compact it.

July 2016 compared to previous years

Figure 3. Monthly July ice extent for 1979 to 2016 shows a decline of 7.3 percent per decade.||Credit: National Snow and Ice Data Center| High-resolution image

Figure 3. Monthly July ice extent for 1979 to 2016 shows a decline of 7.3 percent per decade.

Credit: National Snow and Ice Data Center
High-resolution image

Through 2016, the rate of decline for the month of July is 72,700 square kilometers 28,070 square miles) per year, or 7.3 percent per decade. July extent remained above 2011 and 2012 levels throughout the month, but it was below the 2007 extent for the first half of the month.

A shift in pressure

Figure 4. These graphs show sea level pressure anomalies or differences from average sea level pressure in the Northern Hemisphere for April, May, June, and July 2016.

Figure 4. These graphs show sea level pressure anomalies or differences from average sea level pressure in the Northern Hemisphere for April, May, June, and July 2016.

Credit: NSIDC courtesy NOAA Earth System Research Laboratory Physical Sciences Division
High-resolution image

Beginning in June there was a significant change in the atmospheric circulation over the Arctic. May was characterized by high pressure over the Arctic Ocean which had persisted since the beginning of the year. However, in June the pattern shifted to lower than average pressure. This brought clouds and fairly low temperatures to the region, slowing ice loss. The change in circulation also shifted the pattern of ice motion, slowing the earlier movement of ice away from the coast in the Beaufort Sea (as depicted in our May 3rd post).

This pattern shift is associated with the development of a large and persistent area of moderate high pressure over the northeastern Pacific (south of Alaska) that formed beginning in mid-May. This may be related to an ongoing shift in the Pacific Decadal Oscillation over spring and early summer this year.

Sea ice dances to the changing wind

Figure 5a. These graphs Arctic sea ice motion for May 2 to 8, 2016 (top) and July 25 to 31, 2016 (bottom).

Figure 5a. These graphs show Arctic sea ice motion for May 2 to 8, 2016 (top) and July 25 to 31, 2016 (bottom).

Credit: NSIDC/University of Colorado, M. Tschudi, C. Fowler, J. Maslanik, W. Meier
High-resolution image

Figure 5b. This sea ice concentration image from the Advanced Microwave Scanning Radiometer 2 (AMSR2) shows dispersed sea ice and small polynyas in the Beaufort and East Siberian season July 27, 2016.

Figure 5b. This sea ice concentration image from the Advanced Microwave Scanning Radiometer 2 (AMSR2) shows dispersed sea ice and small polynyas in the Beaufort and East Siberian seas on July 27, 2016.

Credit: University of Bremen
High-resolution image

The shift in air pressure pattern also resulted in a change in sea ice drift directions in the Arctic. Early in the year, sea ice drift had a strong clockwise pattern (Figure 5a, top). However, July conditions greatly reduced sea ice drift speed in the Beaufort Sea and produced a counterclockwise drift pattern in the Laptev Sea (Figure 5a, bottom).

Persistent low pressure and repeated cyclonic storms in the Siberian side of the Arctic tended to disperse the pack and move it away from the coast. By late July, several regions of thin pack and small polynyas were beginning to open in these areas (Figure 5b).

The ice of our forefathers

Figure 6. These graphs show a best estimate of ice extent and sea ice departure from average for the period 1850 to 2013. The top figure shows winter and summer.

Figure 6. These graphs show a best estimate of ice extent and sea ice departure from average for the period 1850 to 2013. The top figure shows winter and summer.

Credit: NOAA at NSIDC
High-resolution image

Earlier this month, NOAA at NSIDC published a new compilation of Arctic sea ice extent using a variety of historical sources, including whaling ship reports and several historical ice chart series from Alaska, the Russian Arctic, Canada, and Denmark. The compilation provides a synthesized mid-monthly estimate extending back to 1850. The study concludes that the current downward trend in sea ice has no precedent in duration or scale of ice loss since 1850. With the exception of the Bering Sea, none of the areas have seen sea ice extents as low as in the past decade. Historical periods that show a decrease in summertime sea ice extent in the Arctic, such as the late 1930’s and 1940’s, are smaller in magnitude than the current downward-trending period.

Further reading

Walsh, J. E., F. Fetterer, J. S. Stewart, and W. L. Chapman. 2016. A database for depicting Arctic sea ice variations back to 1850. Geographical Review. doi: 10.1111/j.1931-0846.2016.12195.x.