After a quick initial freeze-up during the second half of September, ice growth slowed substantially during early October. On October 20, 2016, Arctic sea ice extent began to set new daily record lows for this time of year. After mid-October, ice growth returned to near-average rates, but extent remained at record low levels through late October. High sea surface temperatures in open water areas were important in limiting ice growth. October air temperatures were also unusually high, and this warmth extended from the surface through a considerable depth of the atmosphere.
Overview of conditions
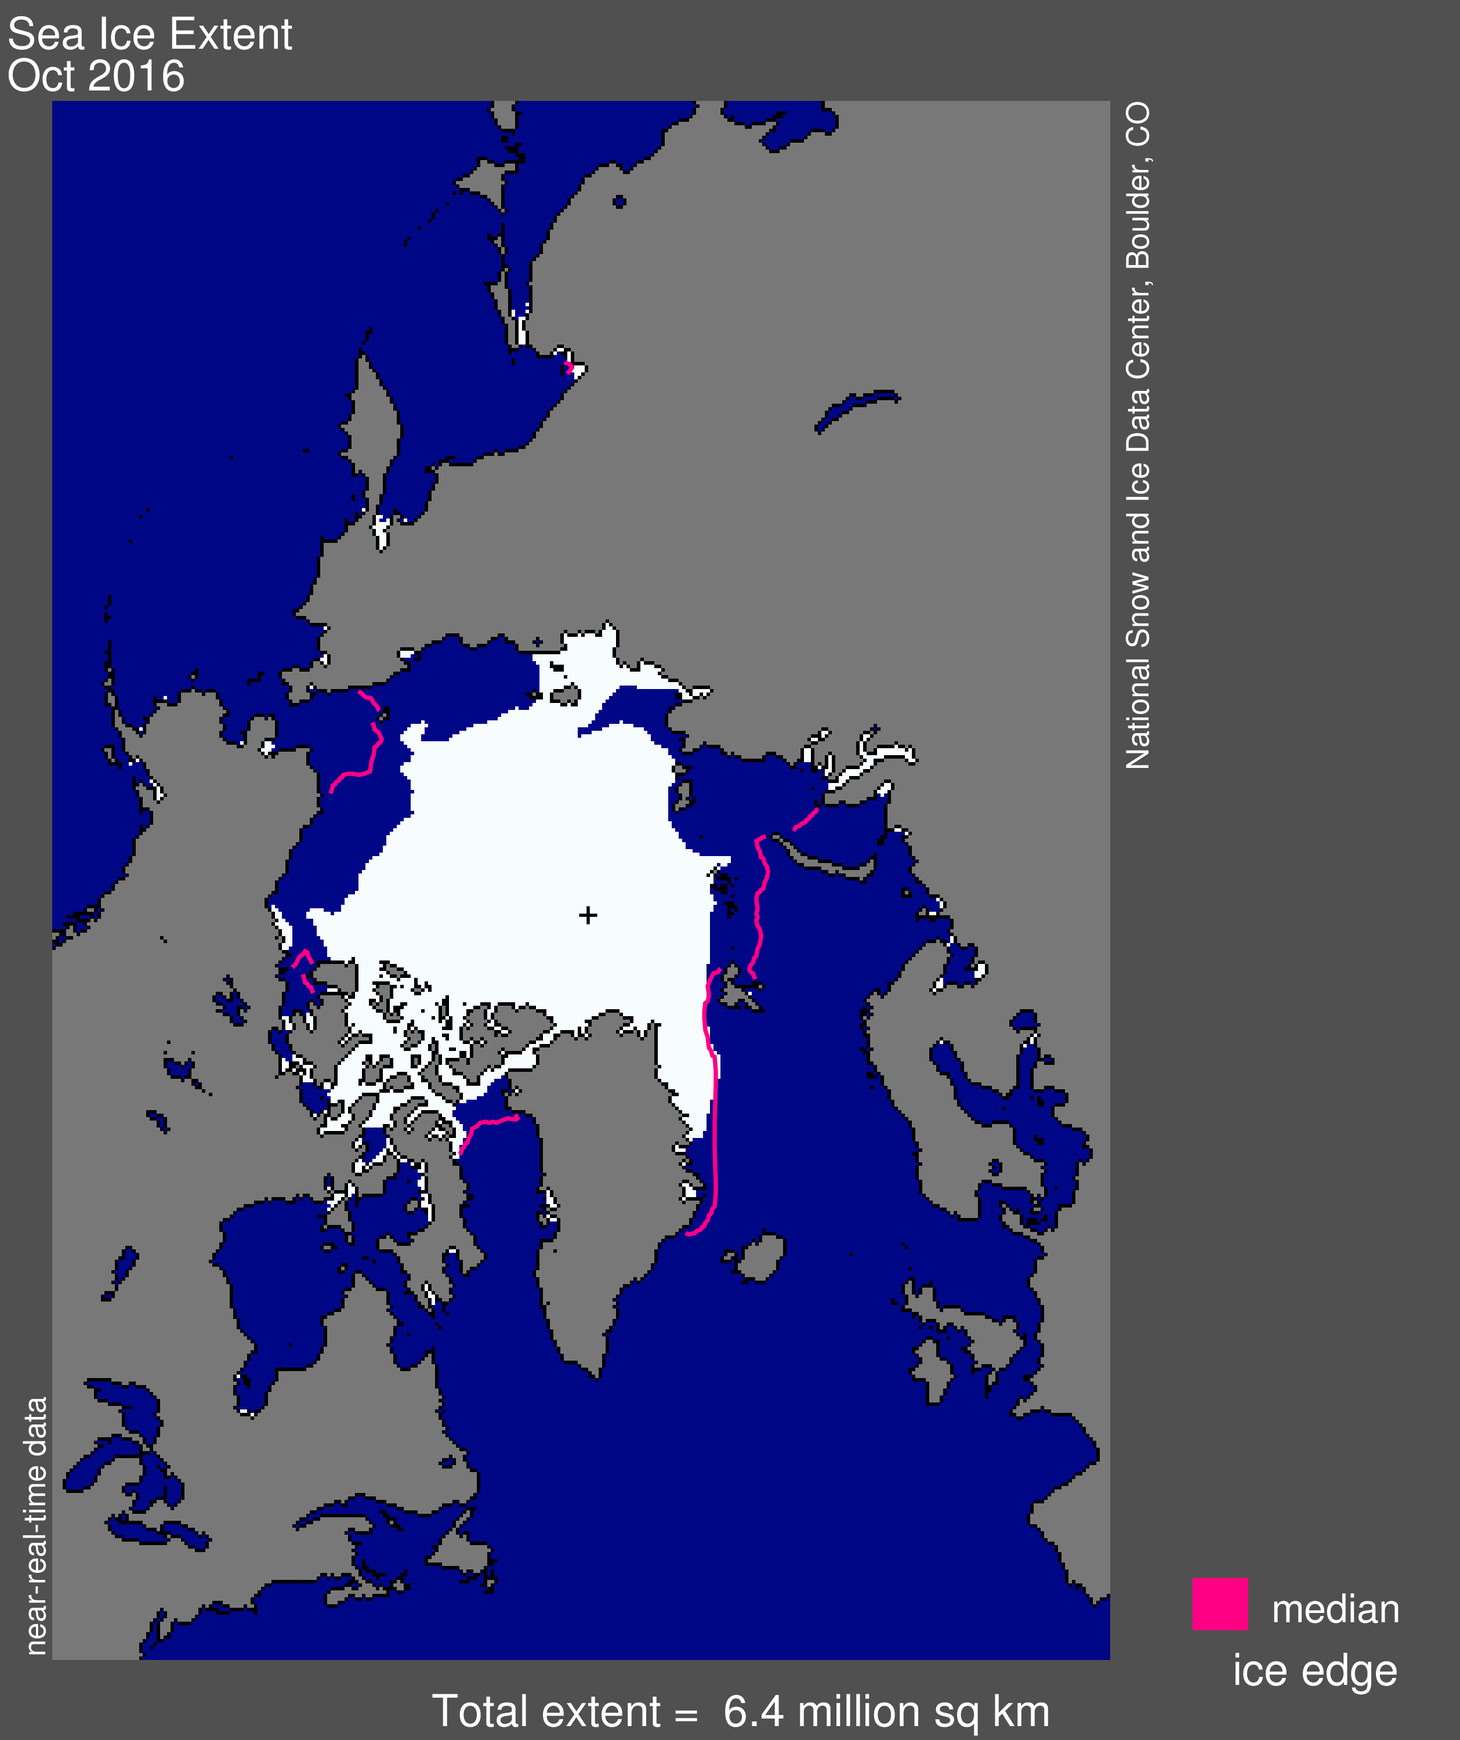
Figure 1. Arctic sea ice extent for October 2016 was 6.40 million square kilometers (2.5 million square miles). The magenta line shows the 1981 to 2010 median extent for that month. The black cross indicates the geographic North Pole. Sea Ice Index data. About the data
Credit: National Snow and Ice Data Center
High-resolution image
In October 2016, Arctic sea ice extent averaged 6.40 million square kilometers (2.5 million square miles), the lowest October in the satellite record. This is 400,000 square kilometers (154,400 square miles) lower than October 2007, the second lowest October extent, and 690,000 square kilometers (266,400 square miles) lower than October 2012, the third lowest. The average extent was 2.55 million square kilometers (980,000 square miles) below the October 1981 to 2010 long-term average.
As of early November, extent remains especially low within the Beaufort, Chukchi, East Siberian, and Kara Seas. Since the beginning of October, ice growth occurred primarily in the Laptev Sea, stretching from the New Siberian Islands towards the coast. Little ice growth occurred in the Kara and Barents Seas, while ice extent increased in the Chukchi and Beaufort Seas.
Conditions in context

Figure 2a. The graph above shows Arctic sea ice extent as of November 1, 2016, along with daily ice extent data for four previous years. 2016 is shown in blue, 2015 in green, 2014 in orange, 2013 in brown, and 2012 in purple. The 1981 to 2010 average is in dark gray. The gray area around the average line shows the two standard deviation range of the data. Sea Ice Index data.
Credit: National Snow and Ice Data Center
High-resolution image

Figure 2b. Sea surface temperatures (SSTs) in October were unusually high over the Chukchi and Beaufort Seas, as well as the Barents and Kara Seas along the Eurasian coast, helping to limit ice growth. This figure shows SSTs on October 25, 2016.
Credit: Climate Change Institute/University of Maine
High-resolution image
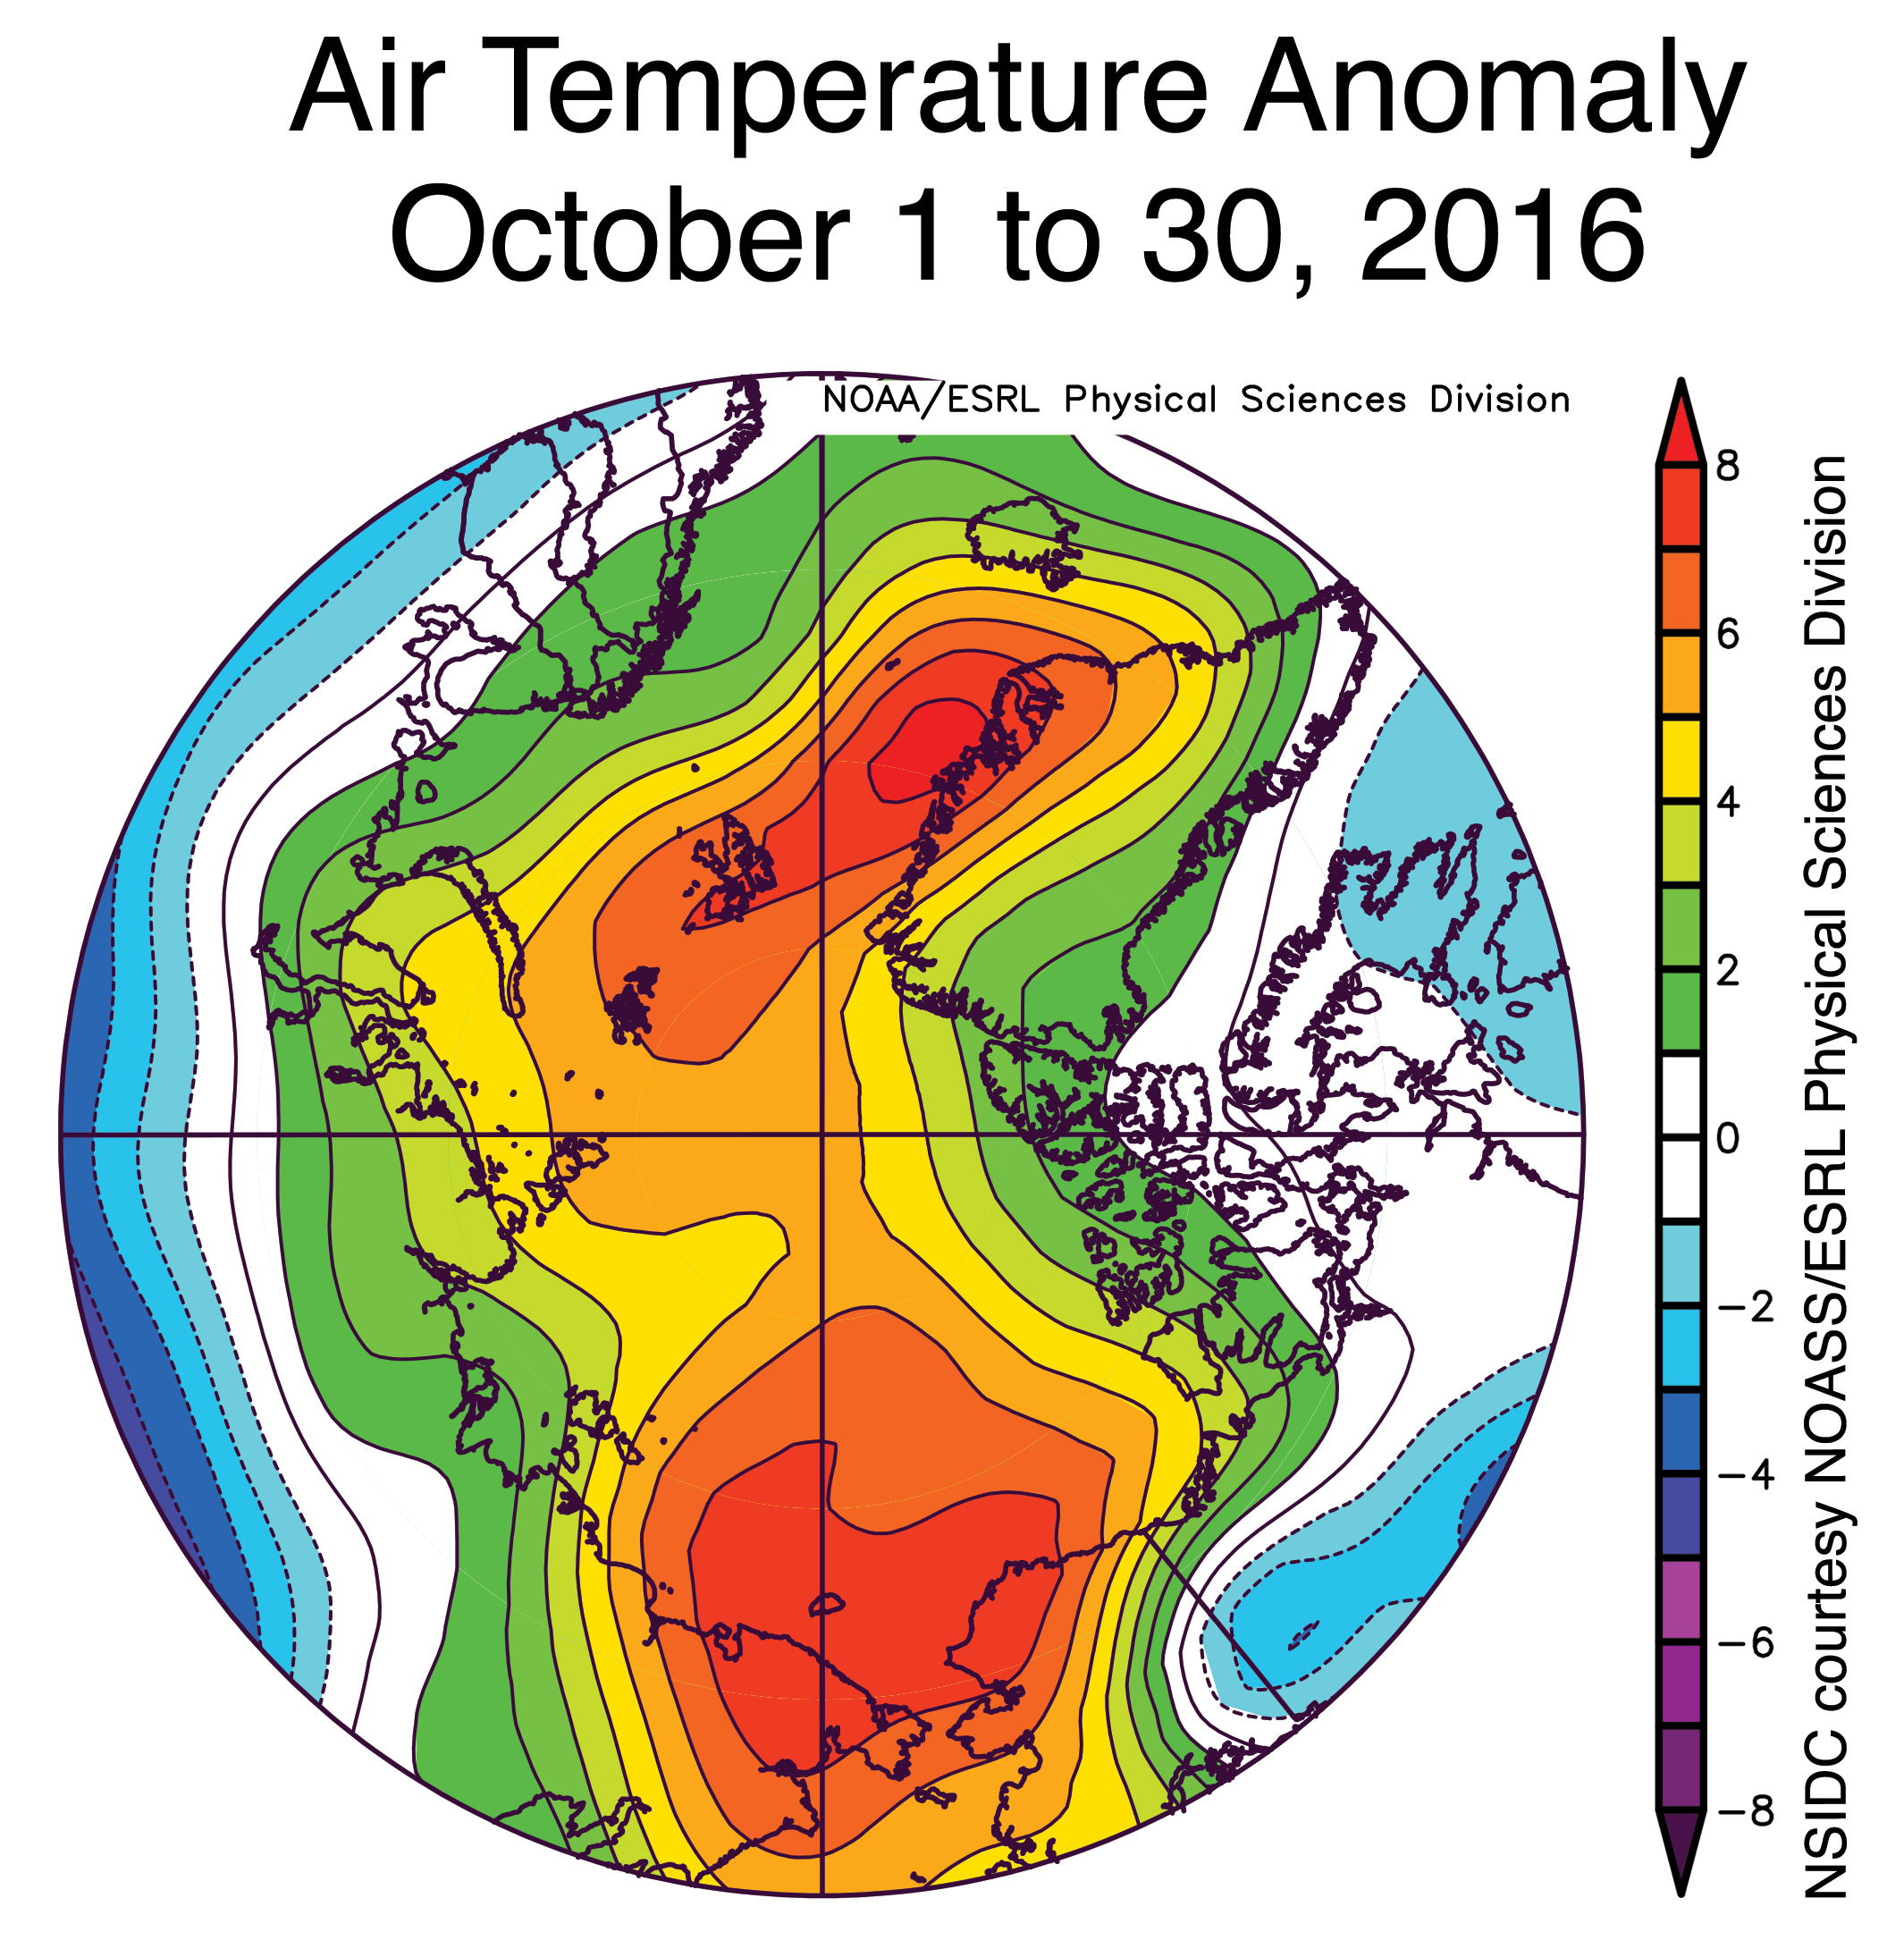
Figure 2c. Air temperatures at the 925 hPa level were usually high over the Beaufort and Chukchi Seas and the East Greenland Sea (up to 8 degrees Celsius or 14 degrees Fahrenheit above average).
Credit: NSIDC courtesy NOAA Earth System Research Laboratory Physical Sciences Division
High-resolution image

Figure 2d. This latitude by height cross section shows that for the Arctic as a whole, air temperatures were above average not just at and near the surface but through a deep layer of the atmosphere. This resulted from the combined effects of high sea surface temperatures in open water areas and the effects of atmospheric circulation drawing warm air into the region.
Credit: NSIDC courtesy NOAA Earth System Research Laboratory Physical Sciences Division
High-resolution image
After an early rapid freeze-up in late September, the rate of ice growth slowed in the first half of October. From October 1 to 15, ice extent increased only 378,000 square kilometers (146,000 square miles), less than a third of the 1981 to 2010 average gain for that period. By October 31, Arctic sea ice extent stood at 7.07 million square kilometers (2.73 million square miles), the lowest extent in the satellite record for that date.
A primary culprit behind the slow growth is that sea surface temperatures in the Beaufort and Chukchi Seas, the Barents and Kara Seas along the Eurasian coast, as well as the East Siberian Sea, were above average. The open water areas in the highest latitudes at the date of the minimum in September had only recently formed and there was little input of solar radiation so far north. So those waters were just above the freezing point. When the atmosphere cooled in September, ice formed rapidly. However, further south, the sea ice had retreated far earlier in the season and a lot of solar energy was absorbed through the summer. This ocean heat inhibited the growth of ice in these regions. Finally toward the end of October, the surface ocean heat began to dissipate, triggering ice formation. However, even by October 25, sea surface temperatures were above average in these areas (Figure 2b).
The atmospheric circulation also played a role. October air temperatures at the 925 hPa level (about 2,500 feet above sea level) were unusually high over most of the Arctic Ocean (Figure 2c), especially over the Beaufort and Chukchi Seas and over the East Greenland Sea (up to 8 degrees Celsius or 14 degrees Fahrenheit above the 1981 to 2010 average). In part, these high temperatures resulted from high sea surface temperatures over the open water areas. However, unusually high sea level pressure centered over northern Scandinavia brought southerly winds from the East Siberian and Barents Seas, contributing to high air temperatures in these regions. In turn, unusually low pressure on the Pacific side centered roughly over the western Bering Sea brought southerly winds over the Beaufort and Chukchi Seas, contributing to unusually high air temperature there. The combined effects of the high sea surface temperatures and atmospheric circulation led to a pattern in which for the Arctic, unusual warmth in October extended from the surface through a deep layer of the atmosphere (Figure 2d).
As noted in our post last month, the Arctic is losing it’s oldest and thickest ice. A new animation from NASA Goddard’s Scientific Visualization Studio shows this loss over the past 30 years.
October 2016 compared to previous years

Figure 3. Monthly October ice extent for 1979 to 2016 shows a decline of 7.4 percent per decade.
Credit: National Snow and Ice Data Center
High-resolution image
Through 2016, the linear rate of decline for October is 66,400 square kilometers or (25,600 square miles) per year, or 7.4 percent per decade.
Antarctic sea ice dropping
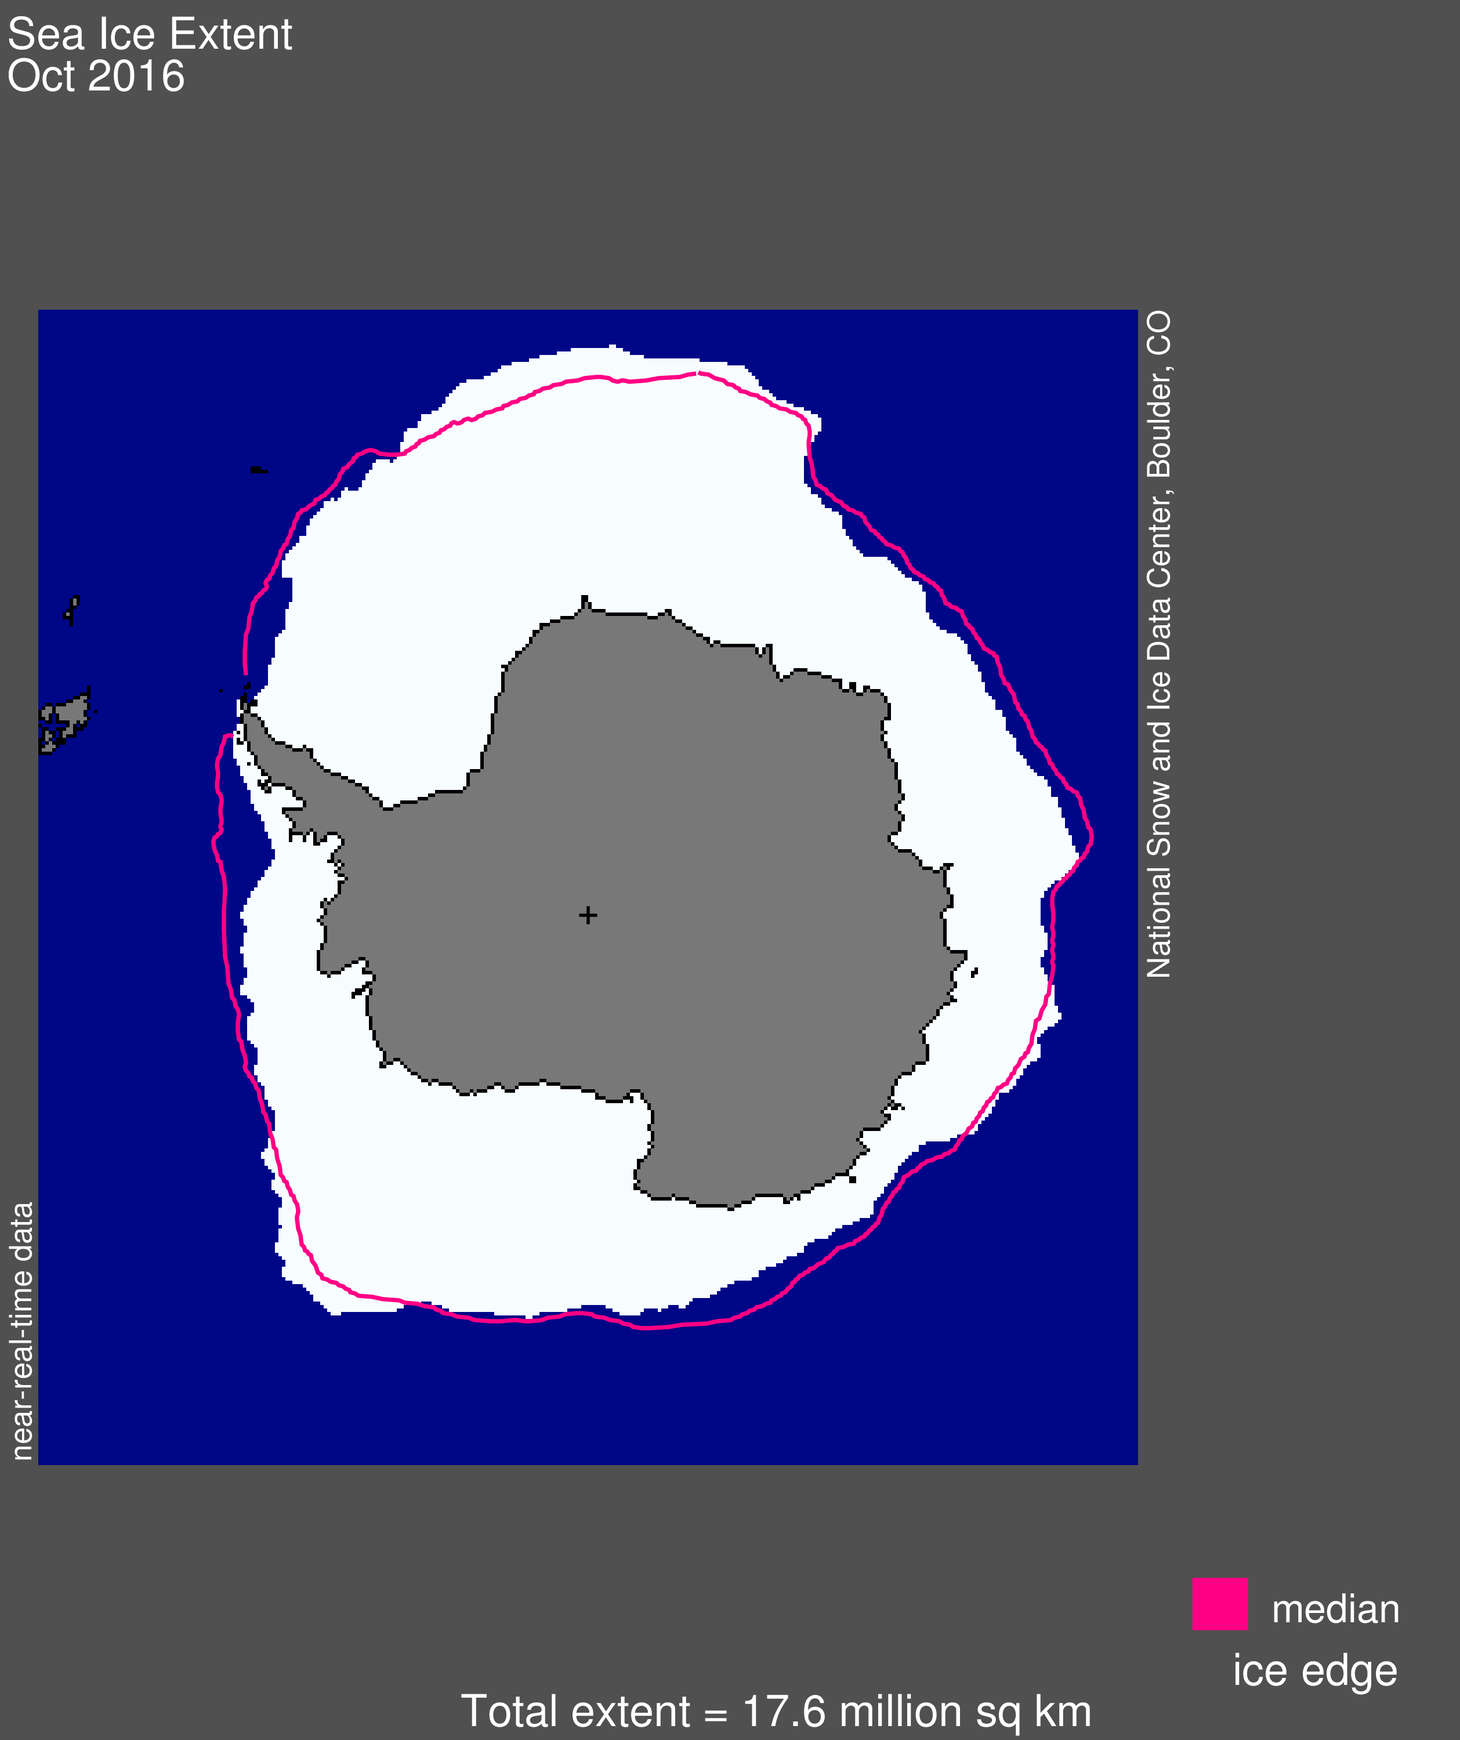
Figure 4. Antarctic sea ice extent for October 2016 was 17.6 million square kilometers (6.8 million square miles). The magenta line shows the 1981 to 2010 median extent for that month. The black cross indicates the geographic South Pole. Sea Ice Index data. About the data
Credit: National Snow and Ice Data Center
High-resolution image
After a reaching its maximum extent unusually early and then following a period of relatively unchanging overall extent, Antarctic sea ice extent started to decline in earnest. Daily sea ice extent levels have been at second lowest in the satellite record since October 20 and below the two standard deviation range. Only the 1986 austral spring extent is lower. Ice extent is particularly low on both sides of the Antarctic Peninsula. The rapid early reduction in sea ice cover in this region may create favorable conditions for the break up of the eastern Peninsula ice shelves at the end of austral summer. Similar sea ice trends and weather conditions were present during the spring seasons preceding past ice shelf retreats (e.g., 2001 to 2002). Extensive open water, created by the downsloping fosters warmer air and surface melting, and allows longer-period ocean waves to reach the ice front of the ice shelves. Other areas of reduced sea ice cover are the Southern Ocean north of Dronning Maud Land, and the area west of the Ross Sea and north of Wilkes Land.

