Since reaching its seasonal minimum on September 10 of 4.14 million square kilometers (1.60 million square miles), Arctic sea ice extent has increased at a rapid rate. Antarctic ice extent saw a sharp decline during the first half of September.
Overview of conditions

Figure 1. Arctic sea ice extent for September 2016 was 4.72 million square kilometers (1.82 million square miles). The magenta line shows the 1981 to 2010 median extent for that month. The black cross indicates the geographic North Pole. Sea Ice Index data. About the data
Credit: National Snow and Ice Data Center
High-resolution image
Arctic sea ice extent during September 2016 averaged 4.72 million square kilometers (1.82 million square miles), the fifth lowest in the satellite record. Average September extent was 1.09 million square kilometers (421,000 square miles) above the record low set in 2012, and 1.82 million square kilometers (703,000 square miles) below the 1981 to 2010 long-term average. Extent remains especially low in the Beaufort, Chukchi and East Siberian Seas. The Northern Sea Route along the Russian coast appears to still be open, but the southern Northwest Passage route (Amundsen’s route) appears to be closed.
Conditions in context
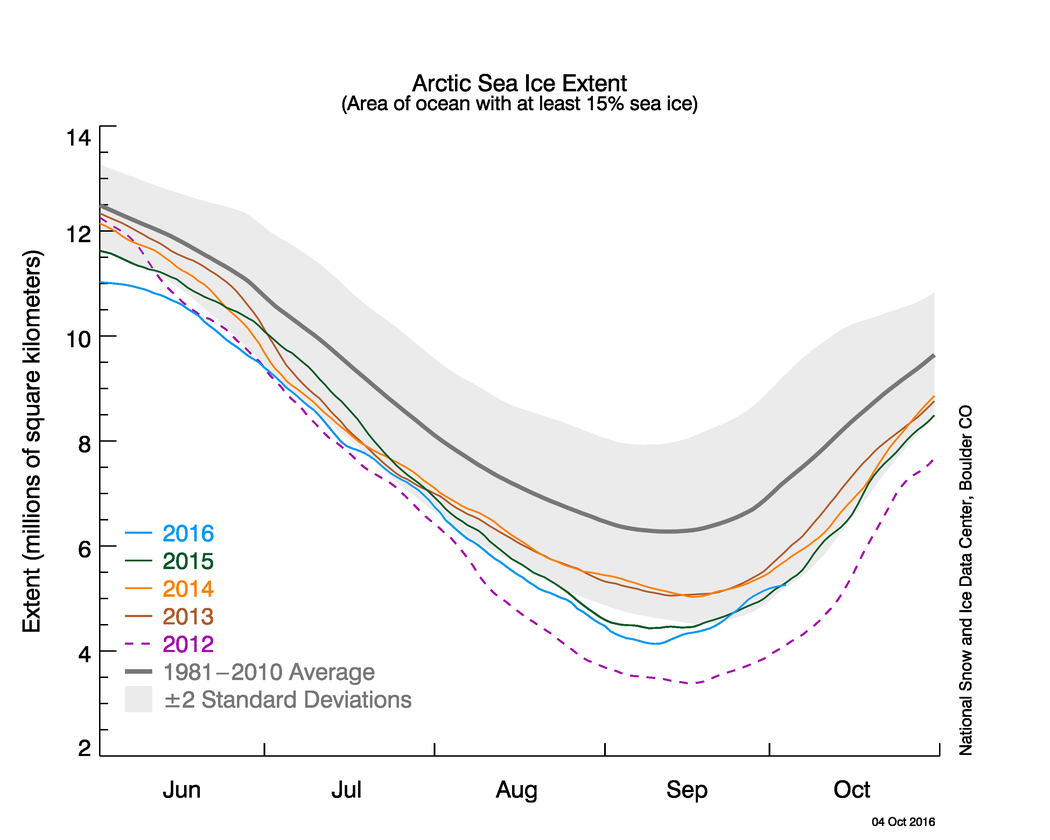
Figure 2. The graph above shows Arctic sea ice extent as of October 4, 2016, along with daily ice extent data for four previous years. 2016 is shown in blue, 2015 in green, 2014 in orange, 2013 in brown, and 2012 in purple. The 1981 to 2010 average is in dark gray. The gray area around the average line shows the two standard deviation range of the data. Sea Ice Index data.
Credit: National Snow and Ice Data Center
High-resolution image
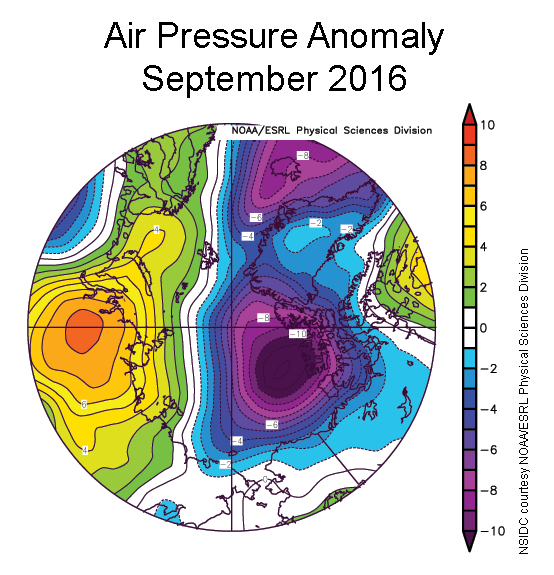
Figure 2b. This plot shows Arctic sea level pressure difference from average for September 2016. Yellows and reds indicate higher than average pressures; blues and purples indicate lower than average pressures.
Credit: NSIDC courtesy NOAA/ESRL Physical Sciences Division
High-resolution image
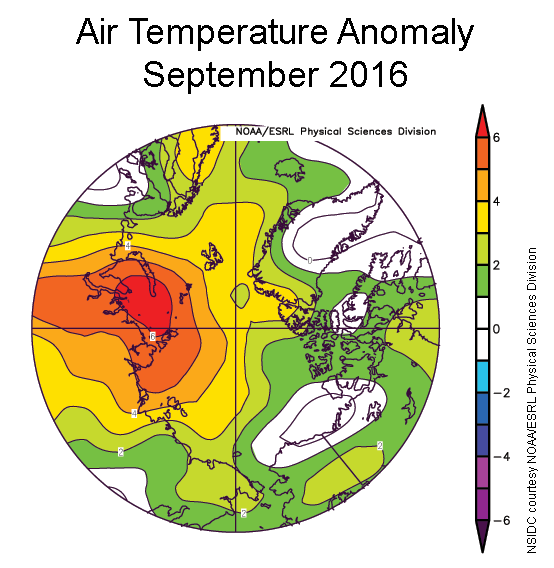
Figure 2c. This plot shows Arctic air temperature (at the 925 hPA level) difference from average for September 2016. Yellows and reds indicate higher than average temperatures; blues and purples indicate lower than average temperatures.
Credit: NSIDC courtesy NOAA/ESRL Physical Sciences Division
High-resolution image
As of October 1, Arctic sea ice extent stood at 5.19 million square kilometers (2.00 million square miles), which is an increase of 1.05 million square kilometers (405,000 square kilometers) from the seasonal minimum of 4.14 million square kilometers (1.60 million square miles) recorded on September 10. Compared to some other years, the growth rate since the seasonal minimum has been quite rapid. The ice growth has been predominantly in the central Arctic Ocean and the East Siberian Sea sector. There has been little ice growth in the Laptev and Kara Seas, and ice has actually retreated in the Barents Sea.
September saw a shift in weather patterns. The summer of 2016 was characterized by unusually low pressure over the central Arctic Ocean, west of the dateline. While low pressure was still a dominant feature of September, the center of low pressure shifted towards North America, and a center of high pressure strengthened over north central Eurasia (Figure 2b). Conditions under the high pressure region were quite warm; temperatures at the 925 hPa level were up to 6 degrees Celsius (11 degrees Fahrenheit) above the 1981 to 2010 average (Figure 2c).
September 2016 compared to previous years

Figure 3. Monthly September ice extent for 1979 to 2016 shows a decline of 13.3% per decade.
Credit: National Snow and Ice Data Center
High-resolution image
Through 2016, the linear rate of decline for September is 87,200 square kilometers (33,700 square miles) per year, or 13.3 percent per decade. While the absolute seasonal minimum for 2016 was tied with 2007 as second lowest, the average extent for the month of September 2016 of 4.72 million square kilometers (1.82 million square miles) ends up being fifth lowest in the satellite record, behind both 2012 and 2007. This reflects the rapid growth of ice following the seasonal minimum recorded on September 10.
Antarctic sea ice reaches winter maximum on a record early date
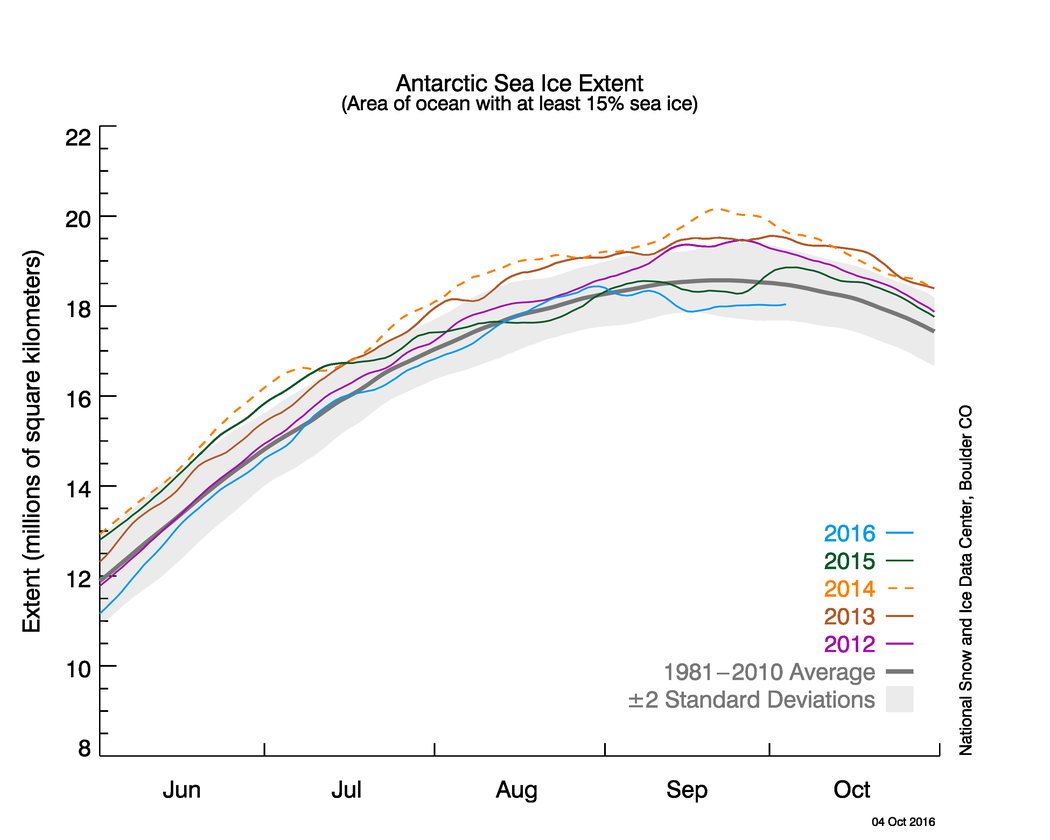
Figure 4. The graph above shows Antarctic sea ice extent as of October 4, 2016, along with daily ice extent data for four previous years. 2016 is shown in blue, 2015 in green, 2014 in orange, 2013 in brown, and 2012 in purple. The 1981 to 2010 average is in dark gray. The gray area around the average line shows the two standard deviation range of the data. Sea Ice Index data.
Credit: National Snow and Ice Data Center
High-resolution image
Antarctic sea ice extent reached 18.44 million square kilometers (7.12 million square miles) on August 31, 2016, and this appears to be the maximum extent for this year. This is the earliest maximum in the satellite record since 1979, and the first time the maximum has occurred in August. The maximum was 240,000 square kilometers (93,000 square miles) greater than the average extent for this date of 18.20 million square kilometers (7.03 million square miles). It is the tenth lowest maximum extent on record. On average, the maximum occurs much later (September 23 to 24).
The early maximum appears to be the result of an intense wind pattern in September, spanning nearly half of the continent from the Wilkes Land area to the Weddell Sea, and centered on the Amundsen Sea. Stronger than average low pressure in this area, coupled with high pressure near the Falkland Islands, and near the southern tip of New Zealand in the Pacific Ocean, created two regions of persistent northwesterly winds. Sea ice extent decreased in the areas where the northwesterly winds reached the ice front.
A comparison of sea ice extent from the date of the maximum (August 31) and the last day of September (one month later) shows that sea ice extent decreased through the month along a broad region west and east of the Antarctic Peninsula. It also decreased on the other side of the continent north of Wilkes Land. By comparison, this was partly offset by increases in the northern Amundsen Sea and north of Dronning Maud Land.
The 2016 Arctic melt season in review
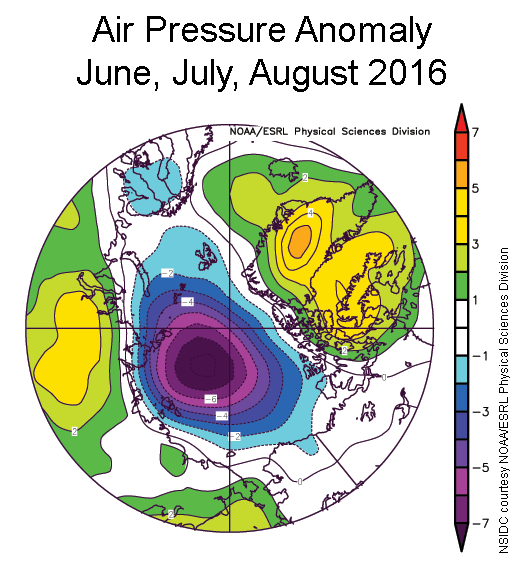
Figure 5a. This plot shows Arctic sea level pressure difference from average for June, July, and August 2016. Yellows and reds indicate higher than average pressures; blues and purples indicate lower than average pressures.
Credit: NSIDC courtesy NOAA/ESRL Physical Sciences Division
High-resolution image
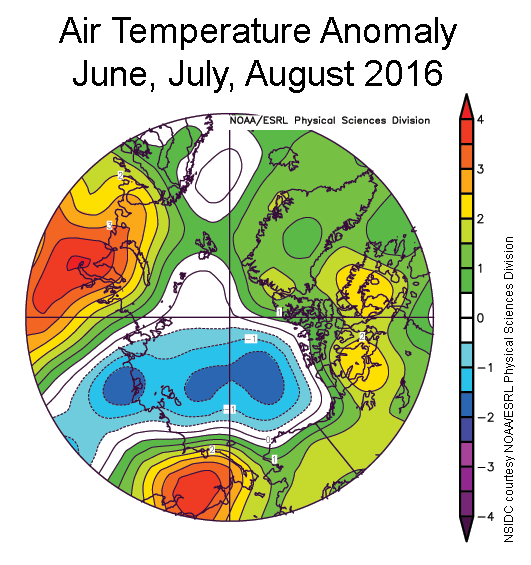
Figure 5b. This plot shows Arctic air temperature (at the 925 hPA level) difference from average for June, July, and August 2016. Yellows and reds indicate higher than average temperatures; blues and purples indicate lower than average temperatures.
Credit: NSIDC courtesy NOAA/ESRL Physical Sciences Division
High-resolution image
The winter of 2015/2016 was extremely warm over the Arctic Ocean. The maximum sea ice extent in March set a new low in the satellite record, barely beating out March 2015. Extent for the month of March as a whole ended up second lowest on record. In April, problems with the F-17 sensor forced a temporary cessation of sea ice updates until data from the newer F-18 satellite could be brought online. Data from other sources documented that during this time, ice was still tracking very low. The months of May and June set more record lows in ice extent.
Although the onset of surface melt was early over much of the Arctic Ocean, as the melt season progressed, a pattern of stormy weather set up. This ended up being a very persistent pattern; as averaged from June through August, sea level pressure was much lower than average over the central Arctic Ocean (Figure 5a), and air temperatures over most of the ocean were average or below average (Figure 5b). Such conditions have been previously shown to limit summer ice loss, and by the early August it became clear that a new record low for September extent was not in the offing. Two very strong storms crossed the central Arctic Ocean in August. In 2012, a strong storm contributed to accelerated ice loss, but this year, the overall influence of the storms remains unclear.
Despite the generally unfavorable weather conditions, the seasonal minimum of 4.14 million square kilometers (1.60 million square miles), reached on September 10, ended up in a statistical tie with 2007 as the second lowest in the satellite record. While previous analyses have shown that there is little correlation between the seasonal maximum extent and the season minimum extent, in large part because of the strong impacts of summer weather patterns, it is likely that the 2016 melt season started with a lot of fairly thin ice. This may help to explain why, despite summer weather unfavorable to sea ice loss, extent at the seasonal minimum ended up tied for second lowest.
Sea ice age
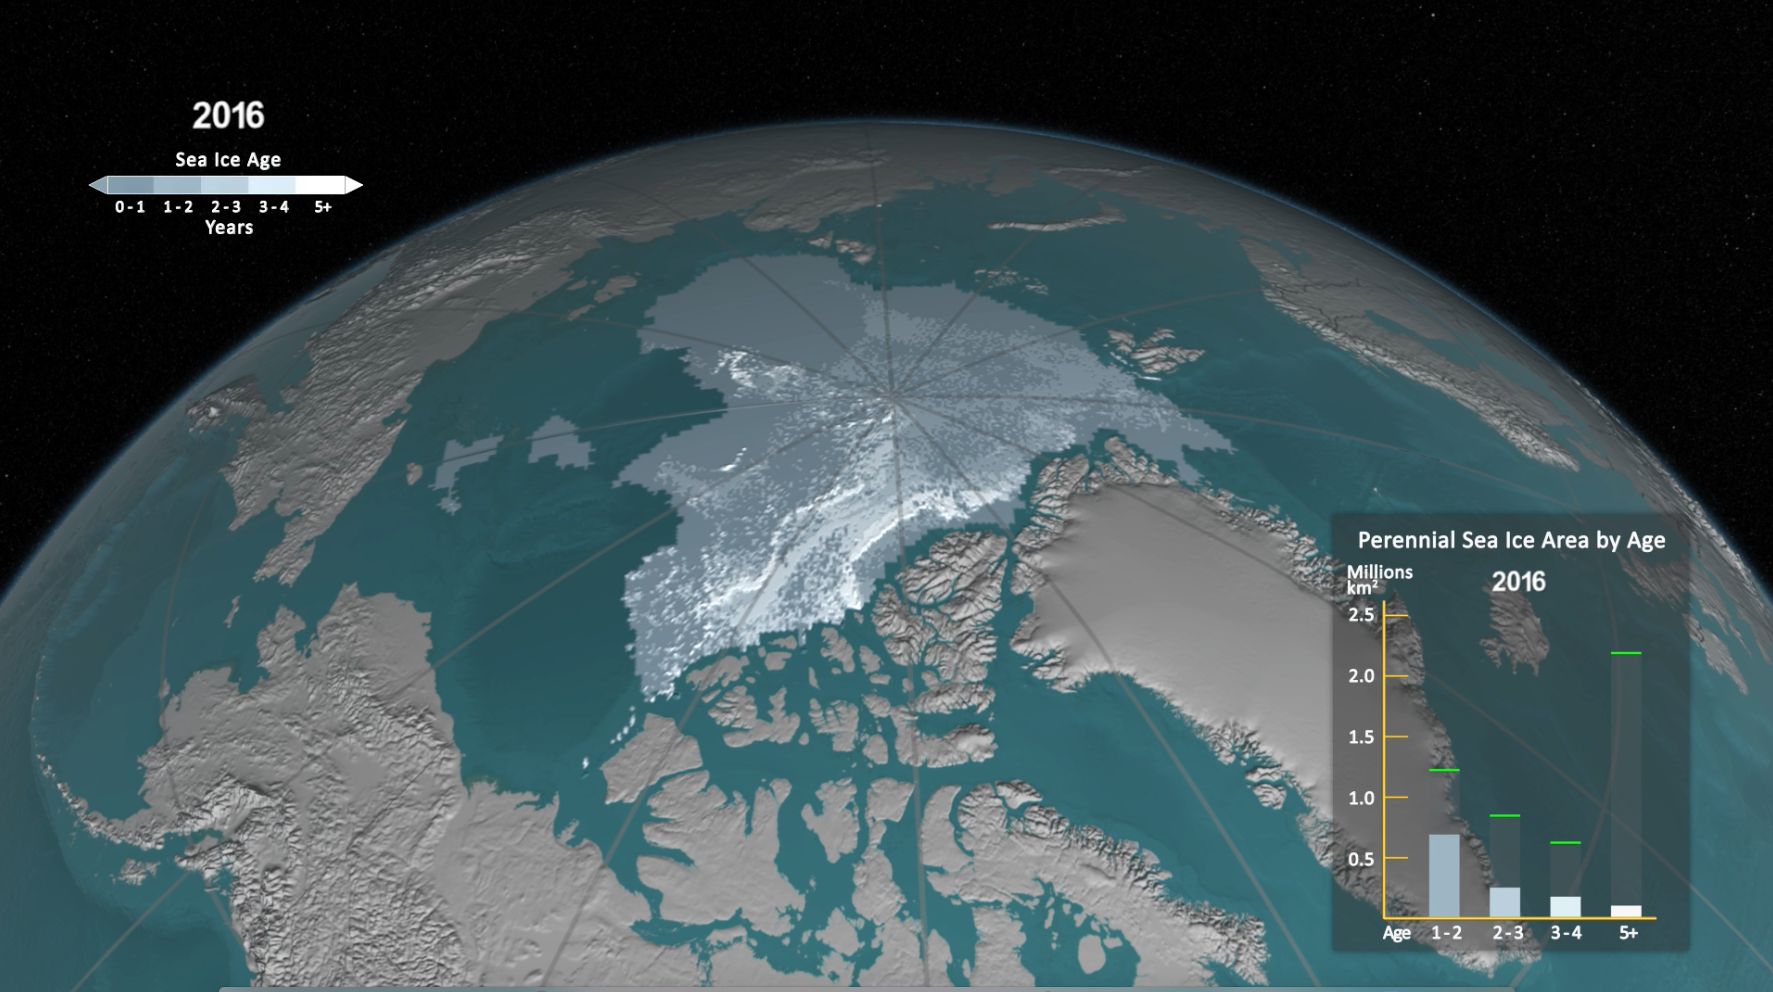
Figure 6. This image shows sea ice age for the week of the 2016 sea ice minimum. The bar chart shows the extent of each multi-year age category (in millions of square kilometers); the green lines on the bar chart are the high values in the satellite record for the minimum week.
Credit: NASA Scientific Visualization Studio
High-resolution image
Age is another indicator of the state of sea ice because older ice is generally thicker ice (Tschudi et al., 2016). As mentioned in previous posts, there has been an overall decline in ice age, particularly the oldest ice types—ice that has been in the Arctic for more than four years. Near-real-time updates (which are preliminary) indicate that at this year’s minimum, only 106,000 square kilometers (41,000 square miles) of 4+ year old ice remained, or 3.1 percent of the total ice extent. This is in stark contrast to the mid-1980s when over 2 million square kilometers (33 percent, or 772,000 square miles) of the summer minimum extent was composed of old ice that had survived at least four summer melt seasons.
Reference
Tschudi, M.A., J.C. Stroeve, and J.S. Stewart. 2016. Relating the age of Arctic sea ice to its thickness, as measured during NASA’s ICESat and IceBridge campaigns. Remote Sensing, 8, 457, doi:10.3390/rs8060457.

