The National Snow and Ice Data Center (NSIDC) is part of the Cooperative Institute for Research in Environmental Sciences (CIRES) at the University of Colorado Boulder. NSIDC scientists provide Sea Ice Today content, with partial support from NASA.
BOULDER, Colo, March 28, 2016—Arctic sea ice was at a record low maximum extent for the second straight year, according to scientists at the National Snow and Ice Data Center (NSIDC) and NASA.
“I’ve never seen such a warm, crazy winter in the Arctic,” said NSIDC director Mark Serreze. “The heat was relentless.” Air temperatures over the Arctic Ocean for the months of December, January and February were 2 to 6 degrees Celsius (4 to 11 degrees Fahrenheit) above average in nearly every region.
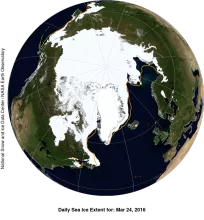
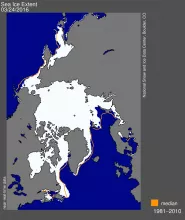
Sea ice extent over the Arctic Ocean averaged 14.52 million square kilometers (5.607 million square miles) on March 24, beating last year’s record low of 14.54 million square kilometers (5.612 million square miles) on February 25. Unlike last year, the peak was later than average in the 37-year satellite record, setting up a shorter than average ice melt season for the coming spring and summer.
According to NSIDC, sea ice extent was below average throughout the Arctic, except in the Labrador Sea, Baffin Bay, and Hudson Bay. It was especially low in the Barents Sea. As noted by Ingrid Onarheim at the Bjerknes Centre for Climate Research in Bergen, Norway: “A decrease in Barents Sea ice extent for this winter was predicted from the influence of warm Atlantic waters from the Norwegian Sea.”
Scientists are watching extent in this area because it will help them understand how a slower Atlantic Meridional Overturning Circulation (AMOC) may affect Arctic sea ice. “Some studies suggest that decreased heat flux of warm Atlantic waters could lead to a recovery of all Arctic sea ice in the near future,” said NSIDC senior research scientist Julienne Stroeve. “I think it will have more of a winter impact and could lead to a temporary recovery of winter ice extent in the Barents and Kara seas.”
This year’s maximum extent is 1.12 million square kilometers (431,000 square miles) below the 1981 to 2010 average of 15.64 million square kilometers (6.04 million square miles) and 13,000 square kilometers (5,000 square miles) below the previous lowest maximum that occurred last year.
This late winter, ice extent growth in the Arctic has been sluggish. “Other than a brief spurt in late February, extent growth has been slow for the past six weeks,” said Walt Meier, a research scientist at the NASA Goddard Space Flight Center. Meier is an affiliate scientist at NSIDC and is part of NSIDC’s Sea Ice Today team.
Ice extent increases through autumn and winter, and the maximum typically occurs in mid March. Sea ice then retreats through spring and summer and shrinks to its smallest or minimum extent typically by mid September.
The September Arctic minimum began drawing attention in 2005 when it first shrank to a record low extent over the period of satellite observations. It broke the record again in 2007, and then again in 2012. The March Arctic maximum has typically received less attention. That changed last year when the maximum extent was the lowest in the satellite record.
“The Arctic is in crisis. Year by year, it’s slipping into a new state, and it’s hard to see how that won’t have an effect on weather throughout the Northern Hemisphere,” said Ted Scambos, NSIDC lead scientist.
NSIDC will release a full analysis of the winter season in early April, once monthly data are available for March.
To read the current analysis from NSIDC scientists, see NSIDC's Sea Ice Today.
For more about Arctic sea ice, see NSIDC's Arctic Sea Ice 101.
See the NASA release here.
View the NASA animation here.
Download high-resolution images
