An extensive area of lower than average temperatures in the Central Arctic and the Siberian coast, attended by persistent low pressure systems in the same region, led to slightly slower than average sea ice decline through the month. The stormy pattern contributed to a dispersed and ragged western Arctic ice pack for July, with several polynyas beginning to form late in the month. A new record low September ice extent now appears to be unlikely.
Overview of conditions
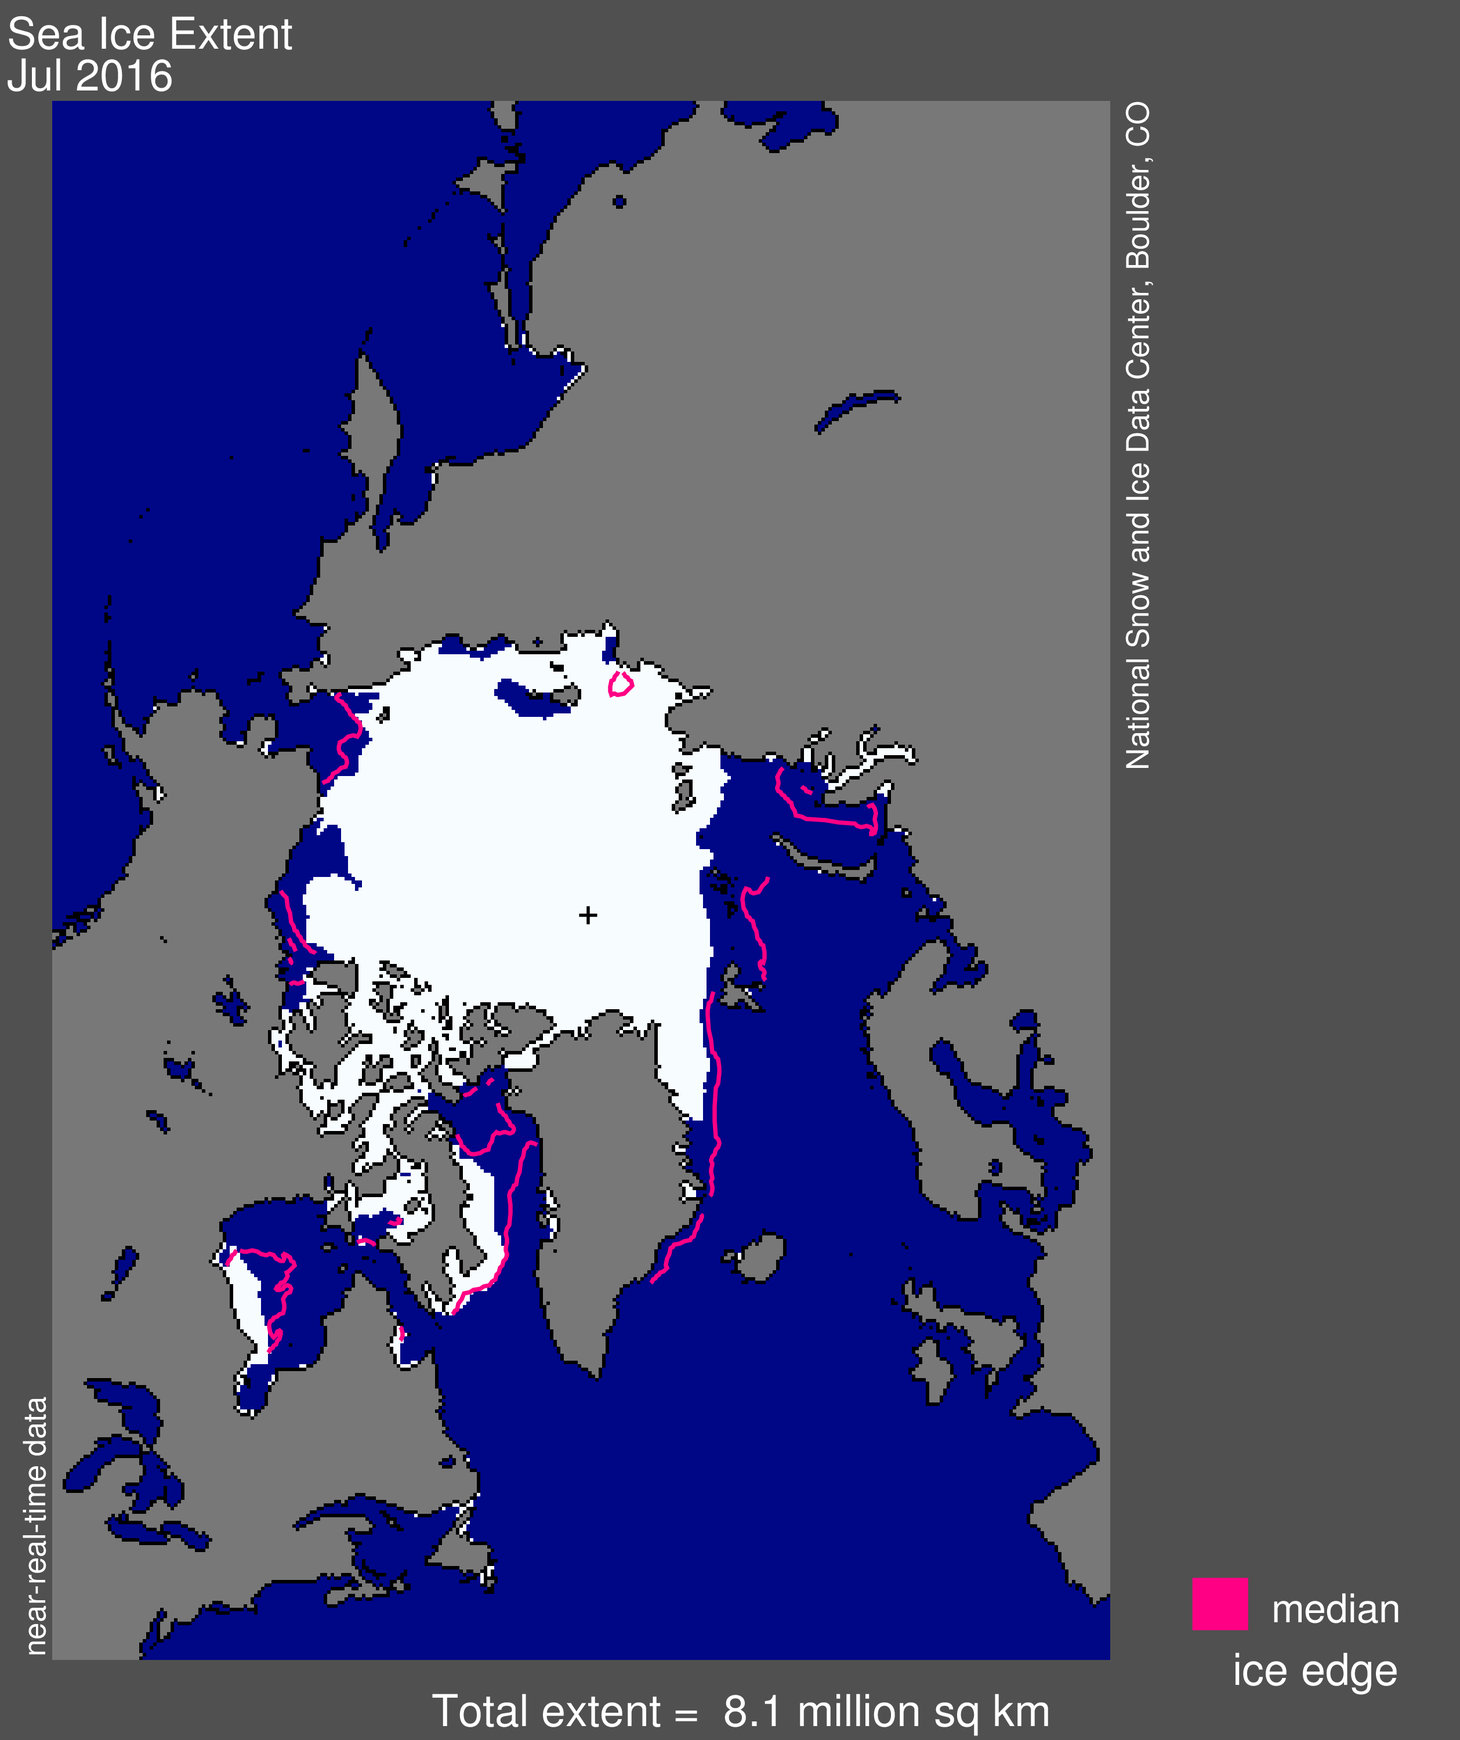
Figure 1. Arctic sea ice extent for July 2016 averaged 8.13 million square kilometers (3.14 million square miles). The magenta line shows the 1981 to 2010 median extent for that month. The black cross indicates the geographic North Pole. Sea Ice Index data. About the data
Credit: National Snow and Ice Data Center
High-resolution image
Arctic sea ice extent for July averaged 8.13 million square kilometers (3.14 million square miles), the third lowest July extent in the satellite record. This makes July only the second month so far this year that did not have a record low extent. July’s extent is 190,000 square kilometers (73,000 square miles) above the previous record low set in 2011, and 1.65 million square kilometers (637,000 square miles) below the 1981 to 2010 long-term average.
Ice extent continues to be far below average in the Kara and Barents seas, as it has been throughout the winter and spring. Extent also remains well below average in the Beaufort Sea, but in the Laptev and East Siberian seas, sea ice extent is near average.
Conditions in context
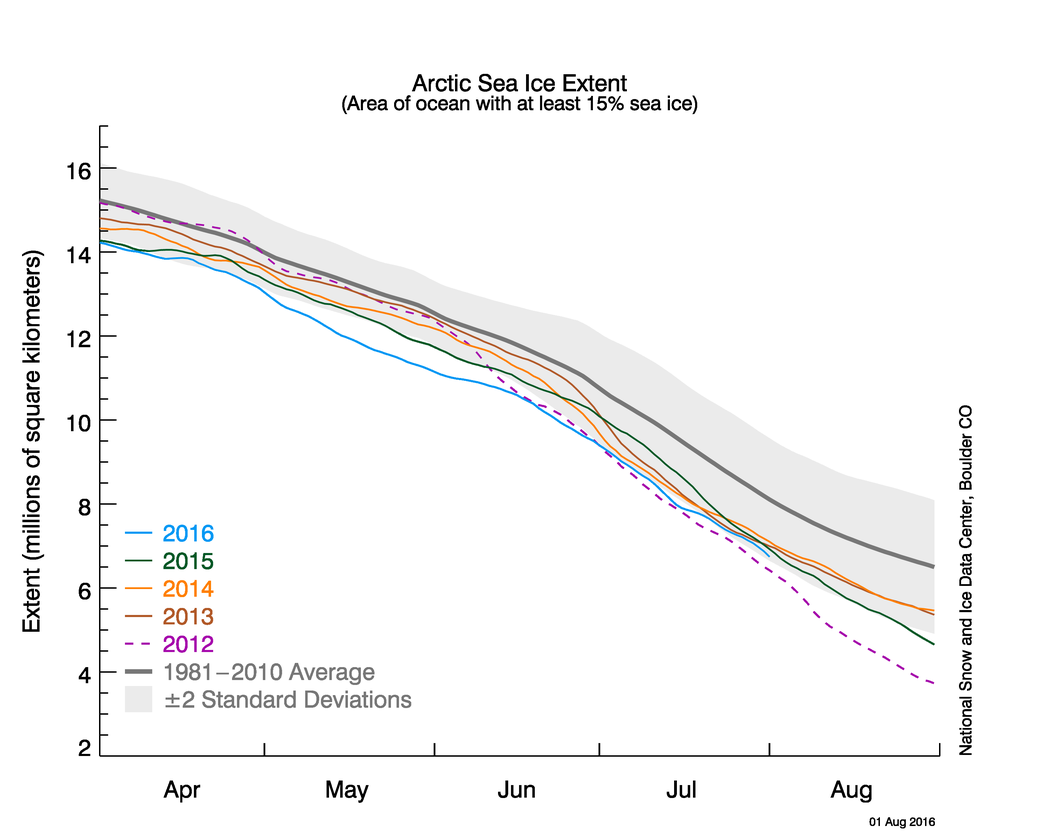
Figure 2a. The graph above shows Arctic sea ice extent as of August 1, 2016, along with daily ice extent data for four previous years. 2016 is shown in blue, 2015 in green, 2014 in orange, 2013 in brown, and 2012 in purple. The 1981 to 2010 average is in dark gray. The gray area around the average line shows the two standard deviation range of the data. Sea Ice Index data.
Credit: National Snow and Ice Data Center
High-resolution image
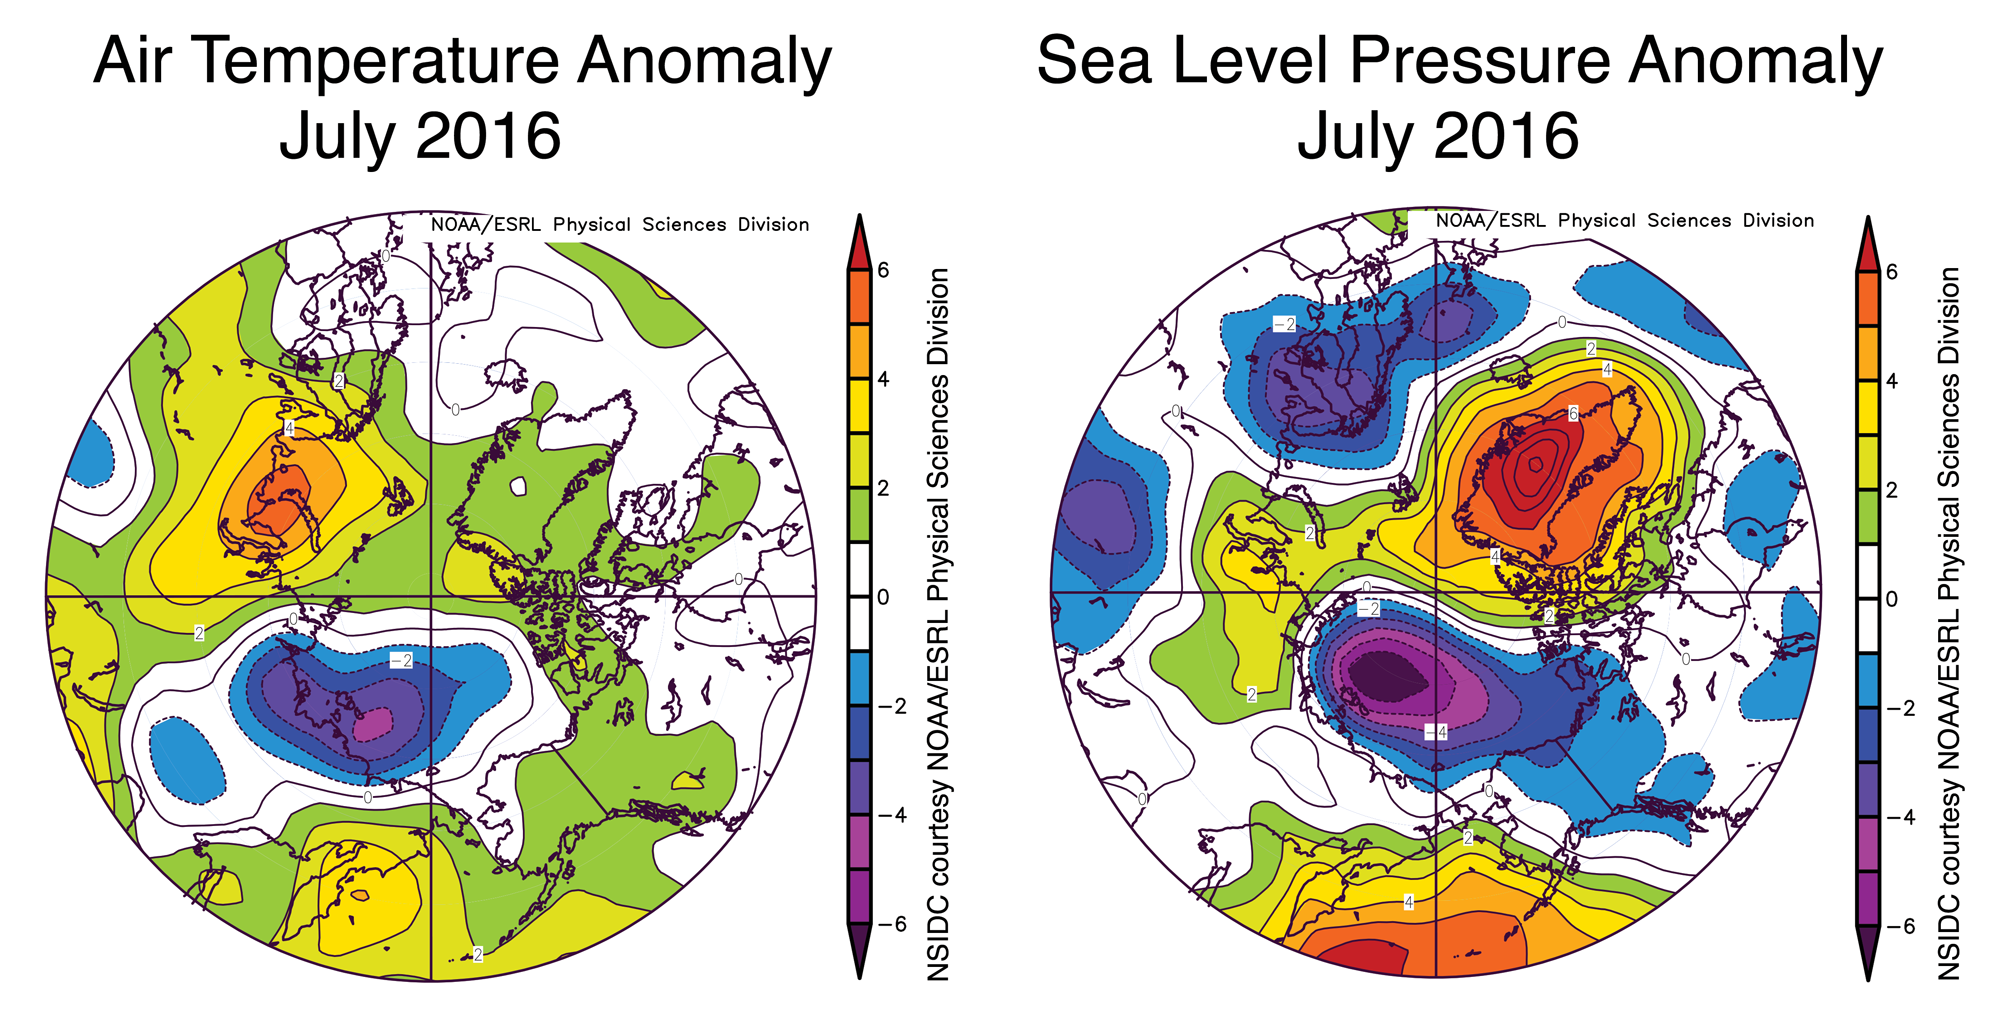
Figure 2b. The plot above shows July 2016 Arctic air temperature anomalies at the 925 hPa level in degrees Celsius and sea level pressure anomalies. Yellows and reds indicate higher than average temperatures and pressure; blues and purples indicate lower than average temperatures and pressure.
Credit: NSIDC courtesy NOAA Earth System Research Laboratory Physical Sciences Division
High-resolution image
The rate of ice loss during July 2016 was slightly below average at 83,800 square kilometers (32,400 square miles) per day. The 1981 to 2010 average rate of ice loss for July is 86,800 square kilometers (33,500 square miles) per day.
Warm conditions with temperatures at the 925 hPa level of 1 to 2 degrees Celsius (2 to 4 degrees Fahrenheit) above average graced the northernmost coasts of Alaska, Canada, and Greenland, but the thick sea ice that is typical of this region is unlikely to melt out. Very warm conditions continued in the Kara and Barents seas, with temperatures as much as 3 to 6 degrees Celsius (5 to 11 degrees Fahrenheit) above average, consistent with the retreat of the ice cover to the northern edge of the Svalbard, Franz Josef, and New Siberian Islands. However, the main feature of the climate conditions for the month was a large area of below-average pressure centered over the Laptev Sea, and associated cooler than average conditions in the same area (1 to 4 degrees Celsius or 2 to 7 degrees Fahrenheit). This continues the pattern seen in June, with conditions unfavorable to pronounced sea ice retreat: cloudy and cool, with winds that tend to disperse the ice and increase its extent, rather than compact it.
July 2016 compared to previous years
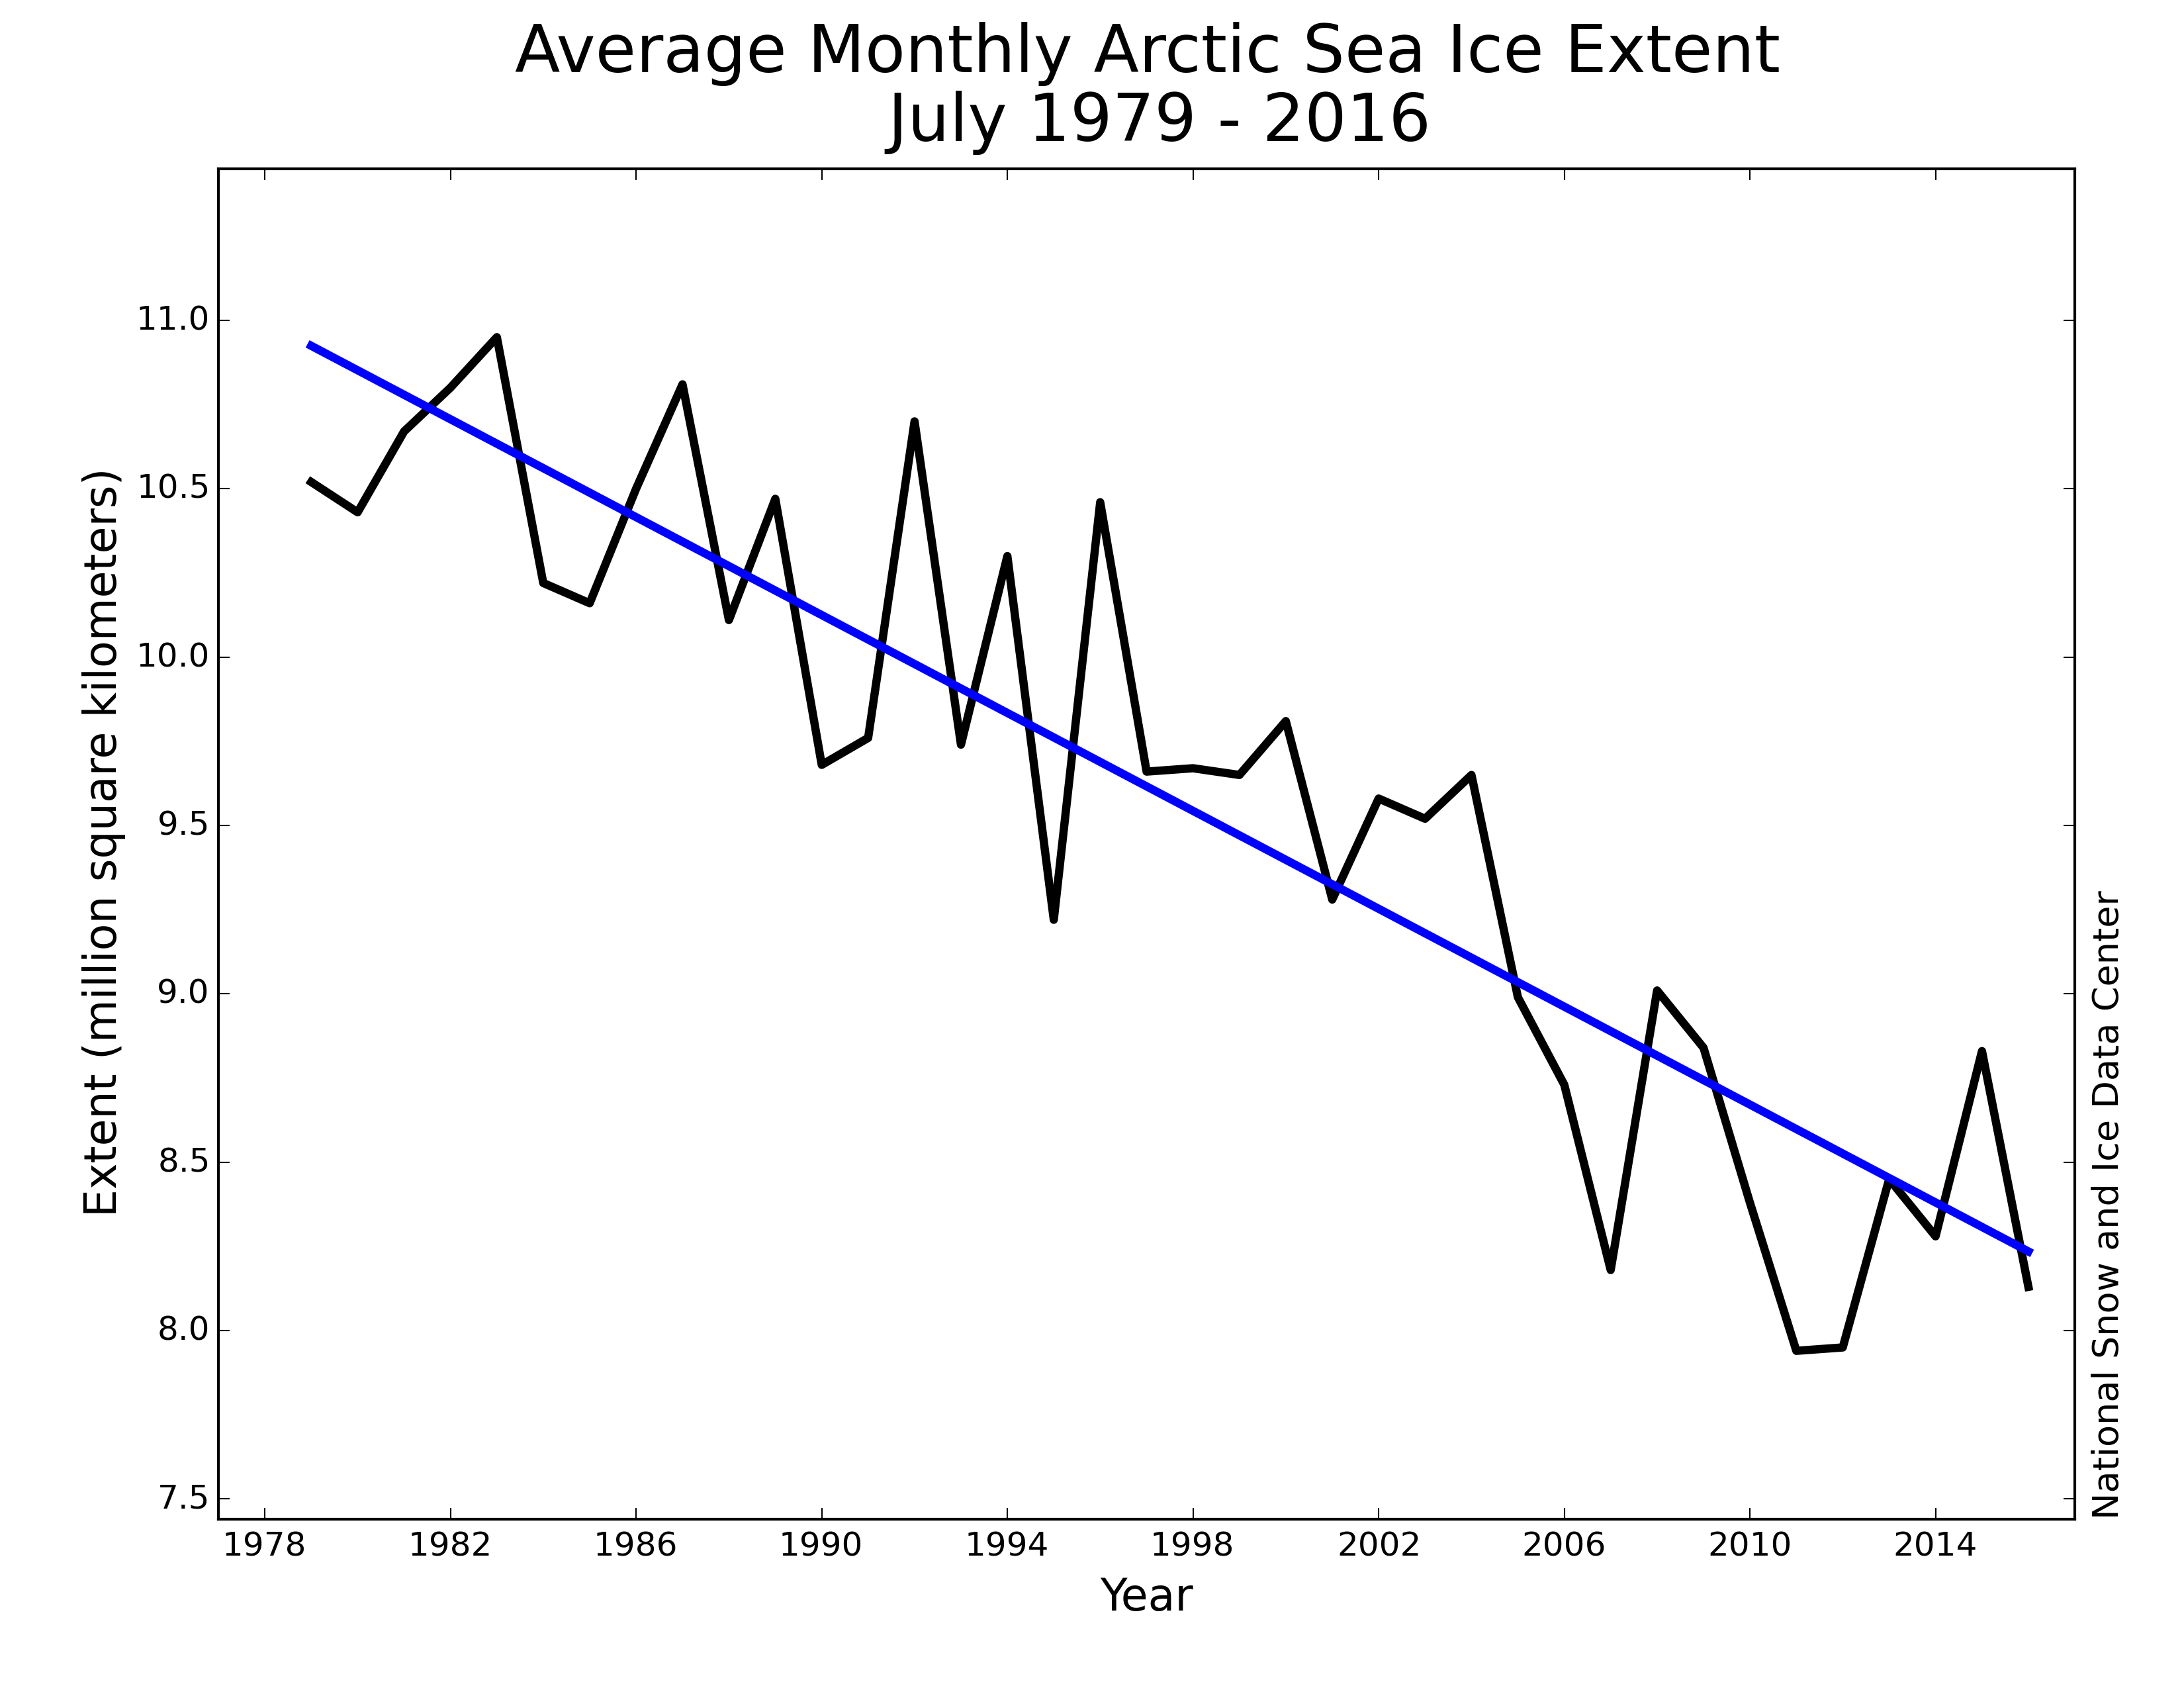
Figure 3. Monthly July ice extent for 1979 to 2016 shows a decline of 7.3 percent per decade.
Credit: National Snow and Ice Data Center
High-resolution image
Through 2016, the rate of decline for the month of July is 72,700 square kilometers 28,070 square miles) per year, or 7.3 percent per decade. July extent remained above 2011 and 2012 levels throughout the month, but it was below the 2007 extent for the first half of the month.
A shift in pressure
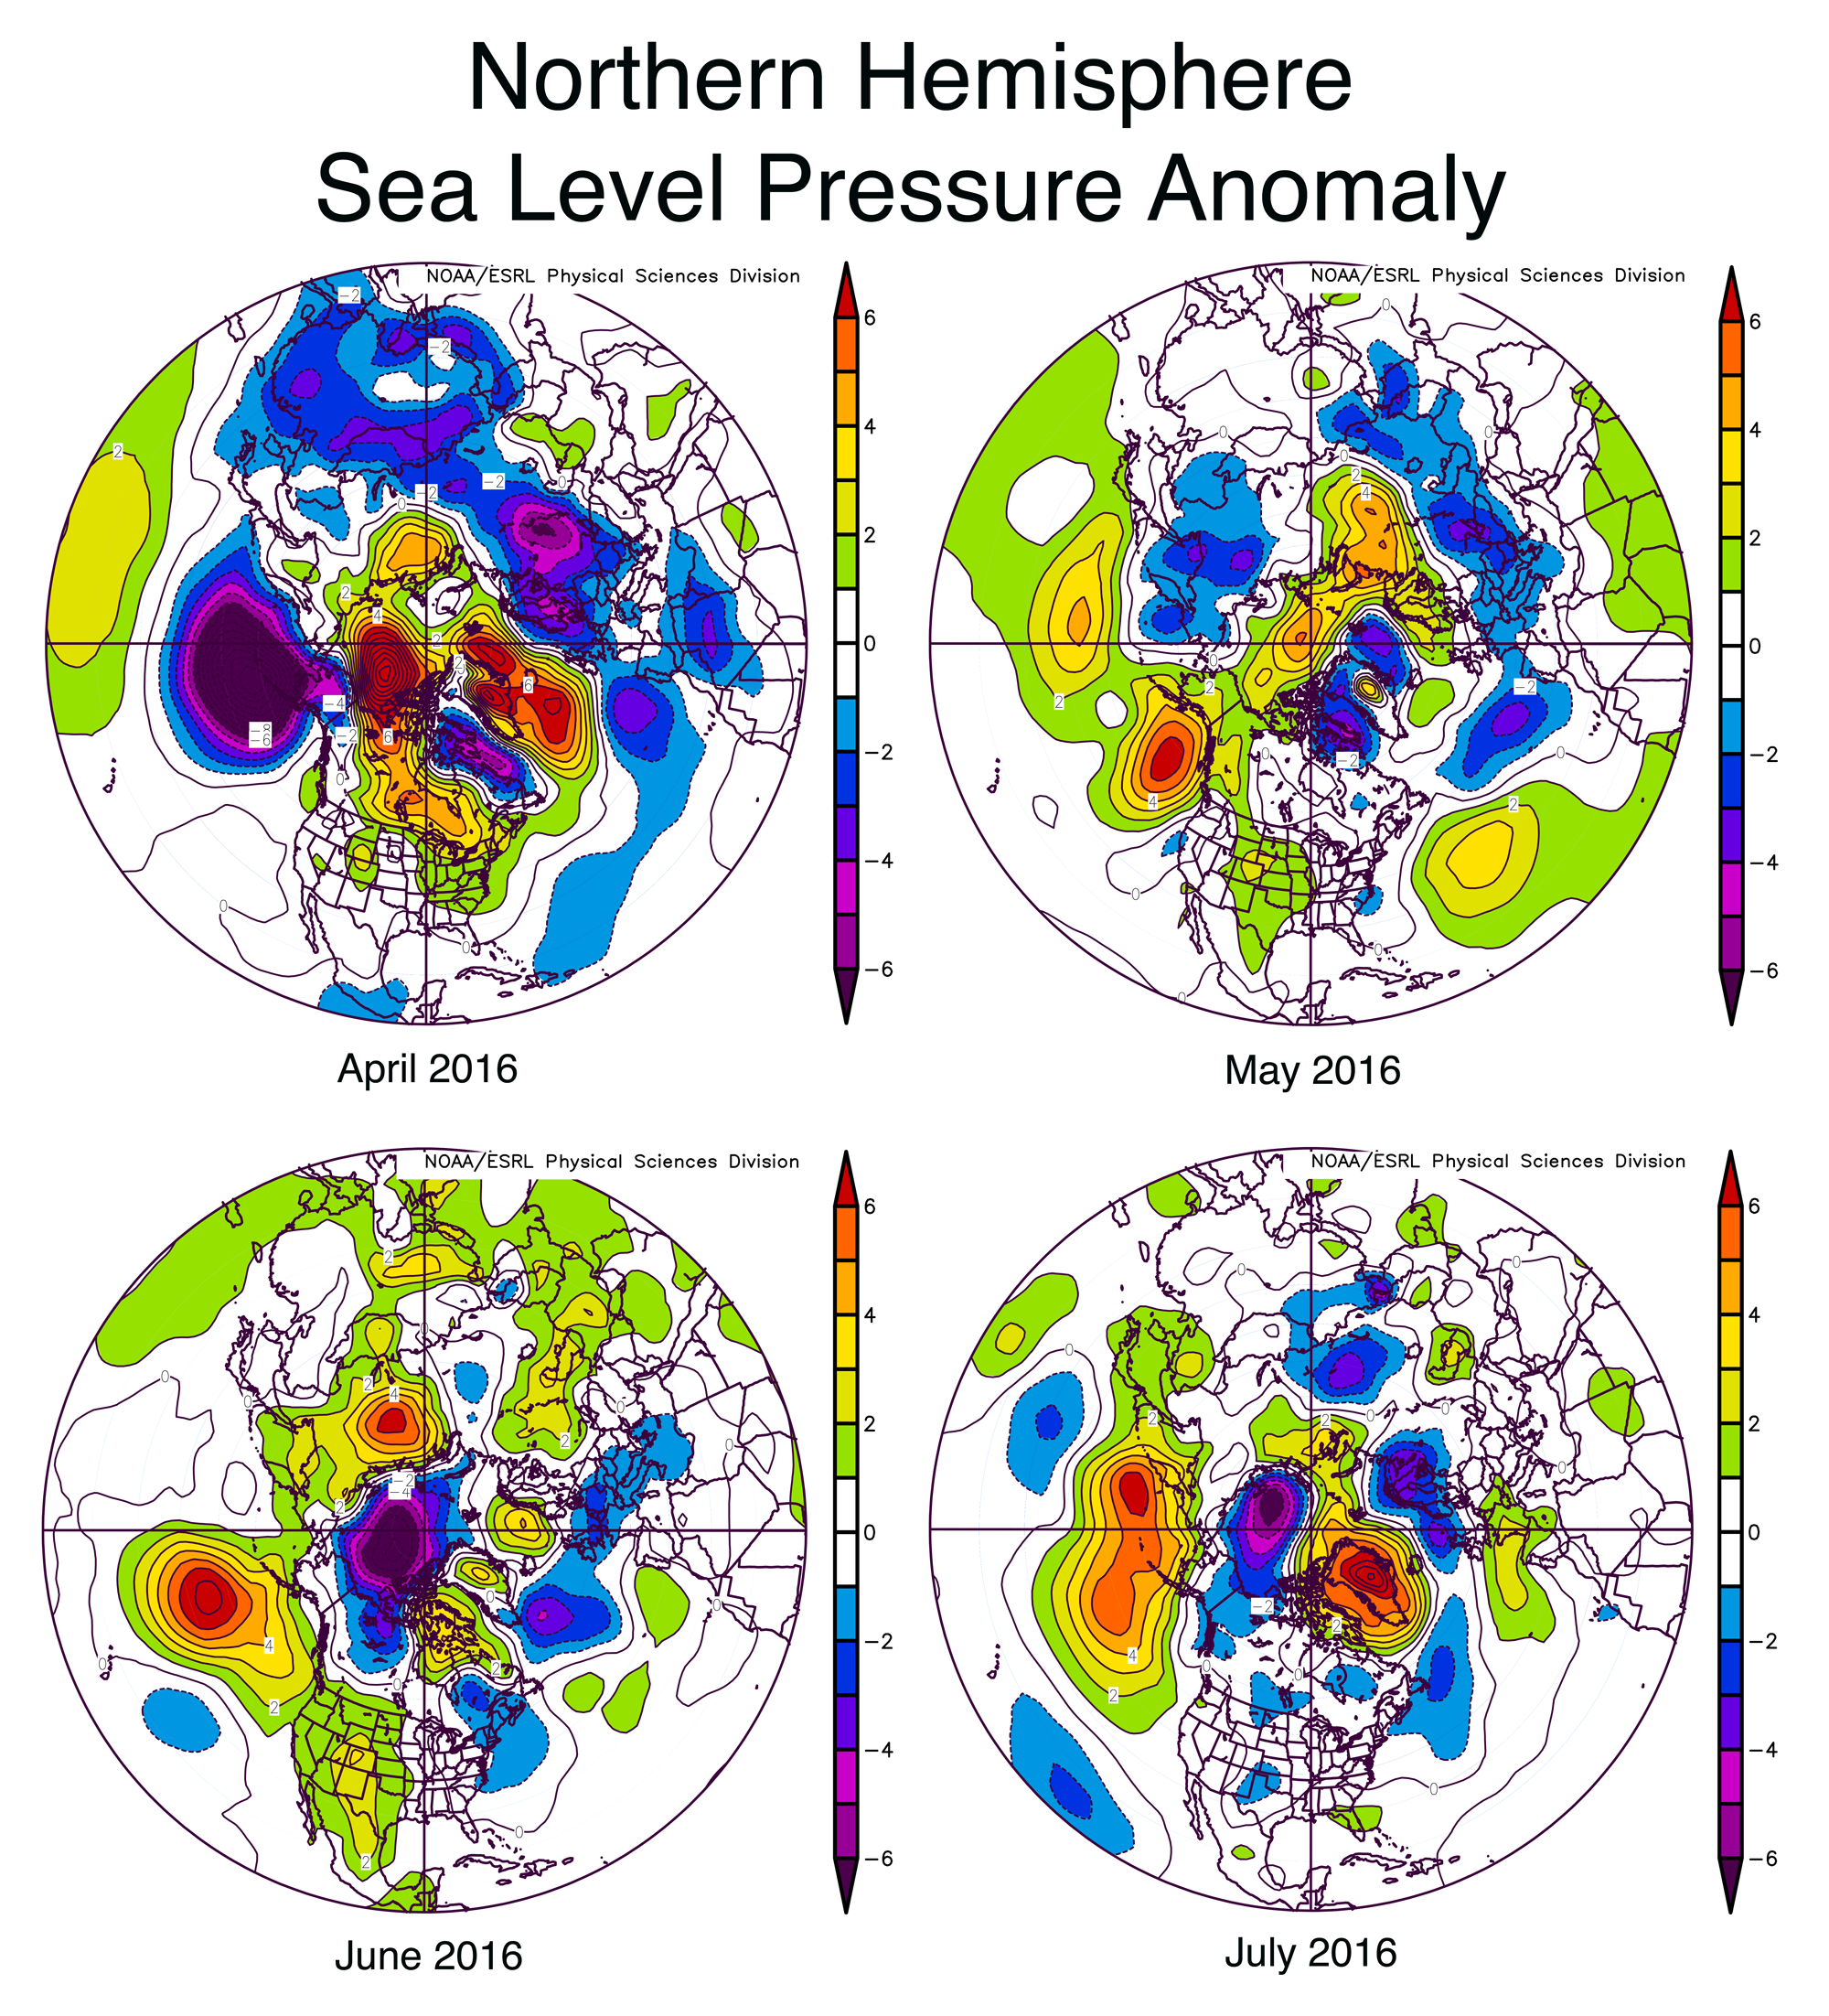
Figure 4. These graphs show sea level pressure anomalies or differences from average sea level pressure in the Northern Hemisphere for April, May, June, and July 2016.
Credit: NSIDC courtesy NOAA Earth System Research Laboratory Physical Sciences Division
High-resolution image
Beginning in June there was a significant change in the atmospheric circulation over the Arctic. May was characterized by high pressure over the Arctic Ocean which had persisted since the beginning of the year. However, in June the pattern shifted to lower than average pressure. This brought clouds and fairly low temperatures to the region, slowing ice loss. The change in circulation also shifted the pattern of ice motion, slowing the earlier movement of ice away from the coast in the Beaufort Sea (as depicted in our May 3rd post).
This pattern shift is associated with the development of a large and persistent area of moderate high pressure over the northeastern Pacific (south of Alaska) that formed beginning in mid-May. This may be related to an ongoing shift in the Pacific Decadal Oscillation over spring and early summer this year.
Sea ice dances to the changing wind
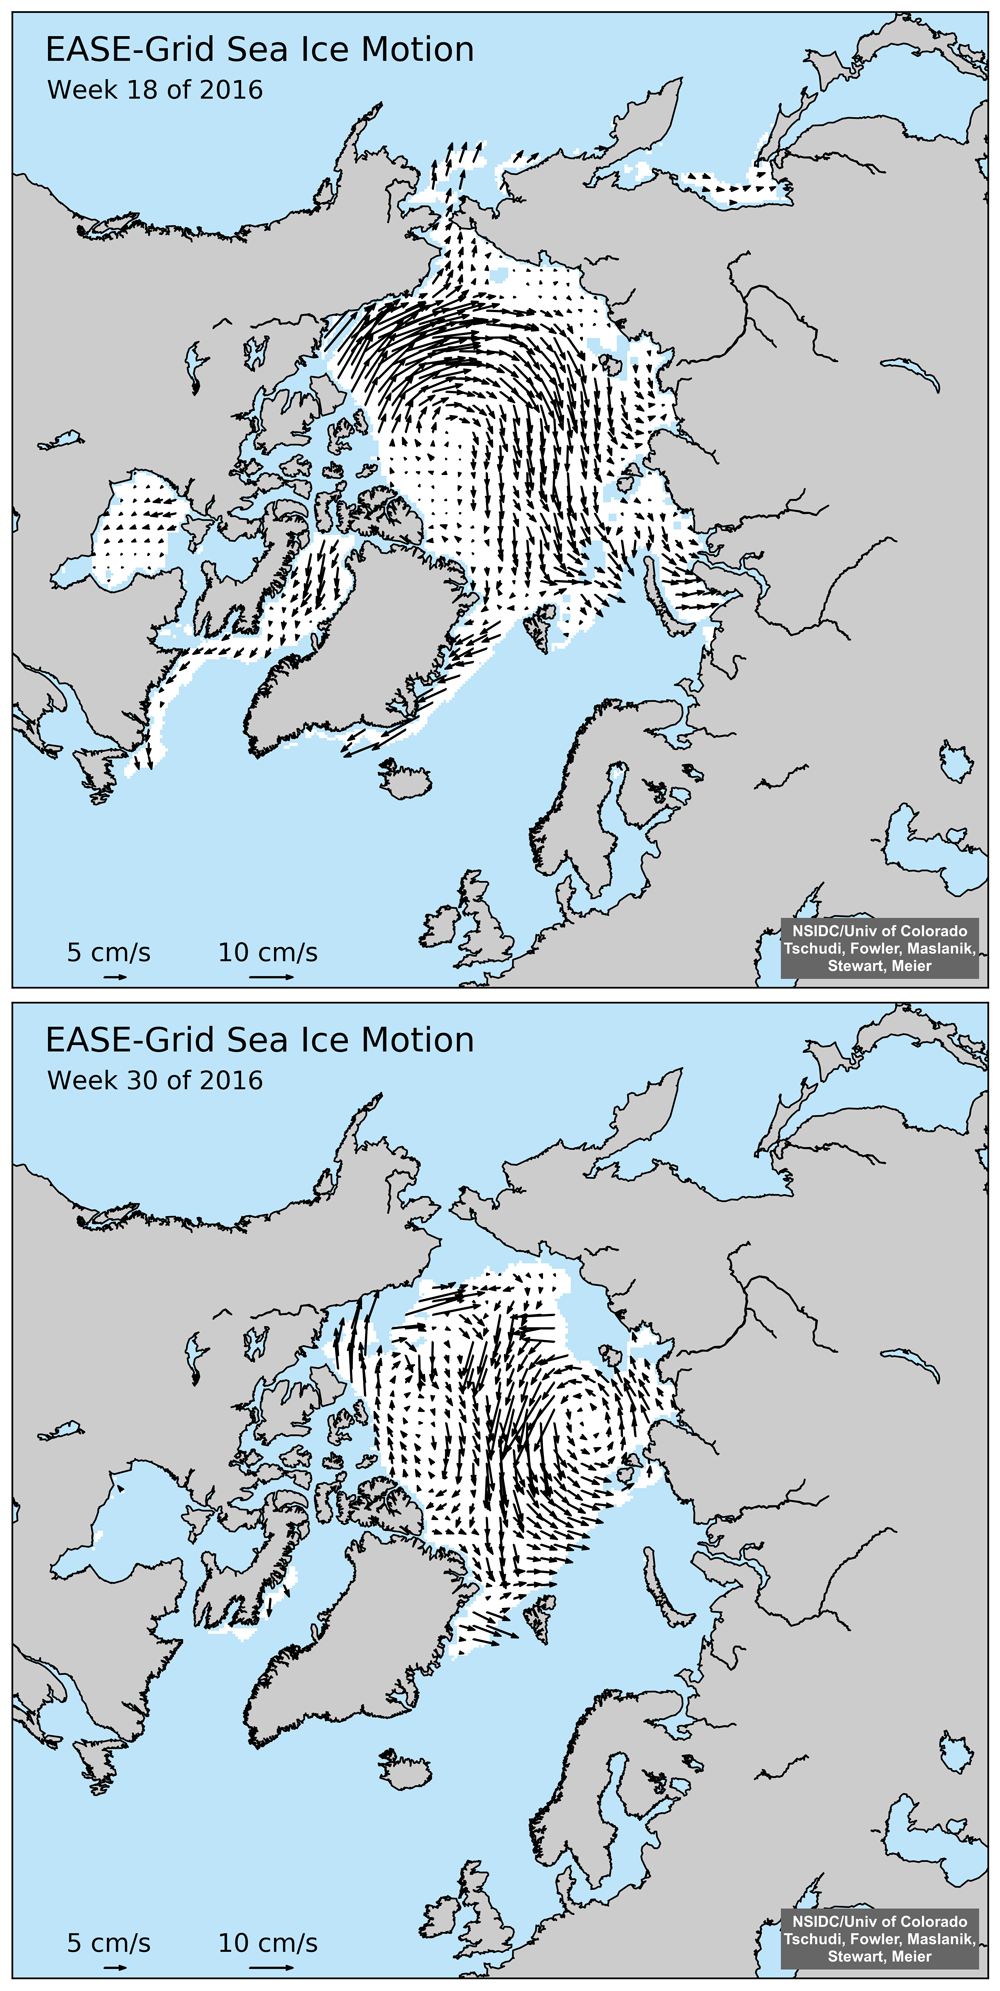
Figure 5a. These graphs show Arctic sea ice motion for May 2 to 8, 2016 (top) and July 25 to 31, 2016 (bottom).
Credit: NSIDC/University of Colorado, M. Tschudi, C. Fowler, J. Maslanik, W. Meier
High-resolution image
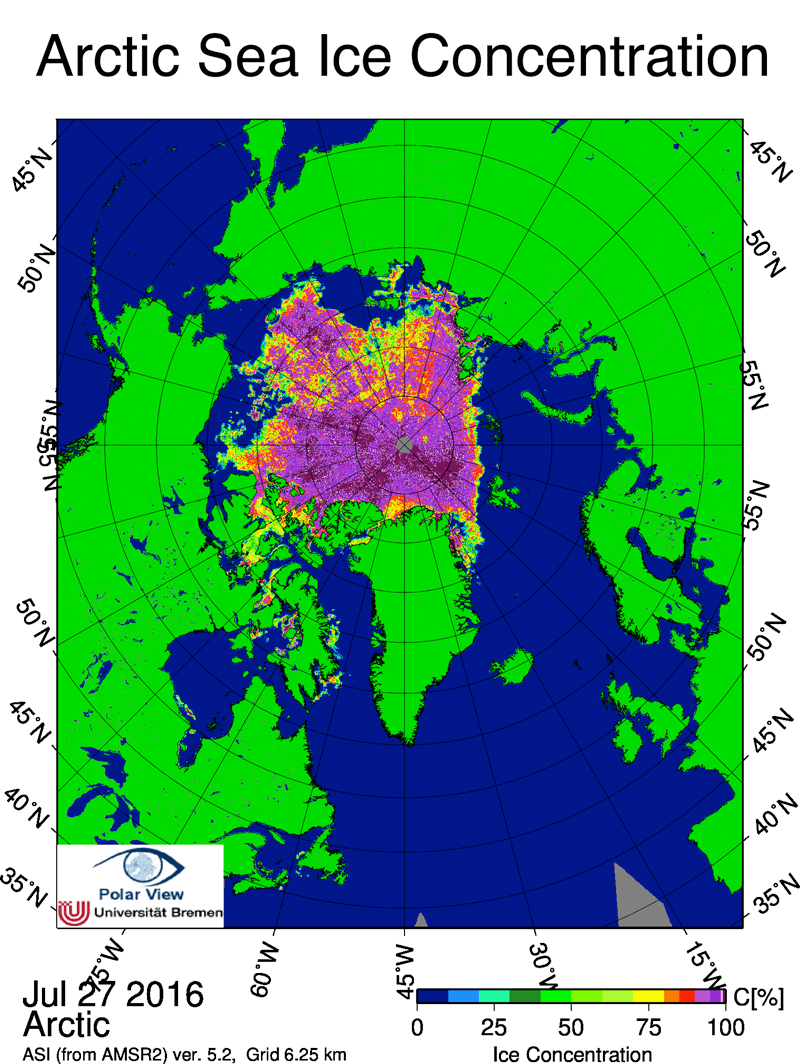
Figure 5b. This sea ice concentration image from the Advanced Microwave Scanning Radiometer 2 (AMSR2) shows dispersed sea ice and small polynyas in the Beaufort and East Siberian seas on July 27, 2016.
Credit: University of Bremen
High-resolution image
The shift in air pressure pattern also resulted in a change in sea ice drift directions in the Arctic. Early in the year, sea ice drift had a strong clockwise pattern (Figure 5a, top). However, July conditions greatly reduced sea ice drift speed in the Beaufort Sea and produced a counterclockwise drift pattern in the Laptev Sea (Figure 5a, bottom).
Persistent low pressure and repeated cyclonic storms in the Siberian side of the Arctic tended to disperse the pack and move it away from the coast. By late July, several regions of thin pack and small polynyas were beginning to open in these areas (Figure 5b).
The ice of our forefathers
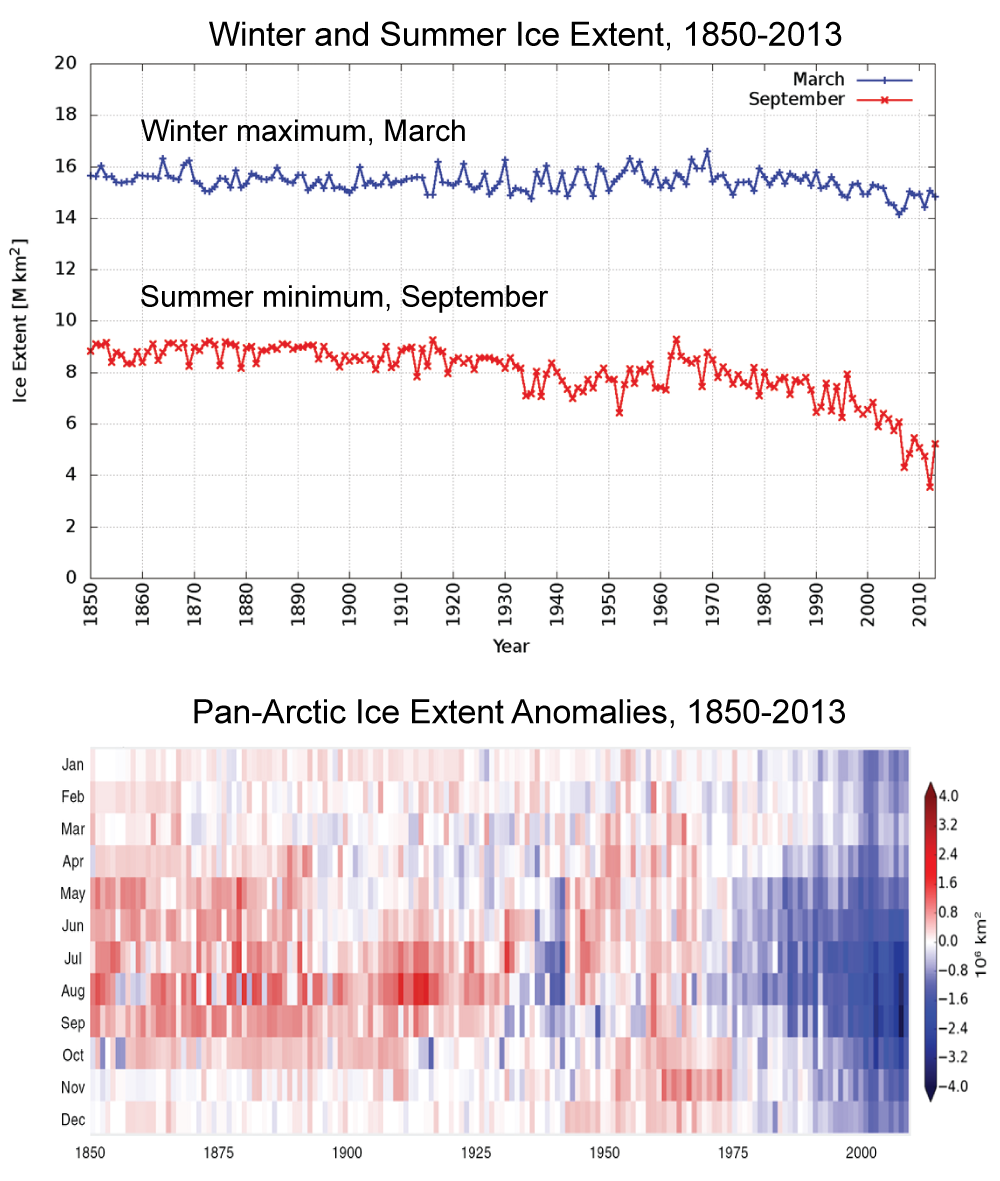
Figure 6. These graphs show a best estimate of ice extent and sea ice departure from average for the period 1850 to 2013. The top figure shows winter and summer.
Credit: NOAA at NSIDC
High-resolution image
Earlier this month, NOAA at NSIDC published a new compilation of Arctic sea ice extent using a variety of historical sources, including whaling ship reports and several historical ice chart series from Alaska, the Russian Arctic, Canada, and Denmark. The compilation provides a synthesized mid-monthly estimate extending back to 1850. The study concludes that the current downward trend in sea ice has no precedent in duration or scale of ice loss since 1850. With the exception of the Bering Sea, none of the areas have seen sea ice extents as low as in the past decade. Historical periods that show a decrease in summertime sea ice extent in the Arctic, such as the late 1930’s and 1940’s, are smaller in magnitude than the current downward-trending period.
Further reading
Walsh, J. E., F. Fetterer, J. S. Stewart, and W. L. Chapman. 2016. A database for depicting Arctic sea ice variations back to 1850. Geographical Review. doi: 10.1111/j.1931-0846.2016.12195.x.

