Arctic sea ice extent for November 2019 ended up at second lowest in the 41-year satellite record. Regionally, extent remains well below average in the Chukchi Sea, Hudson Bay, and Davis Strait.
Overview of conditions
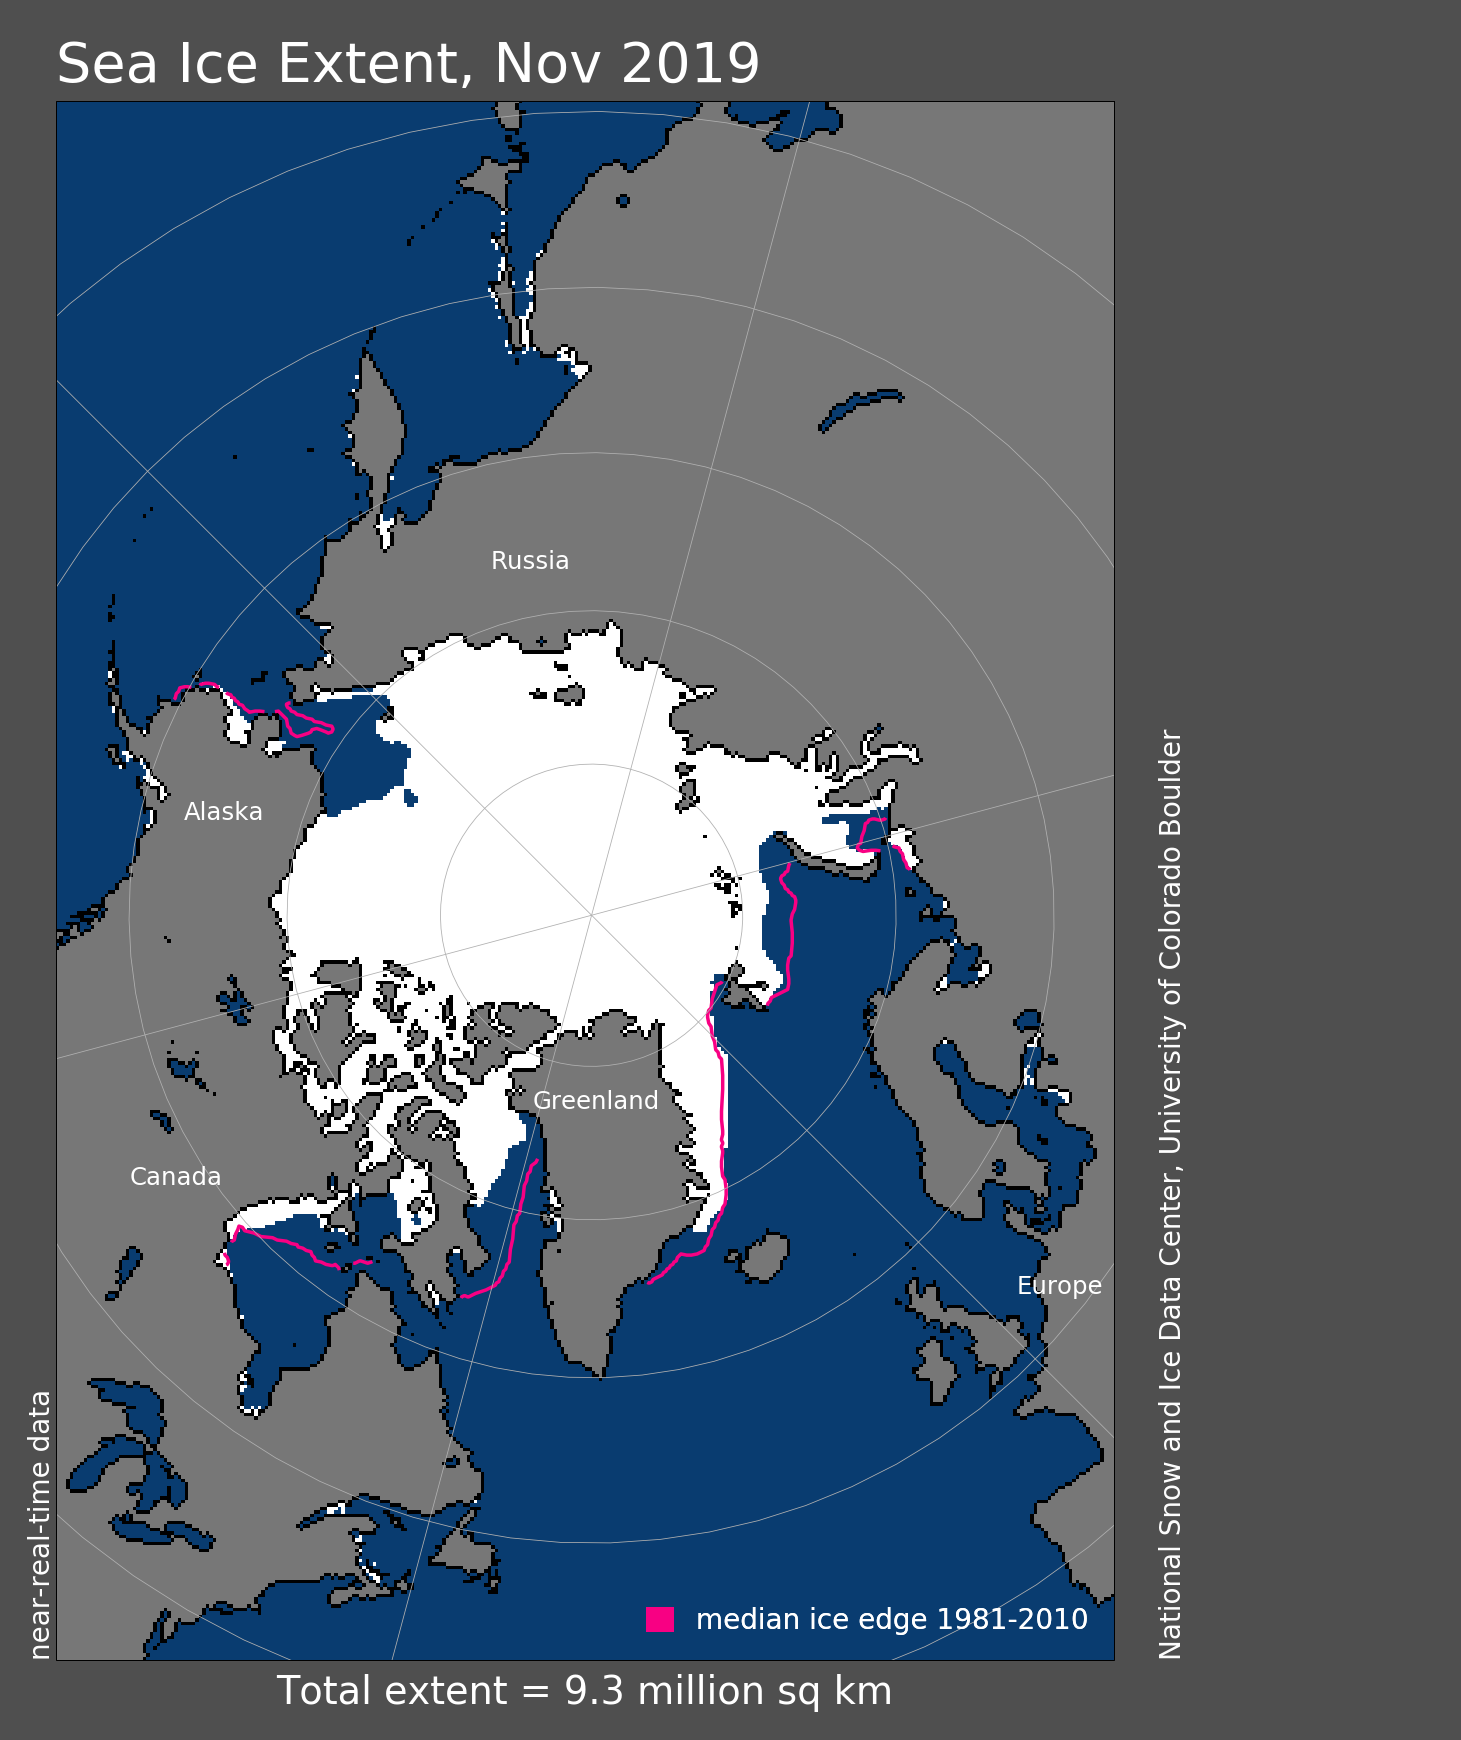
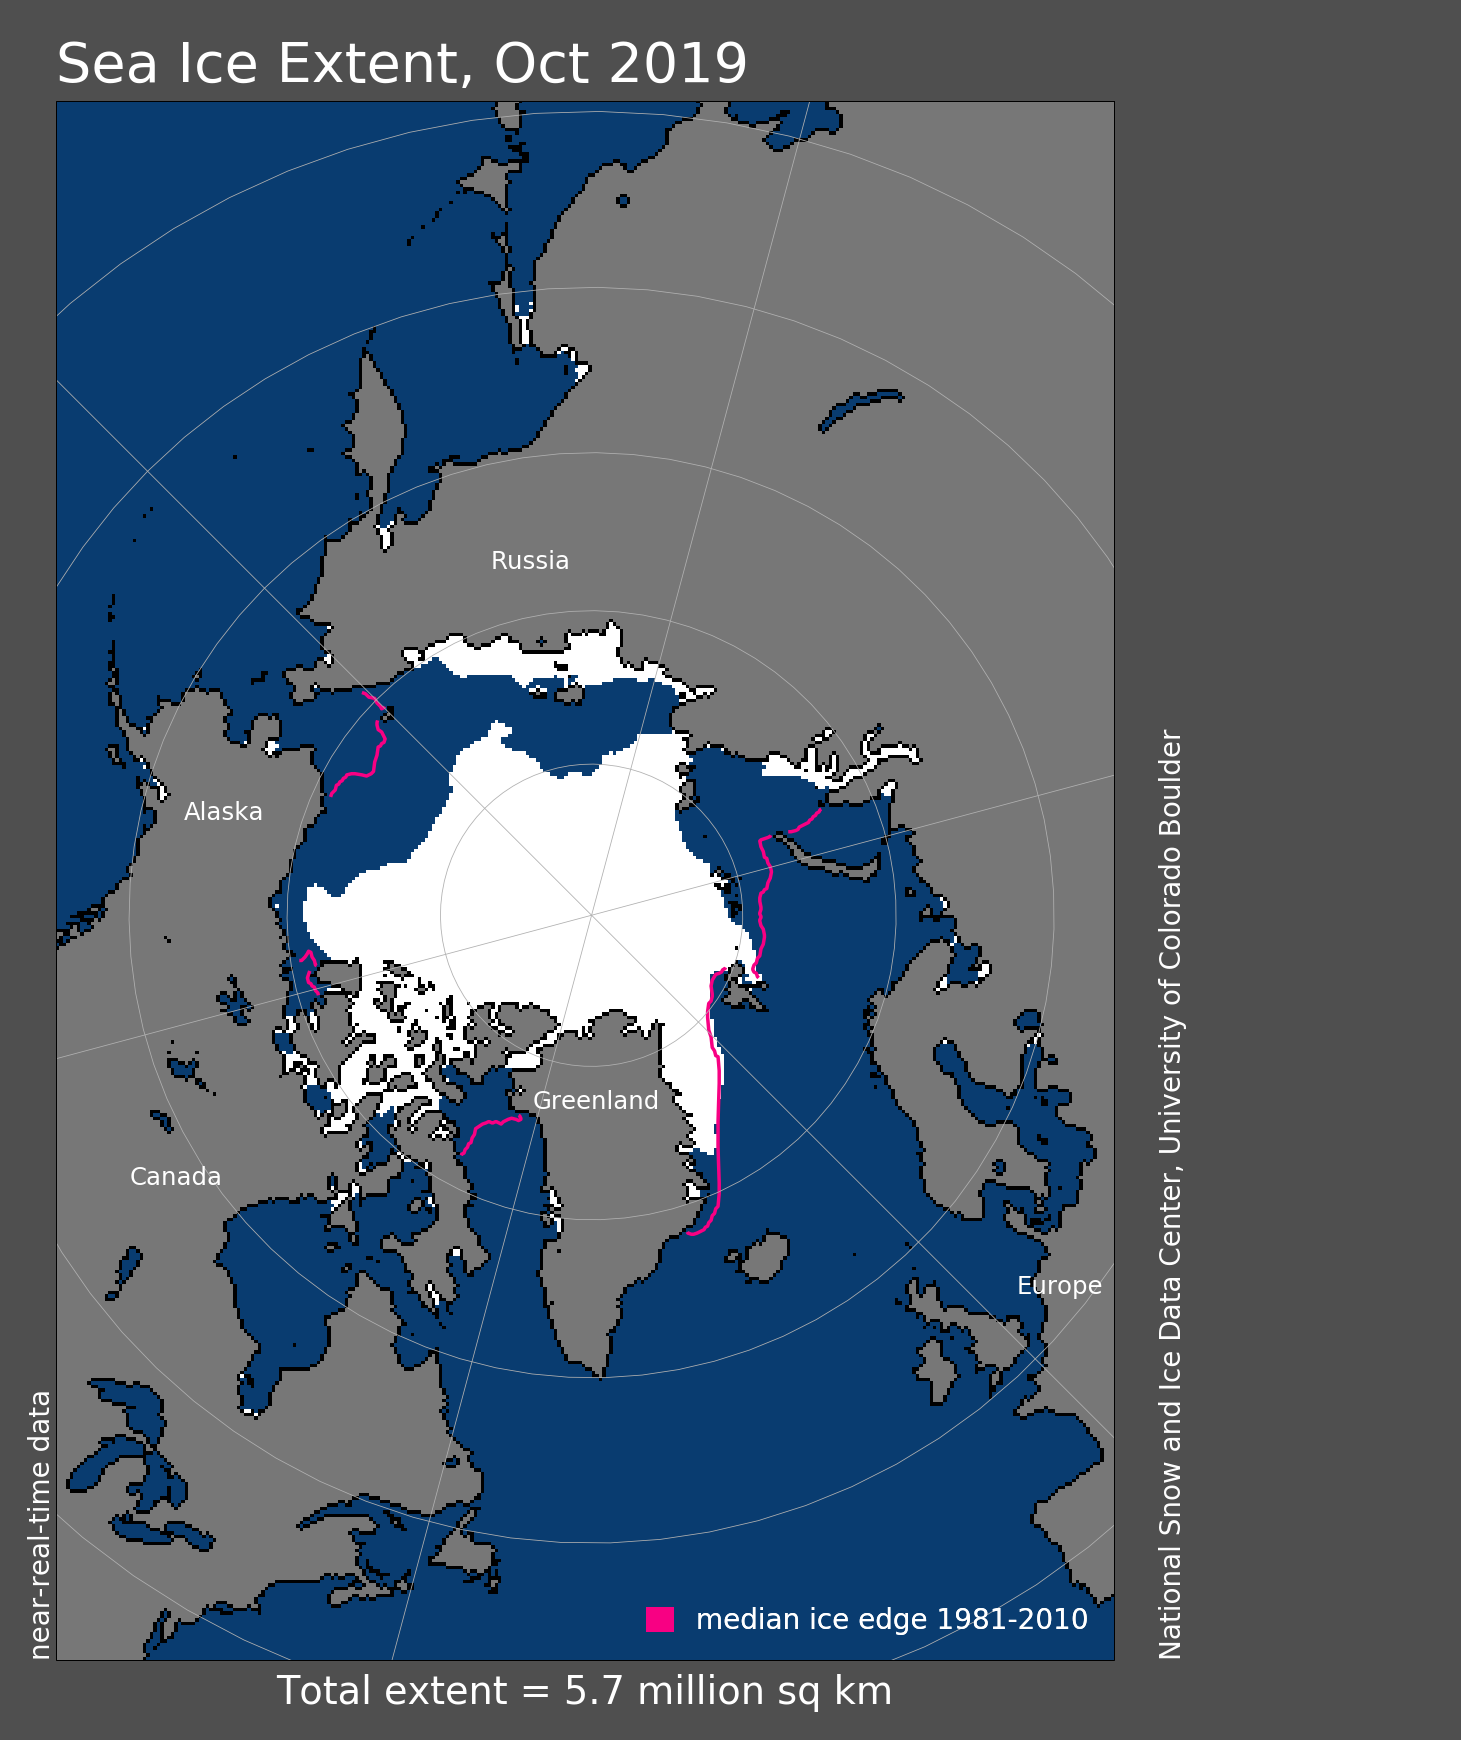
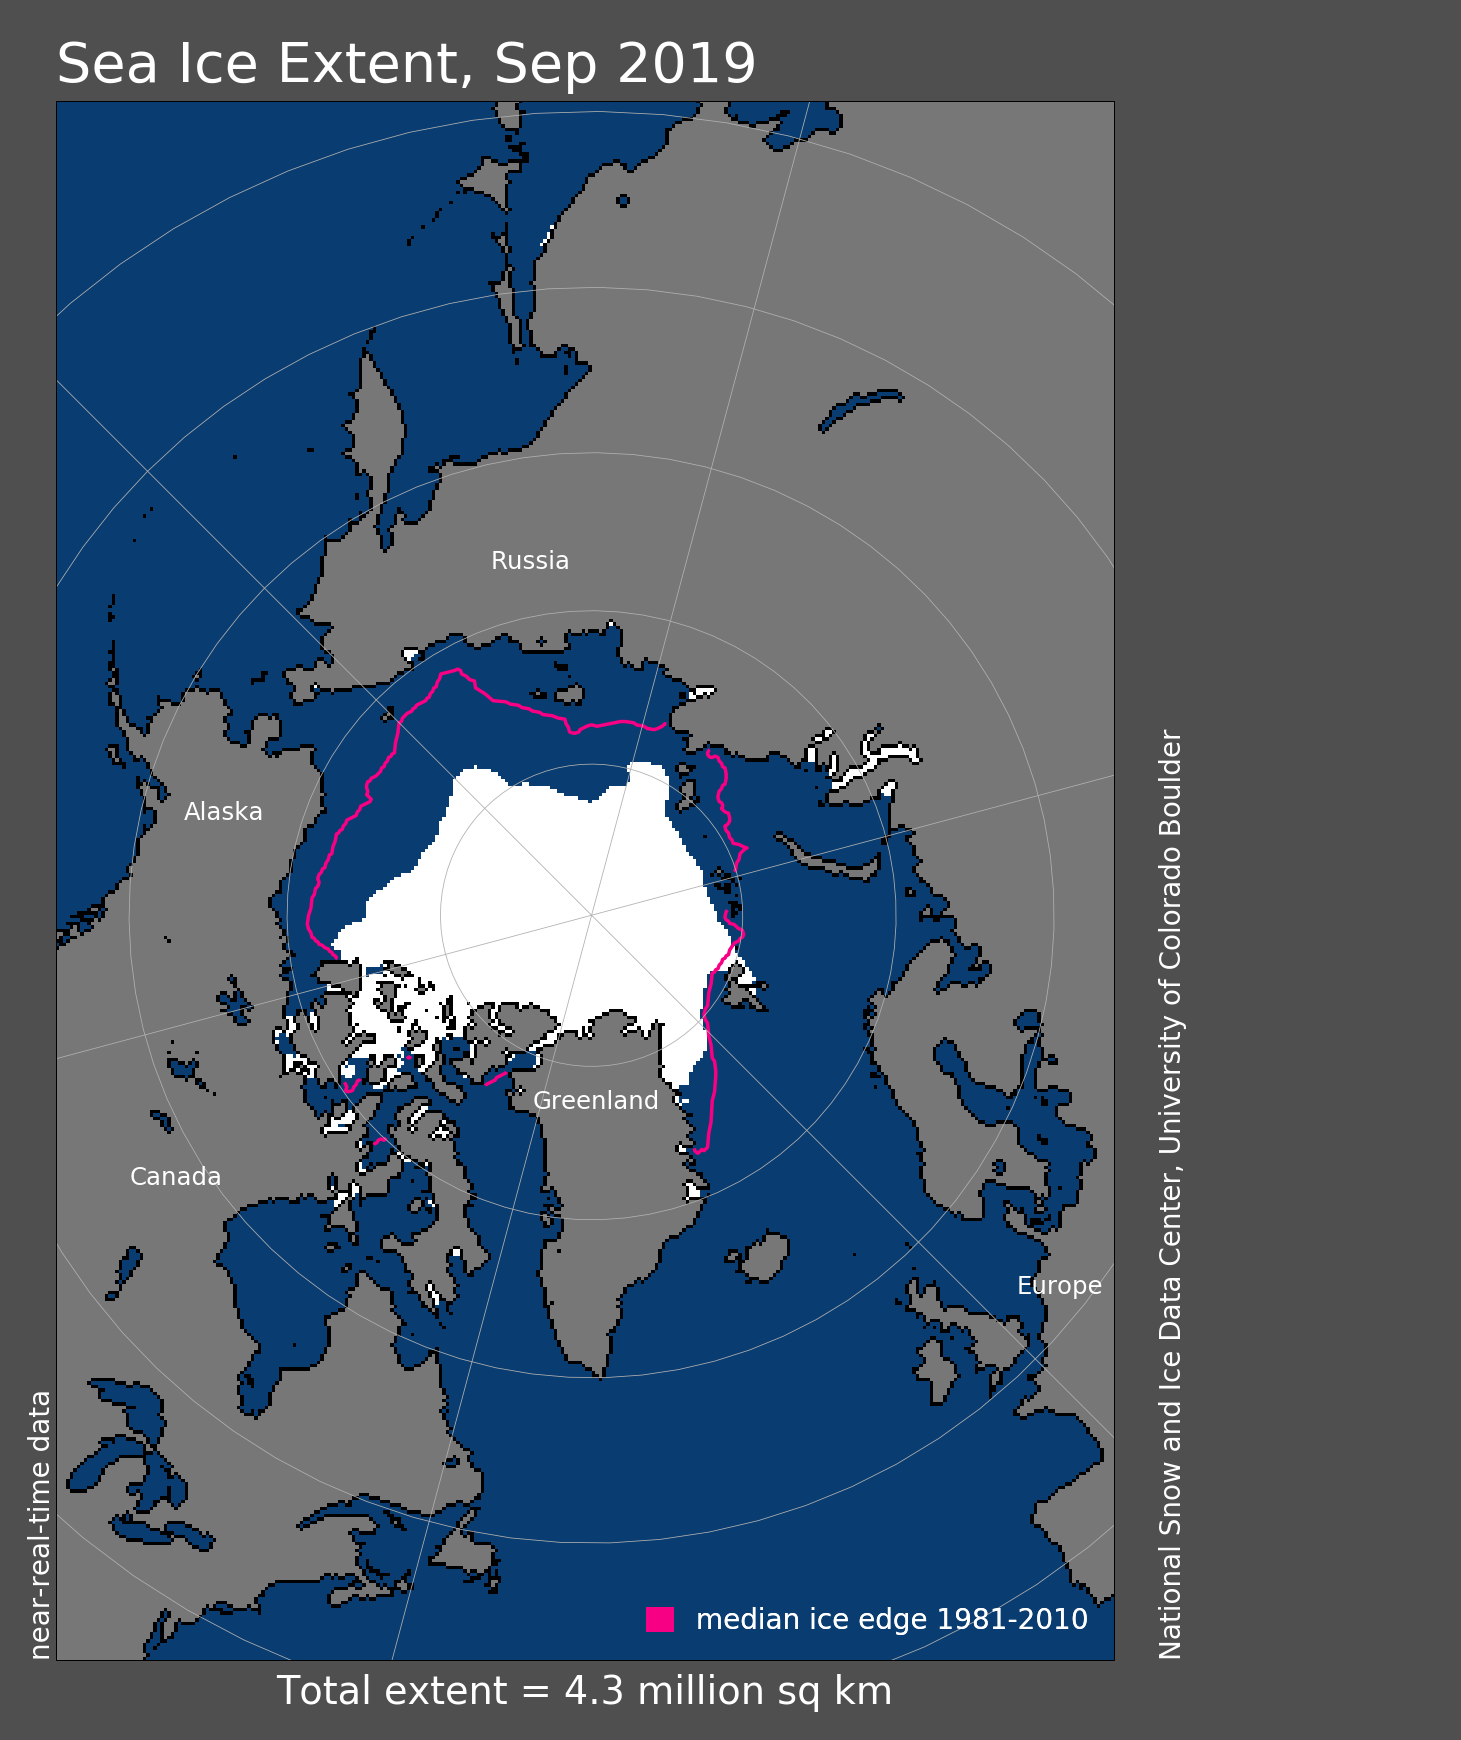
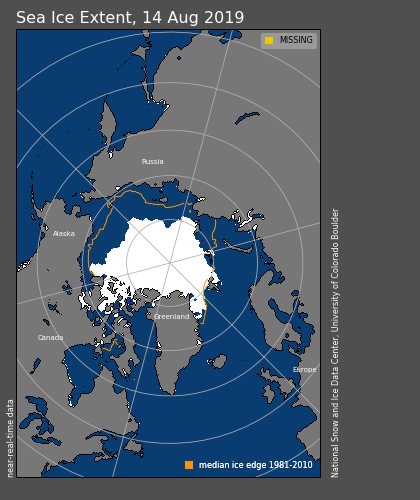
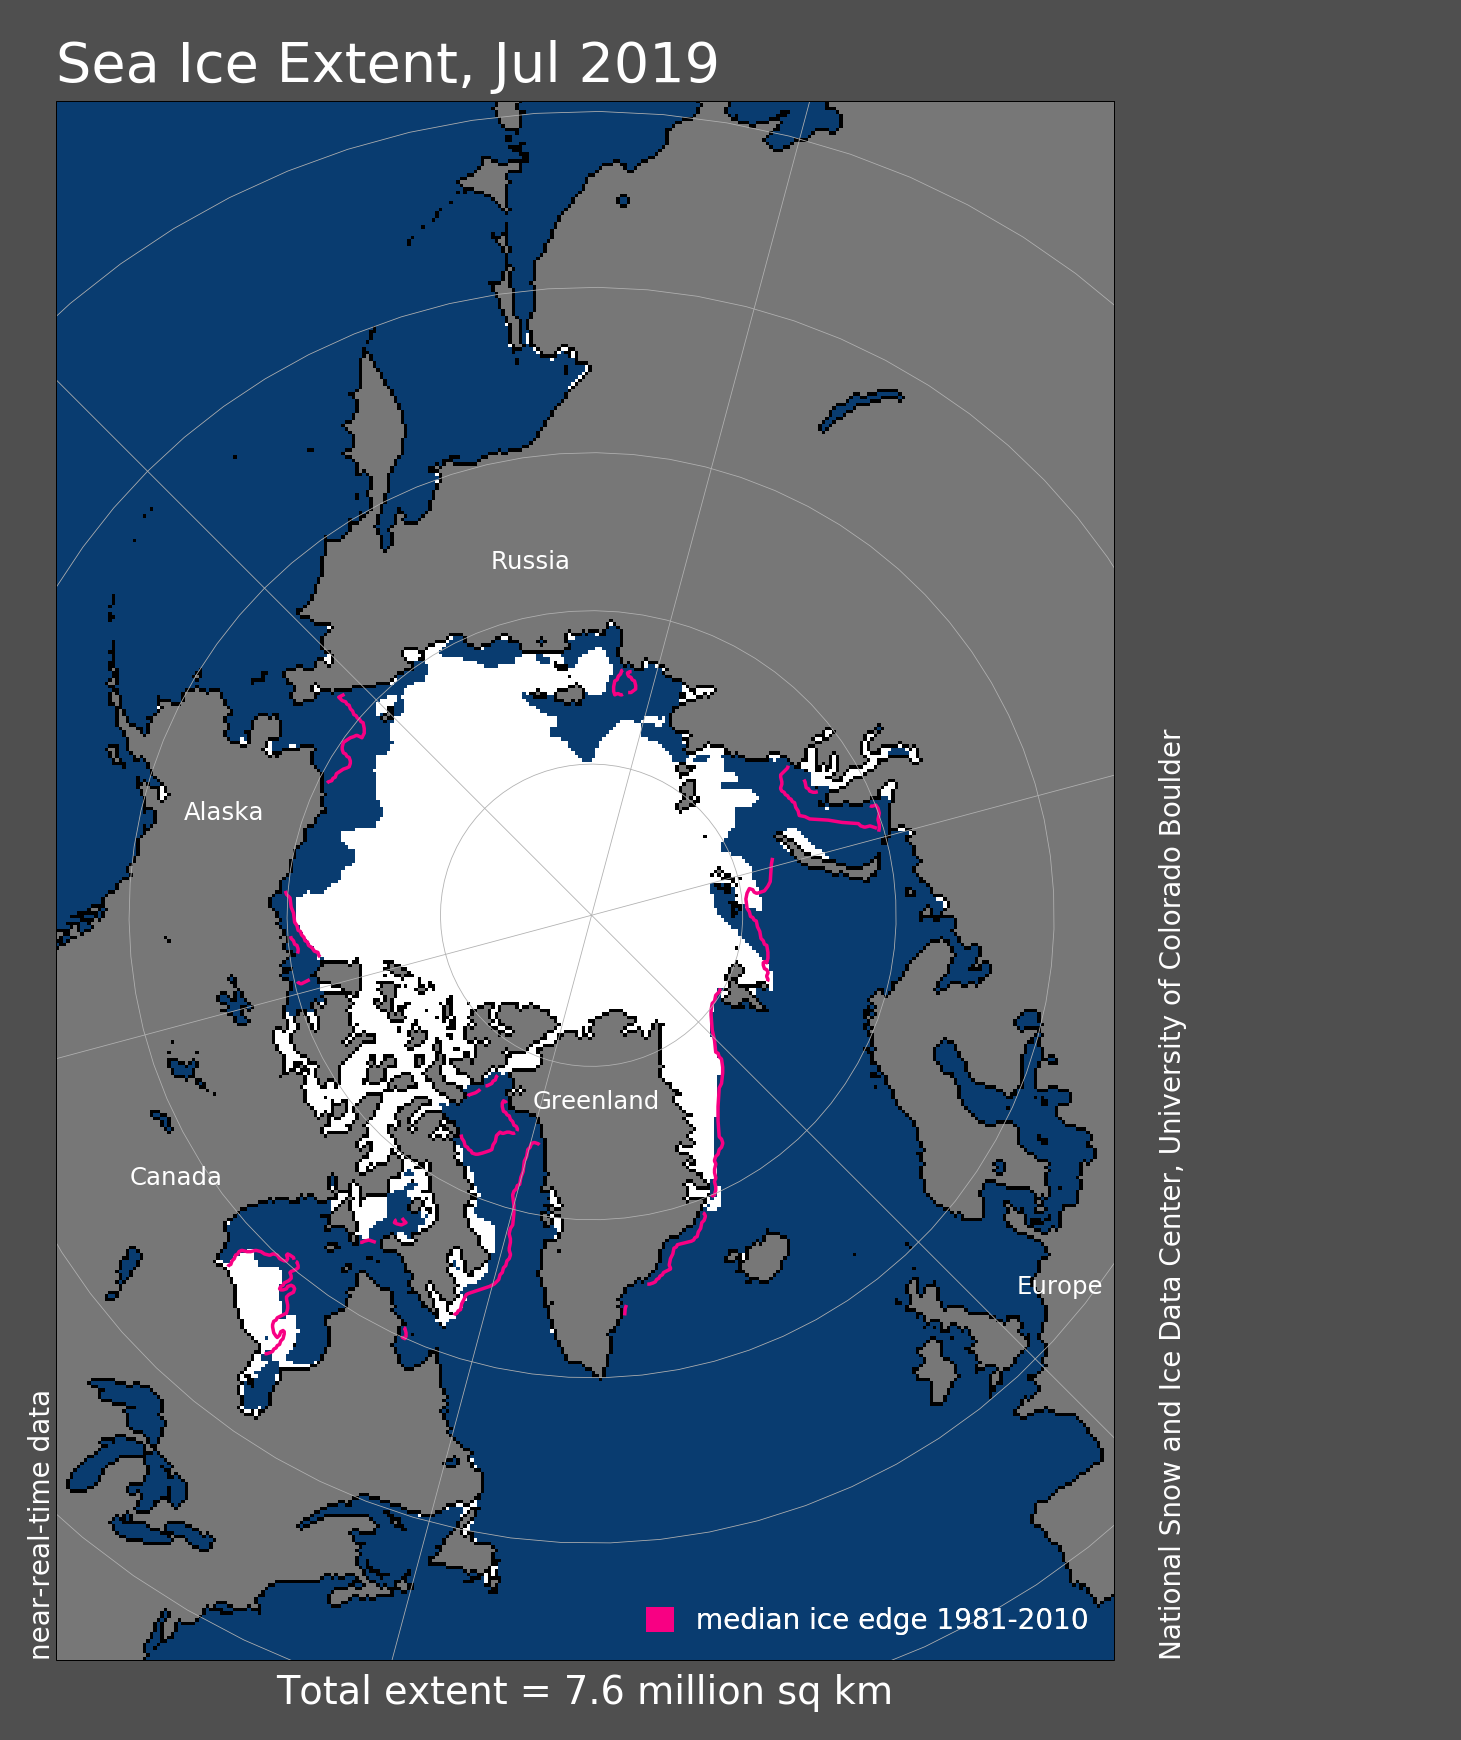
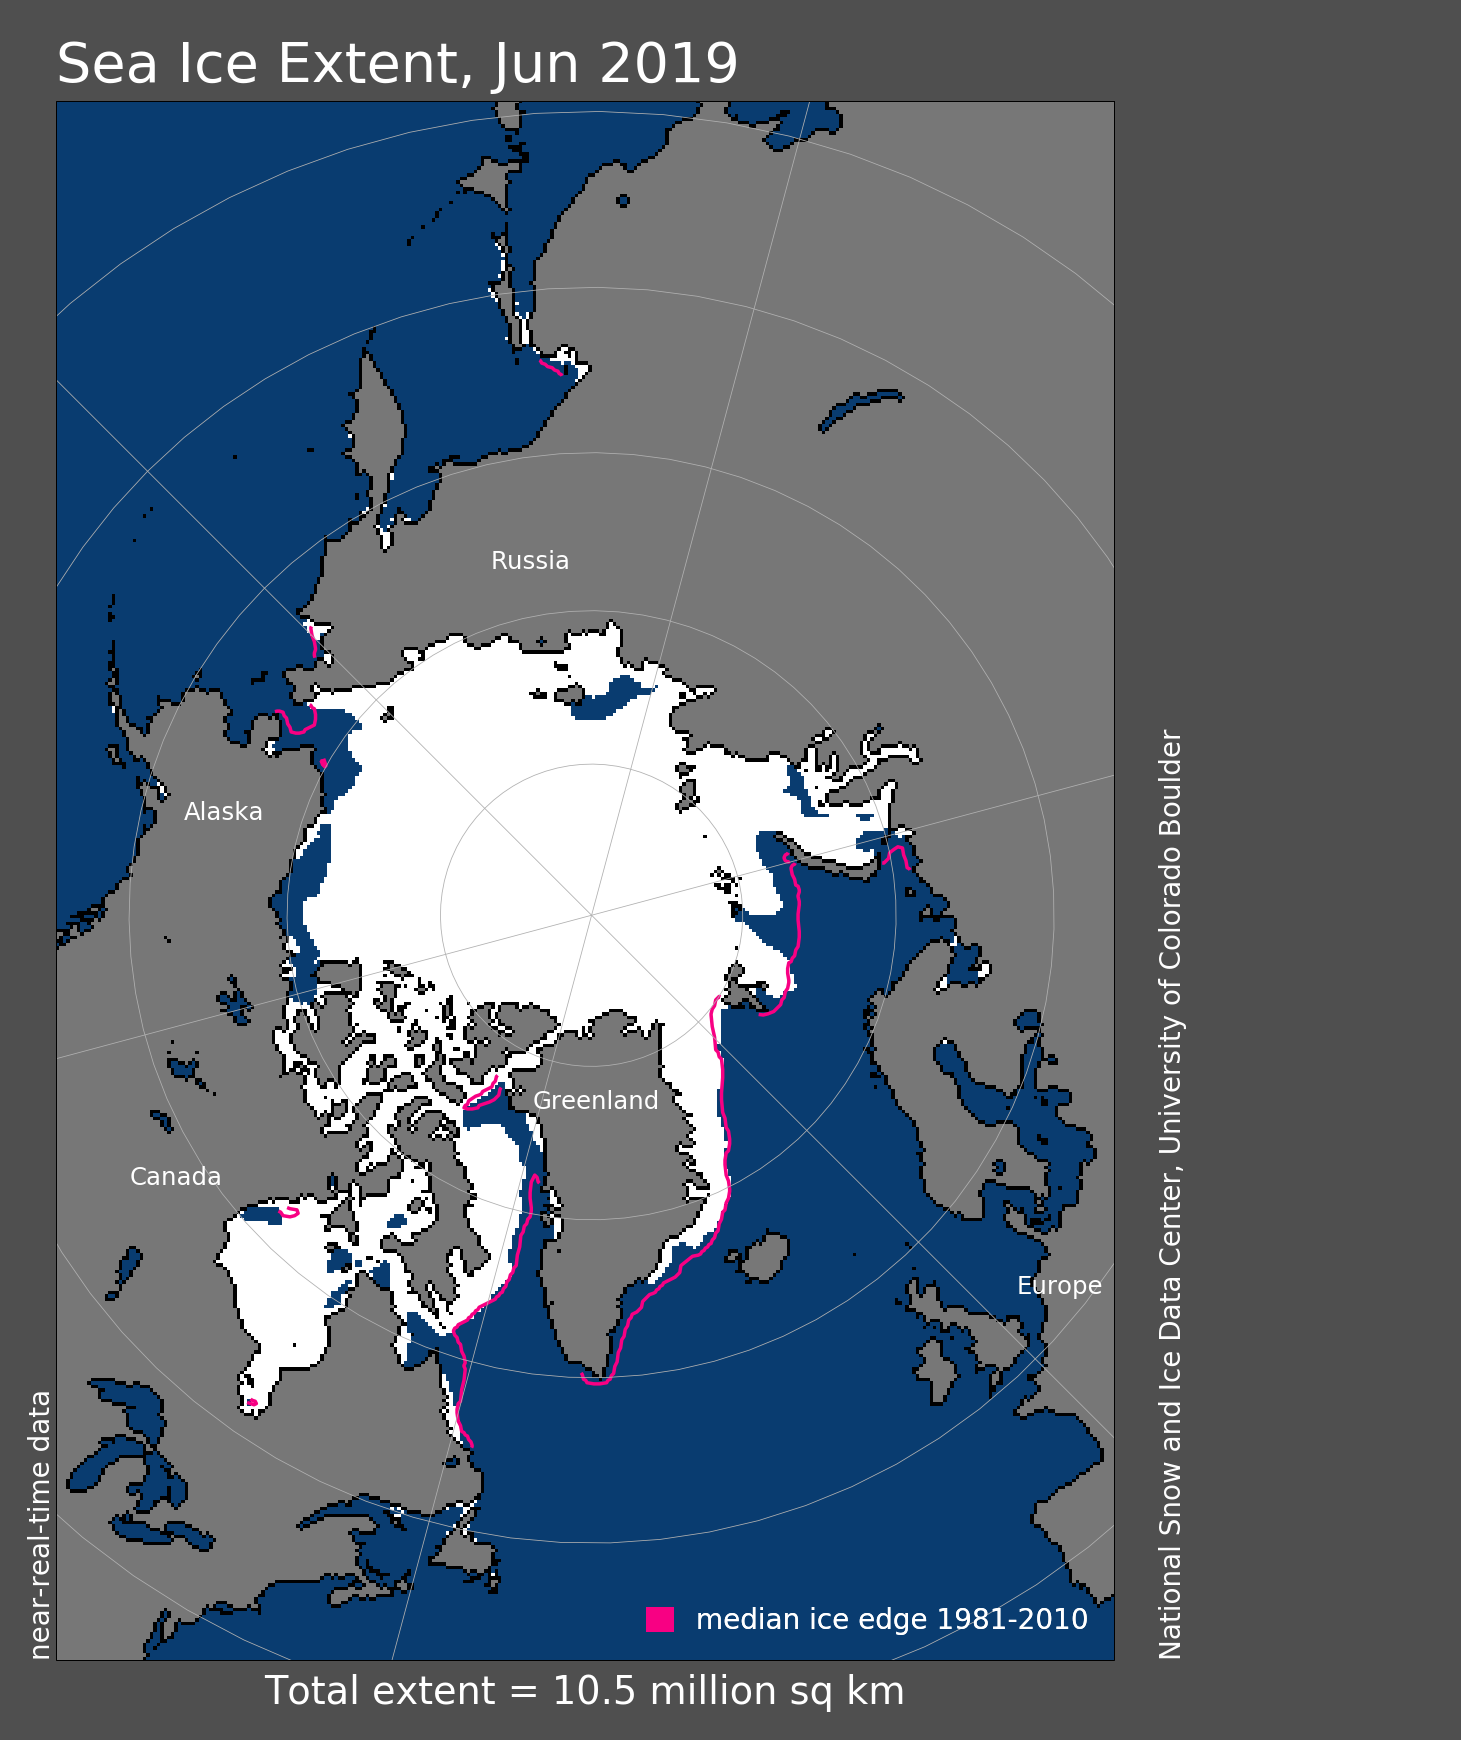
Figure 1. Arctic sea ice extent for November 2019 was 9.33 million square kilometers (3.60 million square miles). The magenta line shows the 1981 to 2010 average extent for that month. Sea Ice Index data. About the data
Credit: National Snow and Ice Data Center
High-resolution image
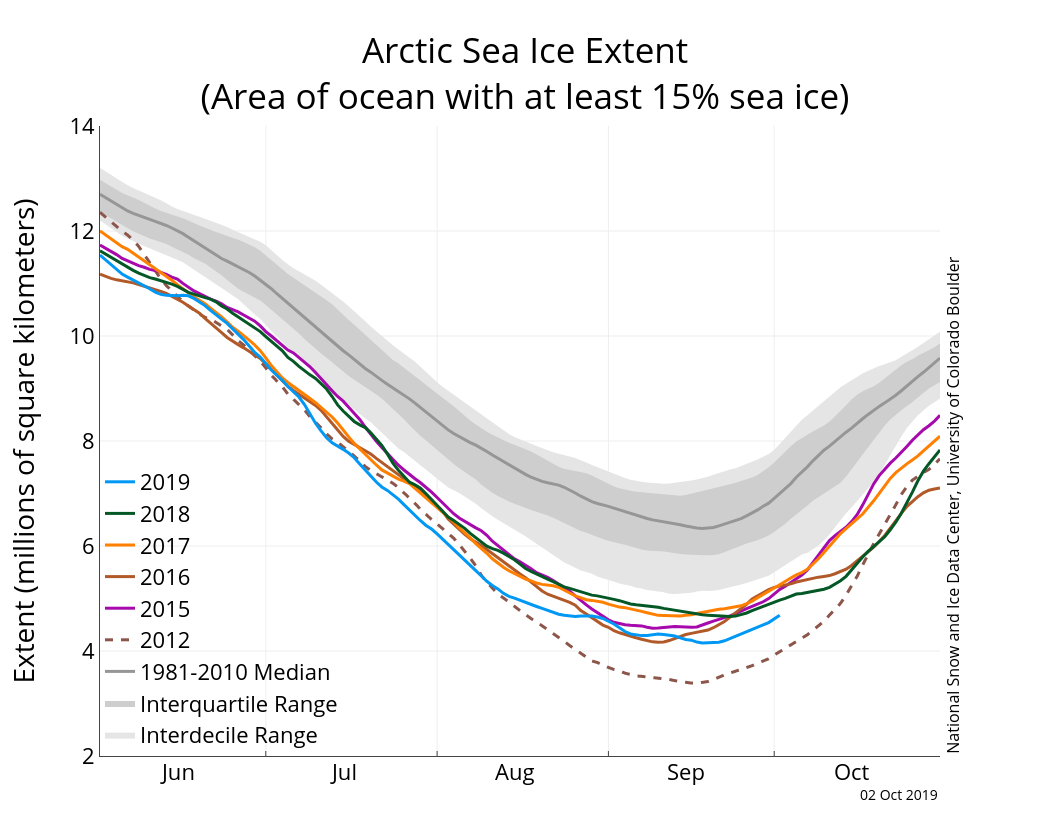
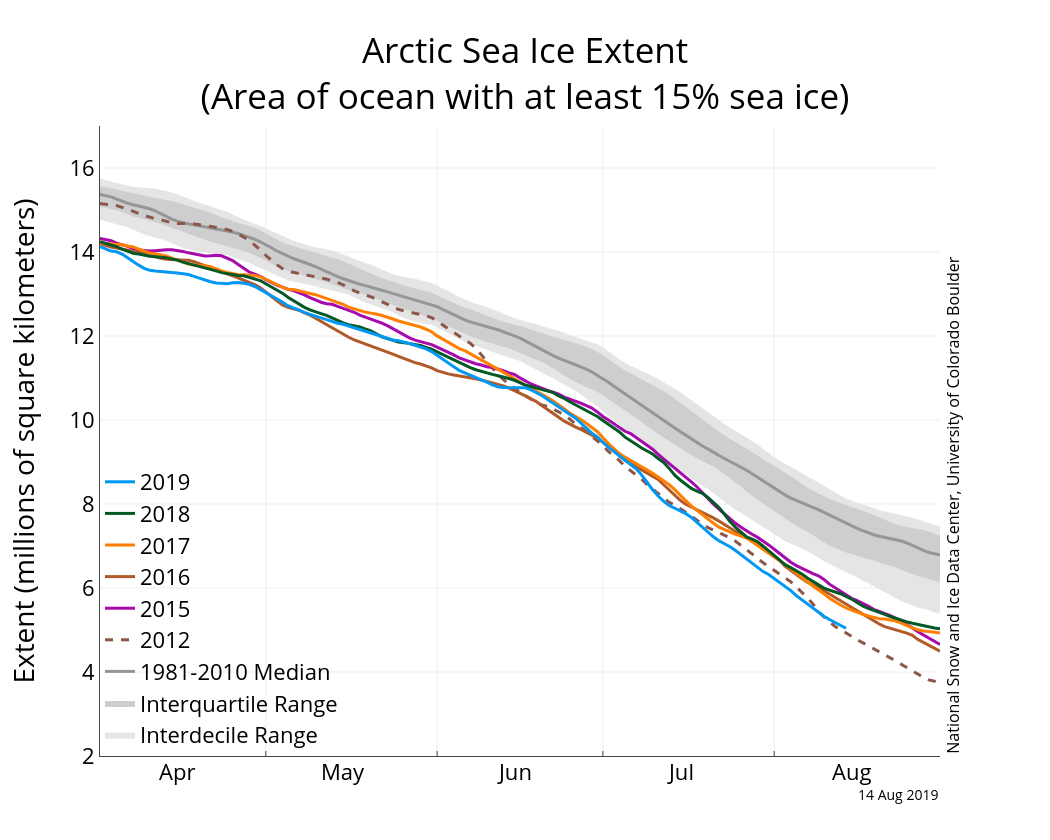
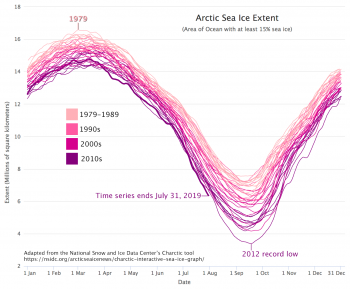
At the end of November and through the first week of December, daily extent was tracking third lowest in the satellite record, behind 2006 and 2016. Average ice extent for the month, however, finished second lowest in the passive microwave satellite record at 9.33 million square kilometers (3.60 million square miles). This was 670,000 square kilometers (259,000 square miles) above the 2016 record low for the month and 1.37 million square kilometers (529,000 square miles) below the 1981 to 2010 average. Regionally, extent remains well below average in the Chukchi Sea, as well as in Hudson Bay and Davis Strait. Extent is also below average in the Barents Sea, but not as pronounced as has been observed in recent years. Ice now extends to the shore along most of the Russian Arctic and along the coast of the Beaufort Sea. Extent is near average in the East Greenland Sea.
Conditions in context
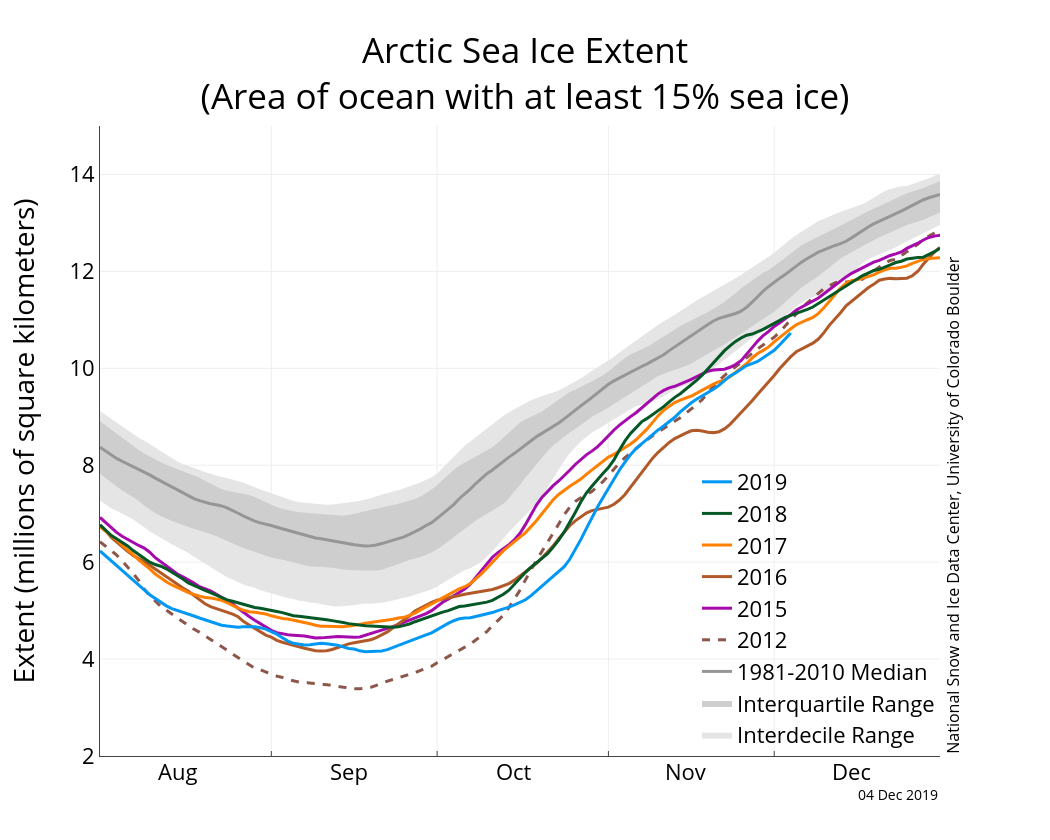
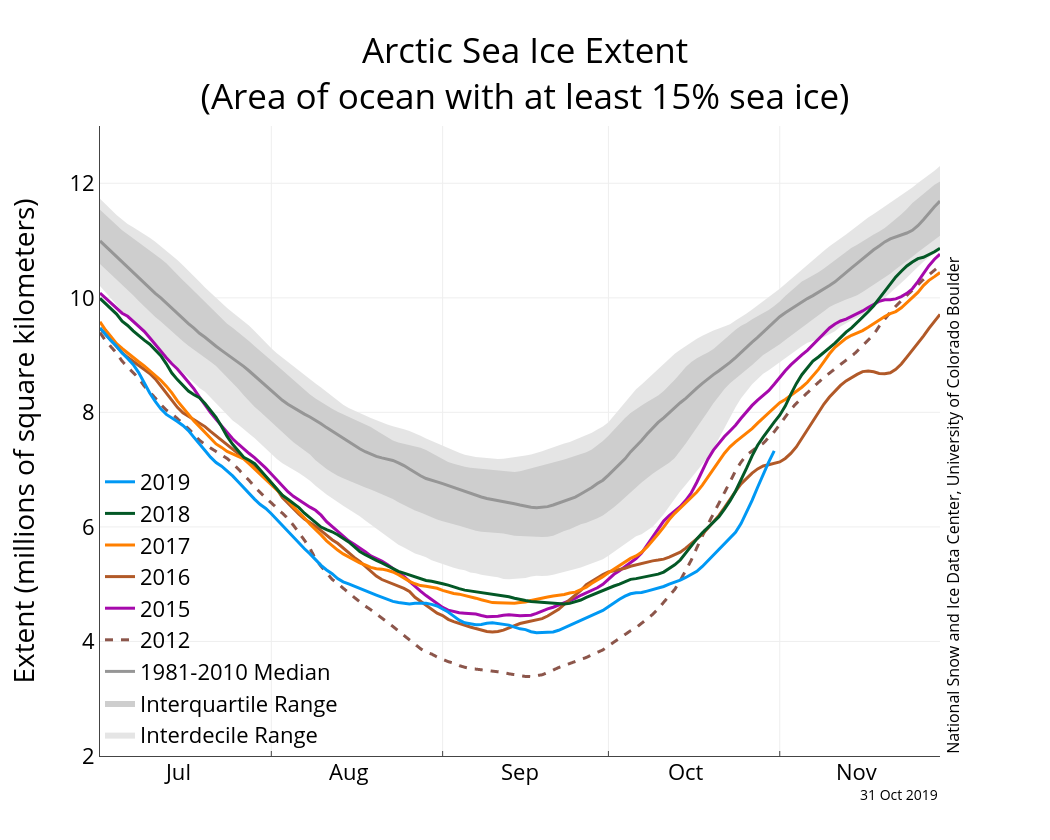
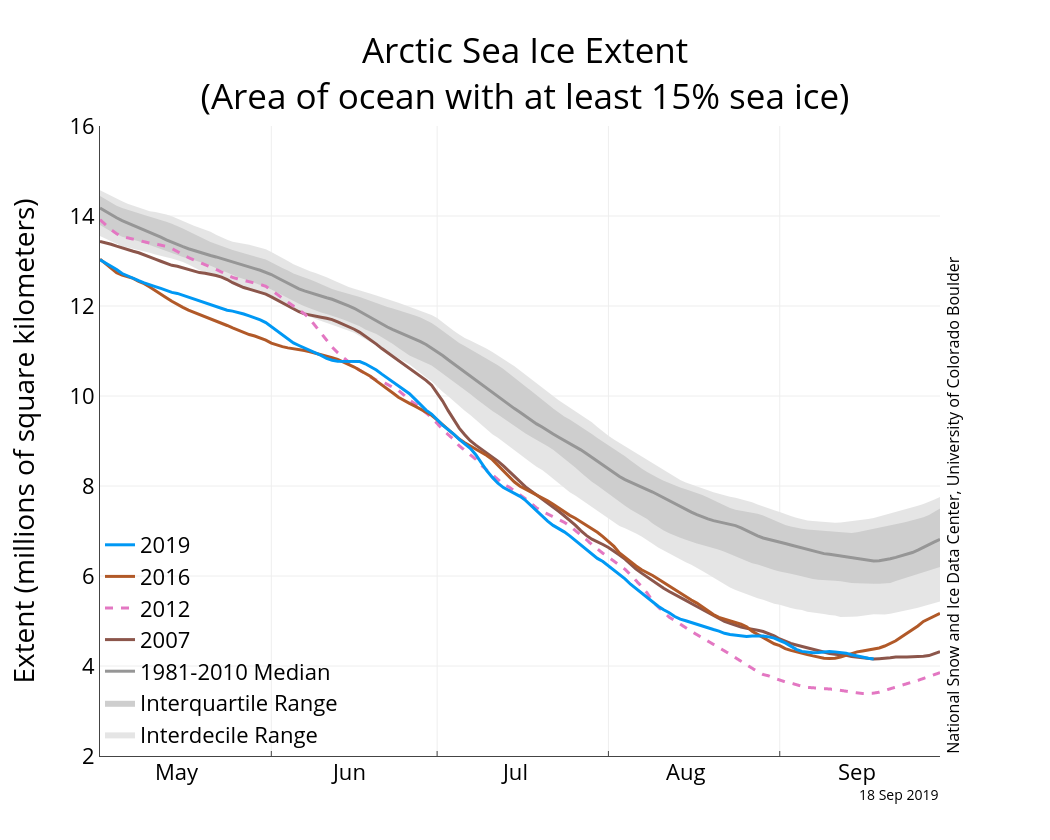
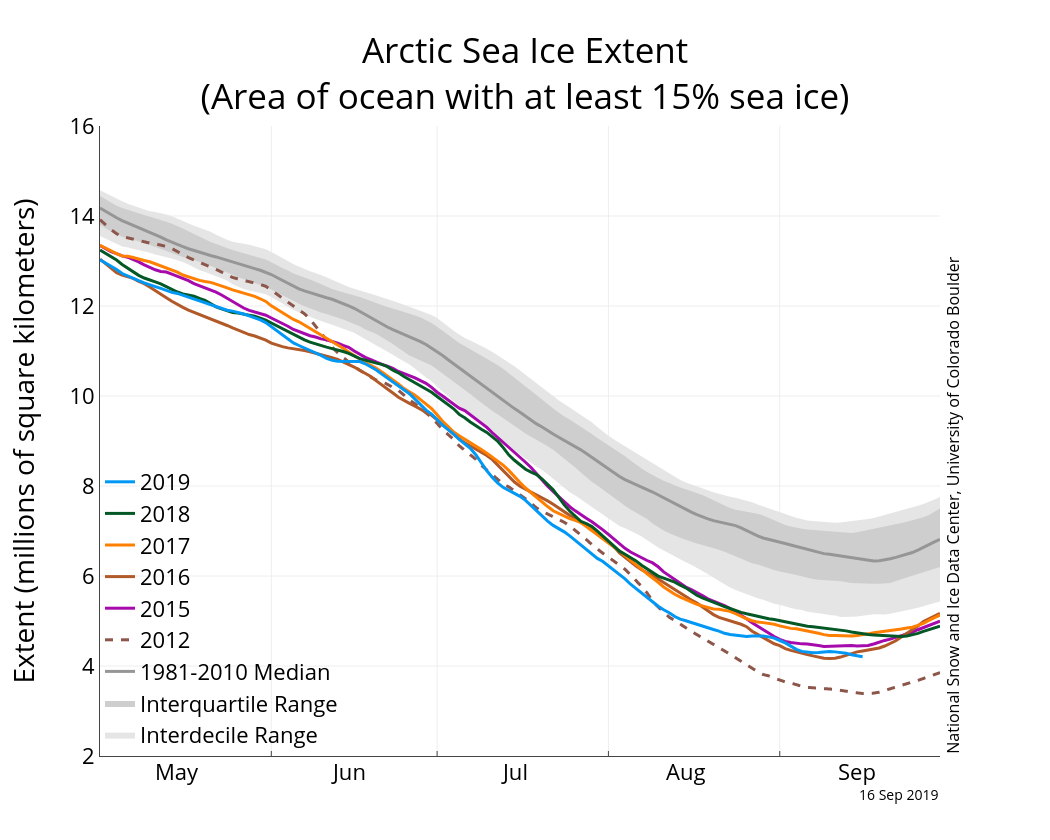
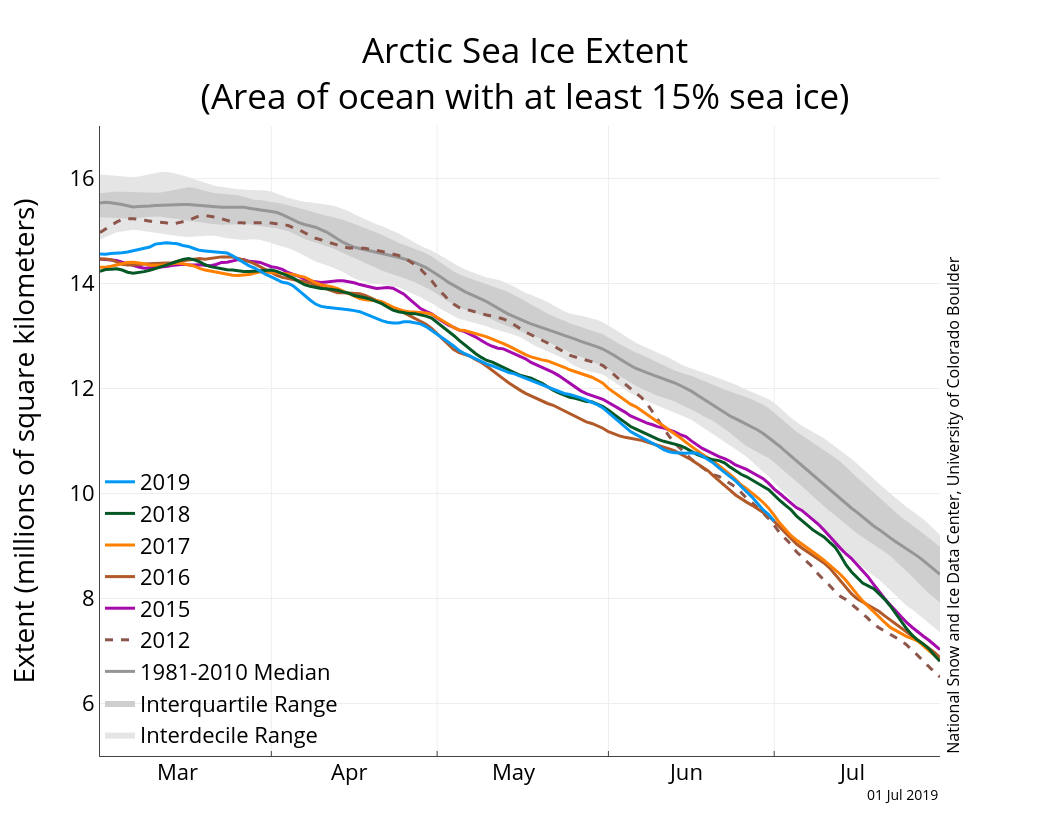
Figure 2a. The graph above shows Arctic sea ice extent as of December 04, 2019, along with daily ice extent data for four previous years and the record low year. 2019 is shown in blue, 2018 in green, 2017 in orange, 2016 in brown, 2015 in purple, and 2012 in dotted brown. The 1981 to 2010 median is in dark gray. The gray areas around the median line show the interquartile and interdecile ranges of the data. Sea Ice Index data.
Credit: National Snow and Ice Data Center
High-resolution image
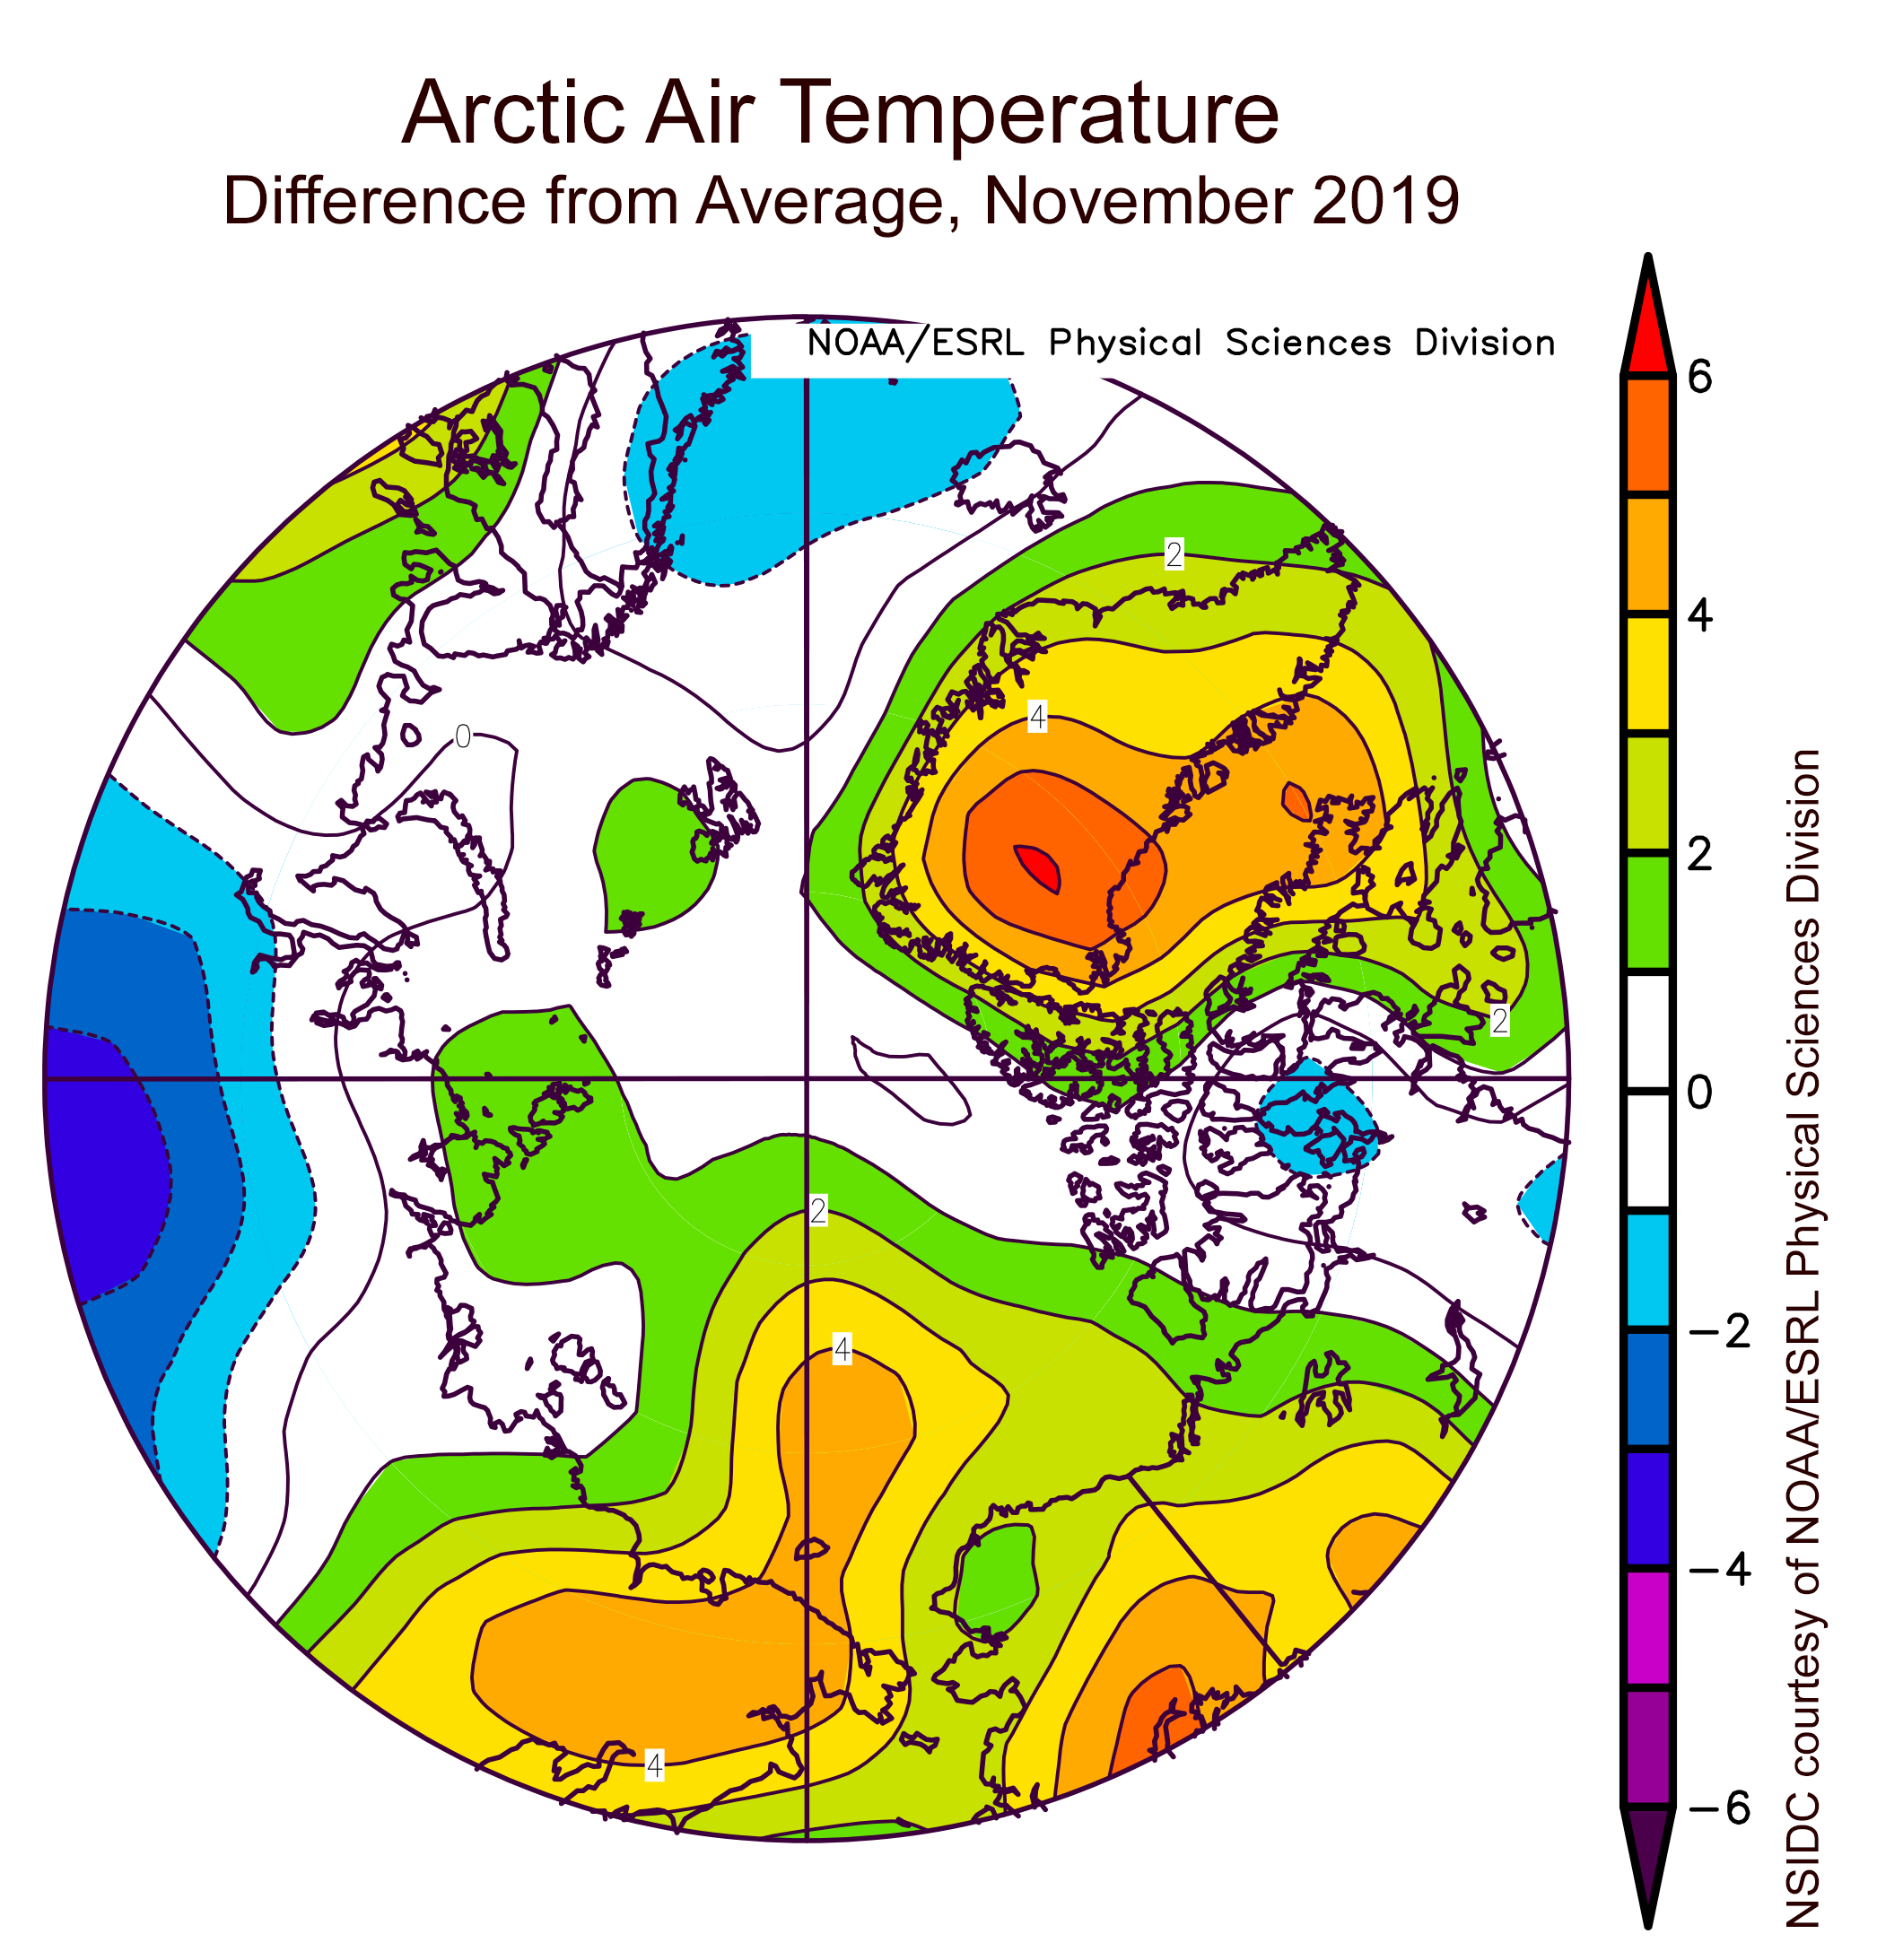
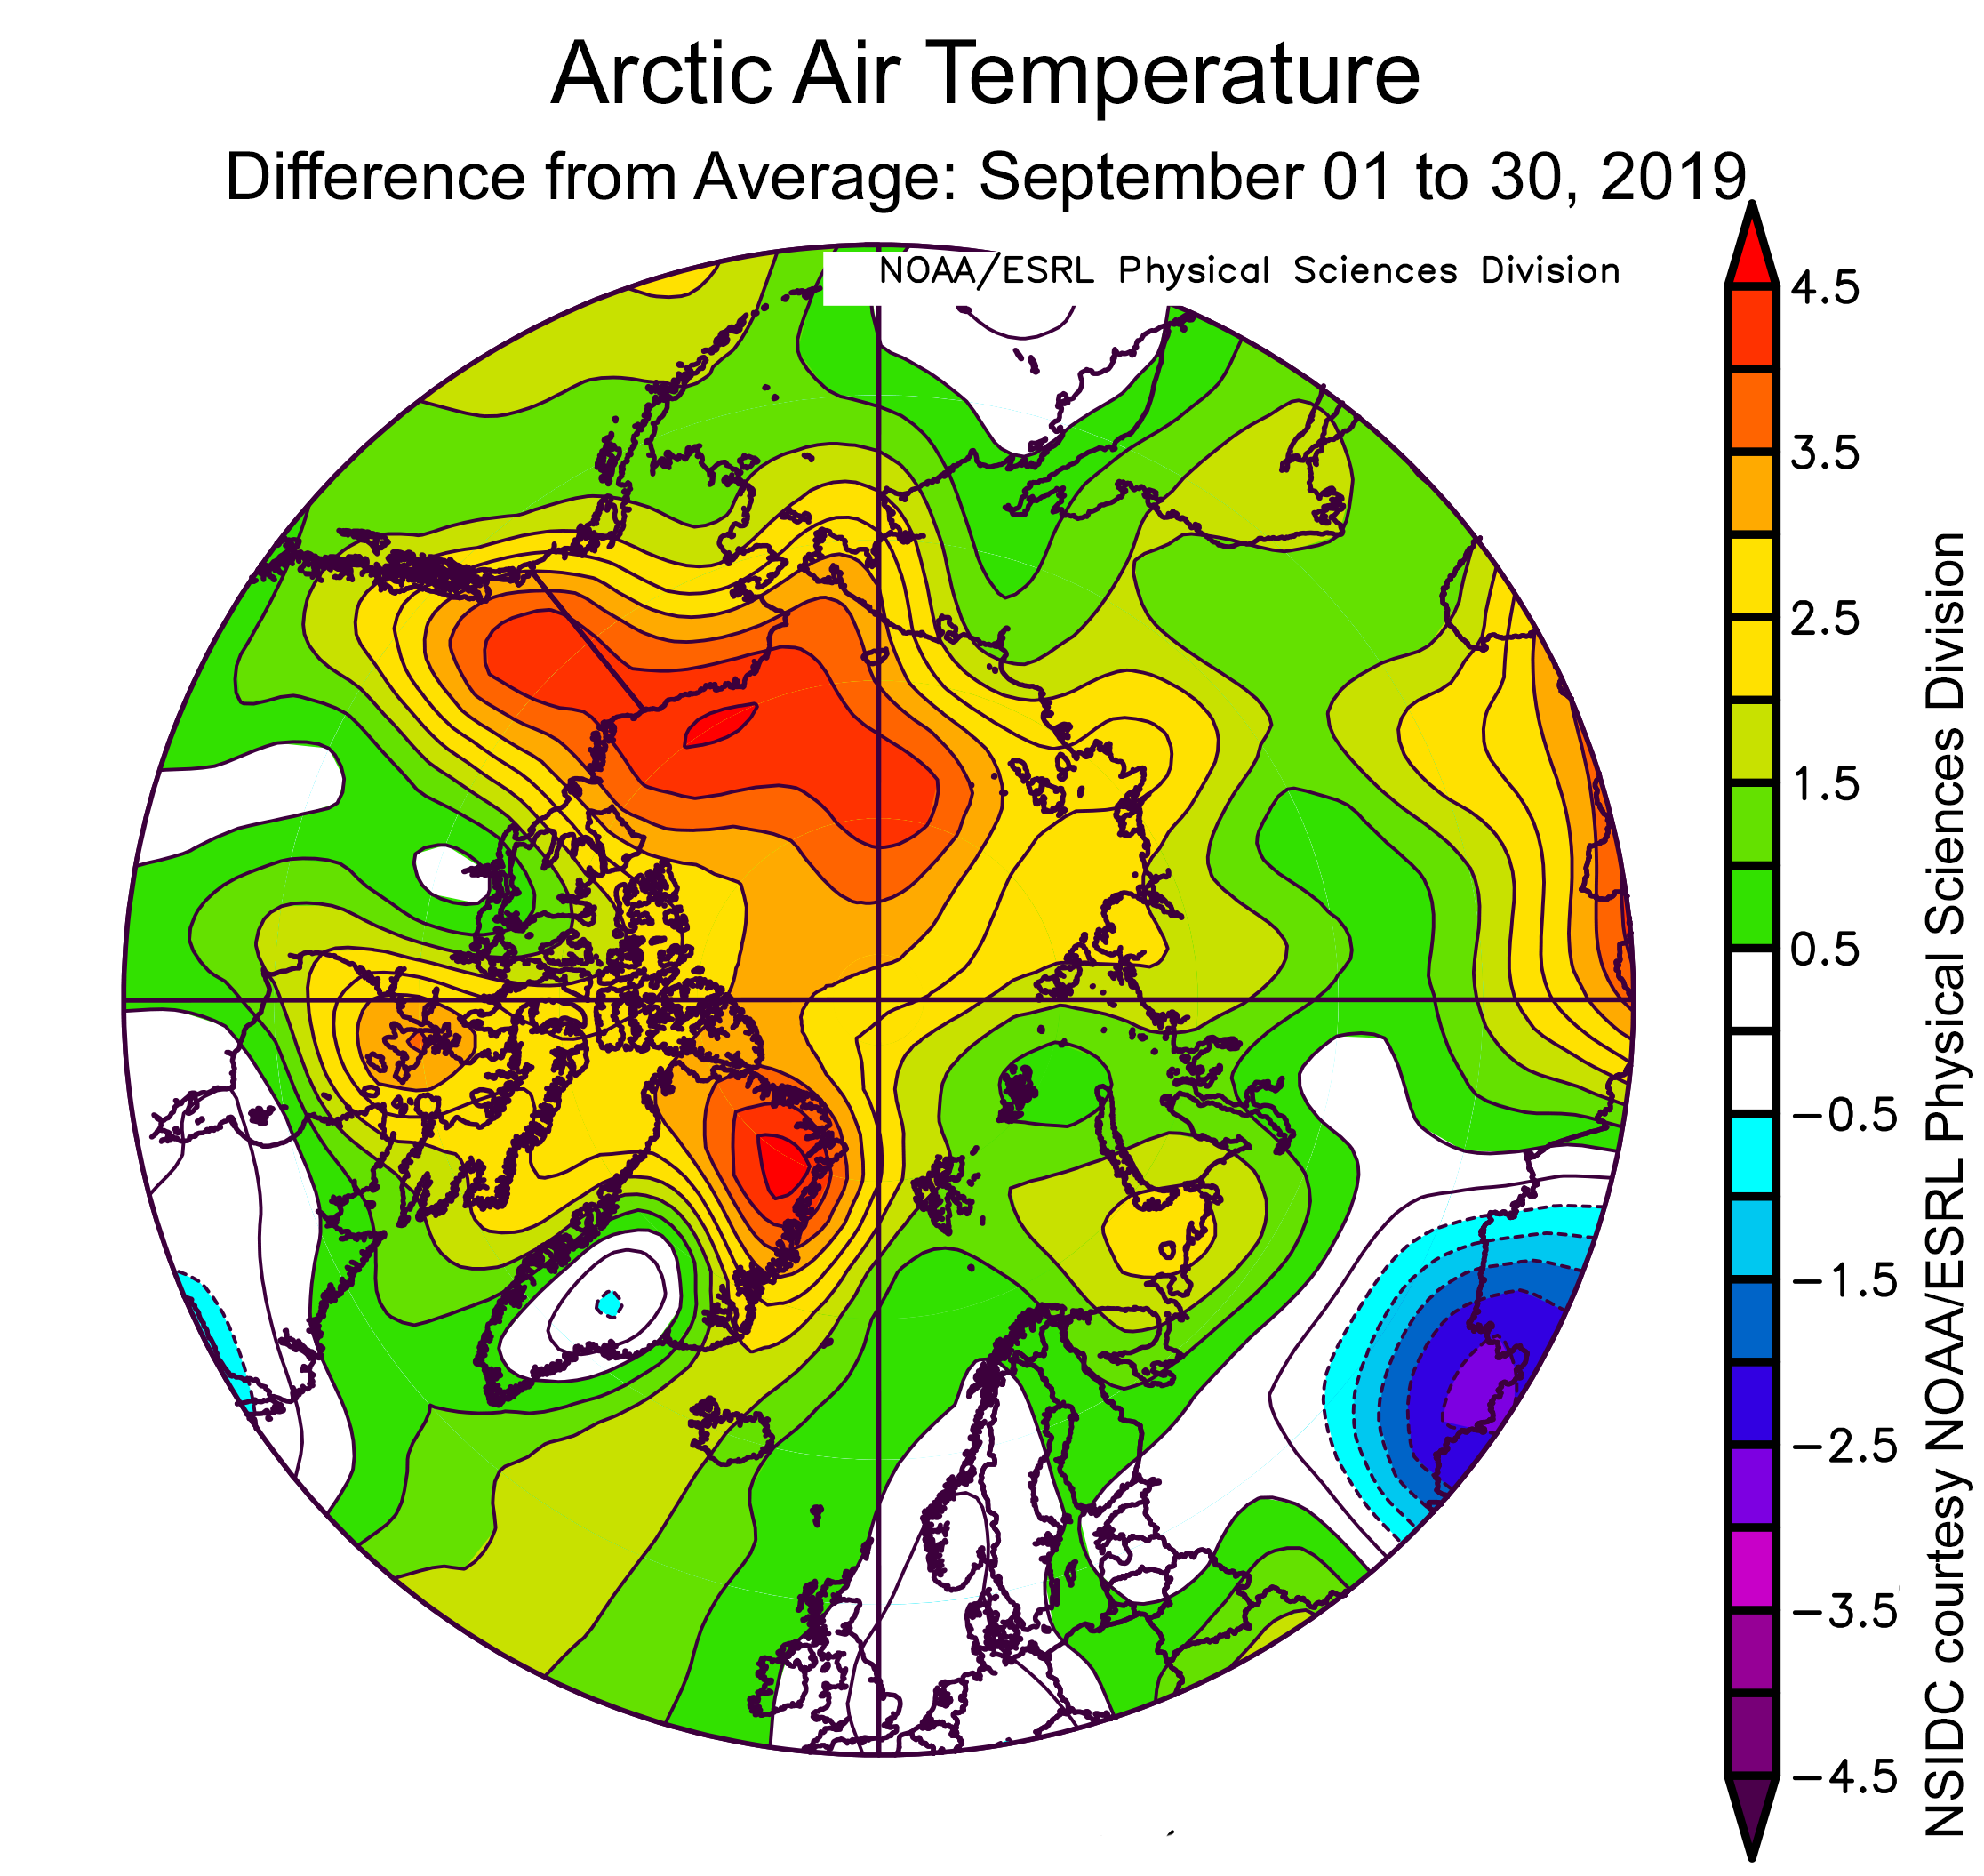
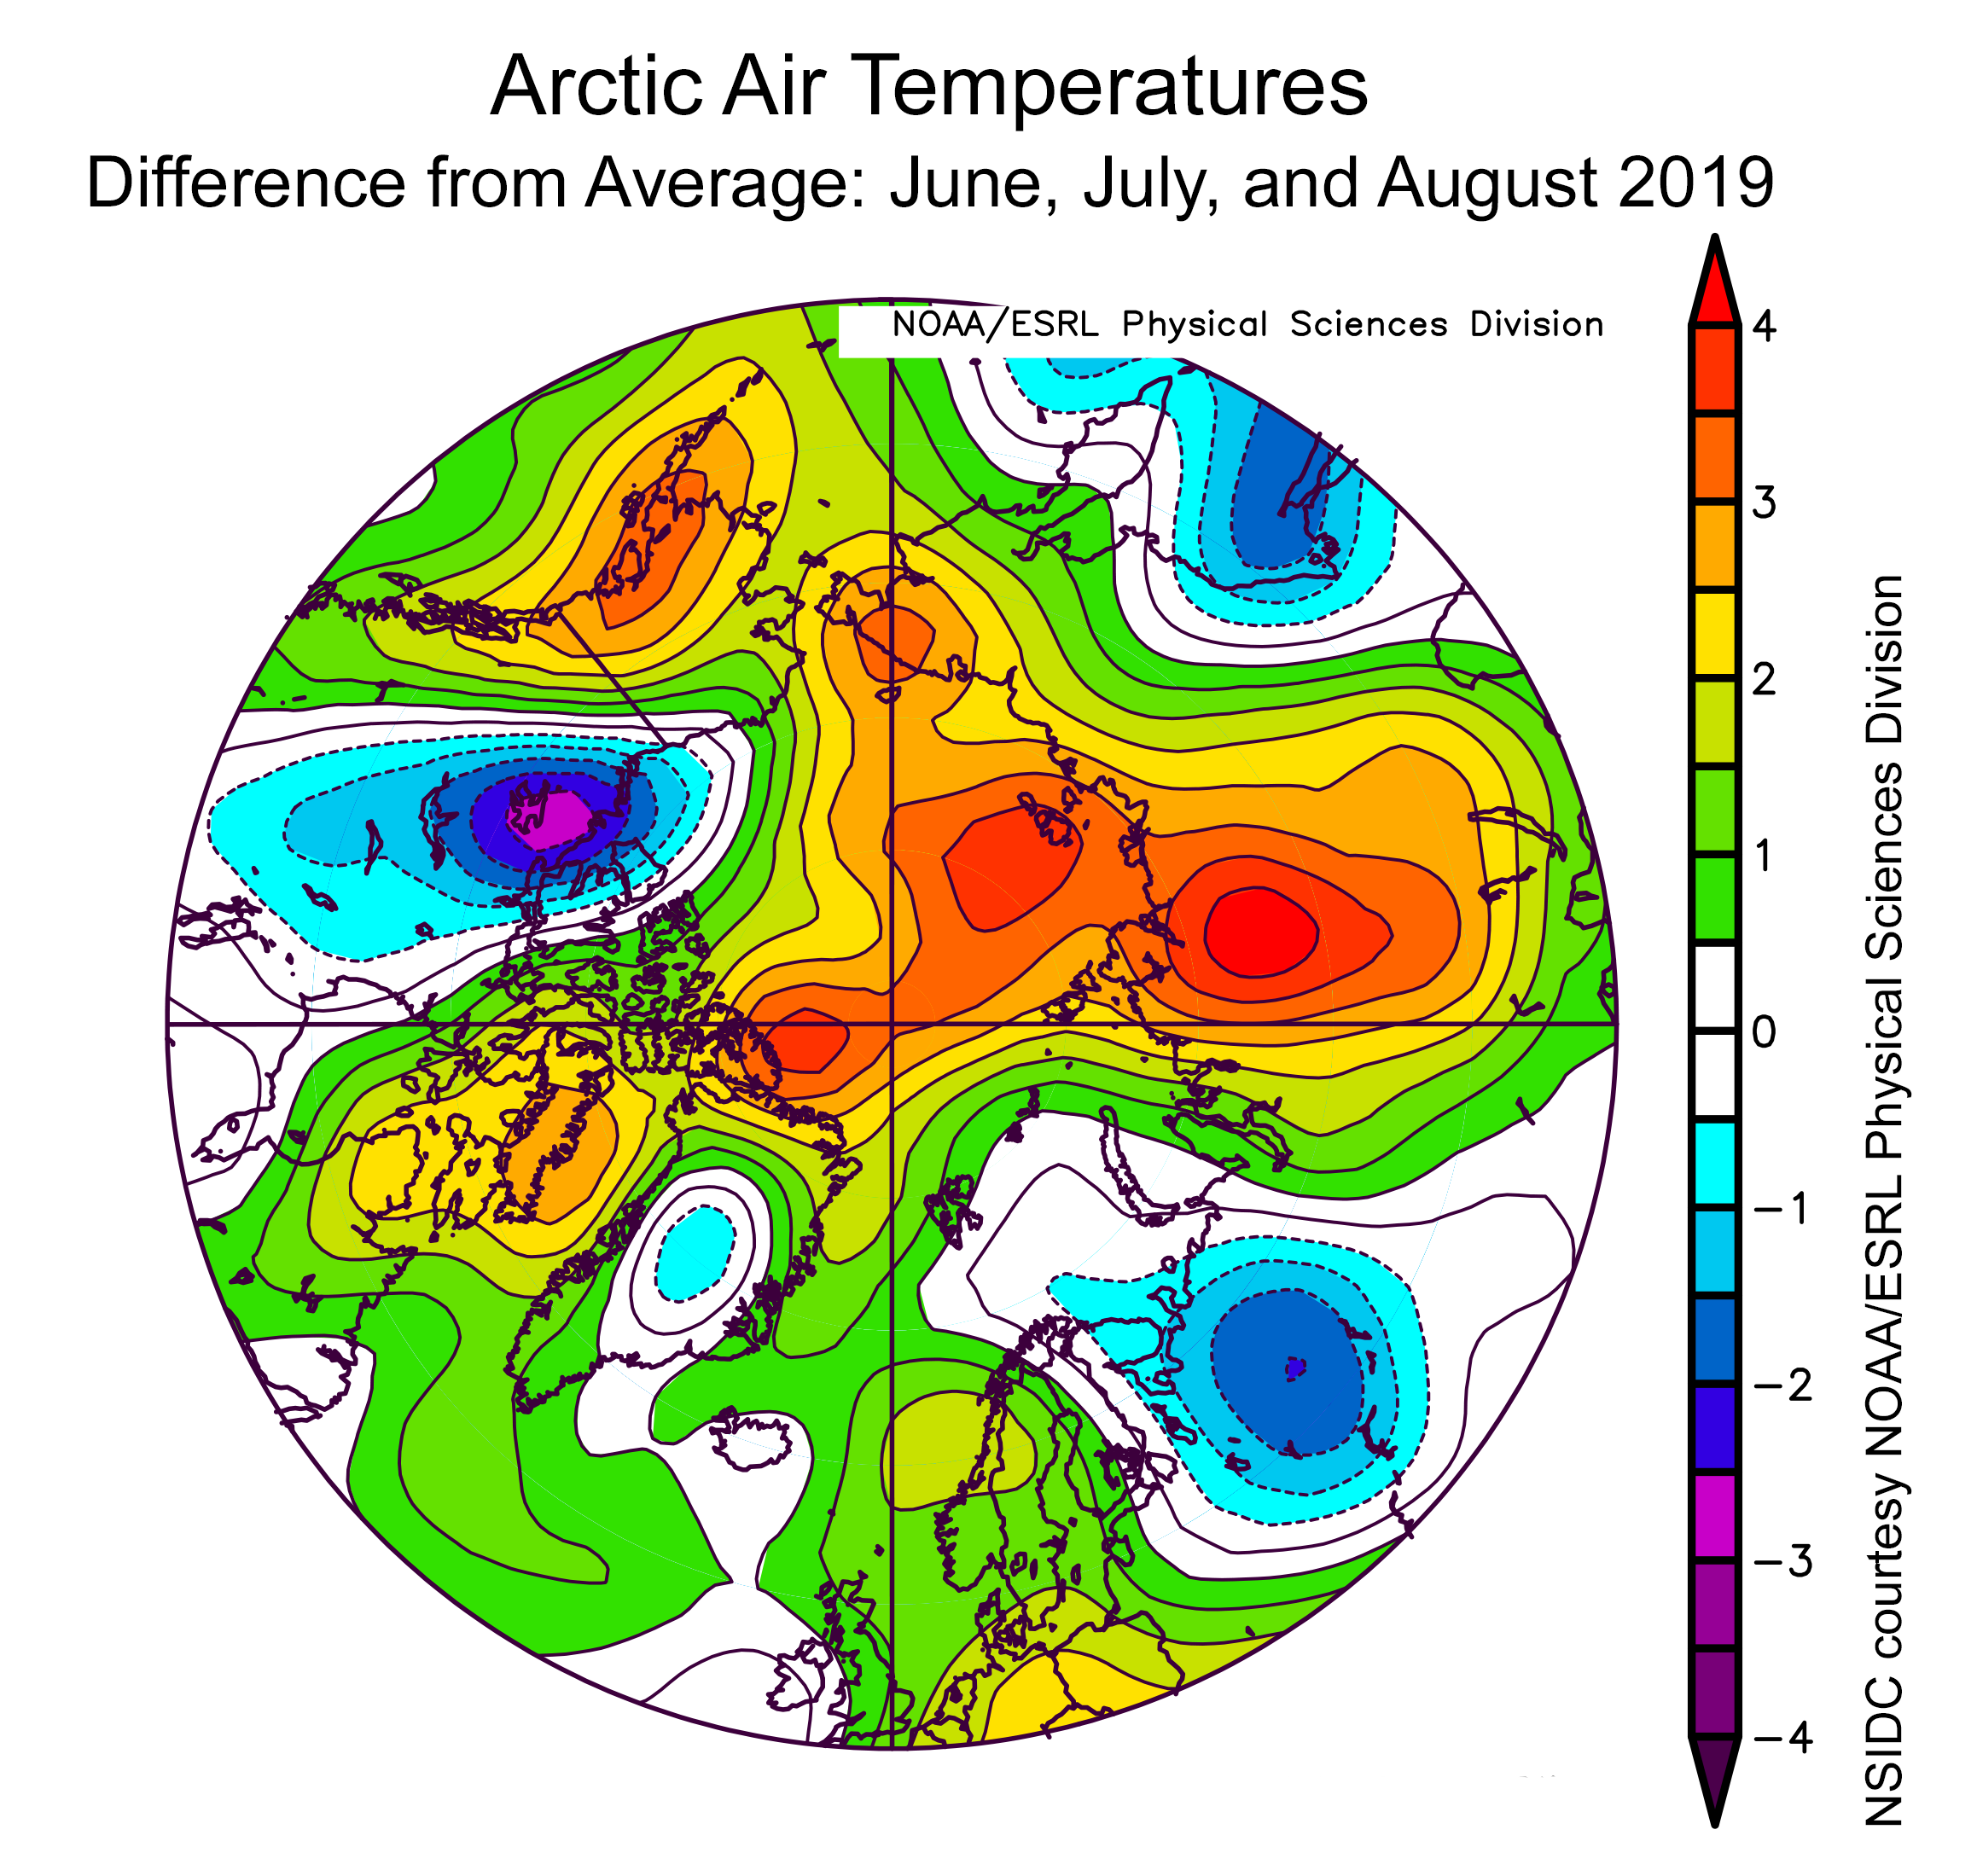
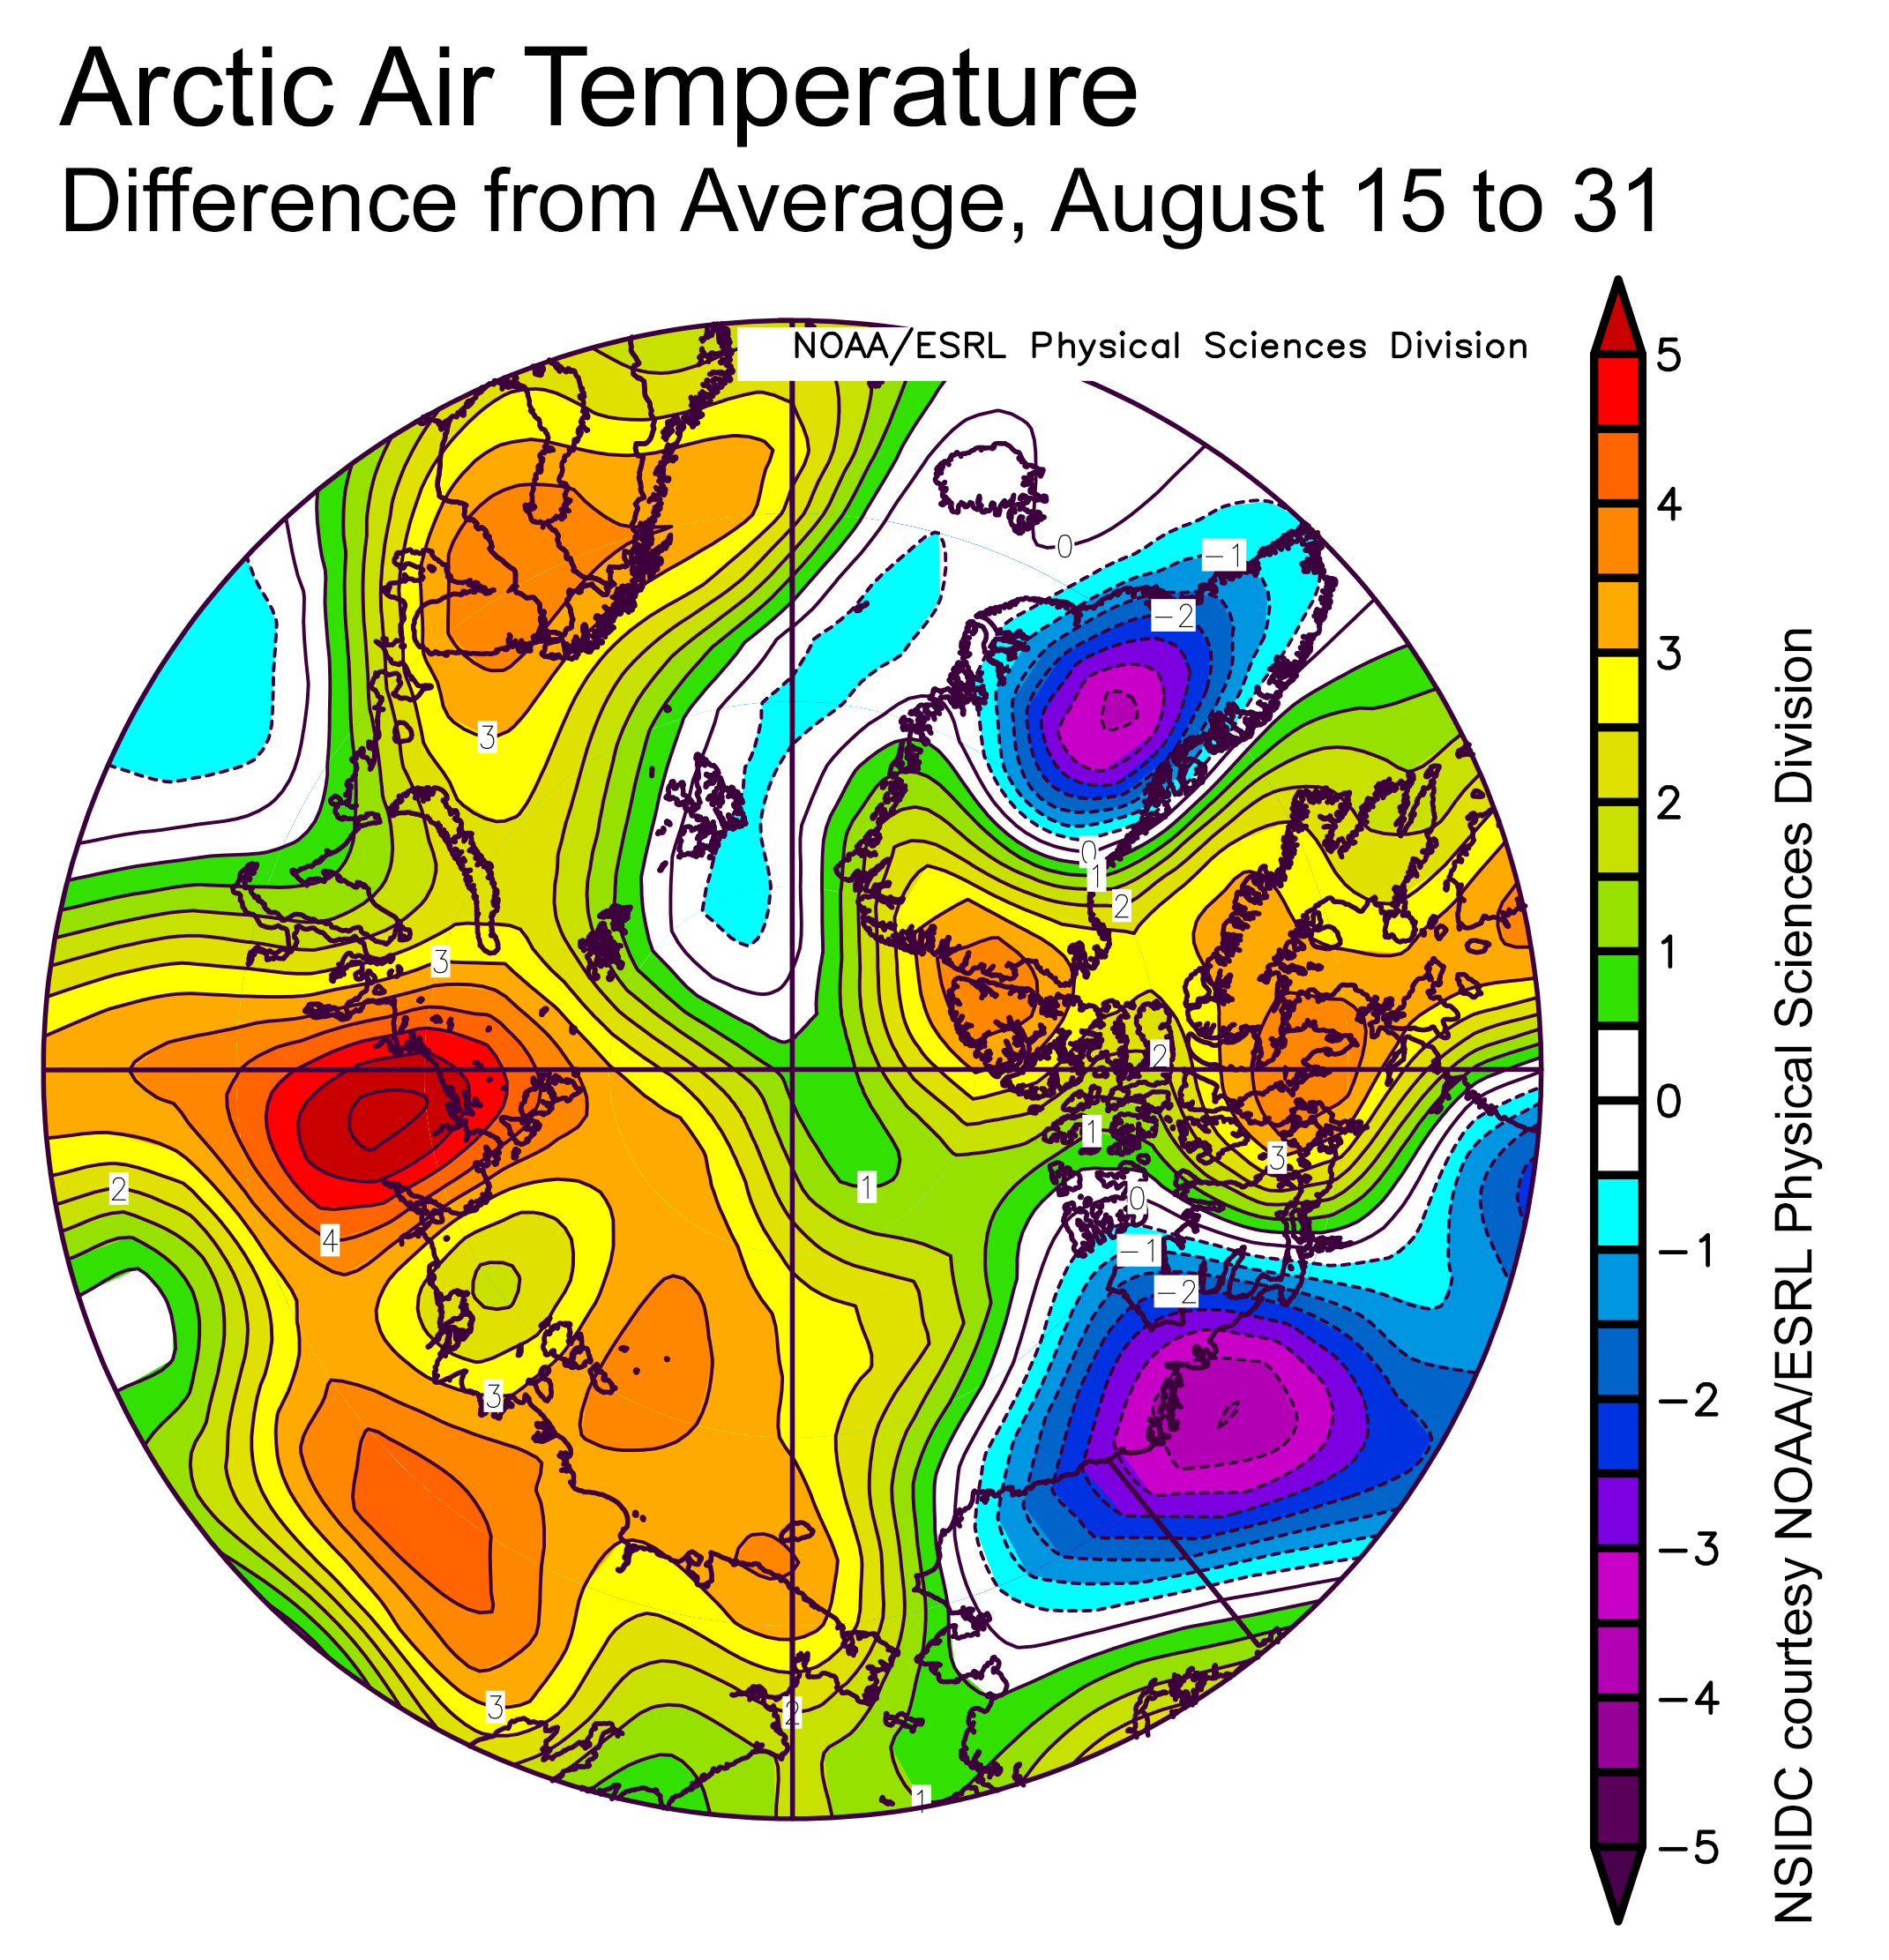
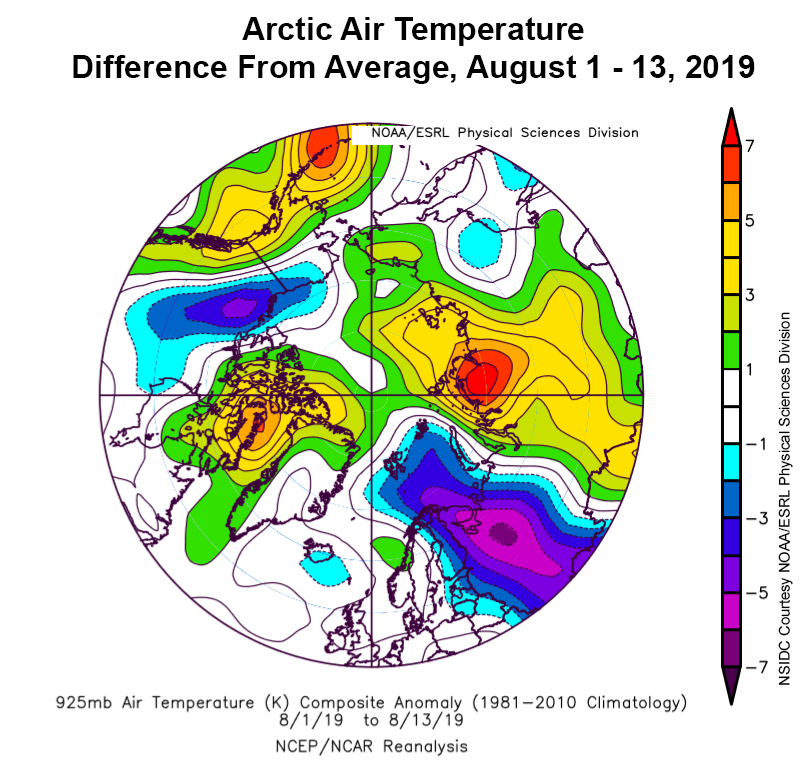
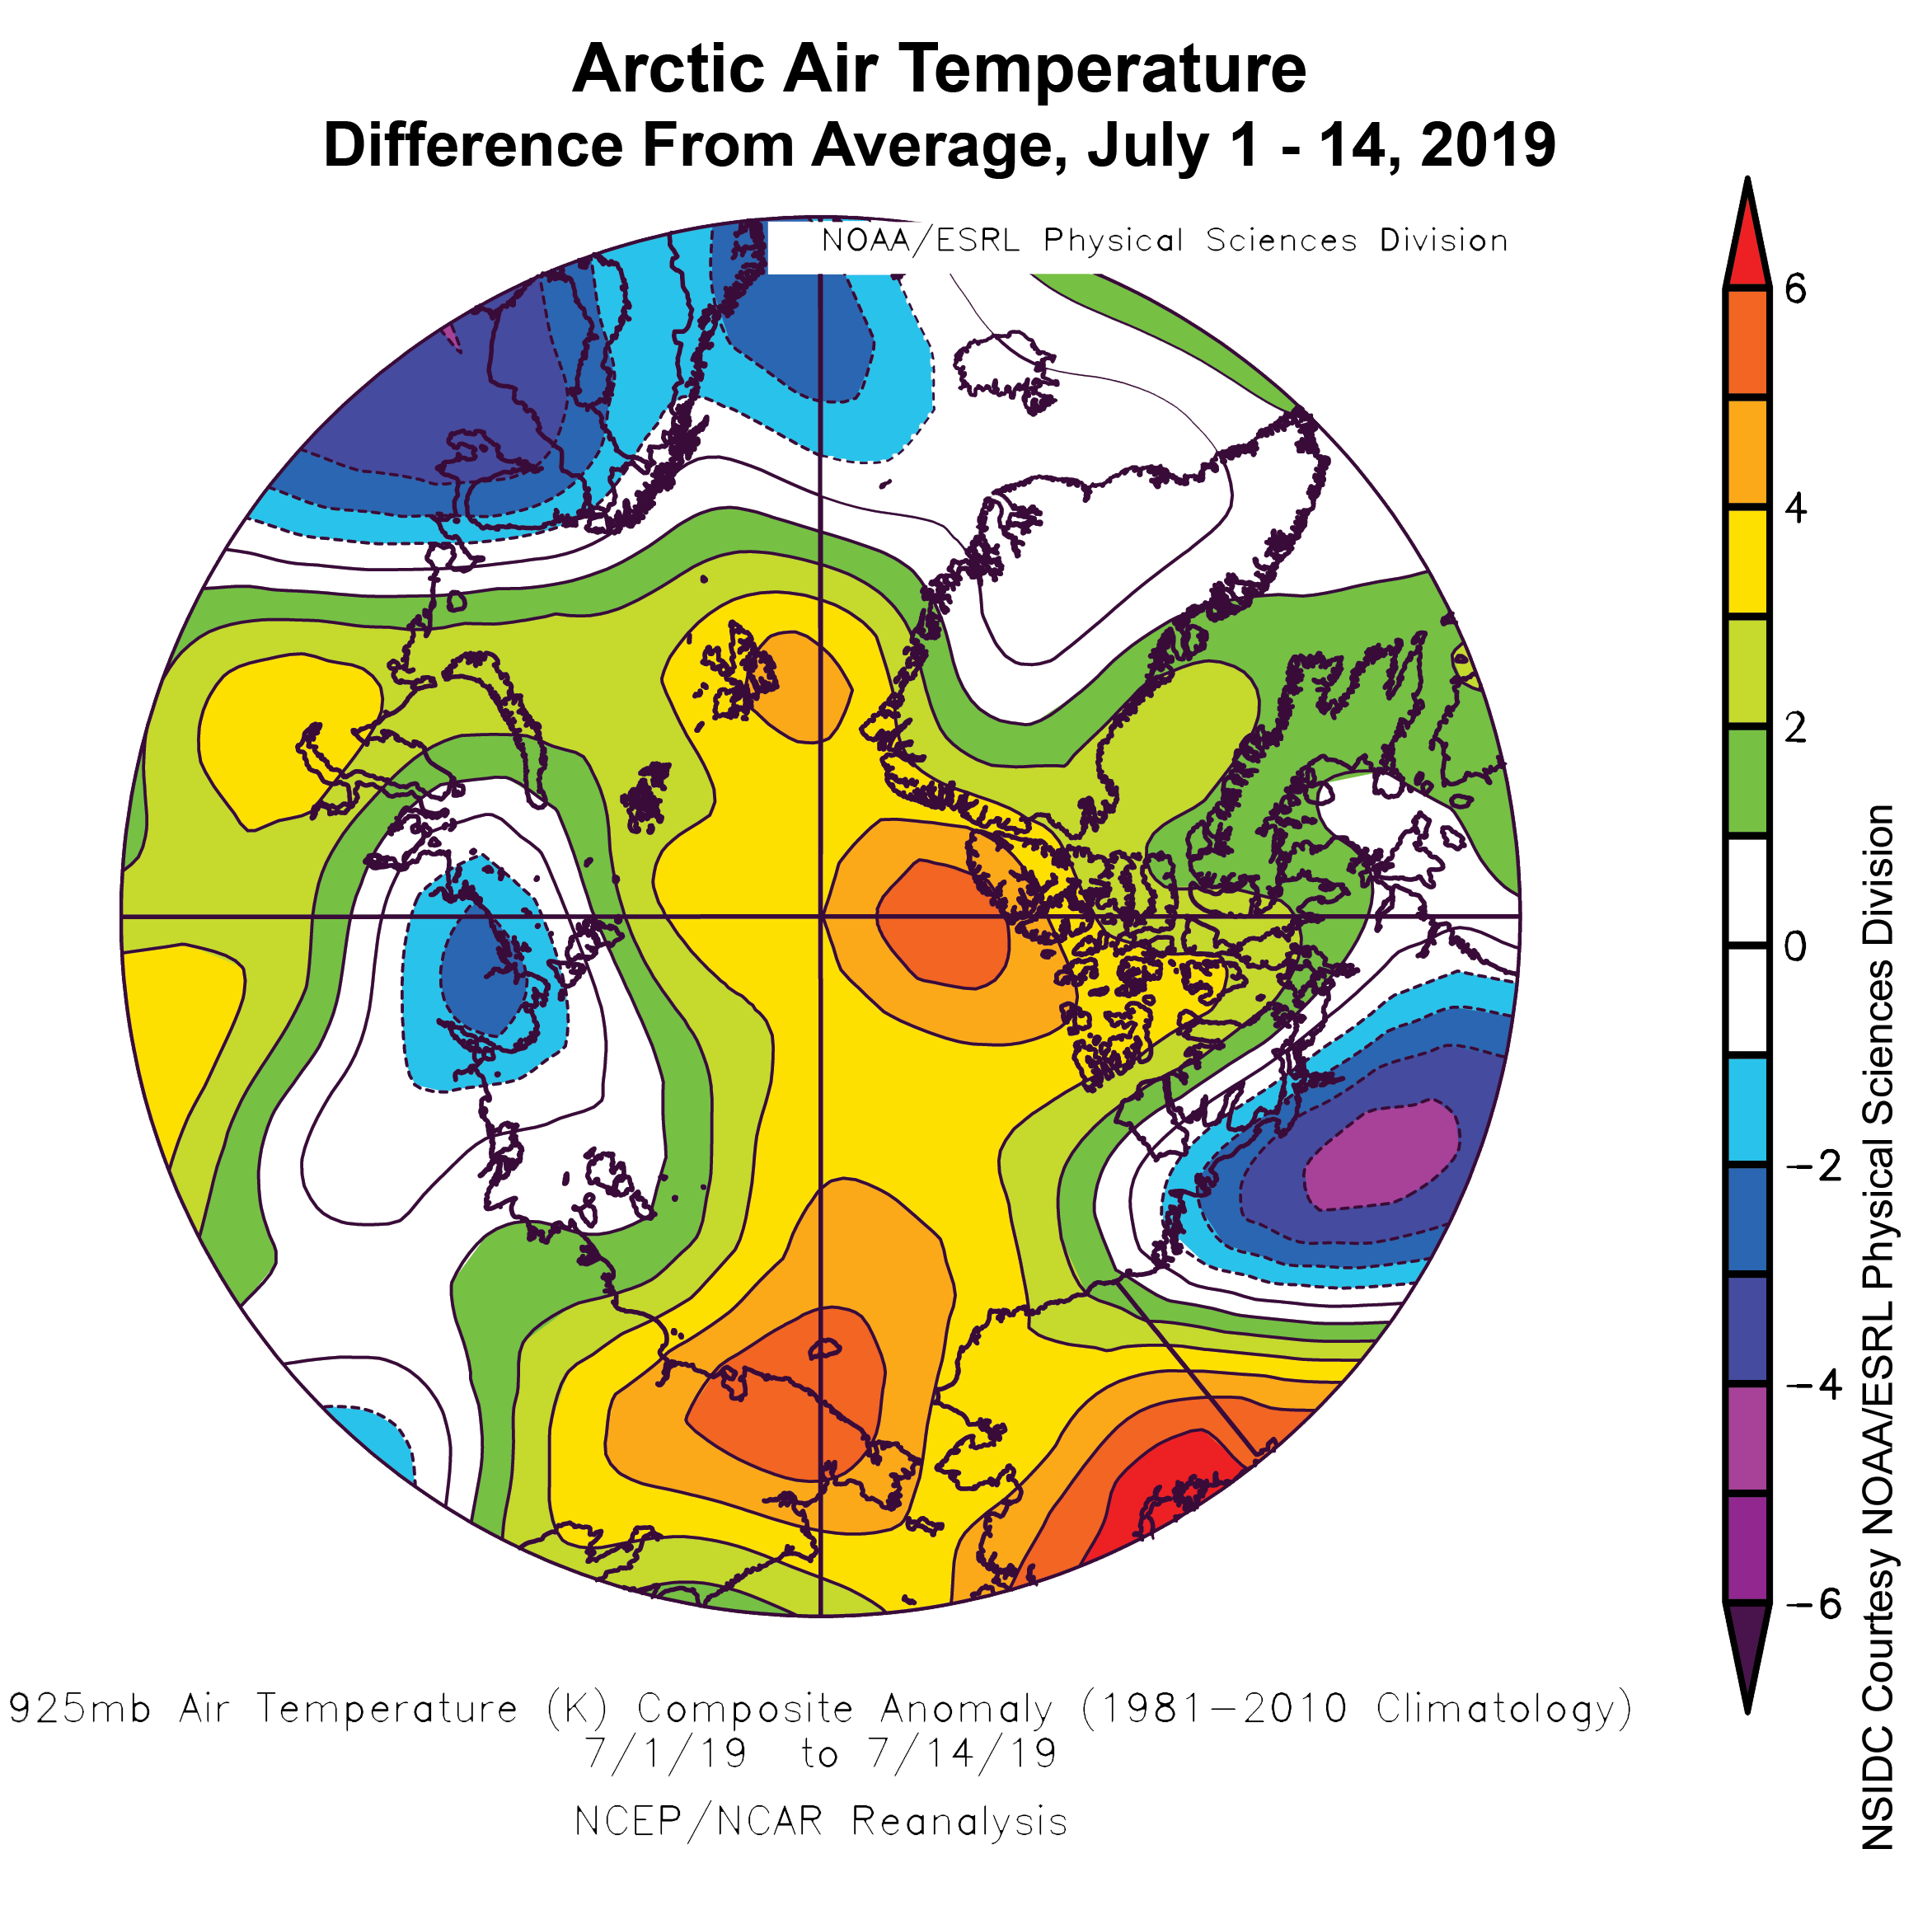
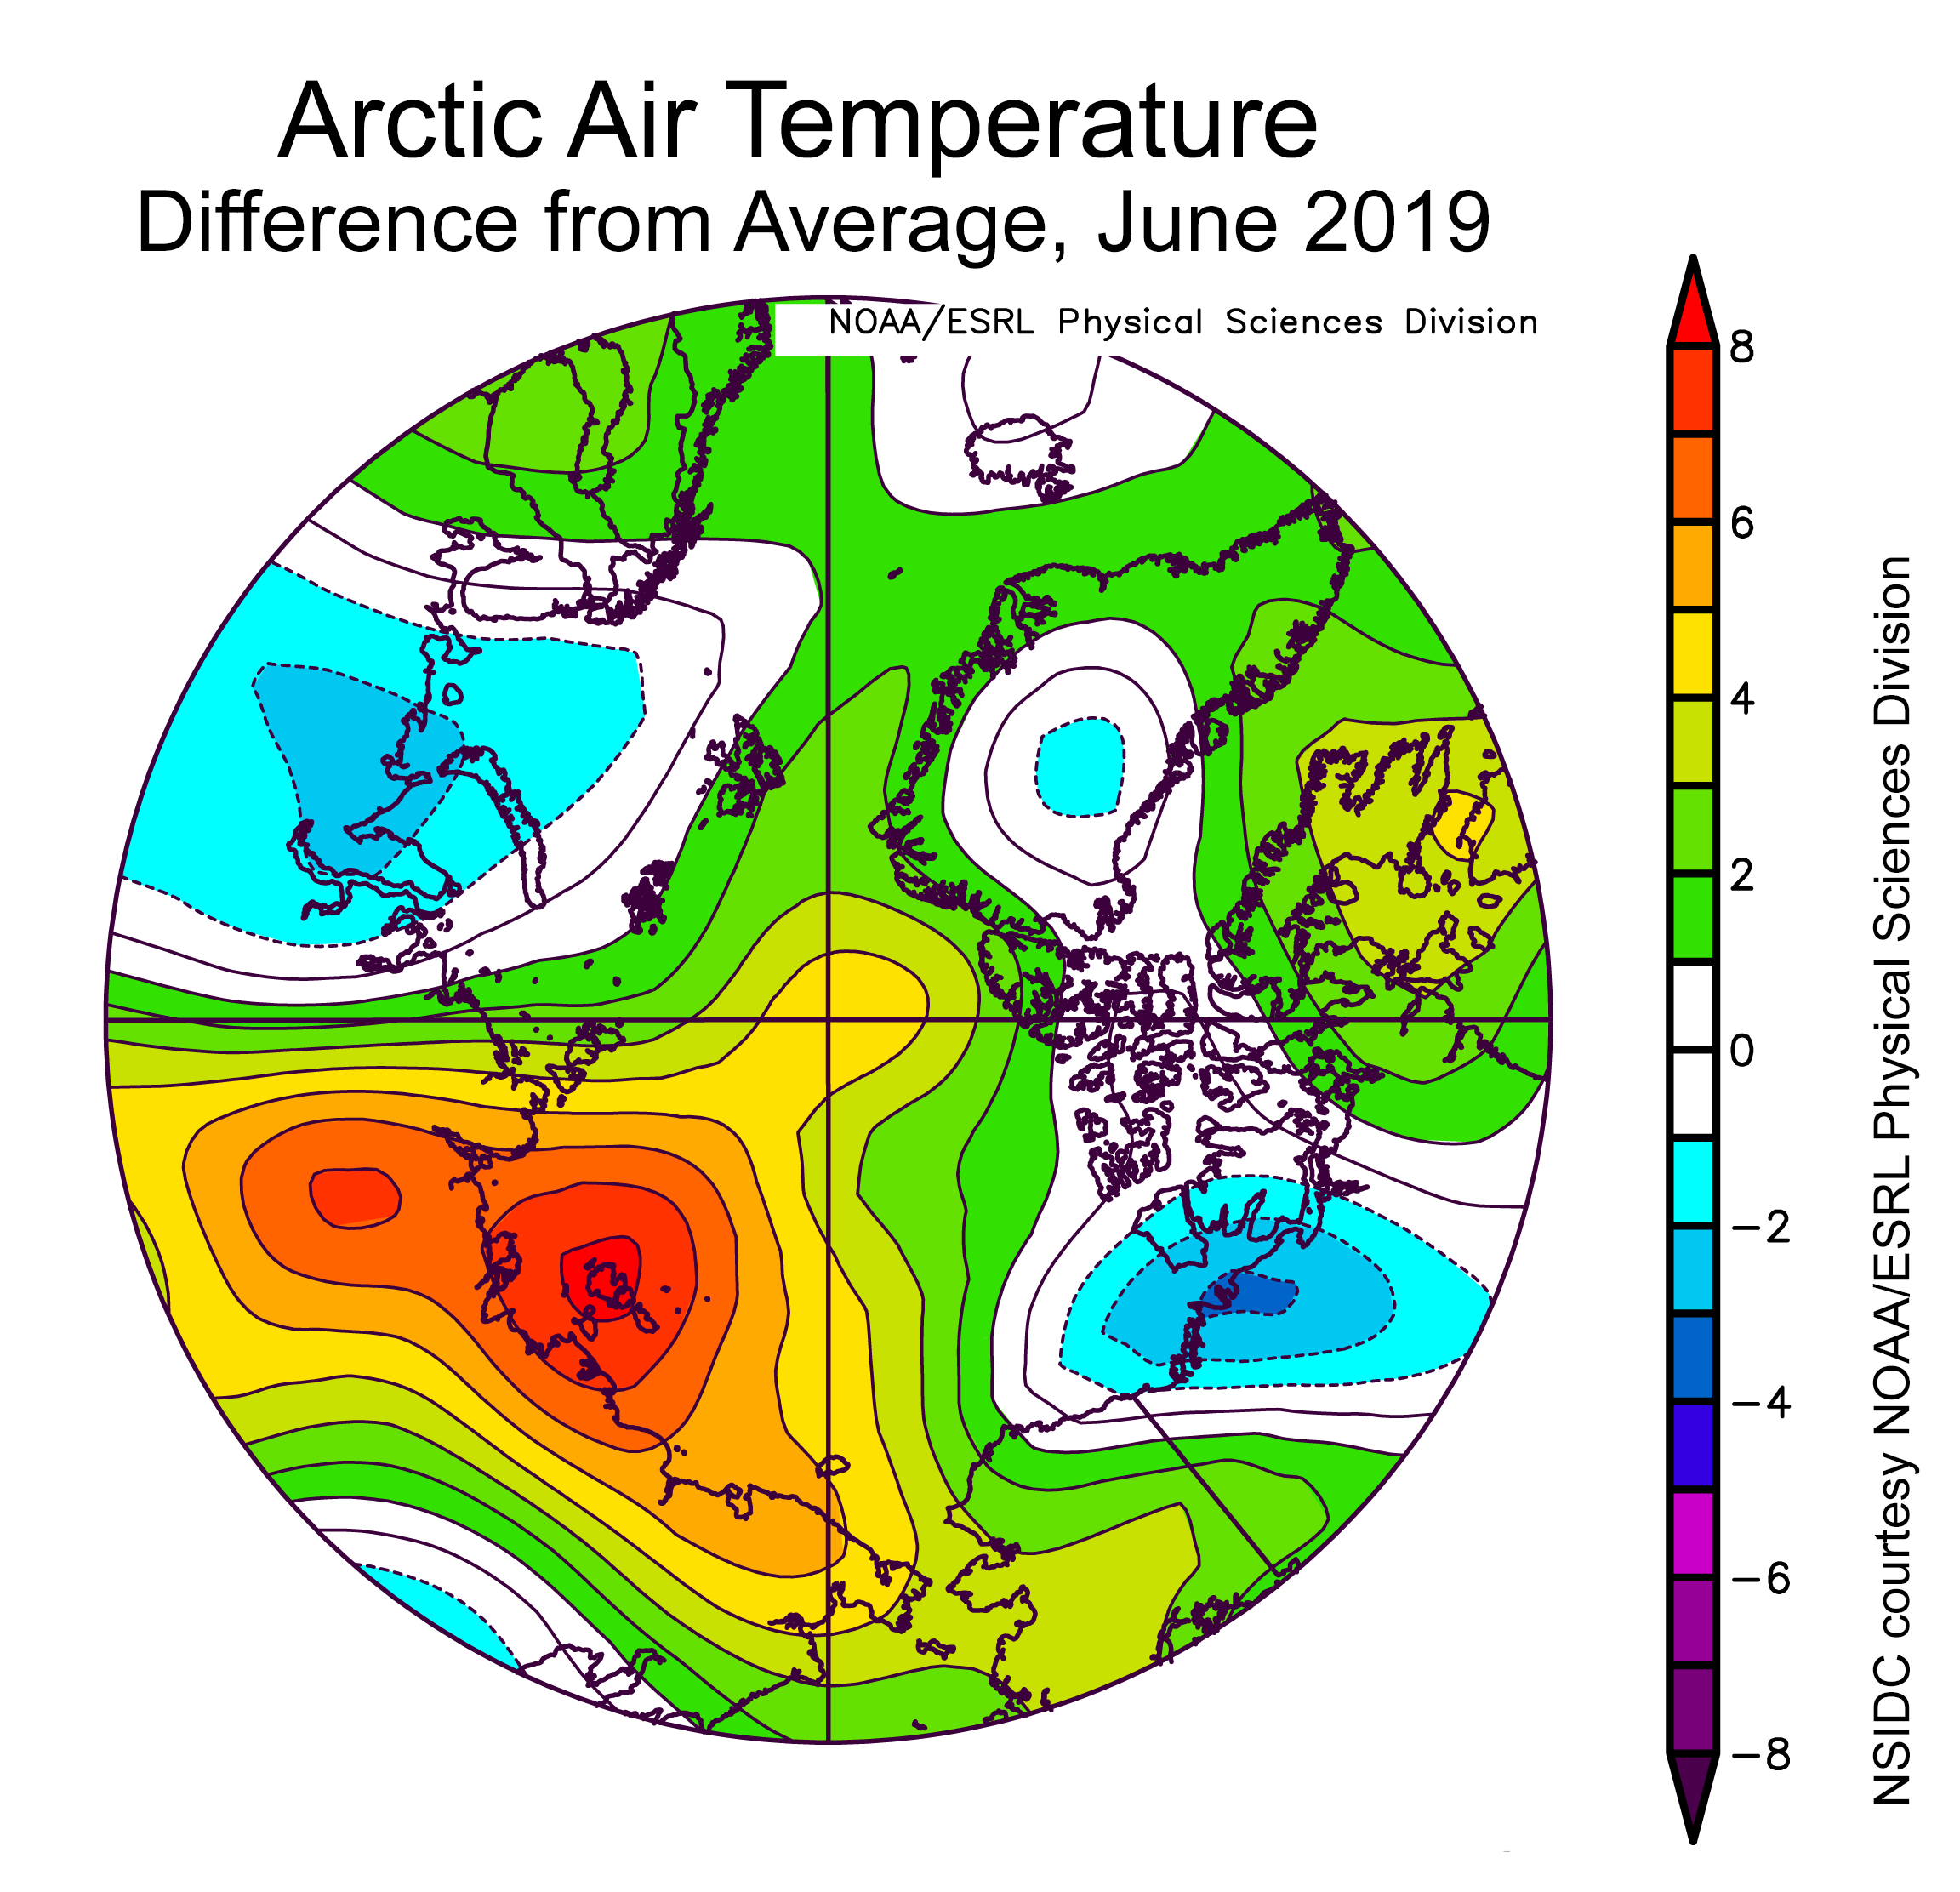
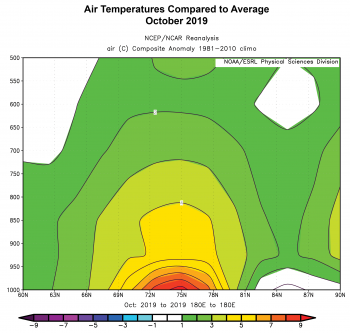
Figure 2b. This plot shows the departure from average air temperature in the Arctic at the 925 hPa level, in degrees Celsius, for November 2019. Yellows and reds indicate higher than average temperatures; blues and purples indicate lower than average temperatures.
Credit: NSIDC courtesy NOAA Earth System Research Laboratory Physical Sciences Division
High-resolution image
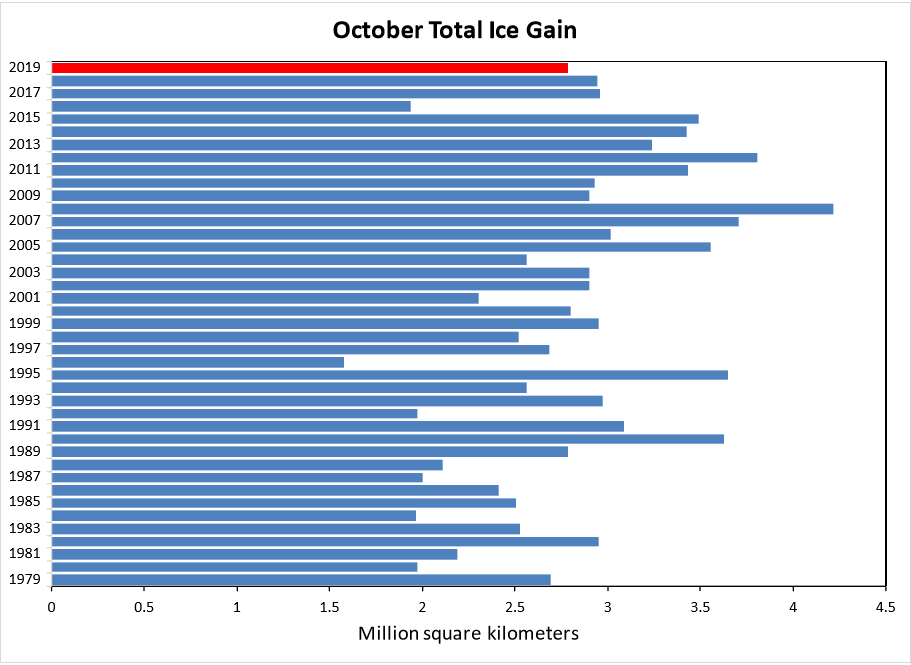
The daily growth rate for November was generally steady, averaging 98,600 square kilometers (38,100 square miles) per day, compared to the 1981 to 2010 average of 69,600 square kilometers (26,900 square miles). Overall, ice extent increased by 2.75 million square kilometers (1.06 million square miles) through the month, somewhat larger than the 1981 to 2010 average for the month of 2.07 million square kilometers (799,000 square miles).
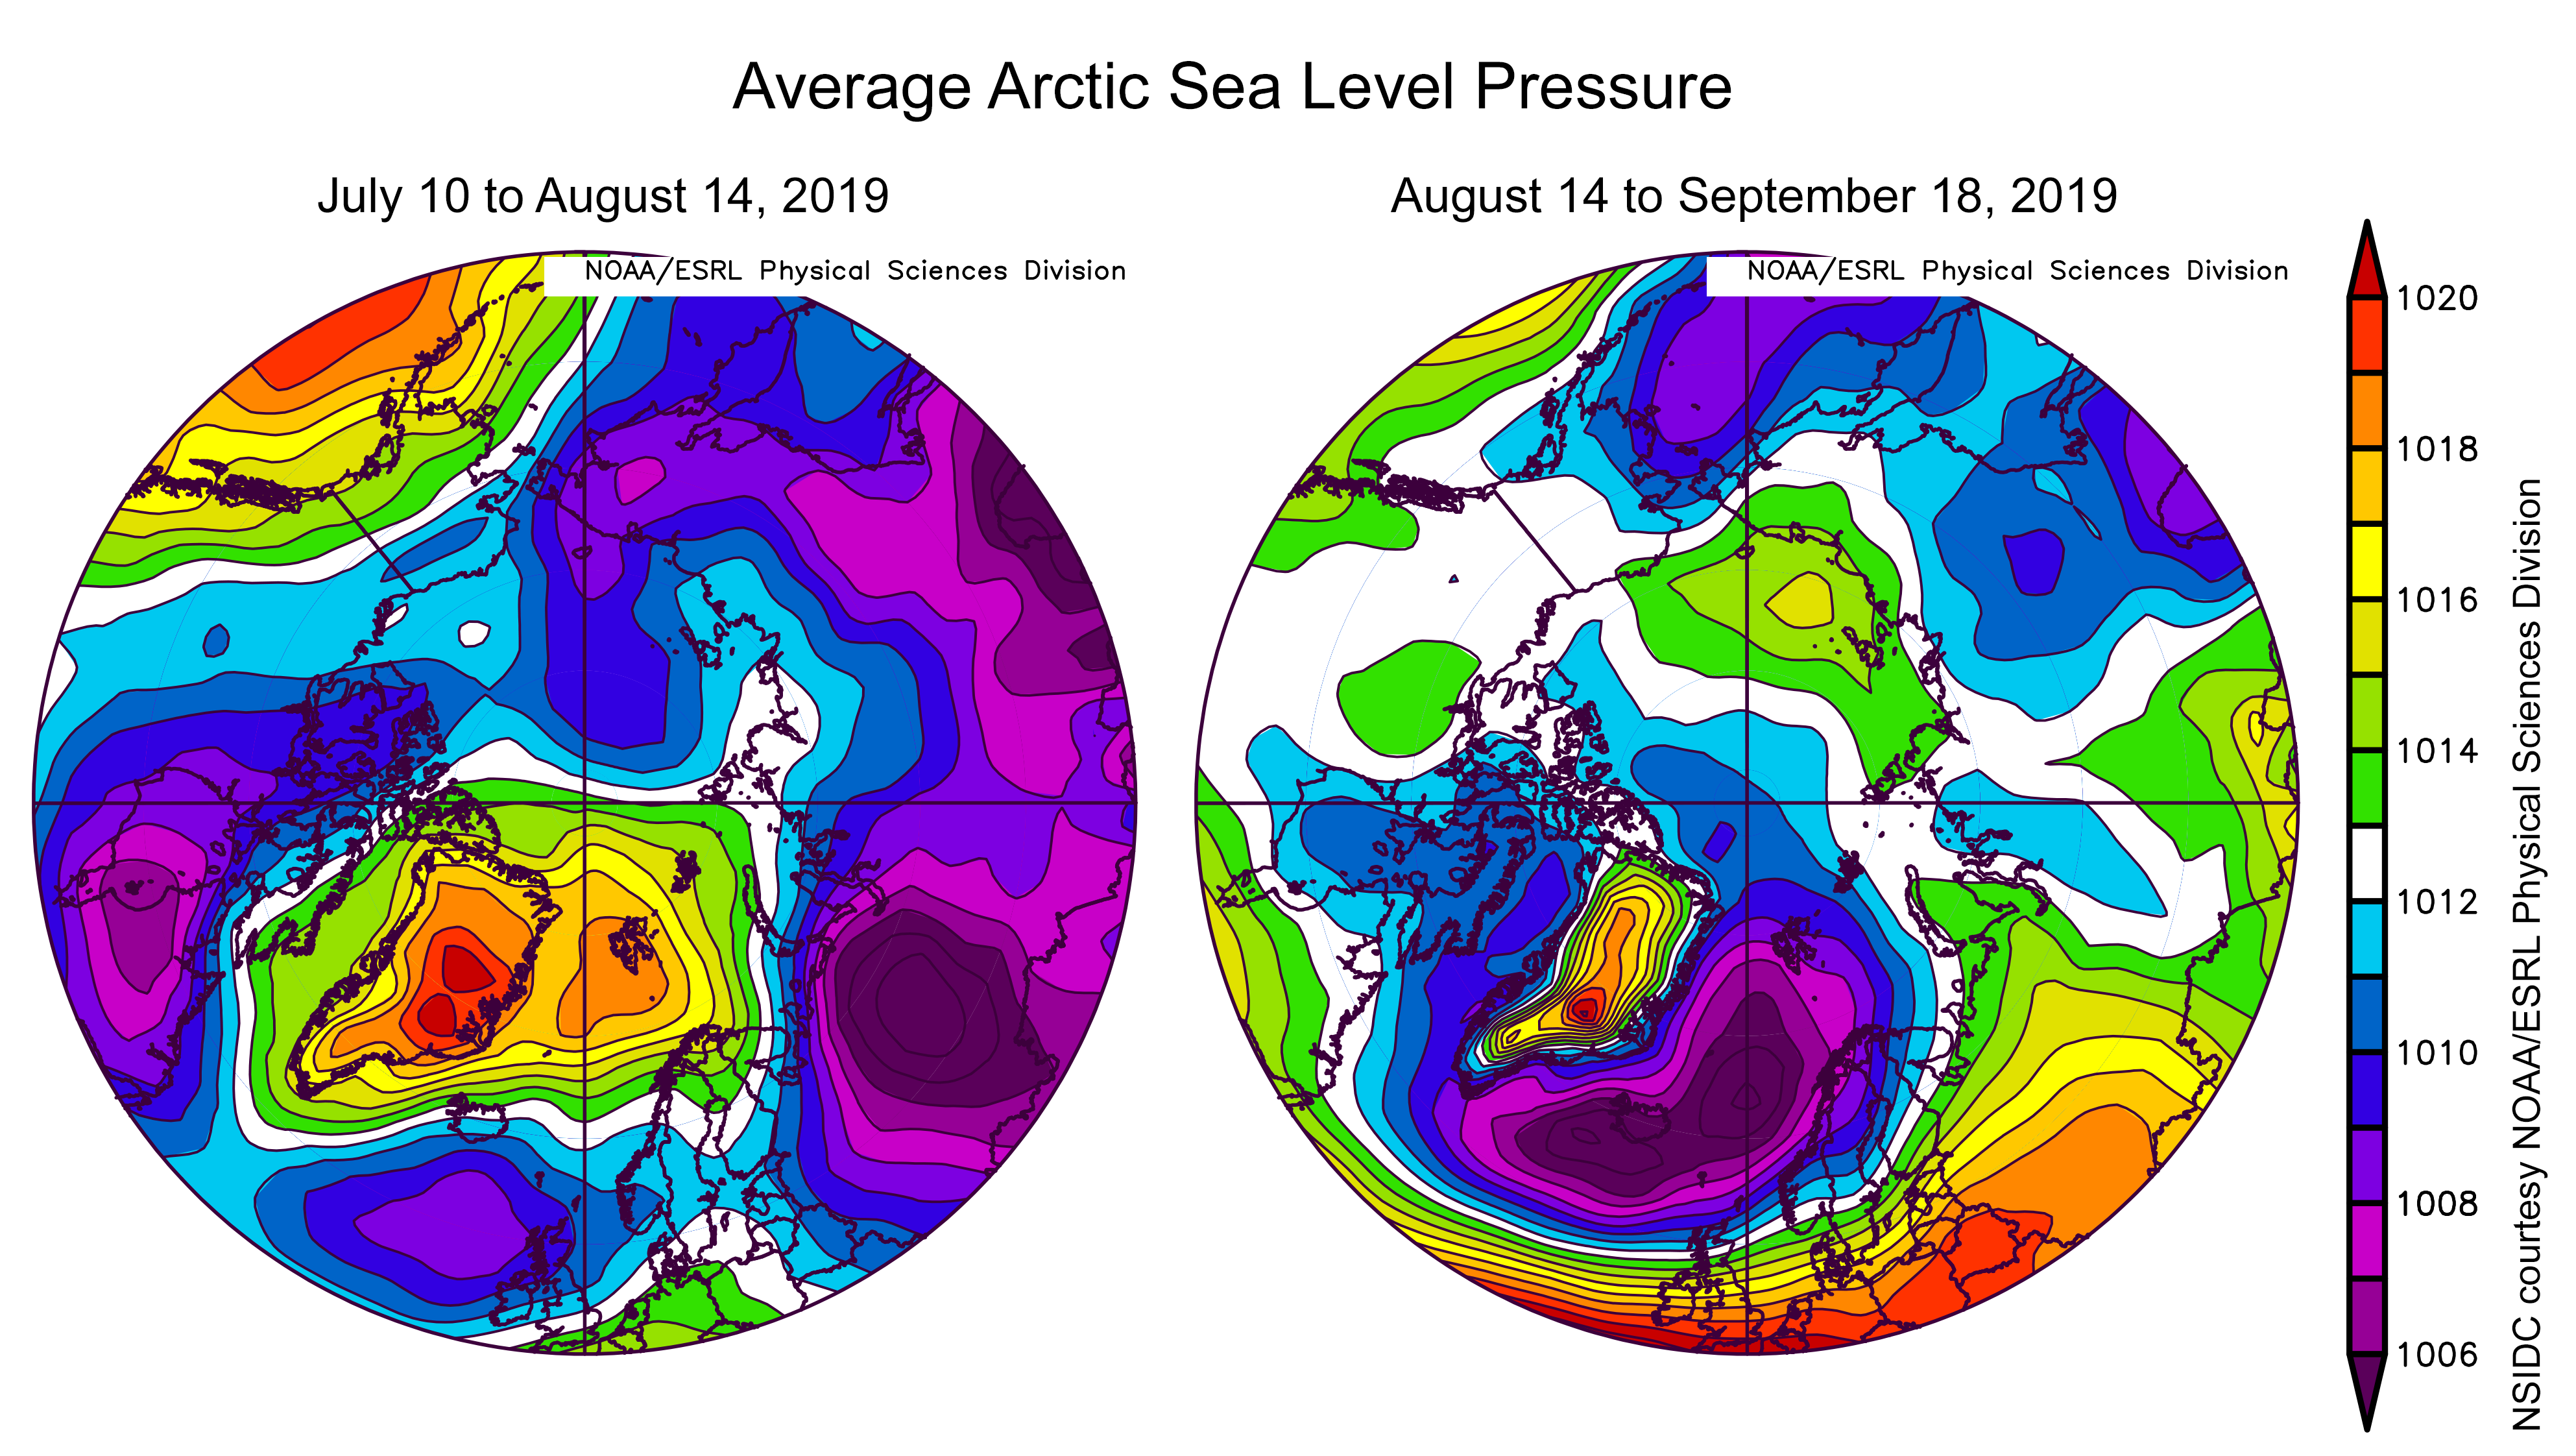
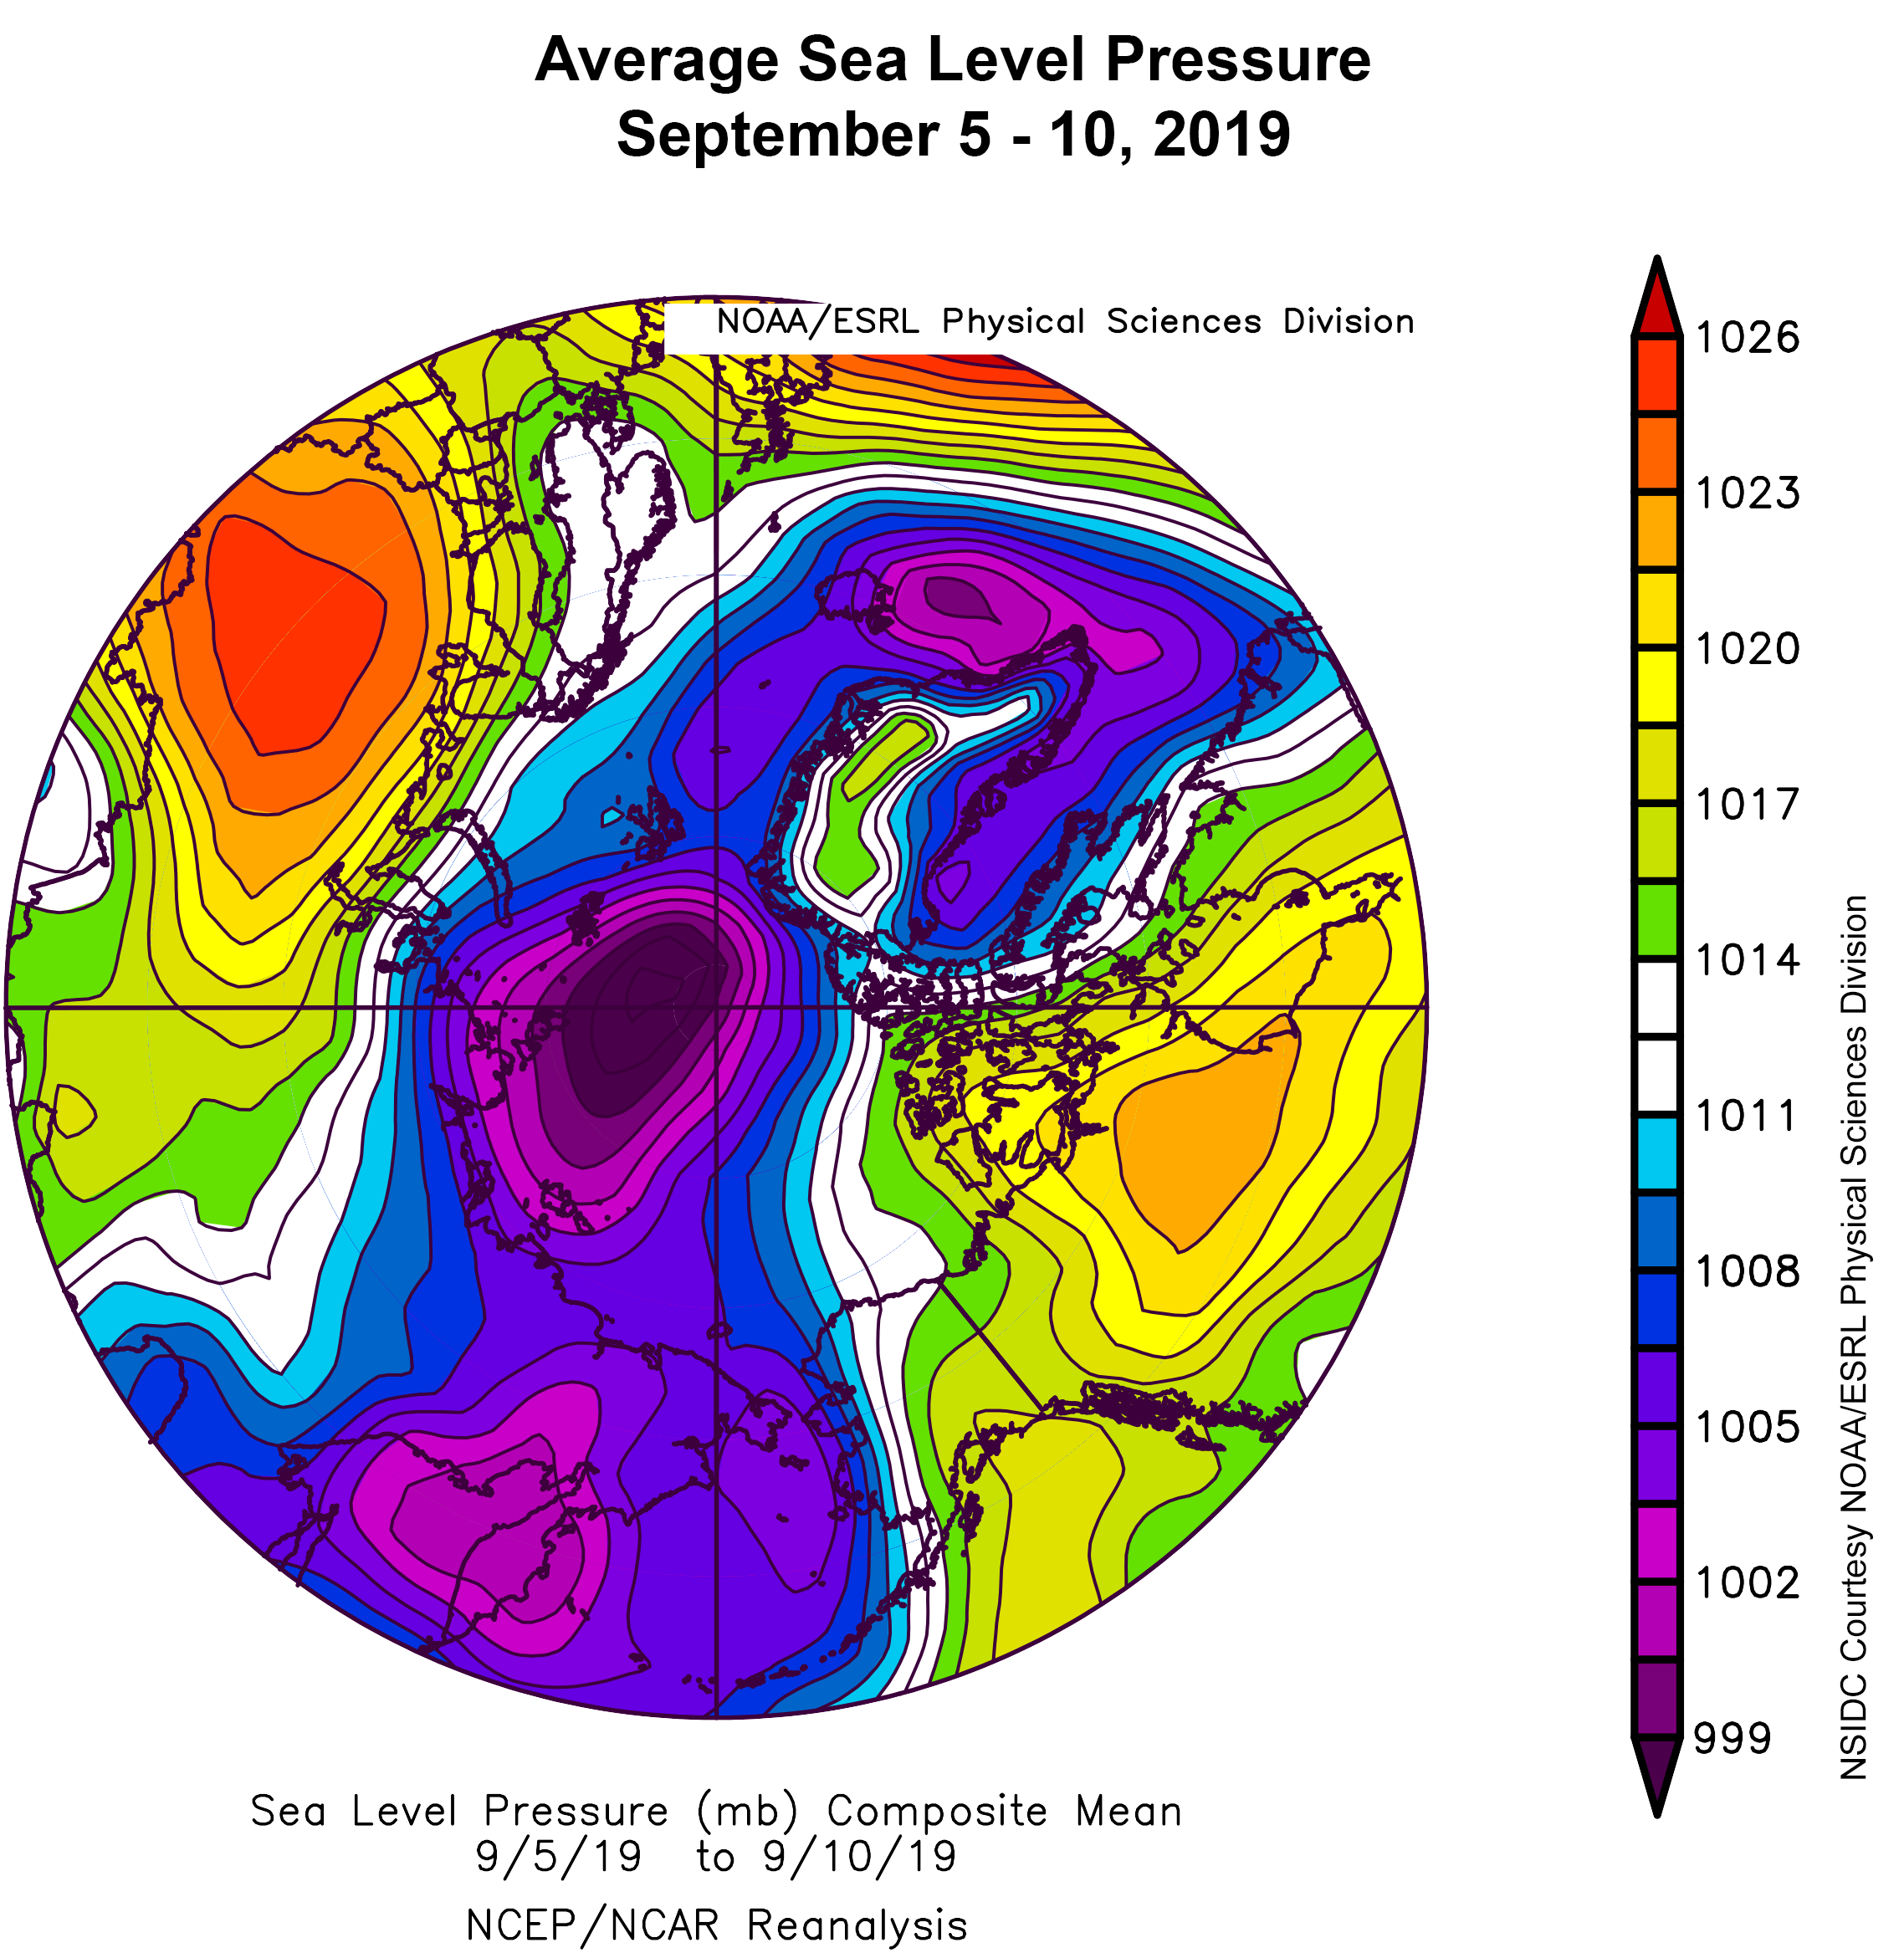
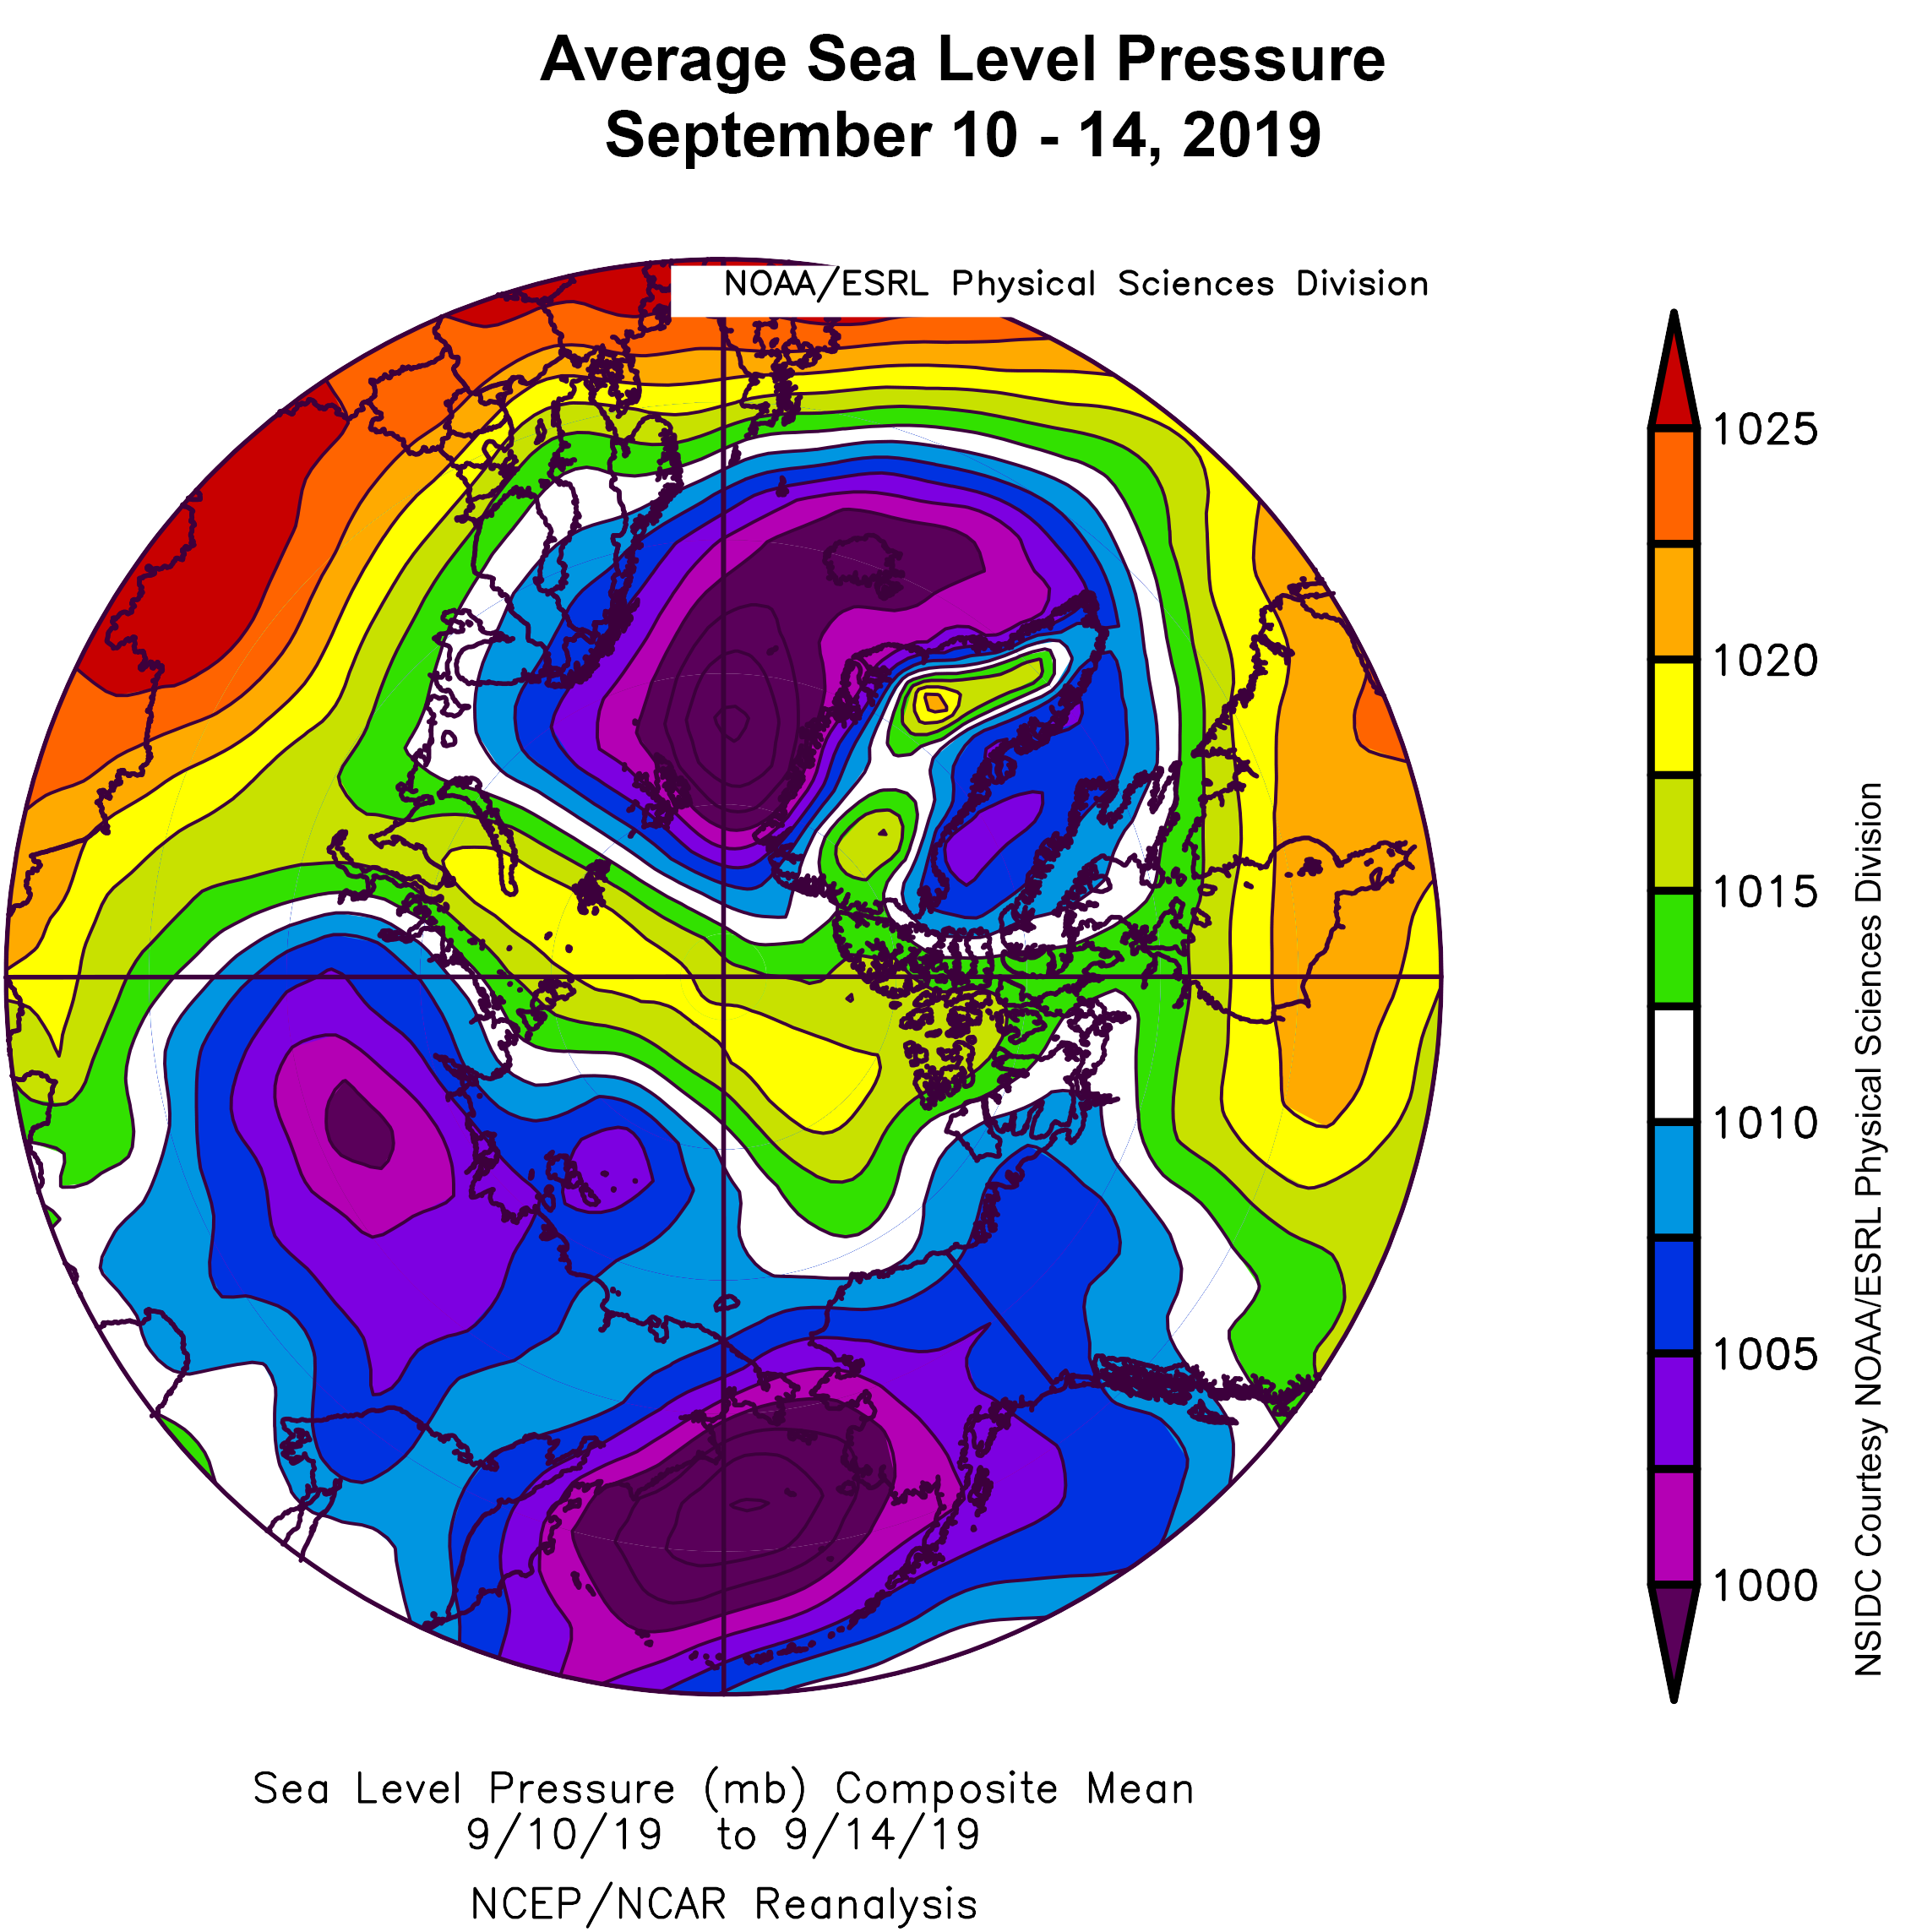
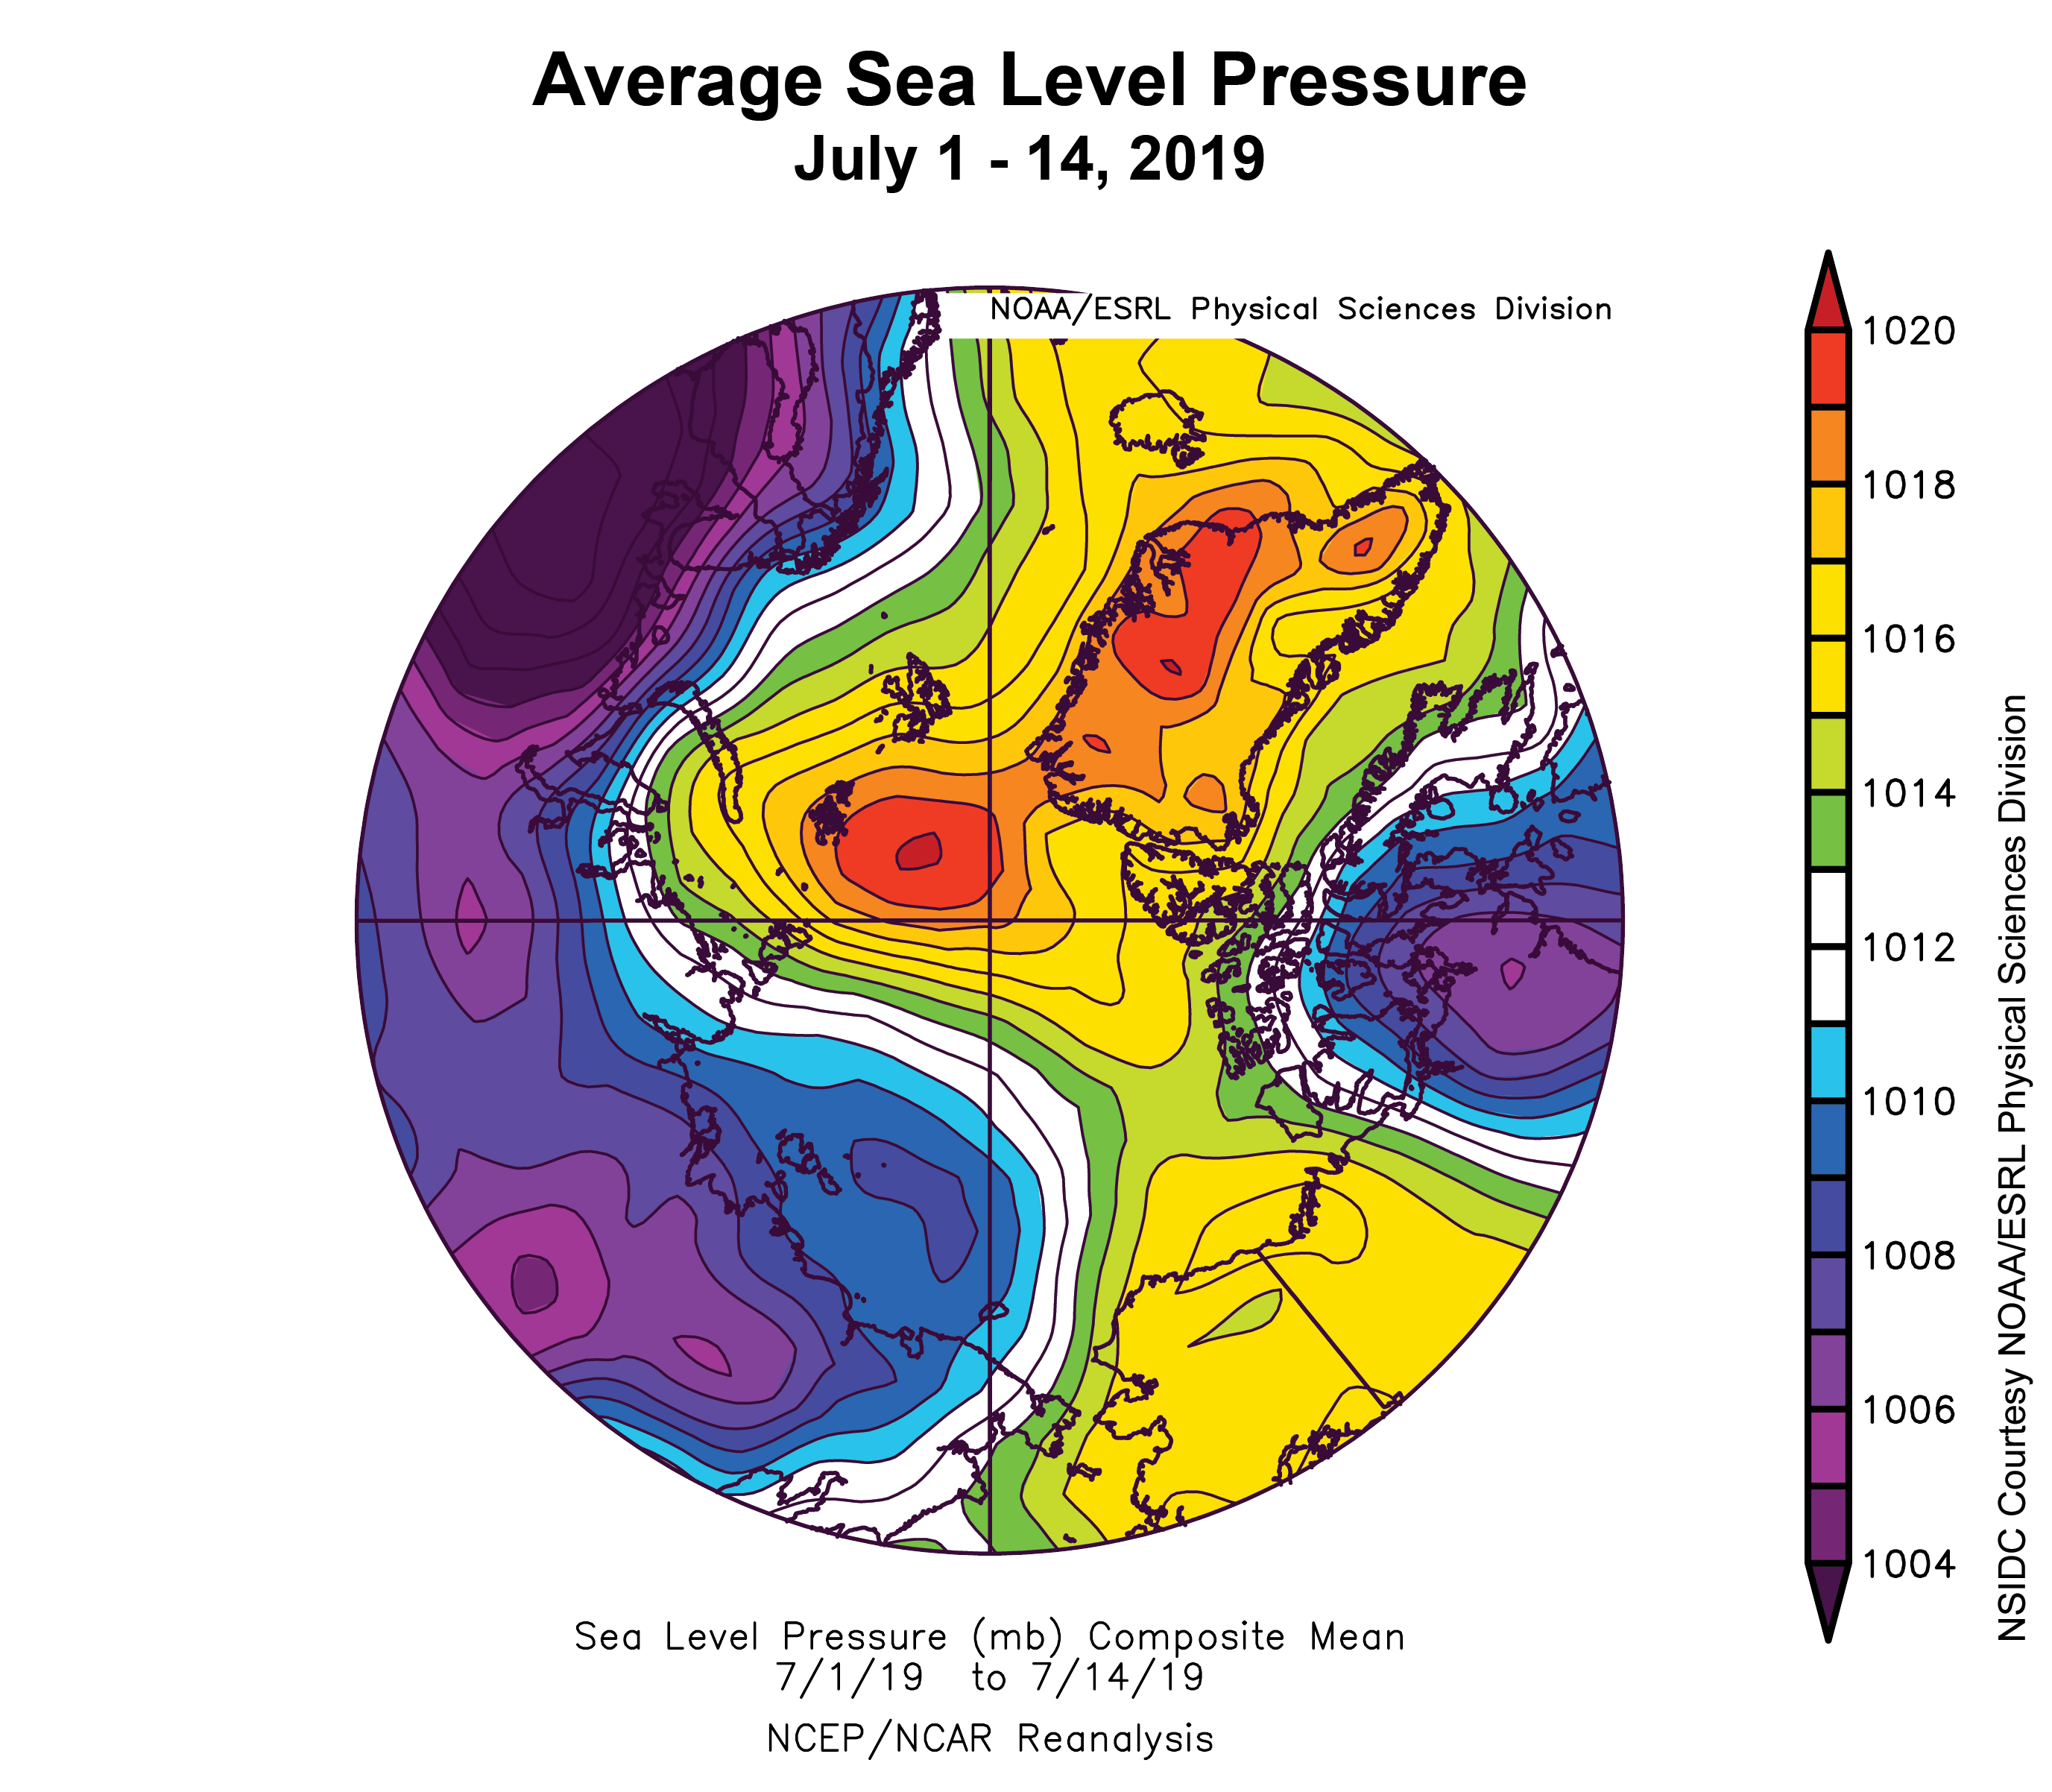
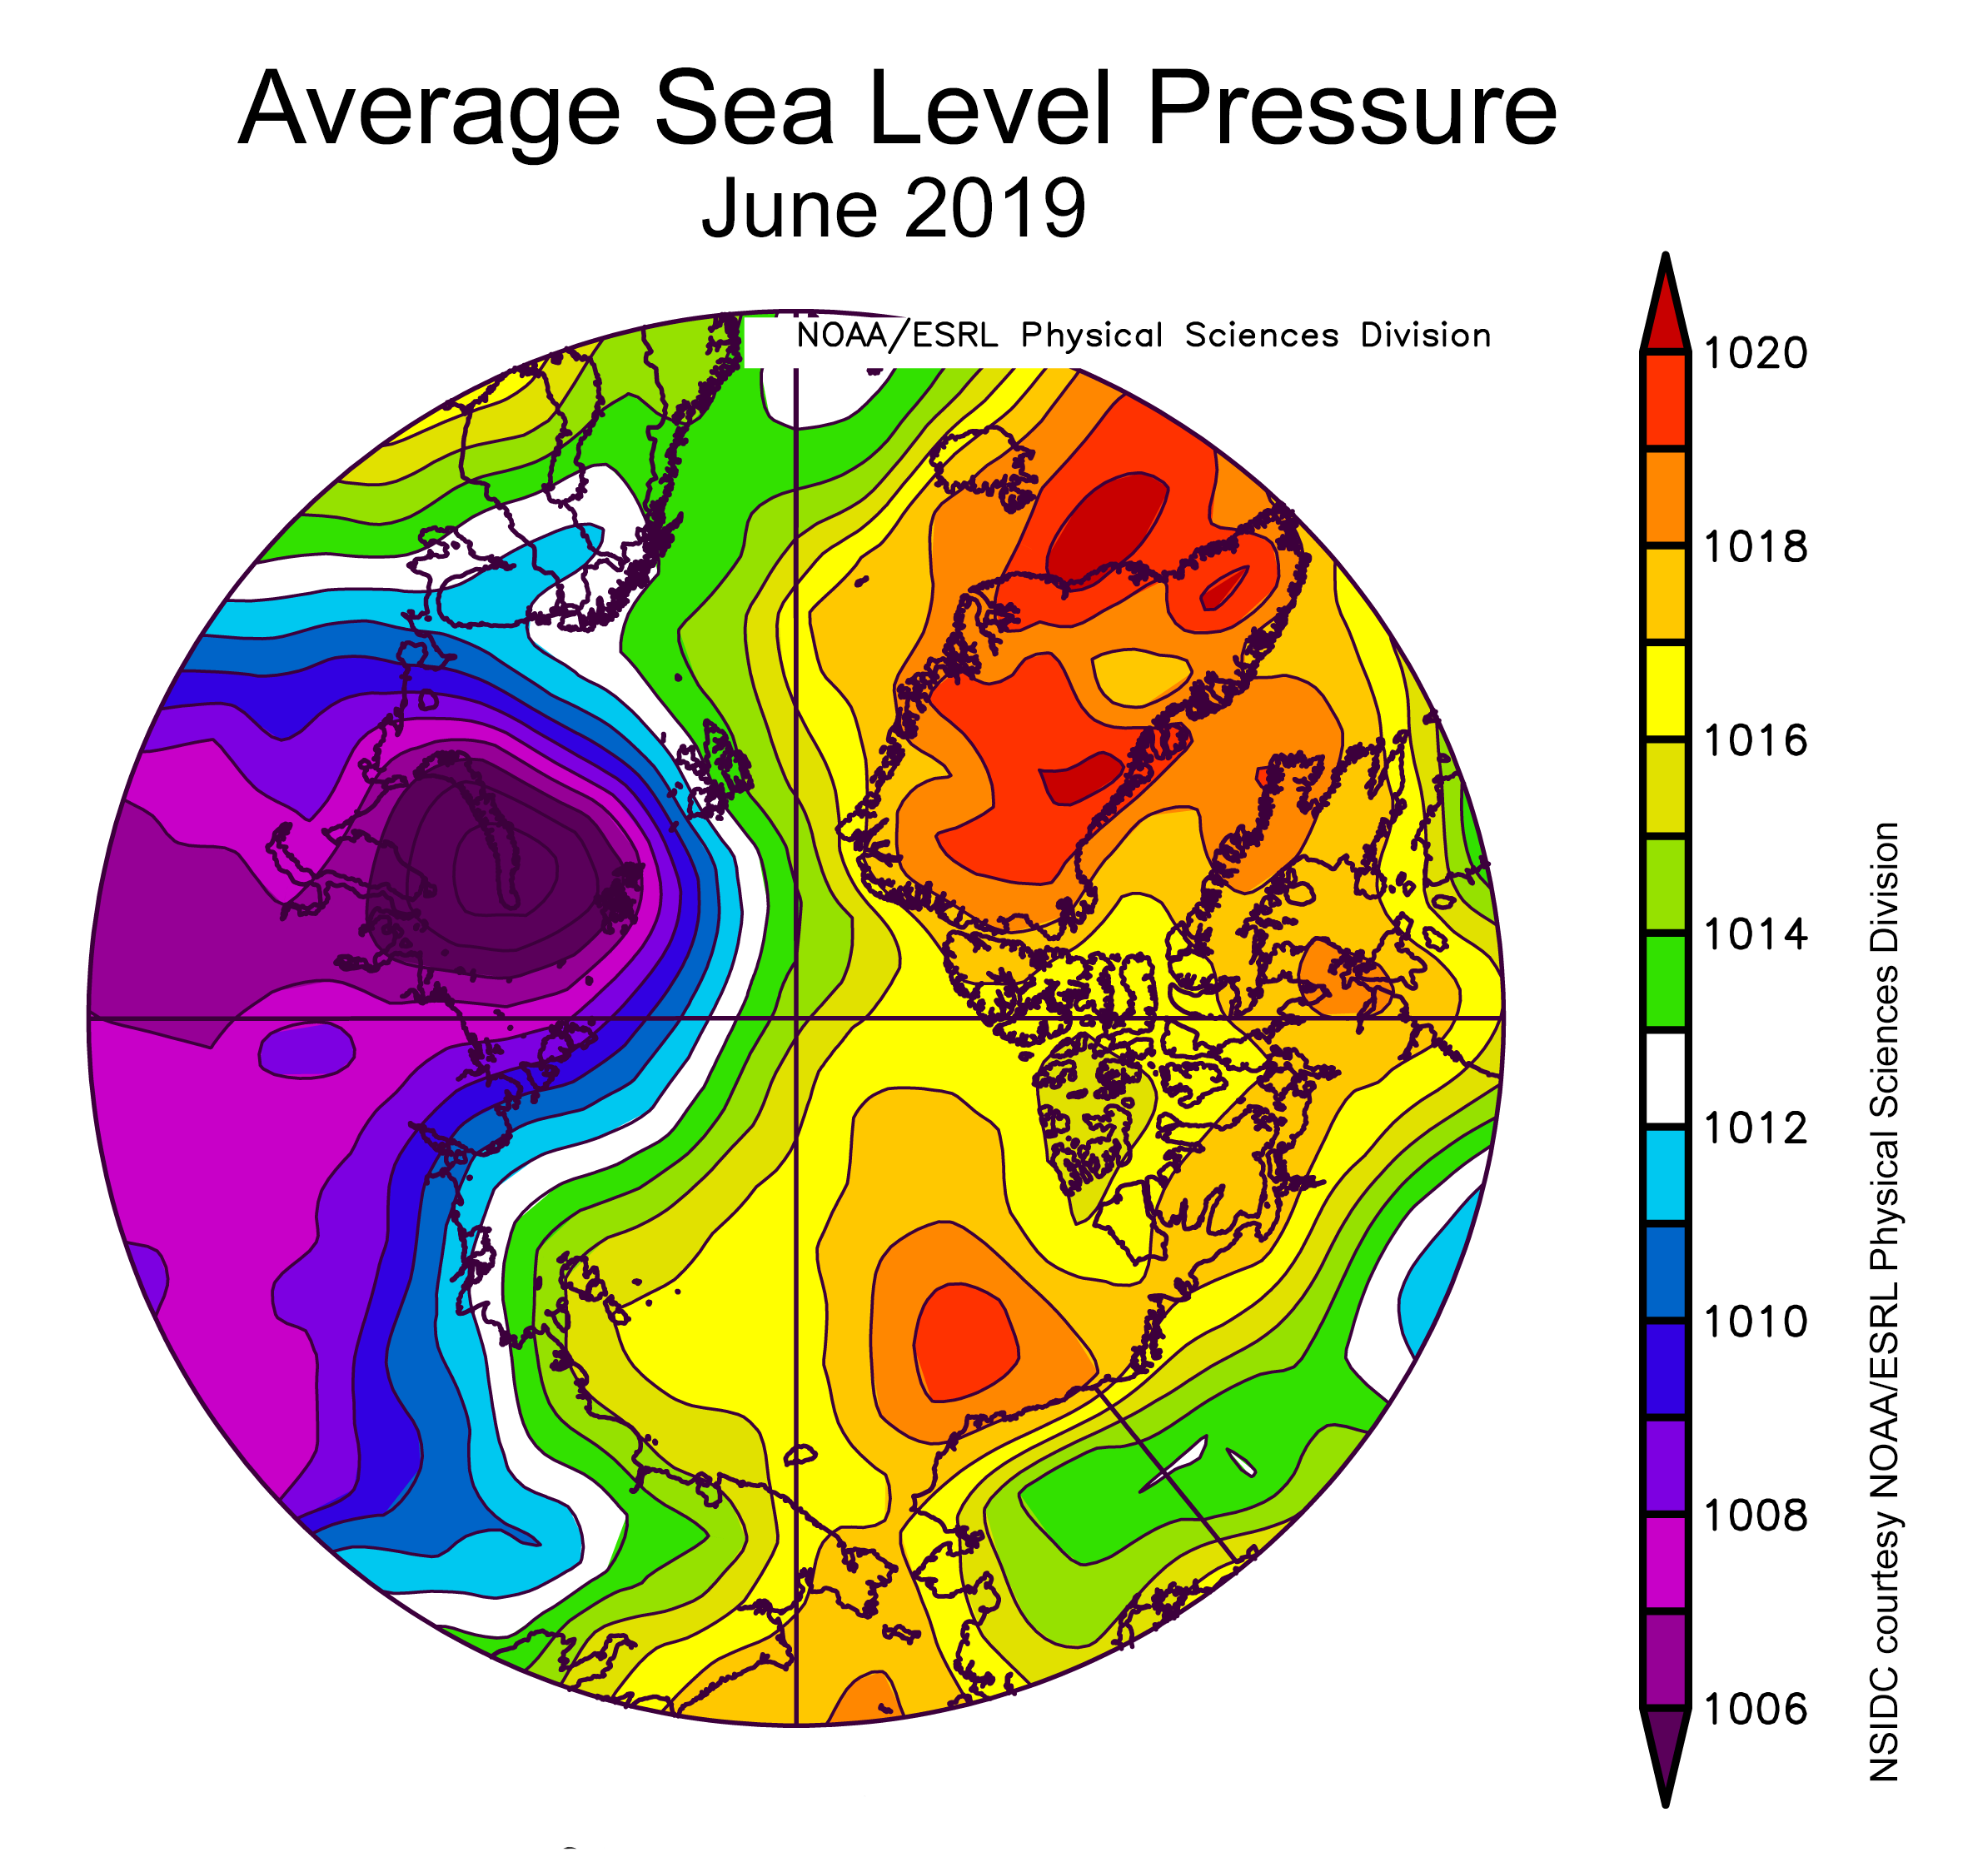
Average November air temperatures at the 925 hPa level (about 2,500 feet above the surface) were 2 to 4 degrees Celsius (4 to 7 degrees Fahrenheit) above average over the East Siberian, Beaufort, and Chukchi Seas, but near average or only slightly above average over the remainder of the Arctic Ocean. It was unusually warm, up to 6 degrees Celsius (11 degrees Fahrenheit) above average, over Greenland (Figure 2b). The warmth over the East Siberian, Chukchi, and Beaufort Seas is consistent with mean low pressure at sea level for the month centered north of East Siberian Sea, drawing in warmth from the south. Above average temperatures over the Chukchi Sea also reflect remaining areas of open water; indeed, at the surface, November temperatures in the Chukchi Sea were 10 to 12 degrees Celsius (18 to 22 degrees Fahrenheit) above average. Such high surface temperatures in this area will remain until the upper ocean losses its remaining heat and ice begins to form.
November 2019 compared to previous years
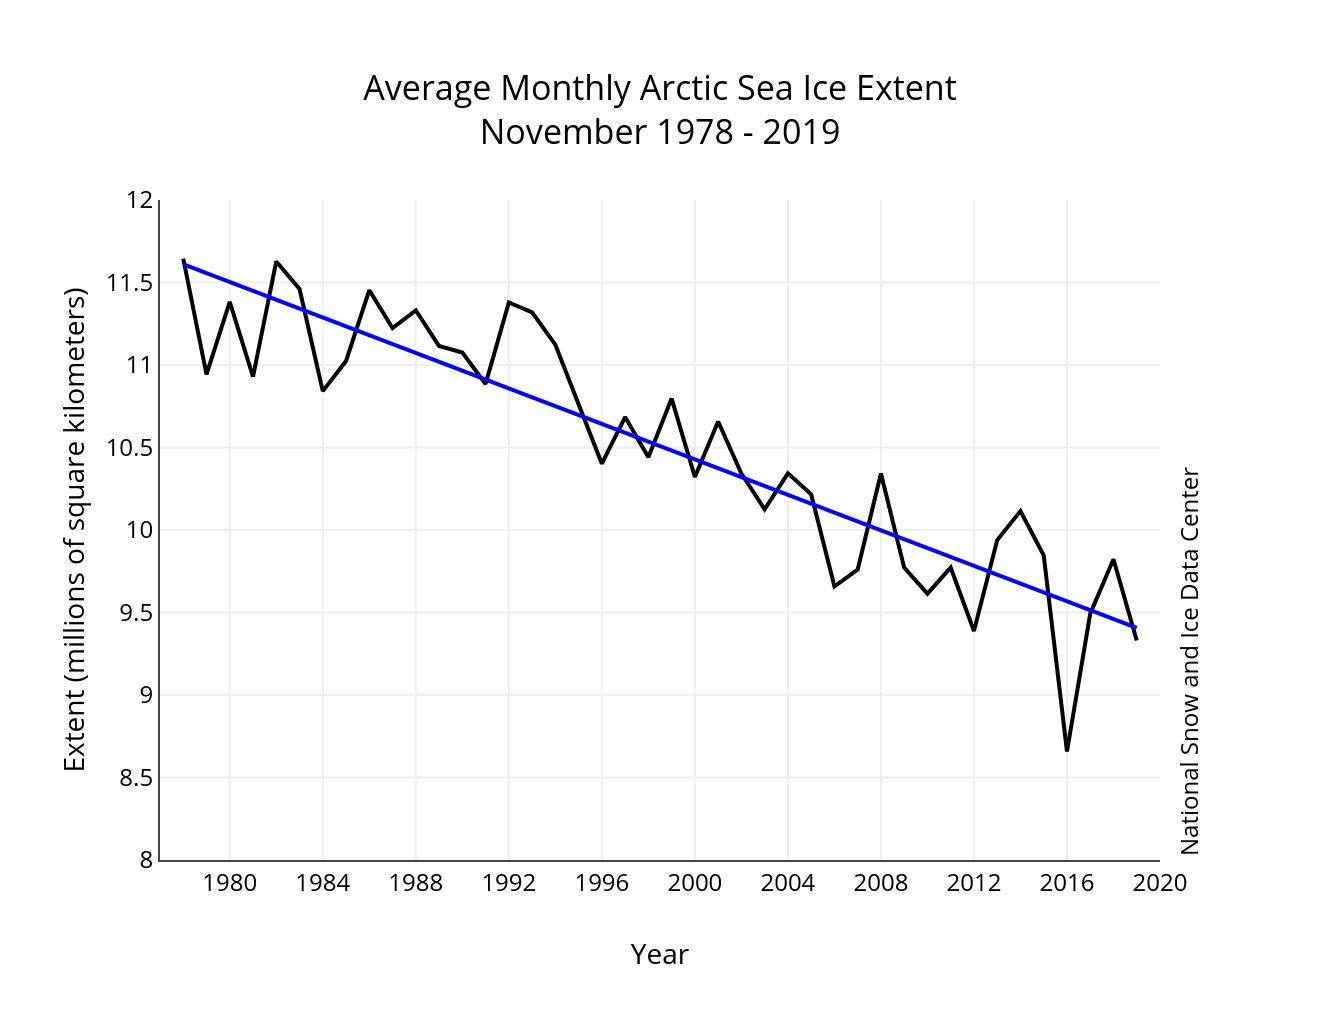
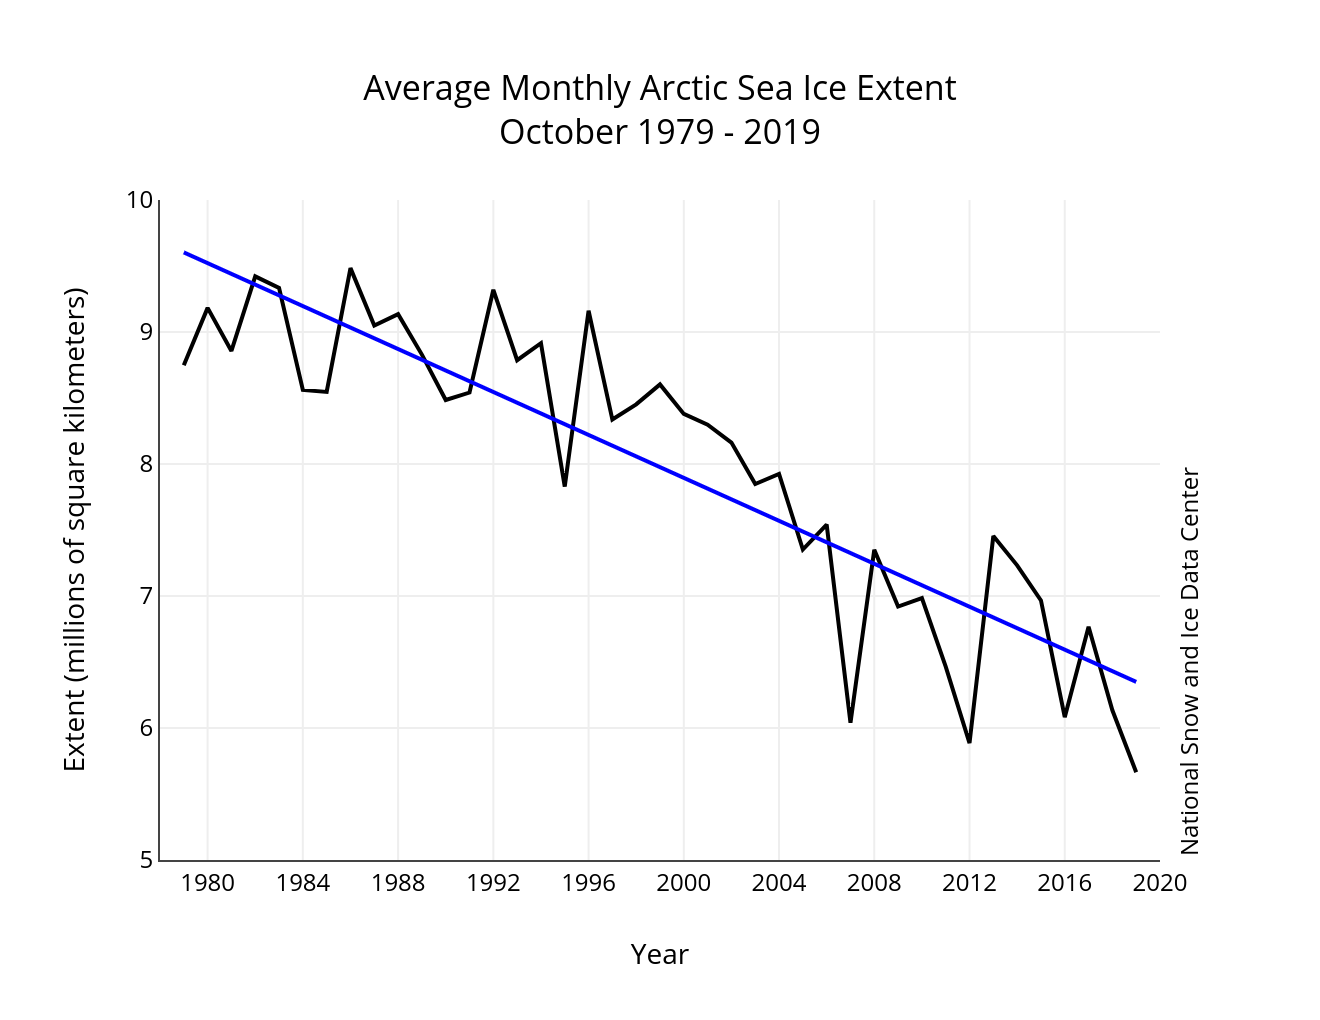
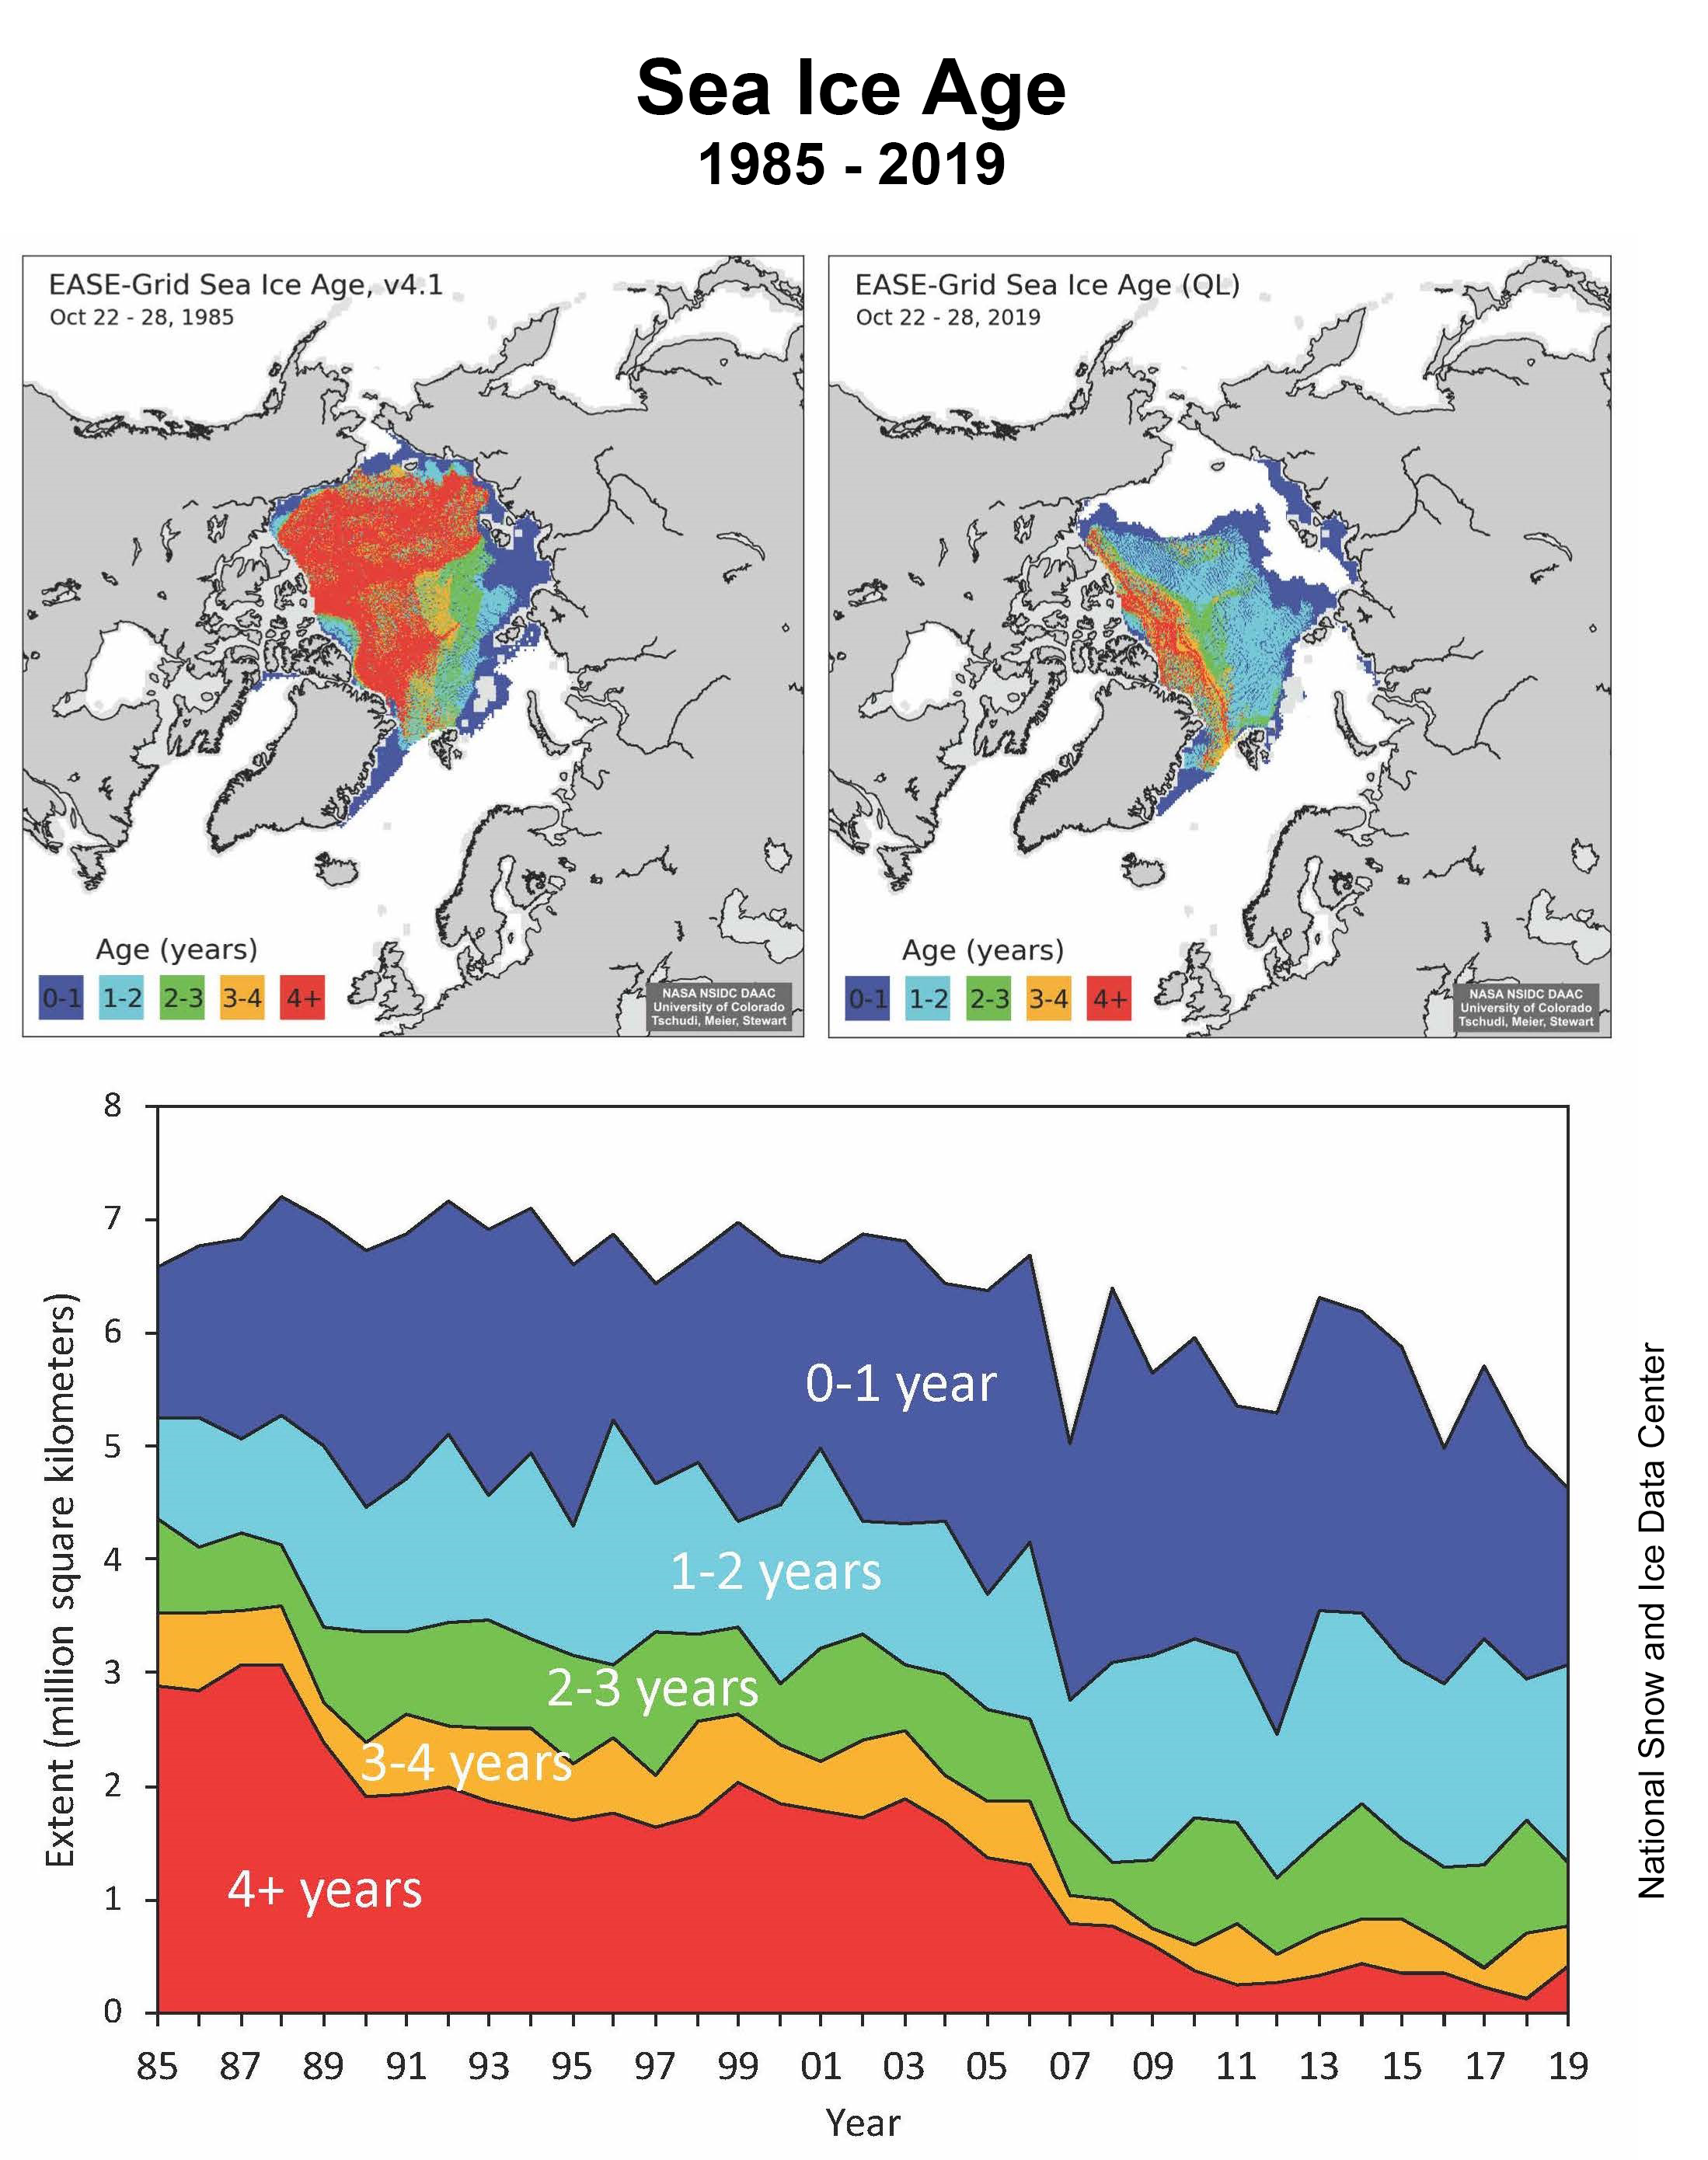
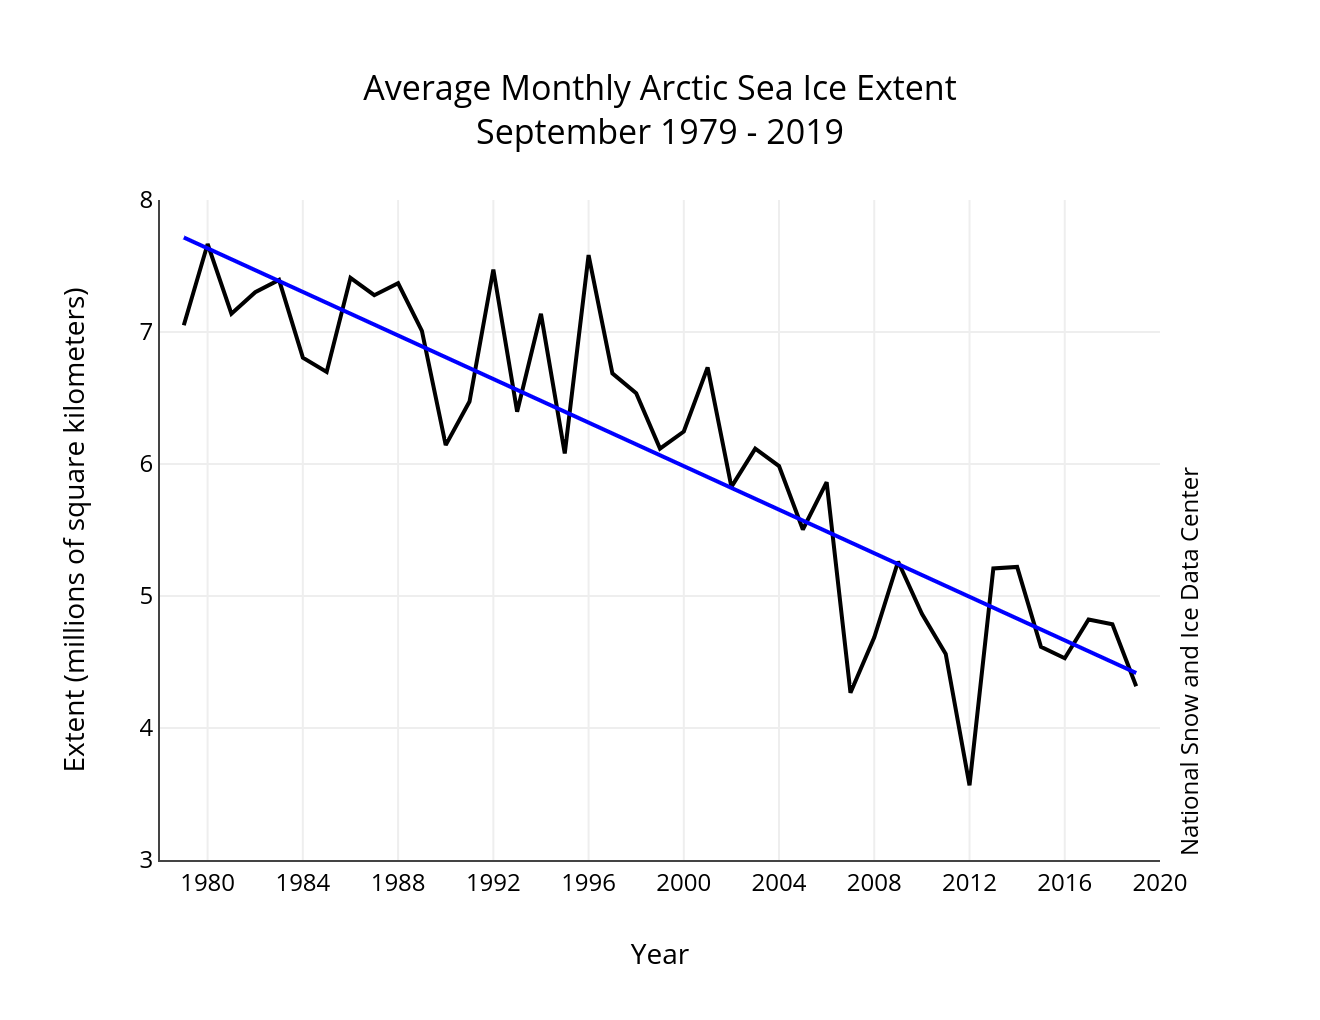
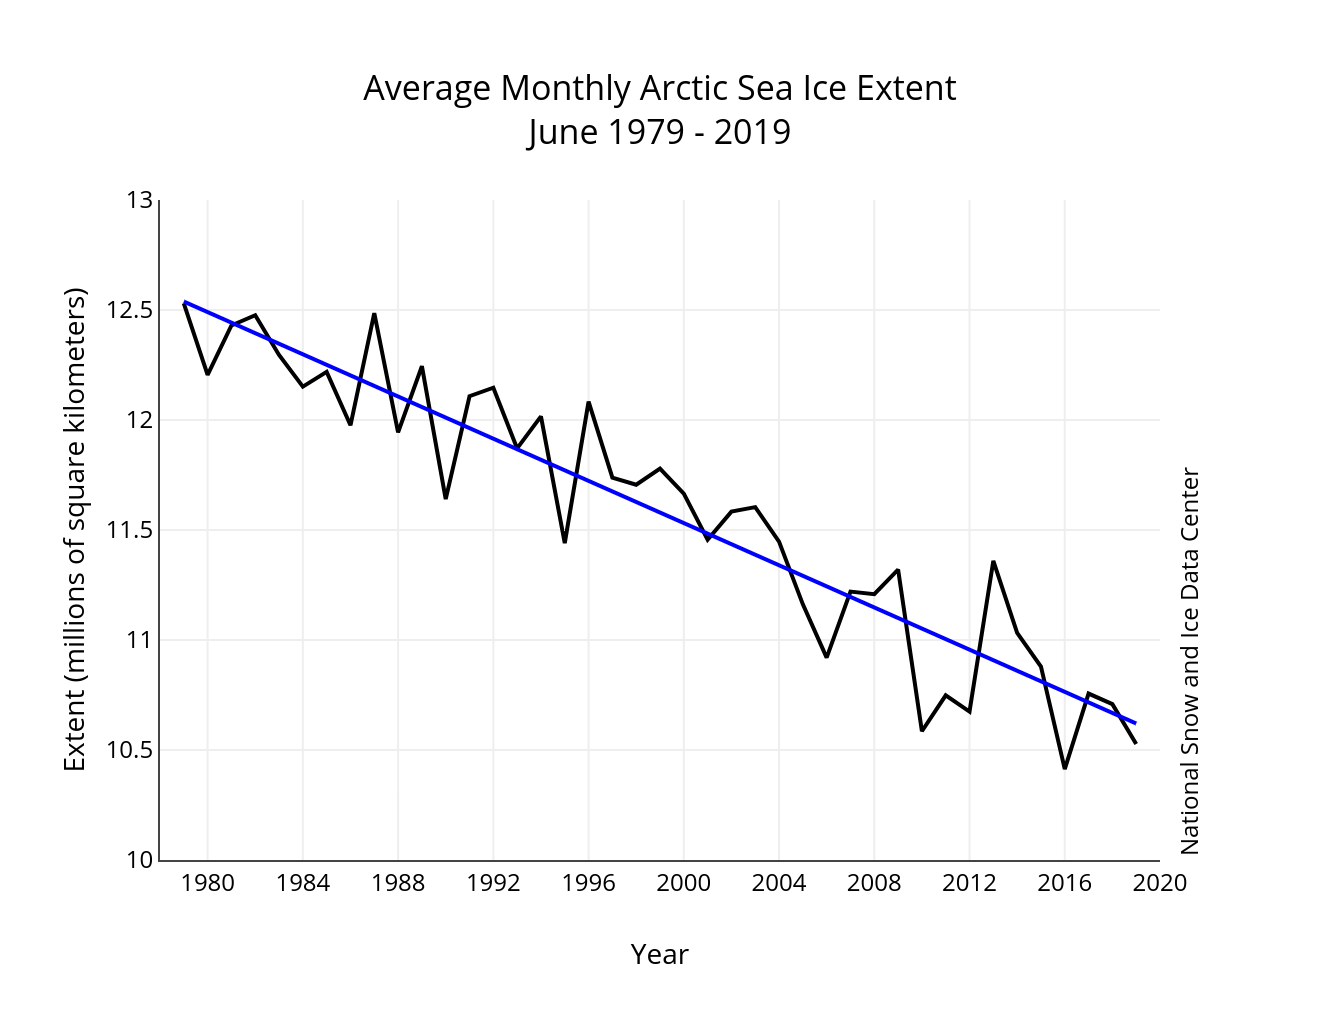
Figure 3. Monthly November ice extent for 1979 to 2019 shows a decline of 5.02 percent per decade.
Credit: National Snow and Ice Data Center
High-resolution image
As assessed over the period of satellite observations, Arctic sea ice extent for November 2019 was 9.33 million square kilometers (3.60 million square miles), the second lowest in the satellite record. The linear rate of sea ice decline for November is 53,800 square kilometers (20,800 square miles) per year, or 5.02 percent per decade relative to the 1981 to 2010 average.
Ocean heat transport through Bering Strait
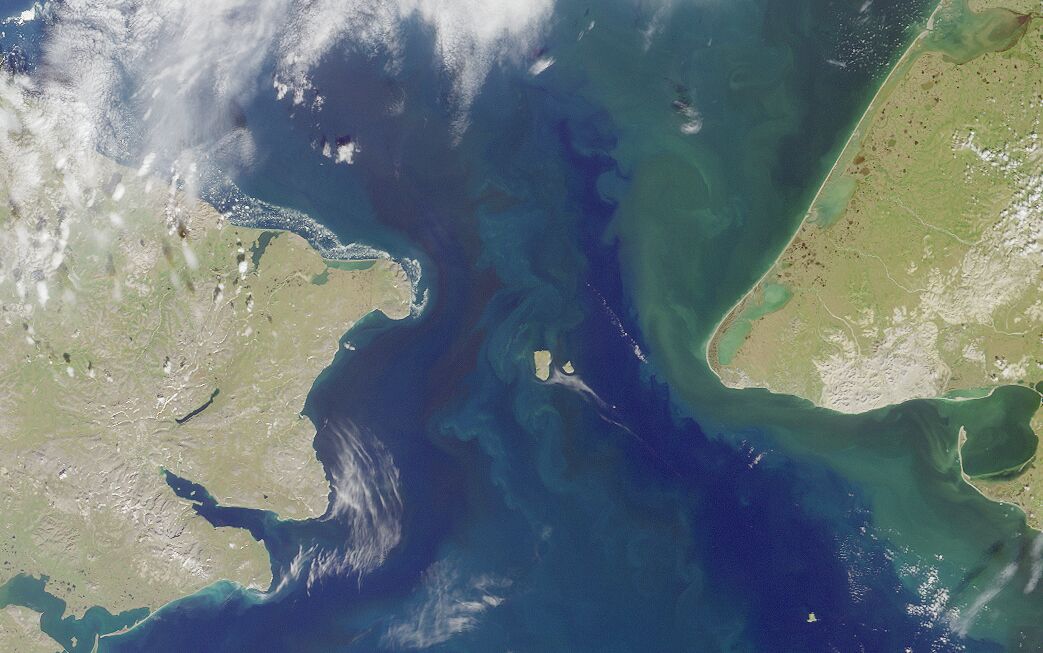
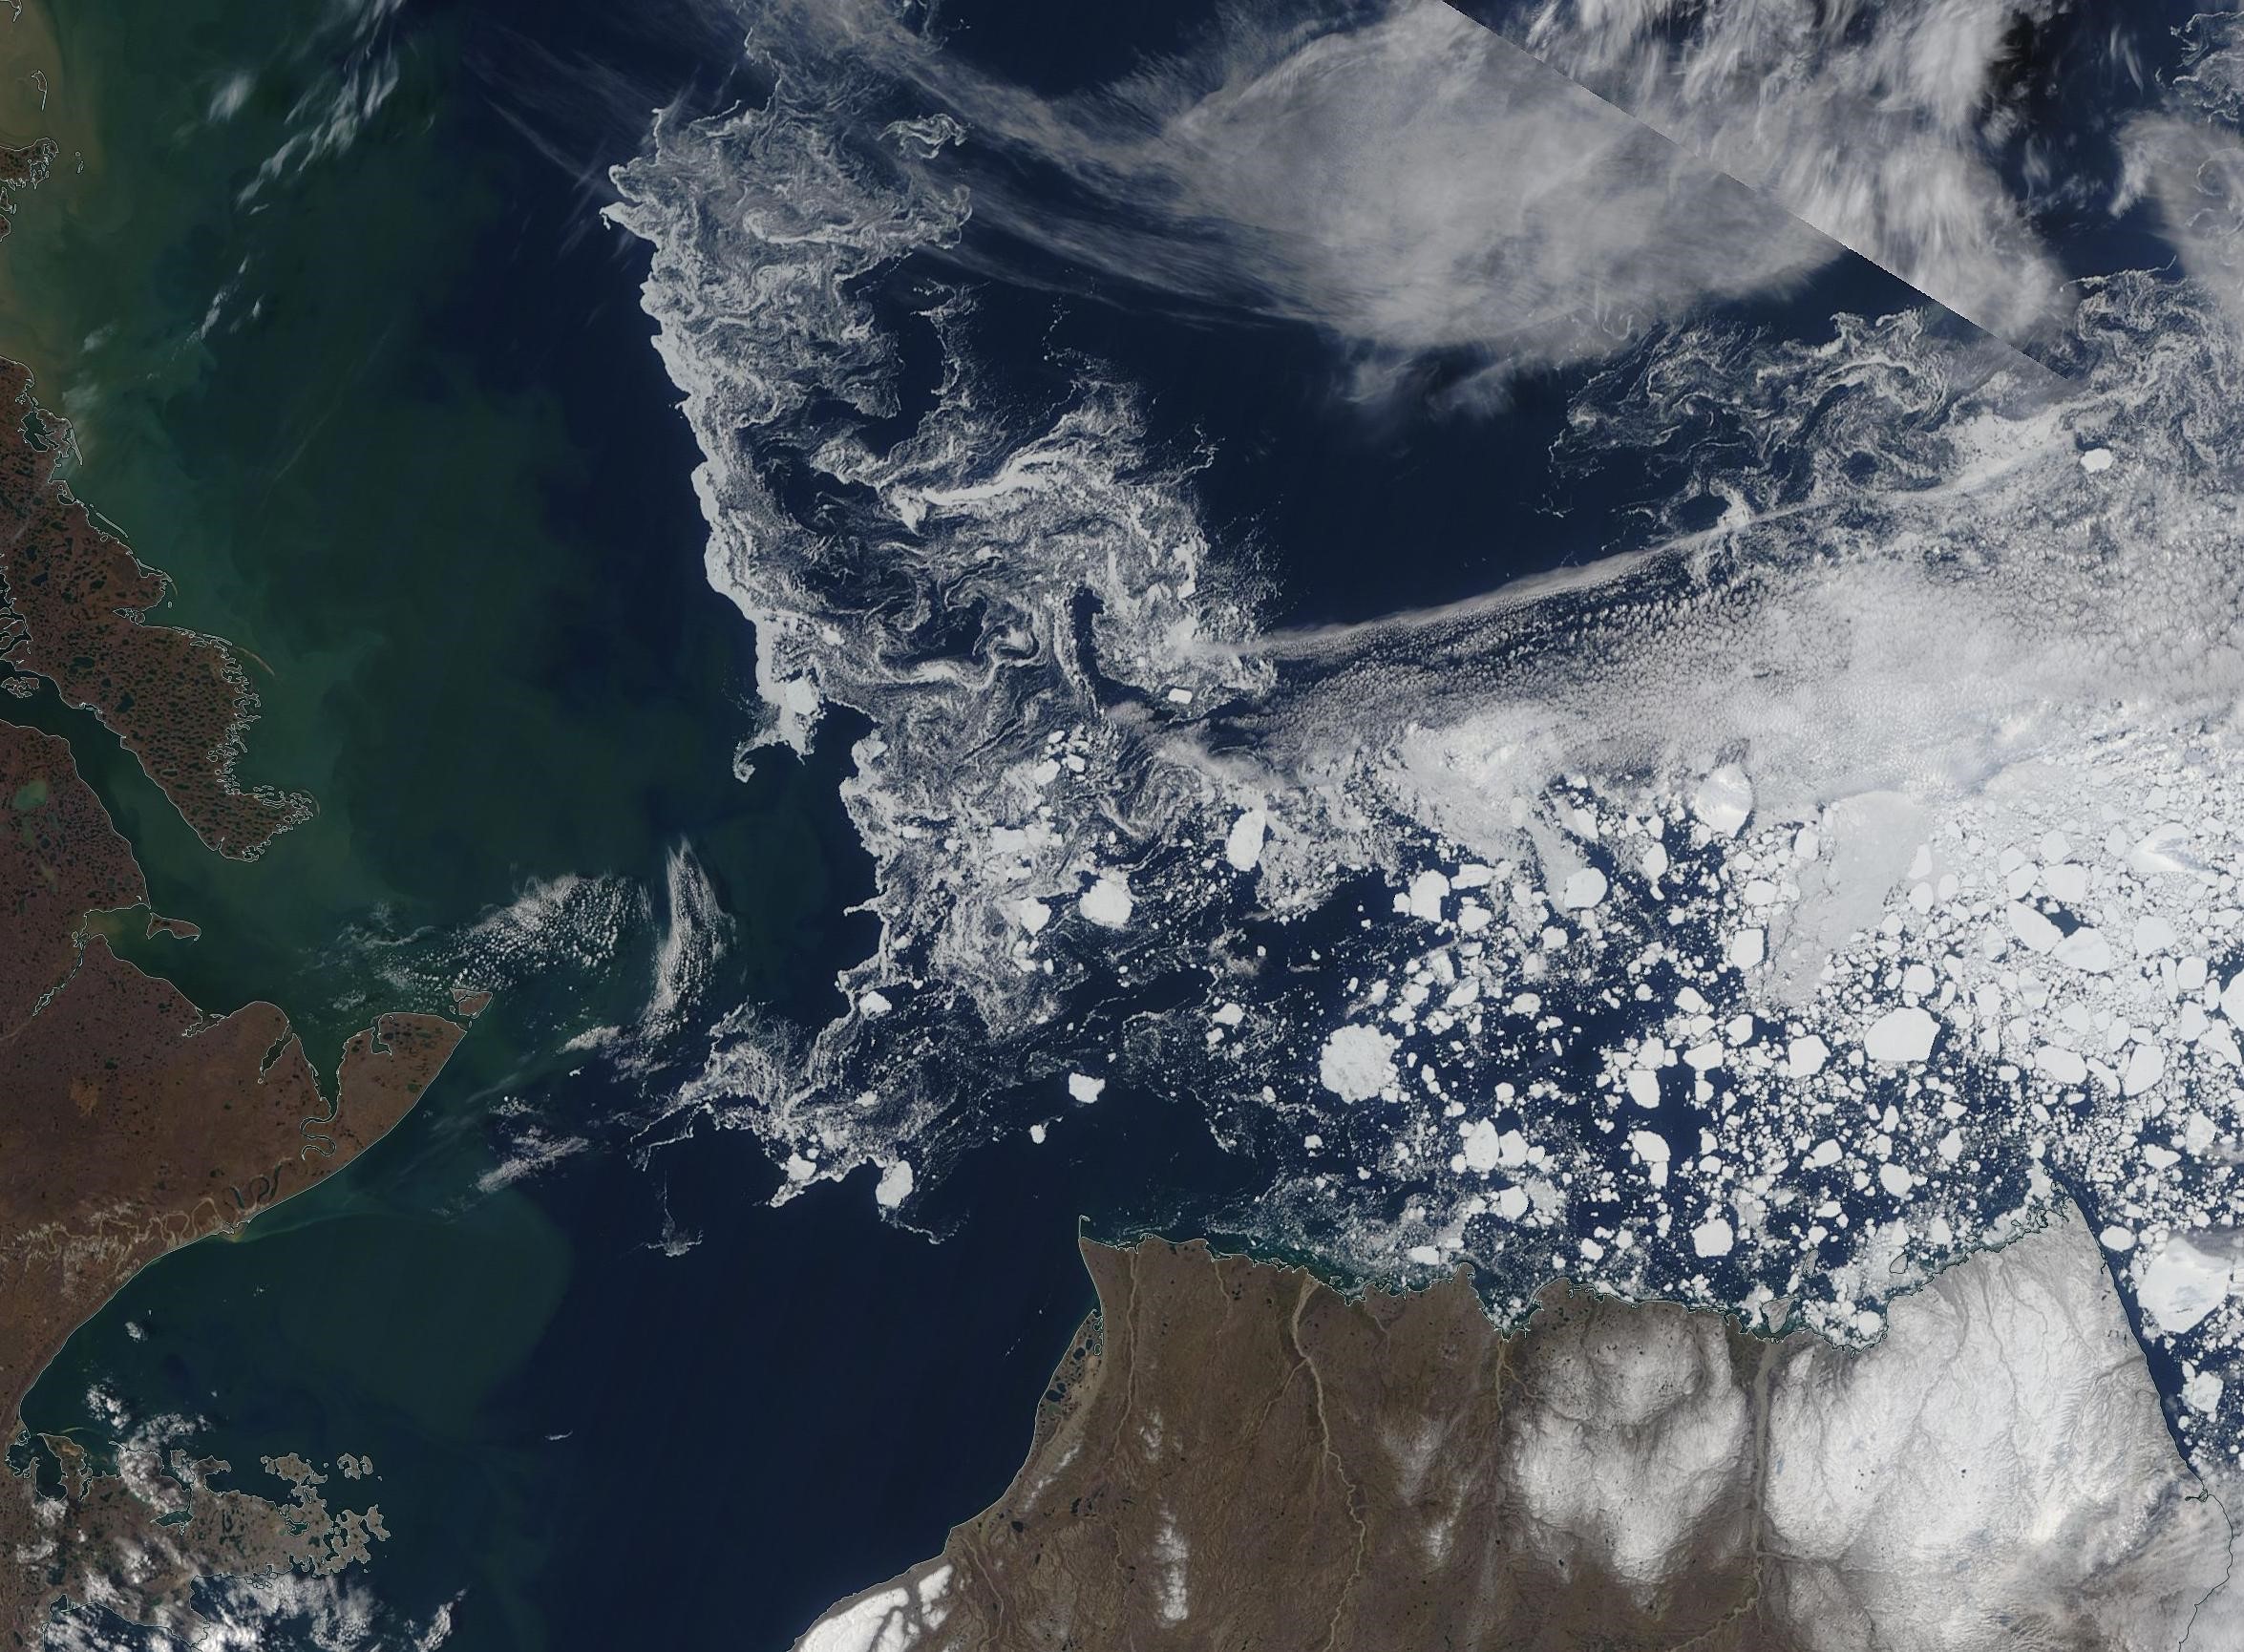
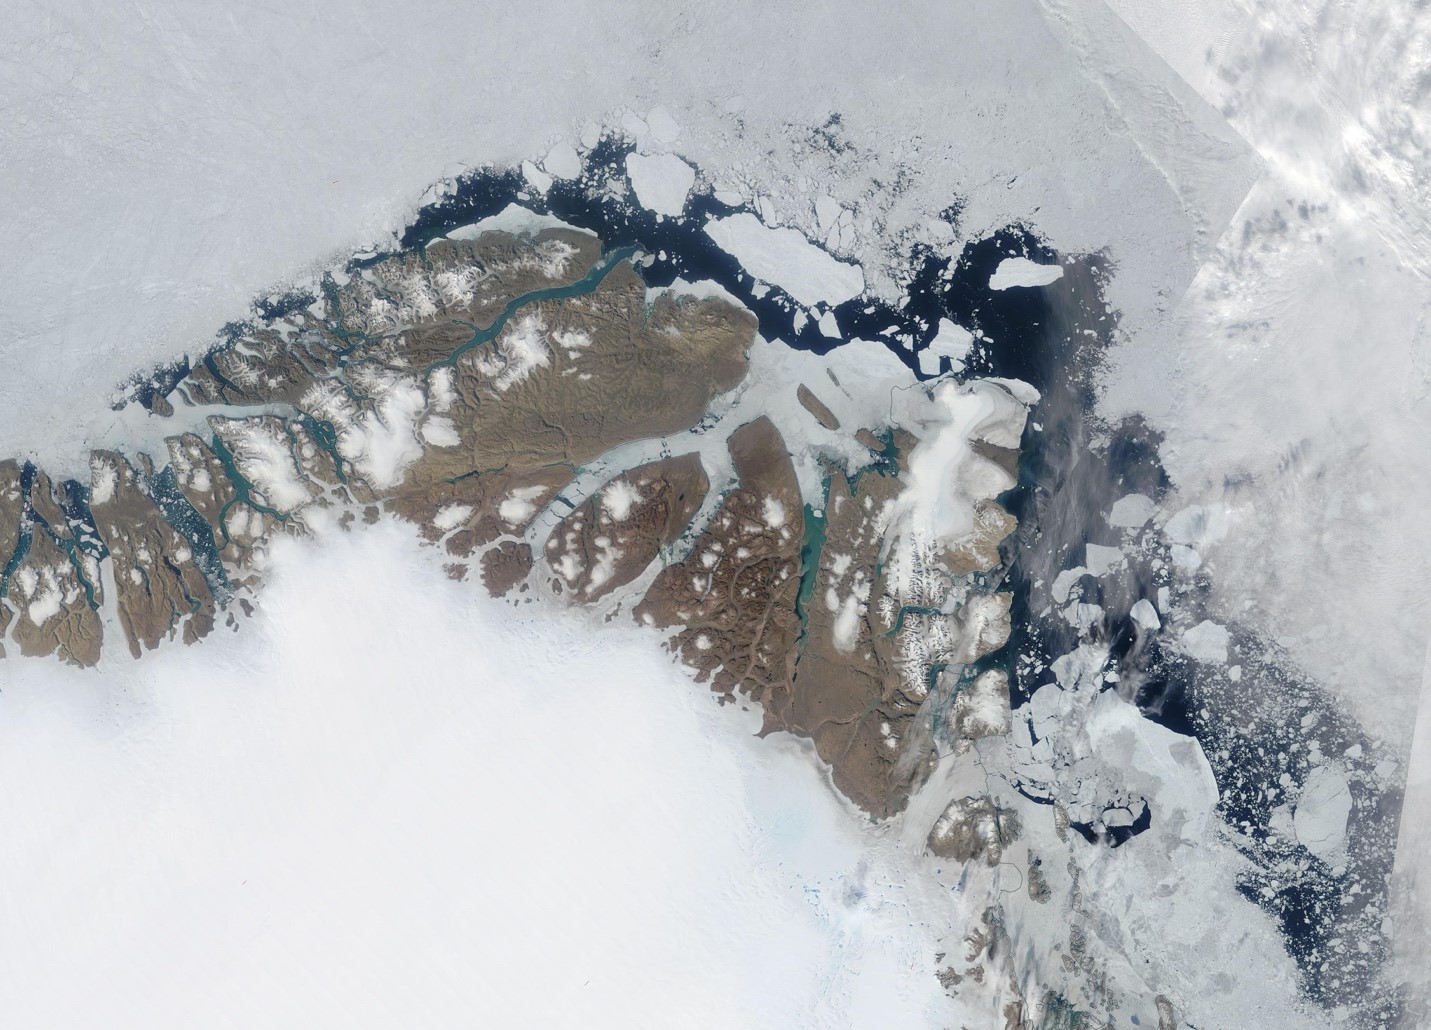
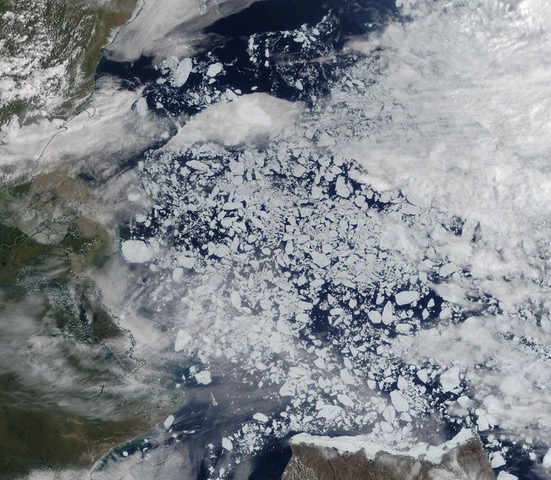
Figure 4. This Terra satellite image uses the multi-angle imaging spectroradiometer (MISR) instrument to visualize the Bering Strait, with the Chukchi Sea to the north. Russia is on the left, Alaska is on the right. The Strait is about 85 kilometers across (53 miles). Warm water from the Pacific Ocean enters the Arctic Ocean via the Bering Strait.
Credit: Wikimedia commons/NASA
High-resolution image
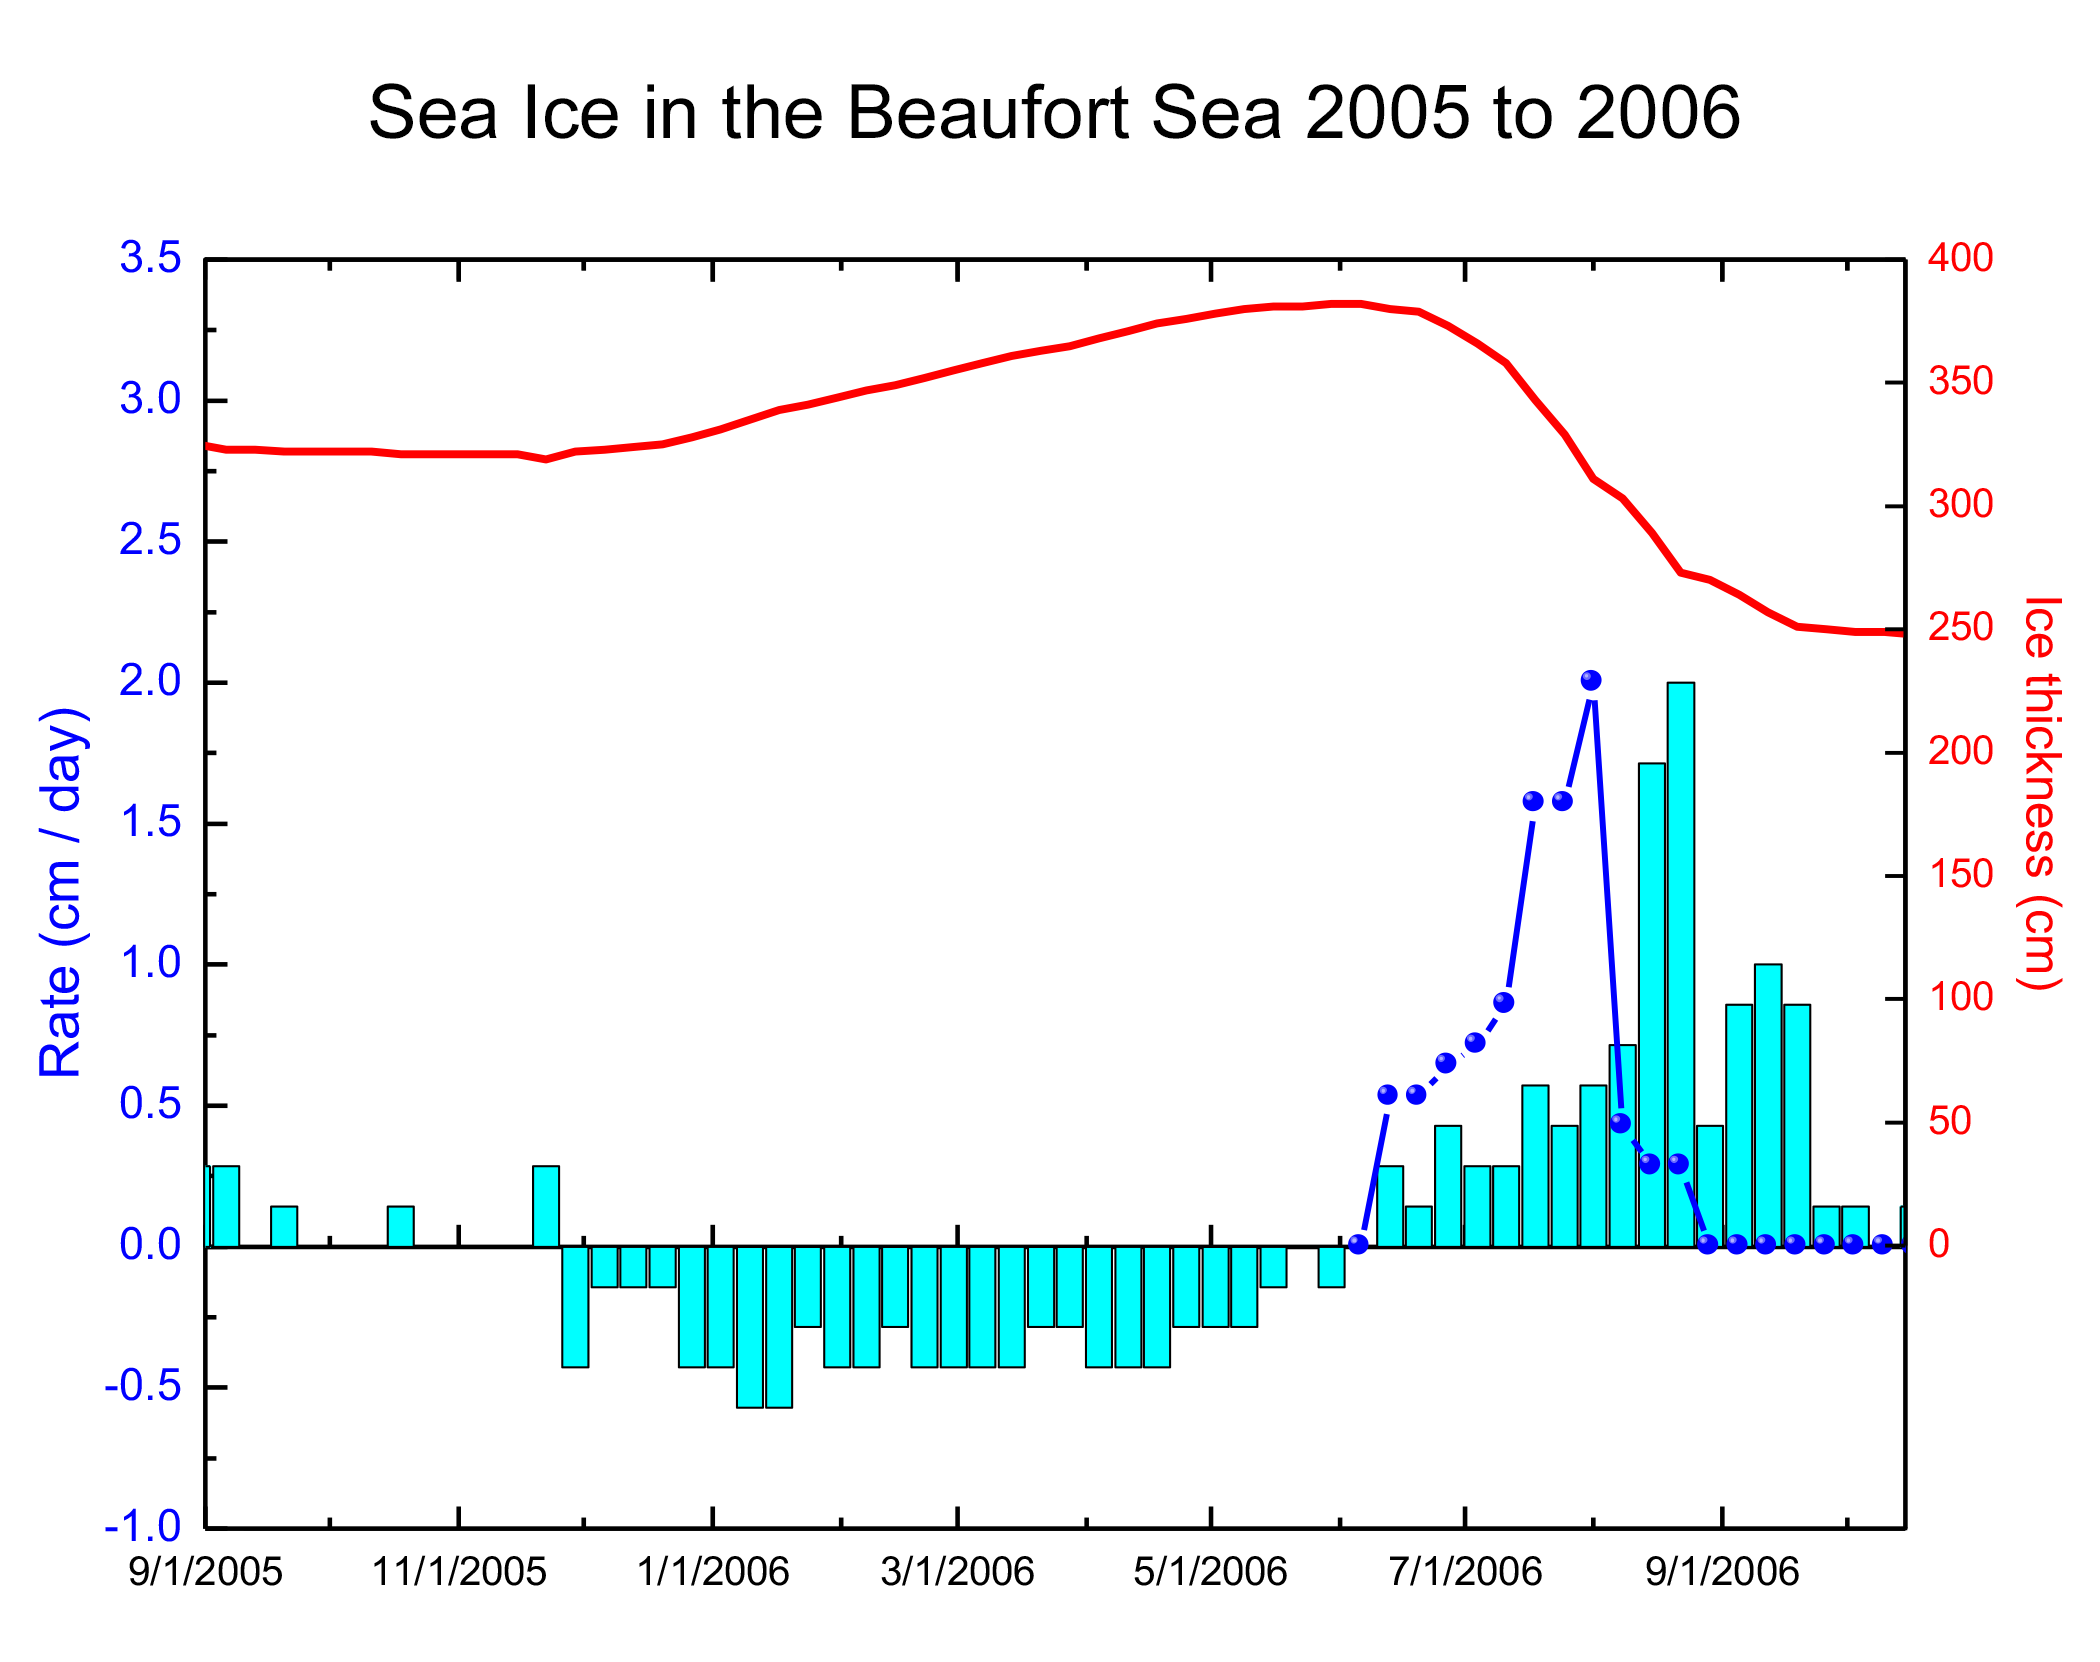
Recent work has shown that the transport of ocean heat into the Chukchi Sea through the Bering Strait strongly influences sea ice conditions in the region (Figure 4). This ocean heat transport, which is monitored by a buoy in the strait, depends on both the volume and temperature of this transported water. Recent work by C. Peralta‐Ferriz and R. Woodgate at the University of Washington in Seattle shows that variability in the volume inflow relates in considerable part to the strength of winds in the East Siberian Sea that act to raise or drop sea level in this area. A follow on paper by NSIDC scientists M. Serreze and A. P. Barrett, along with A. Crawford from Wooster College and R. Woodgate reveals that the winds in the East Siberian Sea that affect the Bering Strait inflow also relate to a broader atmospheric pattern of high versus low pressure over the central Arctic Ocean that influences September sea ice extent for the Arctic as a whole. Some recent large ocean heat transports through the Bering Strait are associated with high water temperatures, consistent with the persistence of open water in the Chukchi Sea into winter and early ice retreat in spring. The stubbornly slow freeze up in the Chukchi Sea this autumn may well reflect the effects of ocean heat transport.
Antarctic sea ice extent tracks the record minimum year
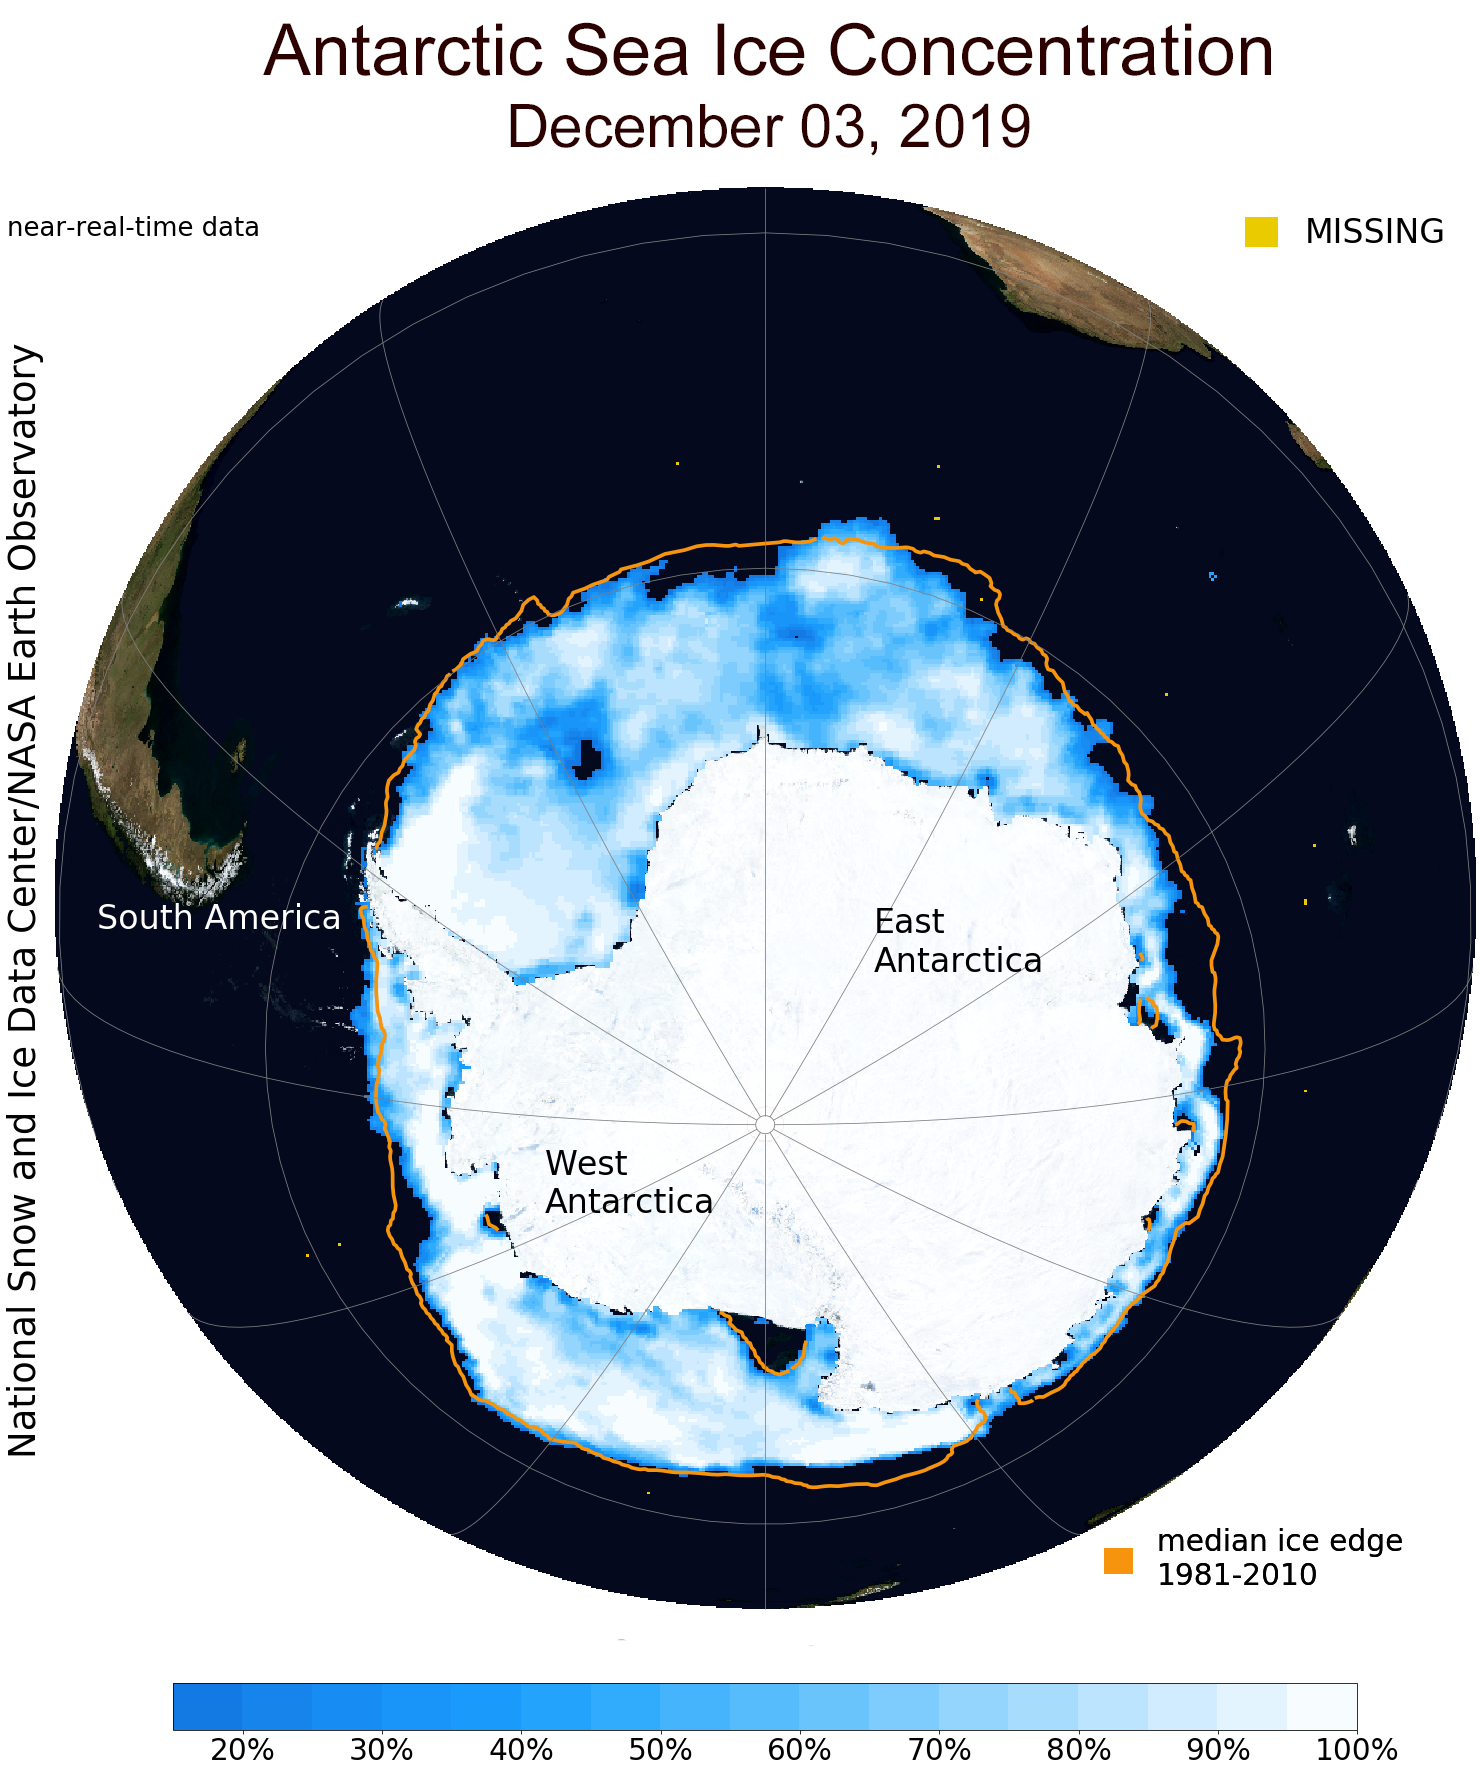
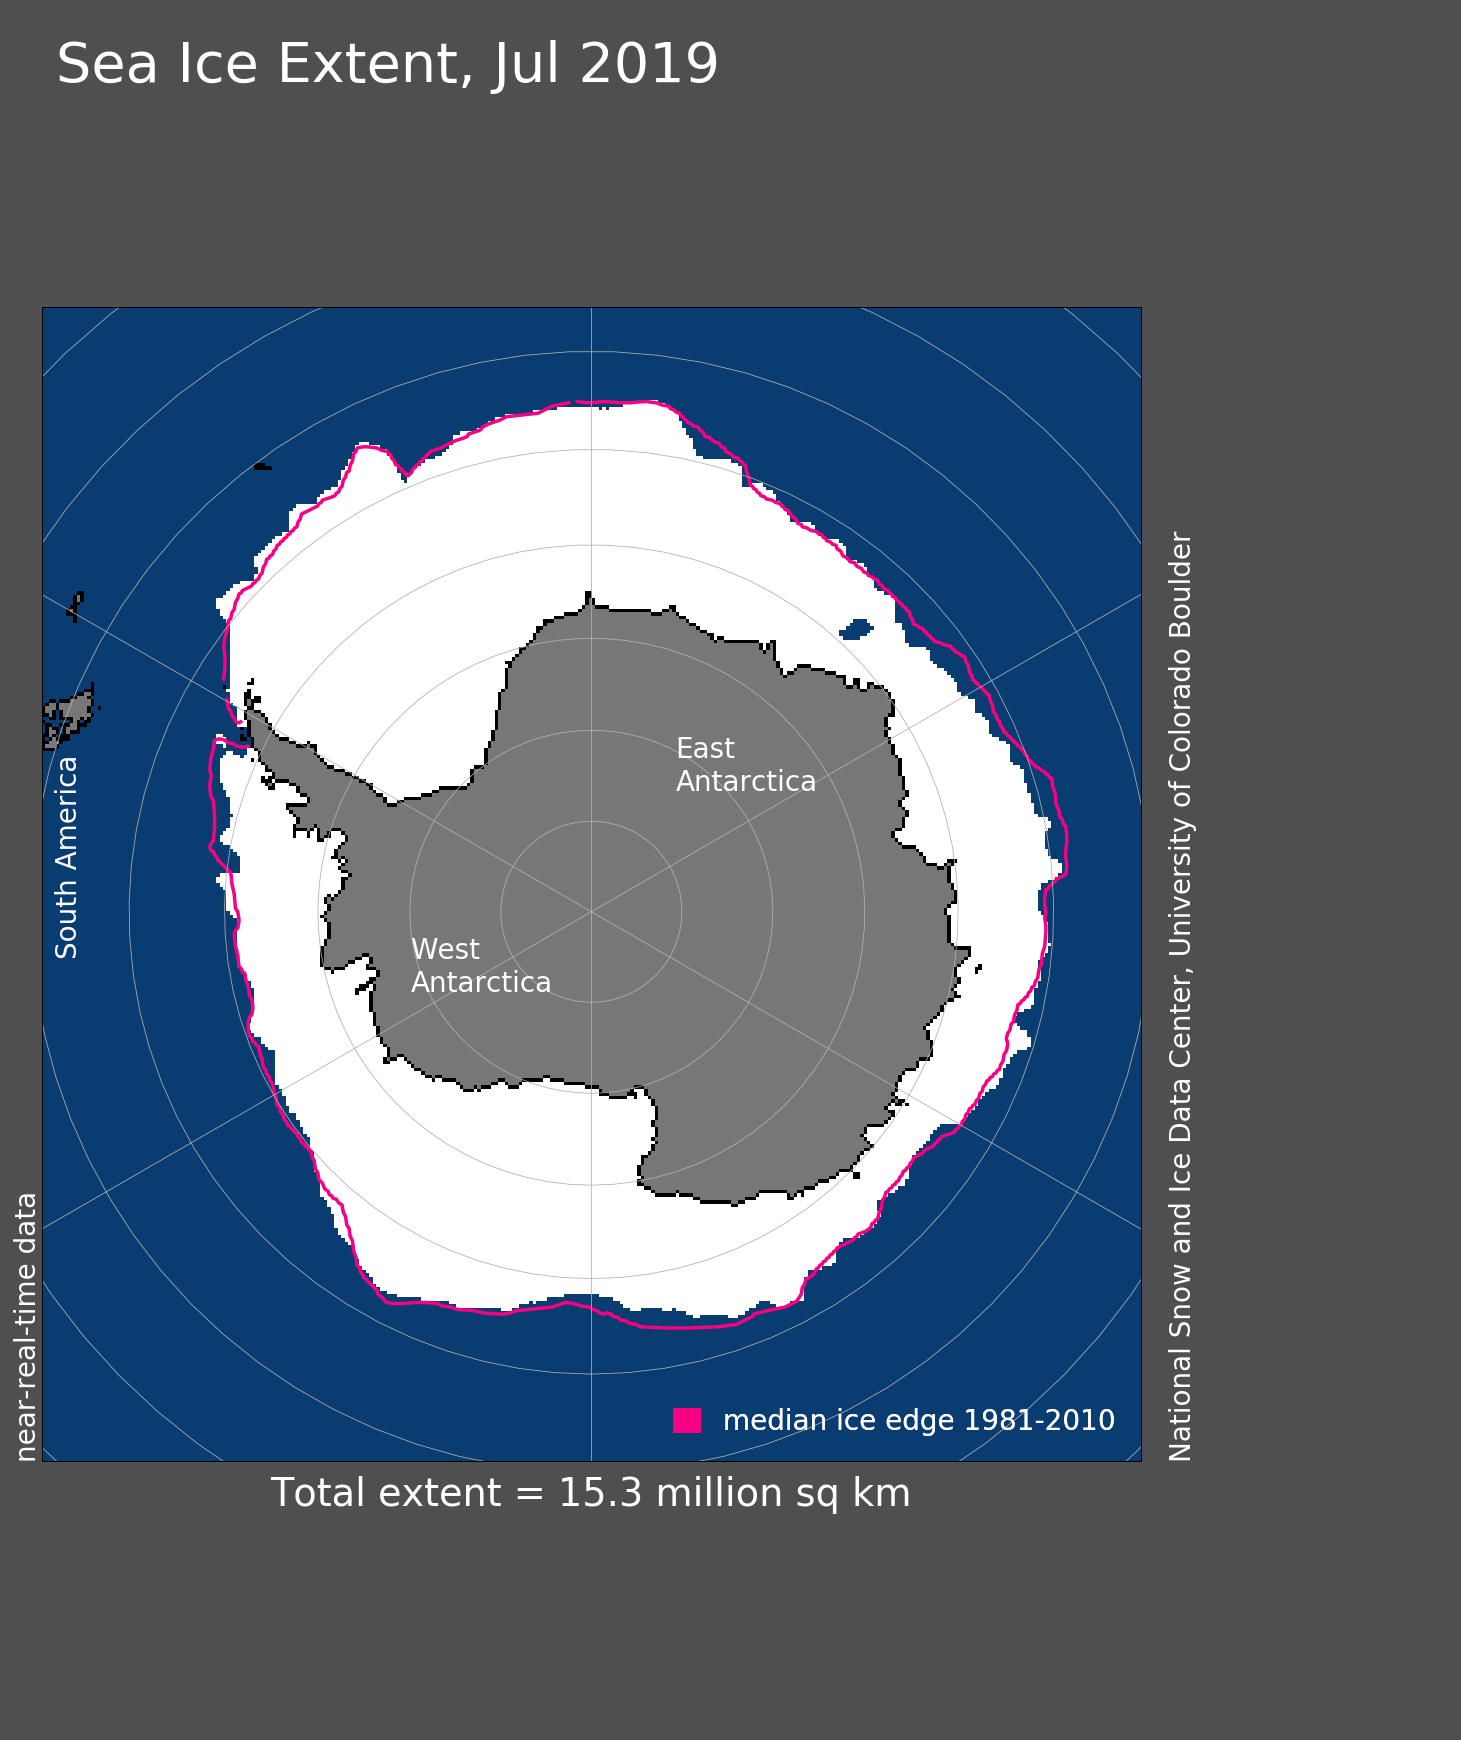
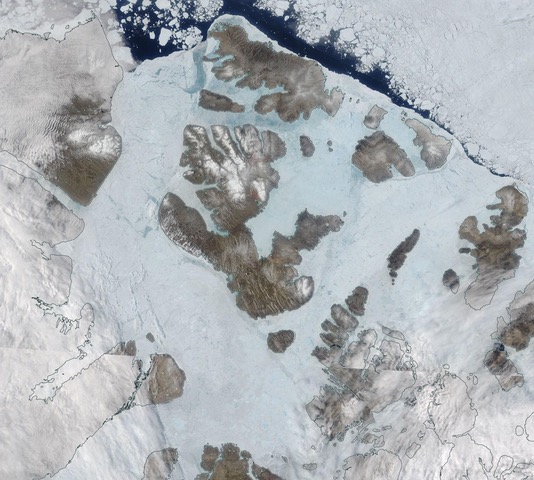
Figure 5. This map shows sea ice concentration surrounding Antarctica on December 3, 2019. White indicates areas of high sea ice concentration; darker blues indicate a decrease in ice concentration.
Credit: NSIDC
High-resolution image
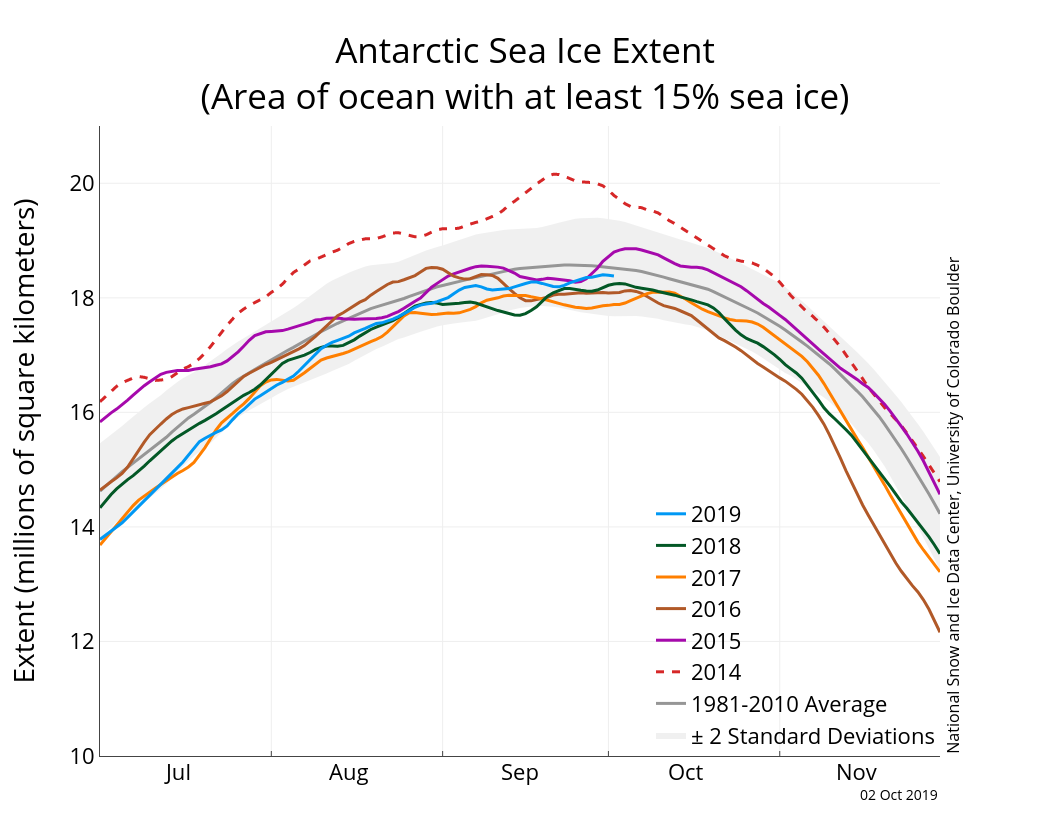
In the Antarctic, sea ice is in the midst of its sharp seasonal decline. It is currently tracking near 2017 levels, the record low year for minimum extent. November extent was 14.89 million square kilometers (5.75 million square miles), which is 1.01 million square kilometers (390,000 square miles) below the 1981 to 2010 average. It is the second lowest November extent in the satellite record, about 670,000 square kilometers (259,000 square miles) above November 2016.
Further reading
Serreze, M. C., A. P. Barrett, A. D. Crawford and R. A. Woodgate. 2019. Monthly variability in Bering Strait oceanic volume and heat transports, links to atmospheric circulation and ocean temperature, and implications for sea ice conditions. Journal of Geophysical Research Oceans, November 11, 2019, doi:10.1029/2019JC015422.


