On September 18, Arctic sea ice reached its likely minimum extent for 2019. The minimum ice extent was effectively tied for second lowest in the satellite record, along with 2007 and 2016, reinforcing the long-term downward trend in Arctic ice extent. Sea ice extent will now begin its seasonal increase through autumn and winter.
Please note that this is a preliminary announcement. Changing winds or late-season melt could still reduce the Arctic ice extent, as happened in 2005 and 2010. NSIDC scientists will release a full analysis of the Arctic melt season, and discuss the Antarctic winter sea ice growth, in early October.
Overview of conditions
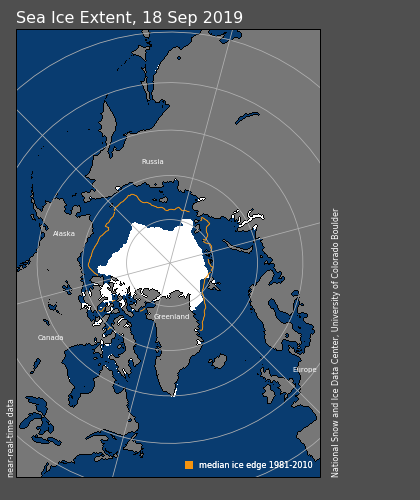
Figure 1. Arctic sea ice extent for September 18, 2019 was 4.15 million square kilometers (1.60 million square miles). The orange line shows the 1981 to 2010 average extent for that day. Sea Ice Index data. About the data
Credit: National Snow and Ice Data Center
High-resolution image
On September 18, 2019, sea ice extent dropped to 4.15 million square kilometers (1.60 million square miles), effectively tied for the second lowest minimum in the satellite record along with 2007 and 2016. This appears to be the lowest extent of the year. In response to the setting sun and falling temperatures, ice extent will begin increasing through autumn and winter. However, a shift in wind patterns or a period of late season melt could still push the ice extent lower.
The minimum extent was reached four days later than the 1981 to 2010 median minimum date of September 14. The interquartile range of minimum dates is September 11 to September 19.
This year’s minimum extent was effectively tied with 2007 and 2016 for second lowest, only behind 2012, which is the record minimum. The 13 lowest extents in the satellite era have all occurred in the last 13 years.
Conditions in context
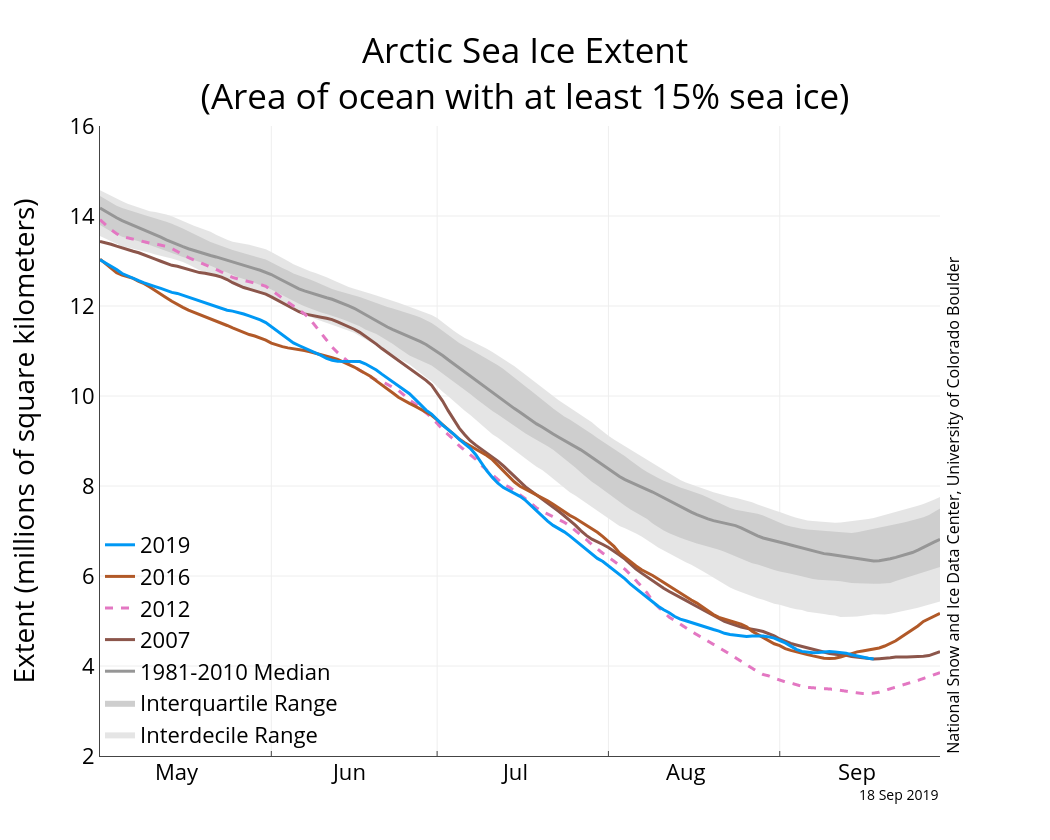
Figure 2a. The graph above shows Arctic sea ice extent on September 18, 2019, along with 2007 and 2016—the years tied for second lowest minimum—and the record minimum for 2012. 2019 is shown in blue, 2016 in light brown, 2012 in dotted pink, and 2007 in dark brown. The 1981 to 2010 median is in dark gray. The gray areas around the median line show the interquartile and interdecile ranges of the data. Sea Ice Index data.
Credit: National Snow and Ice Data Center
High-resolution image
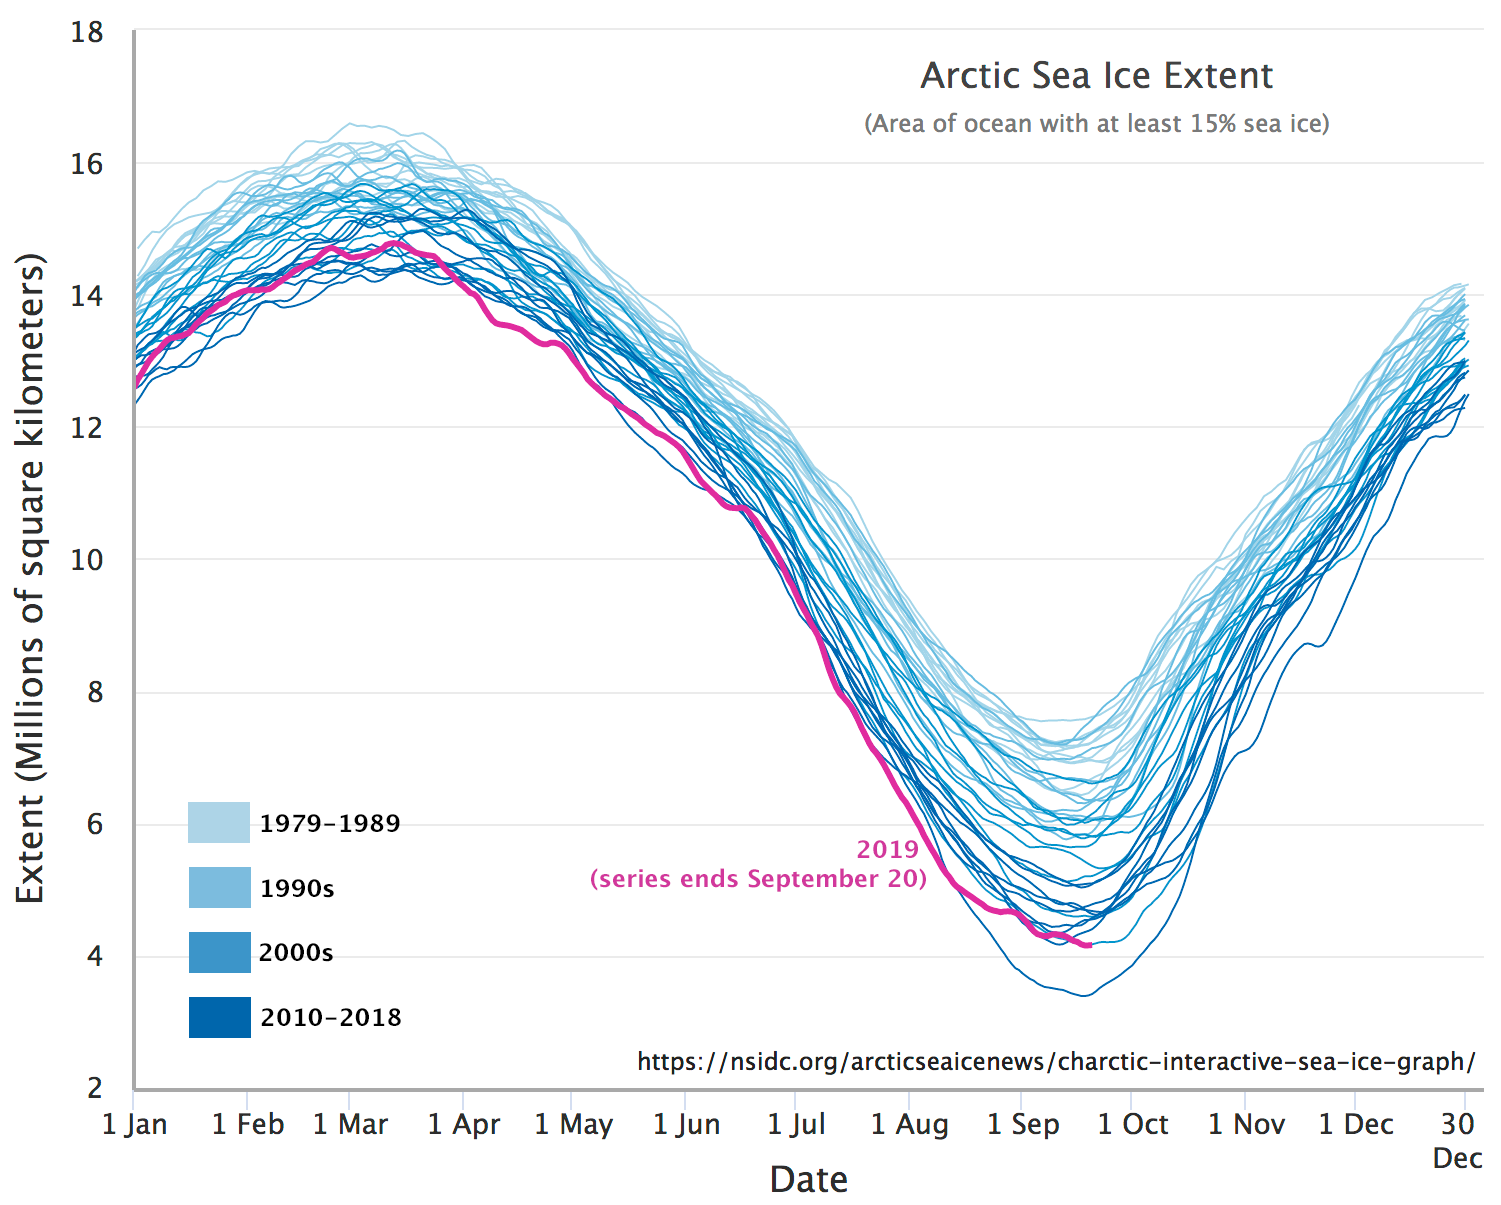
Figure 2b. This graph shows Arctic sea ice decline per decade, and includes the 2019 sea ice decline trajectory. The color scheme moves from lightest to darkest blue, from 1979 to 1989 and 2010 to 2018, respectively. 2019 is shown in magenta. This graphic is based on the Charctic Interactive Sea Ice Graph.
Credit: M. Scott, NSIDC
High-resolution image
This year’s minimum set on September 18 was 760,000 square kilometers (293,000 square miles) above the record minimum extent in the satellite era, which occurred on September 17, 2012, and 2.10 million square kilometers (811,000 square miles) below the 1981 to 2010 average minimum extent.
Thirteen lowest minimum Arctic sea ice extents (satellite record, 1979 to present)
| RANK | YEAR | MINIMUM ICE EXTENT | DATE | |
|---|---|---|---|---|
| IN MILLIONS OF SQUARE KILOMETERS | IN MILLIONS OF SQUARE MILES | |||
| 1 | 2012 | 3.39 | 1.31 | Sept. 17 |
| 2 | 2019 2007 2016 |
4.15 4.16 4.17 |
1.60 1.61 1.61 |
Sept. 18 Sept. 18 Sept. 10 |
| 5 | 2011 | 4.34 | 1.68 | Sept. 11 |
| 6 | 2015 | 4.43 | 1.71 | Sept. 9 |
| 7 | 2008 2010 |
4.59 4.62 |
1.77 1.78 |
Sept. 19 Sept. 21 |
| 9 | 2018 2017 |
4.66 4.67 |
1.80 1.80 |
Sept. 23 Sept. 13 |
| 11 | 2014 2013 |
5.03 5.05 |
1.94 1.95 |
Sept. 17 Sept. 13 |
| 13 | 2009 | 5.12 | 1.98 | Sept. 13 |
Values within 40,000 square kilometers (15,000 square miles) are considered tied. The 2018 value has changed from 4.59 to 4.66 million square kilometers (1.80 million square miles) when final analysis data updated near-real time data, dropping 2018 to a tied ninth position with 2017.

