After a period of slow ice loss in the middle of June, Arctic sea ice loss ramped up, and extent at the end of the month fell below 2012, the year which ended up with the lowest September ice extent in the satellite record. A pattern of atmospheric circulation favored ice loss this June, which was also characterized by above average temperatures over most of the Arctic Ocean, and especially in the Laptev and East Siberian Seas.
Overview of conditions
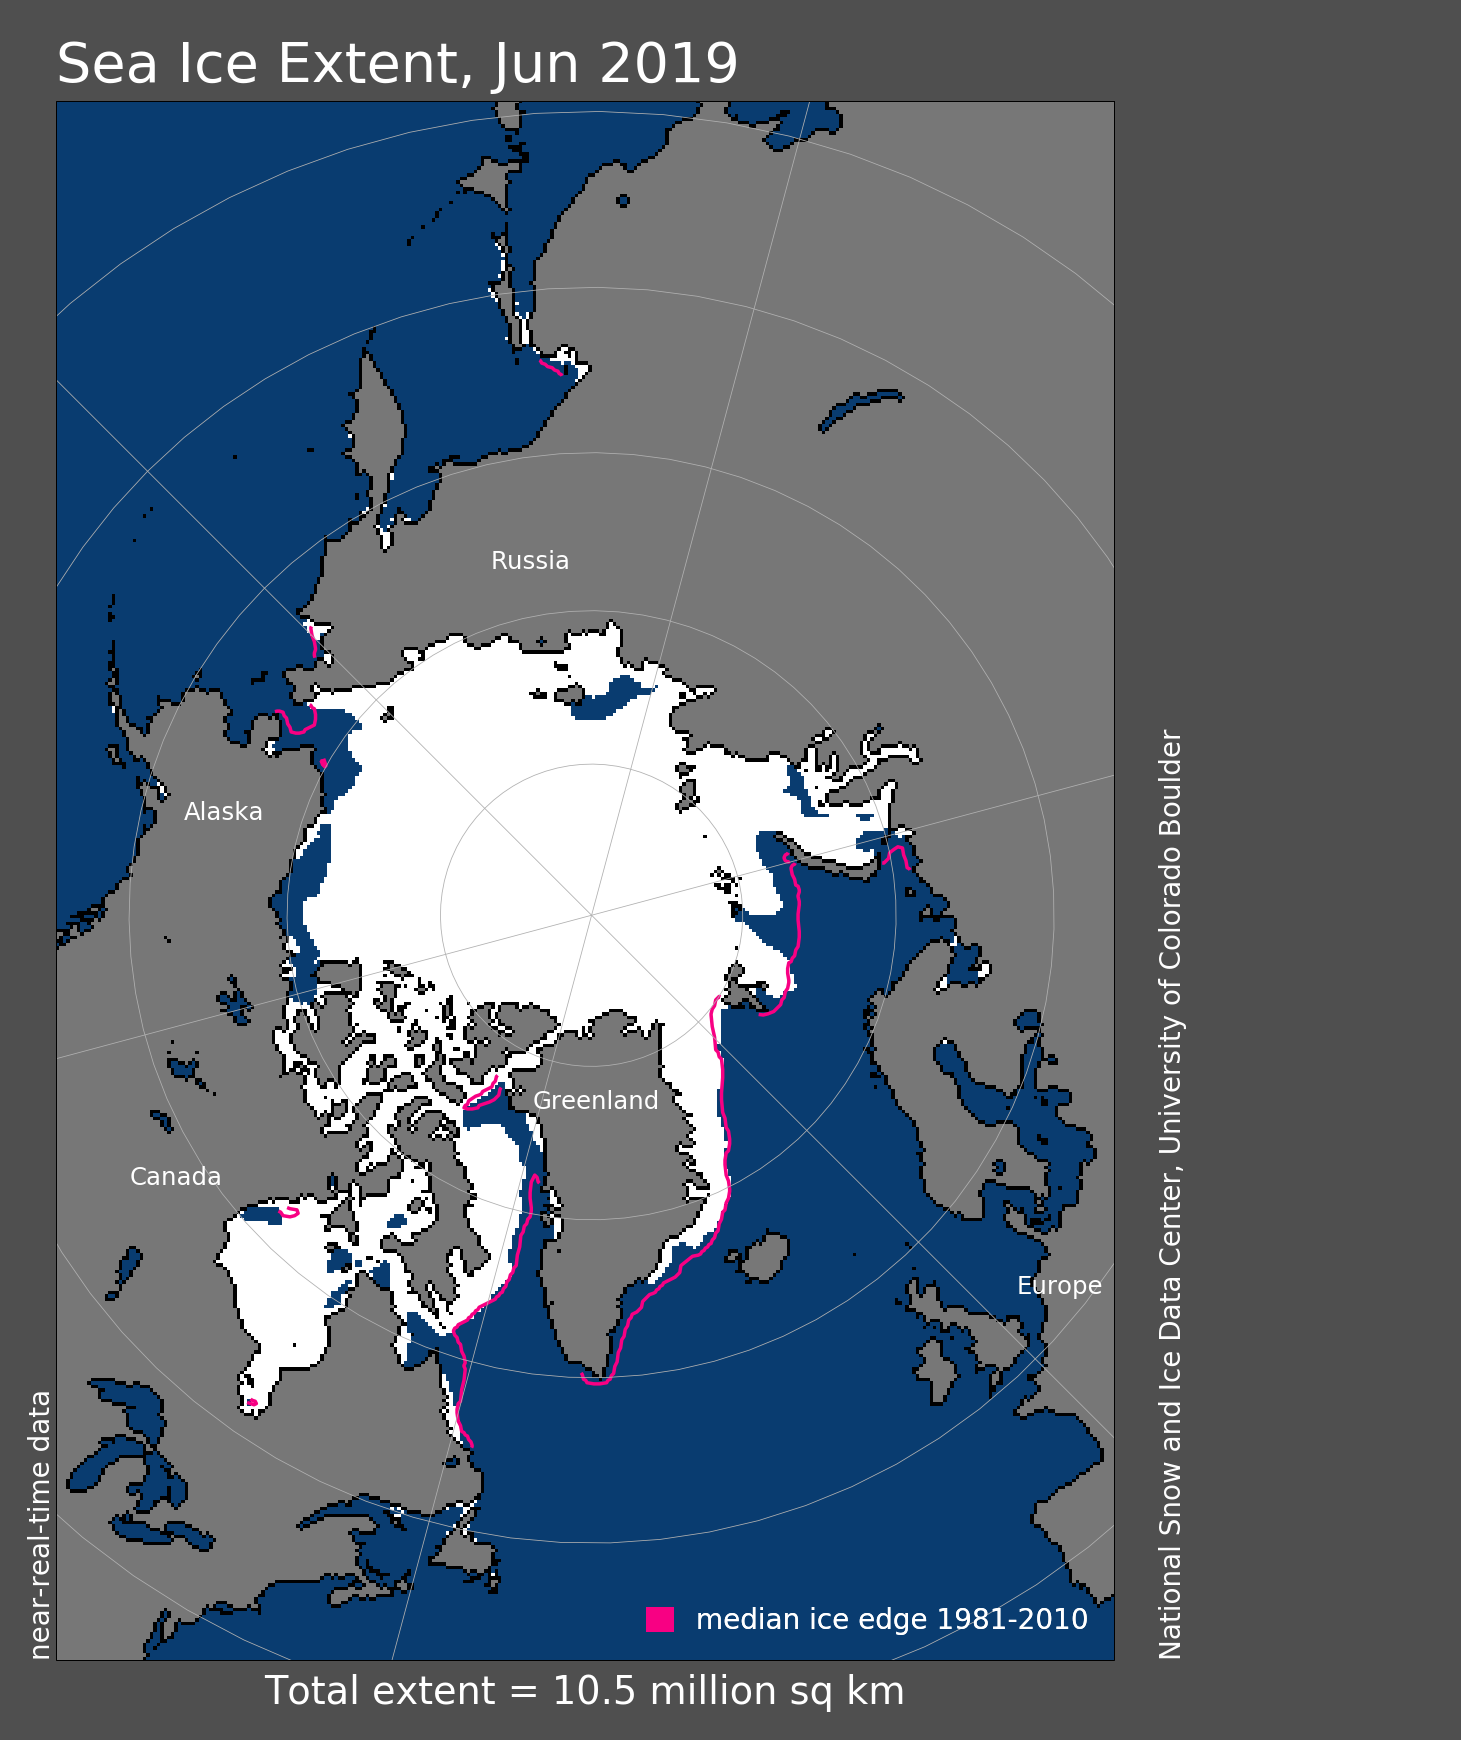
Figure 1. Arctic sea ice extent for June 2019 was 10.53 million square kilometers (4.07 million square miles). The magenta line shows the 1981 to 2010 average extent for that month. Sea Ice Index data. About the data
Credit: National Snow and Ice Data Center
High-resolution image
Arctic sea ice extent for June averaged 10.53 million square kilometers (4.07 million square miles). This is 1.23 million square kilometers (475,000 square miles) below the 1981 to 2010 average and 120,000 square kilometers (46,300 square miles) above the previous June record low set in 2016. Extent at the end of the month remained well below average on the Pacific side of the Arctic, with open water extending from the Bering Strait, and along the coasts of the Chukchi and Beaufort Seas all the way to Melville Island in the Canadian Arctic Archipelago. Sea surface temperatures (SSTs) in the open waters have been unusually high, up to 5 degrees Celsius (9 degrees Fahrenheit) above average in the Chukchi Sea, as indicated by the National Oceanic and Atmospheric Administration (NOAA) SST data provided on the University of Washington Polar Science Center UpTempO website. Large areas of open water are now apparent in the Laptev and Kara Seas with extent below average in Baffin Bay and along the southeast coast of Greenland.
Extent over the first 10 days of the month dropped quickly but then the loss rate suddenly slowed. From June 12 through June 16, extent remained almost constant at 10.8 million square kilometers (4.17 million square miles). Following this hiatus, extent then dropped fairly quickly through the remainder of the month. Overall, sea ice retreated almost everywhere in the Arctic in June. Exceptions included the northern East Greenland Sea, southeast of Svalbard, near Franz Joseph Land, and in the southeastern part of the Beaufort Sea, where the ice edge expanded slightly.
Conditions in context
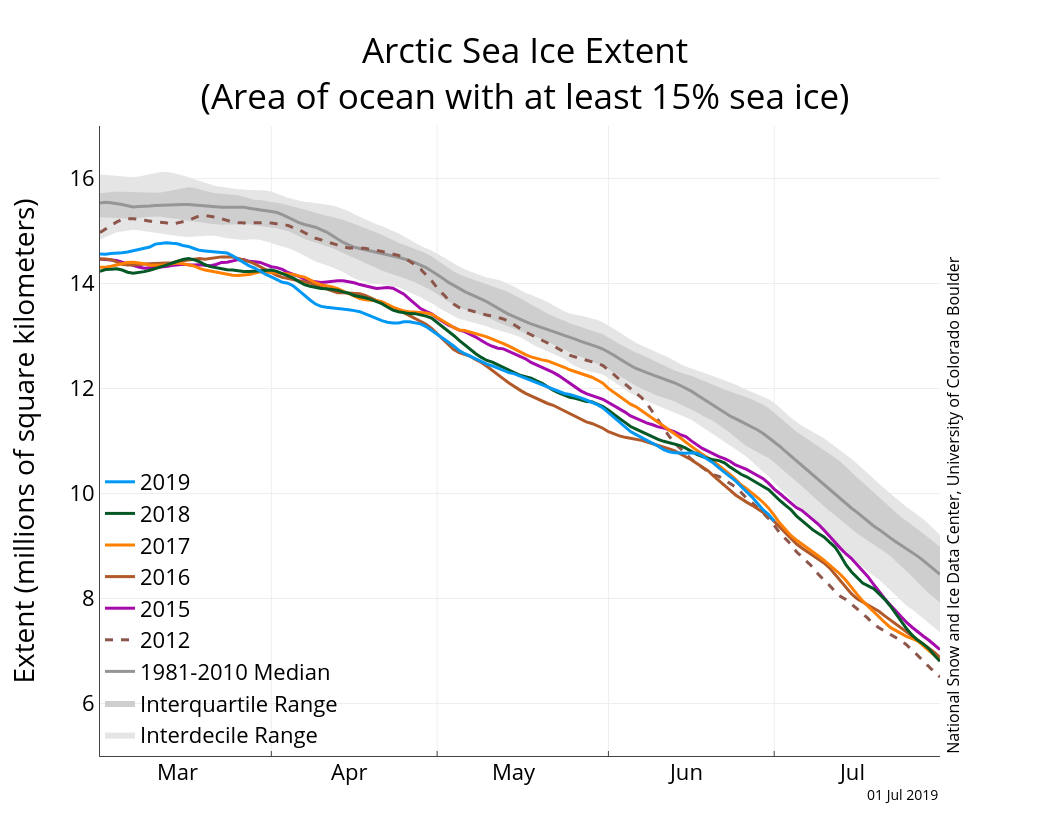
Figure 2a. The graph above shows Arctic sea ice extent as of July 1, 2019, along with daily ice extent data for four previous years and the record low year. 2019 is shown in blue, 2018 in green, 2017 in orange, 2016 in brown, 2015 in purple, and 2012 in dotted brown. The 1981 to 2010 median is in dark gray. The gray areas around the median line show the interquartile and interdecile ranges of the data. Sea Ice Index data.
Credit: National Snow and Ice Data Center
High-resolution image
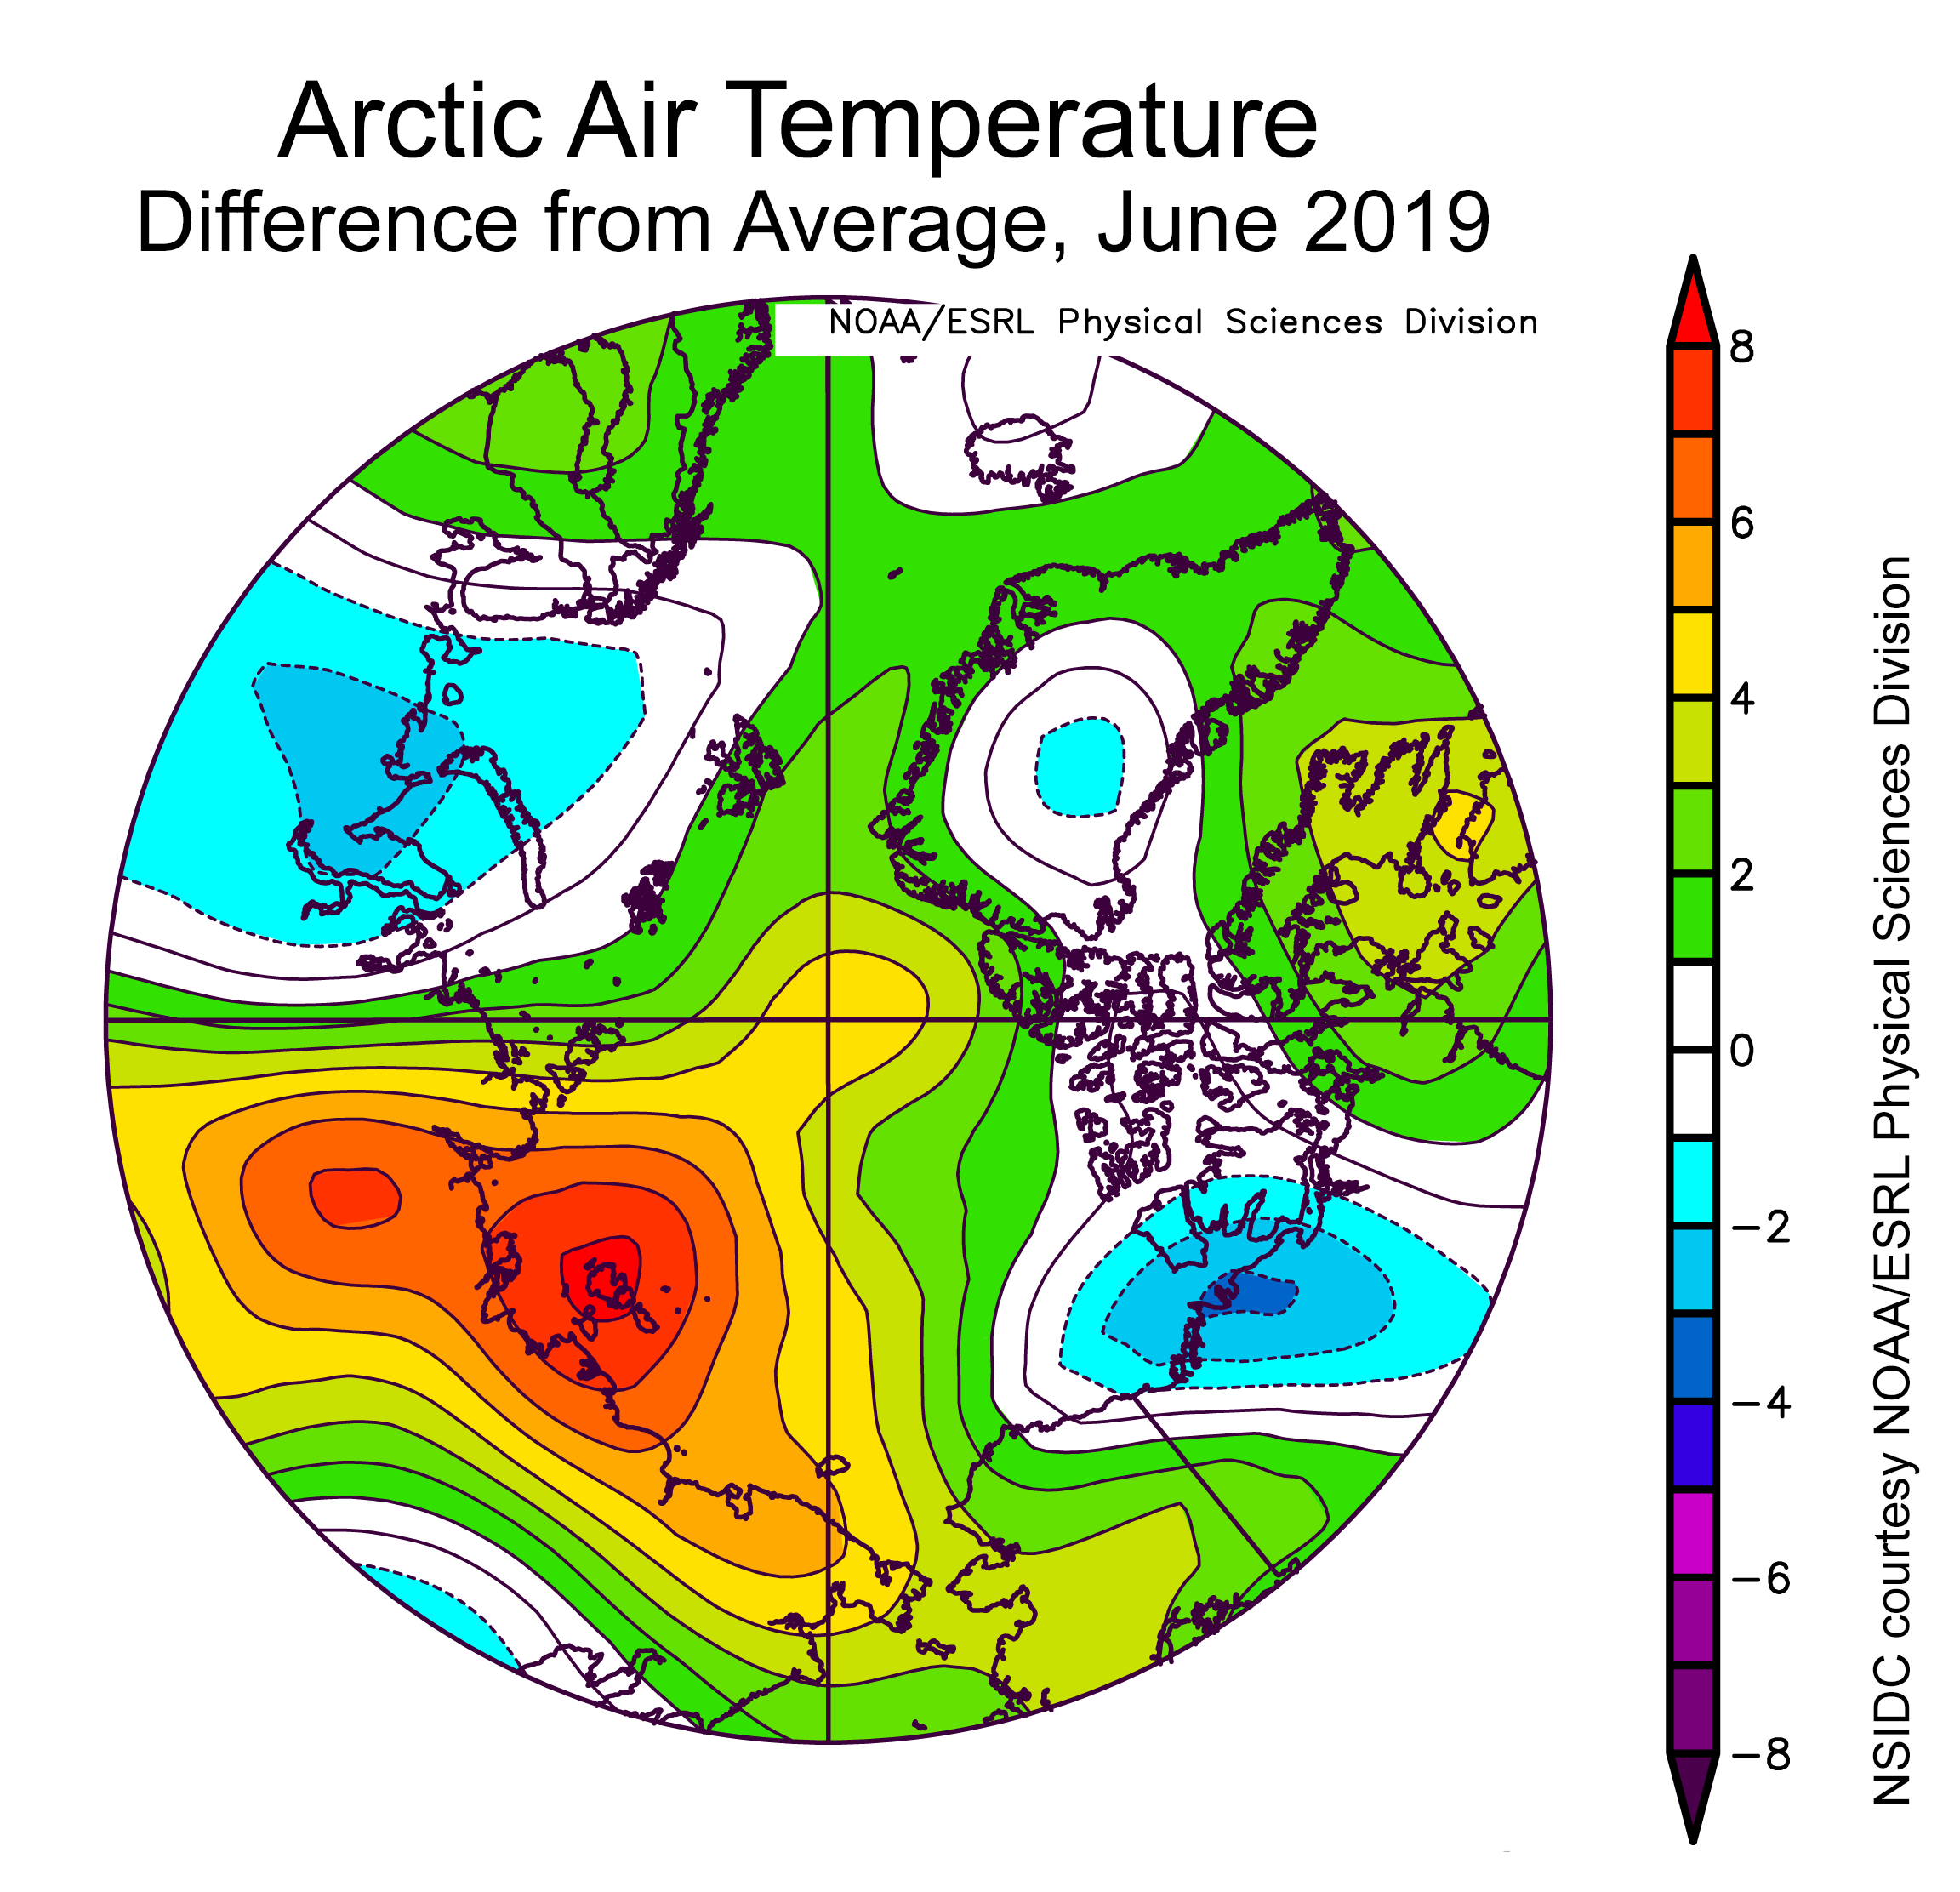
Figure 2b. This plot shows the departure from average air temperature in the Arctic at the 925 hPa level, in degrees Celsius, for June 2019. Yellows and reds indicate higher than average temperatures; blues and purples indicate lower than average temperatures.
Credit: NSIDC courtesy NOAA Earth System Research Laboratory Physical Sciences Division
High-resolution image
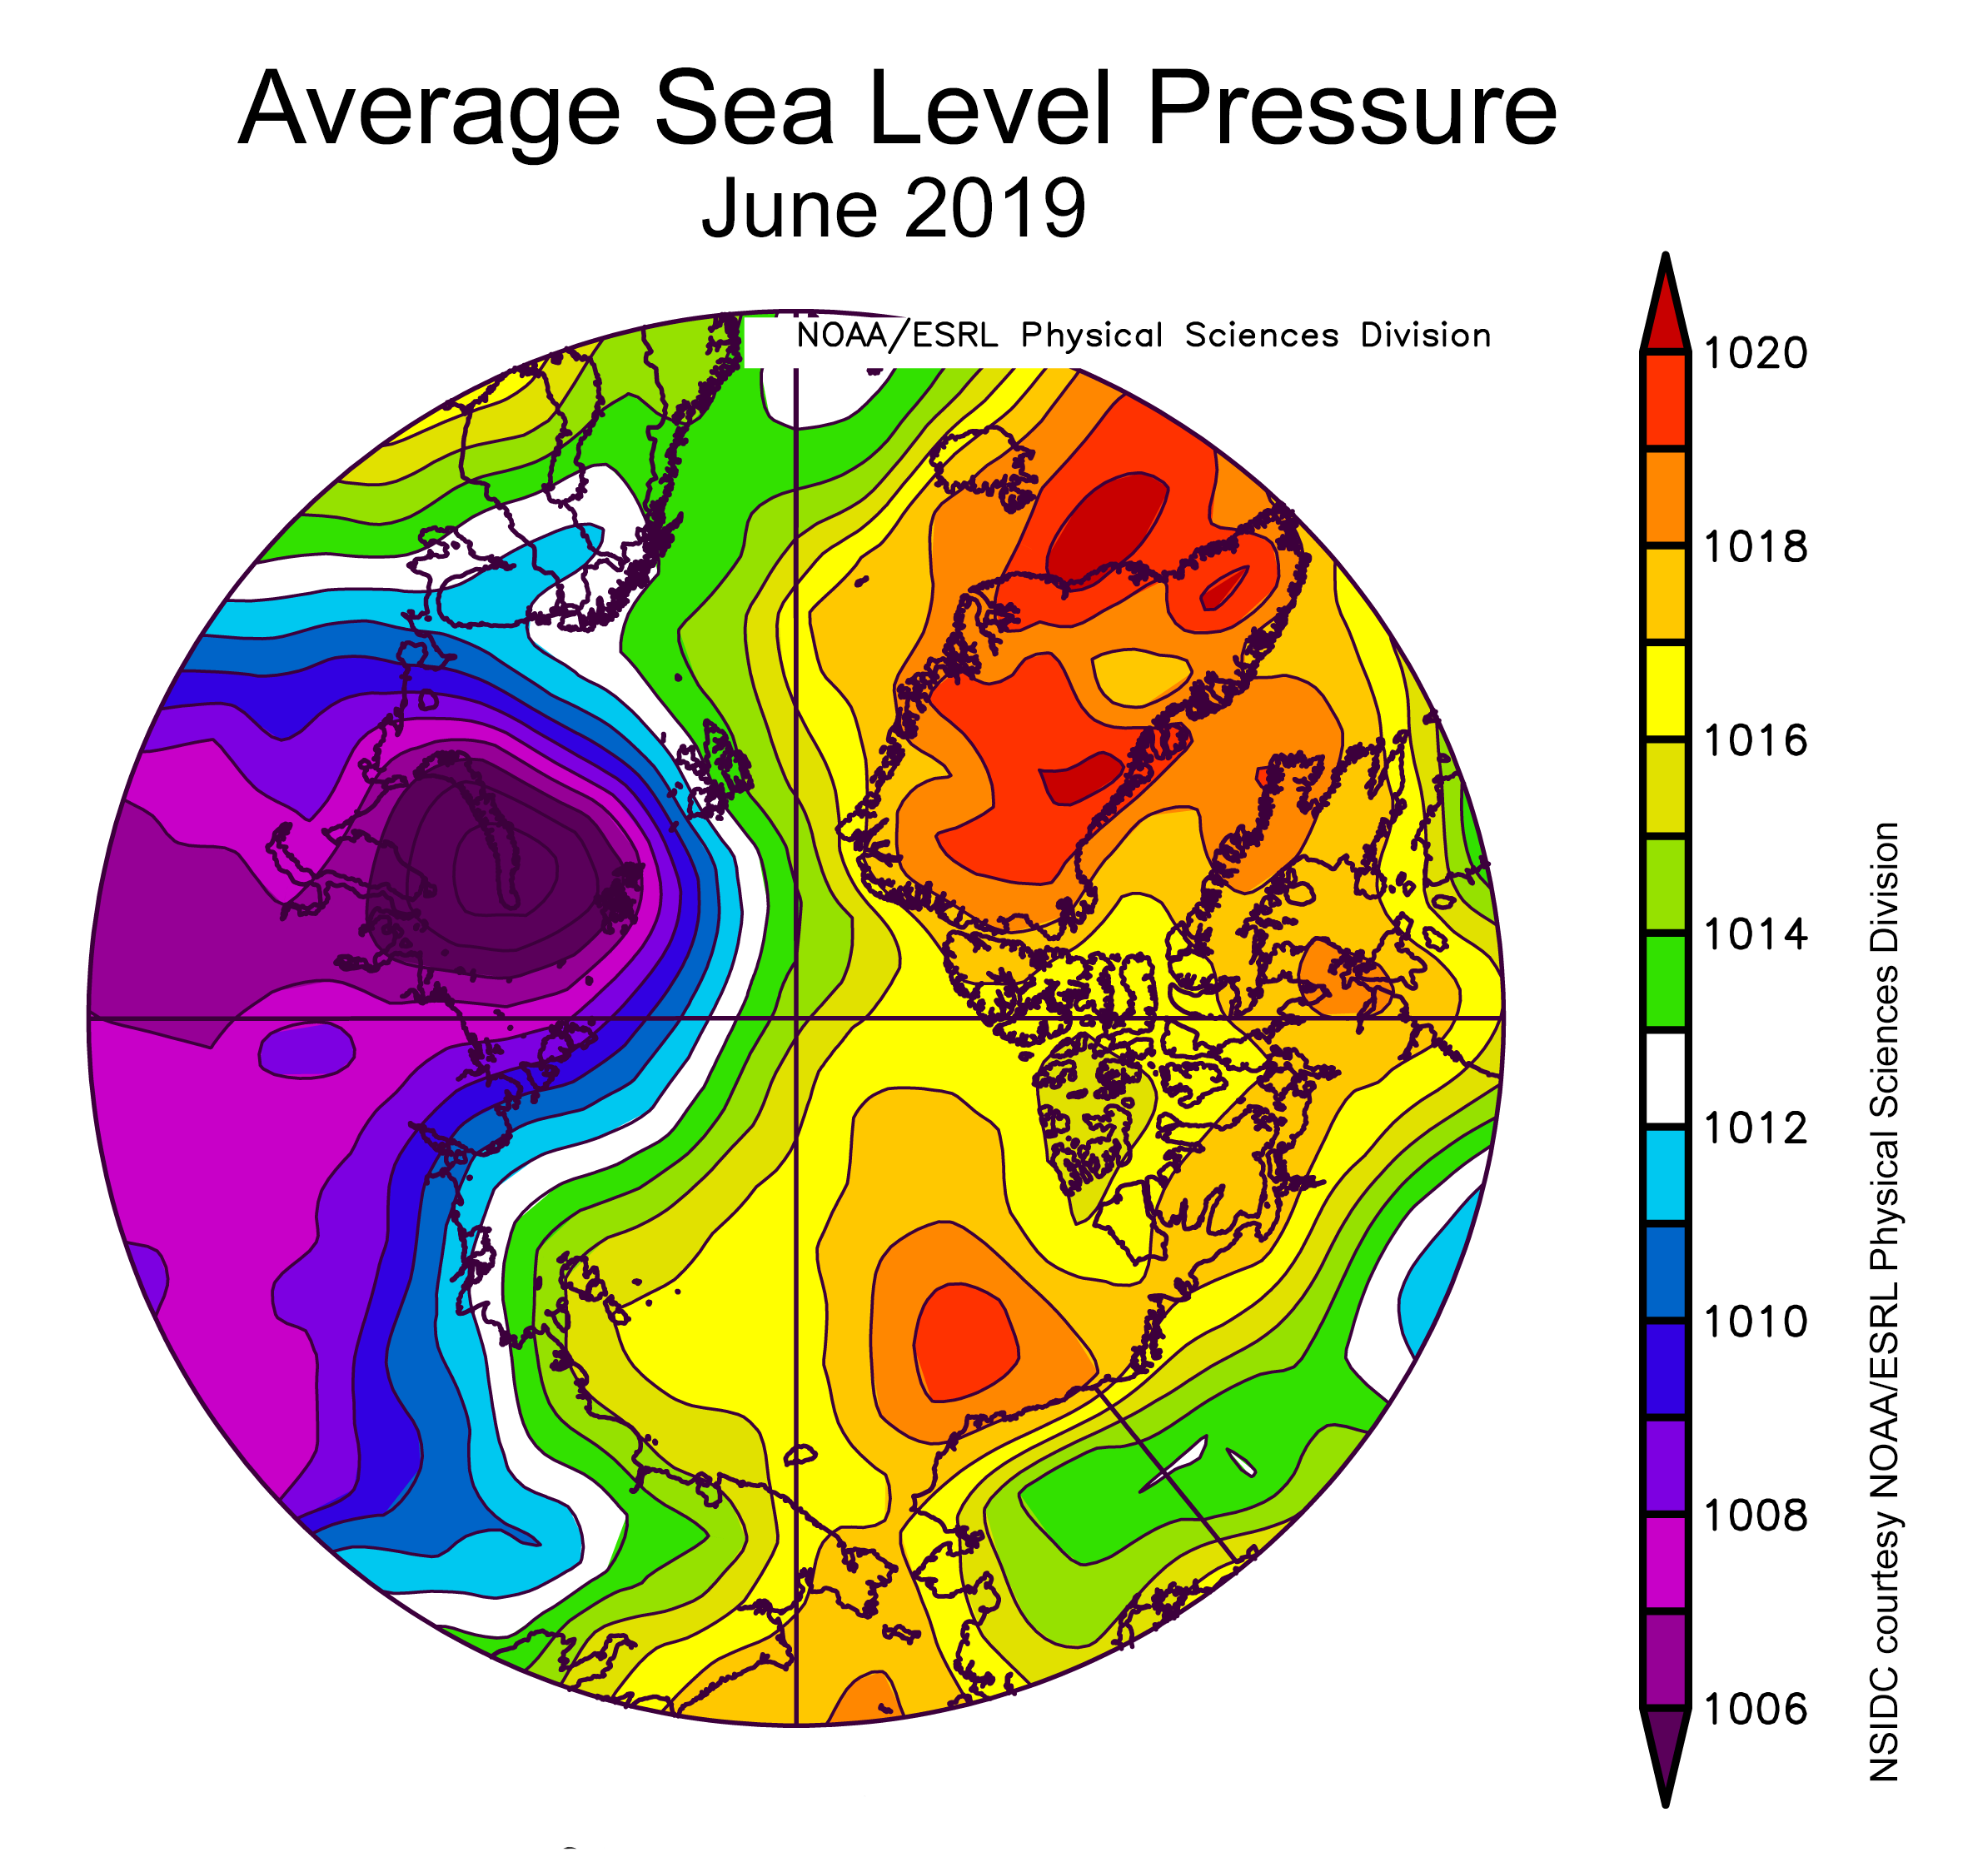
Figure 2c. This plot shows average sea level pressure in the Arctic in millibars (hPa) for June 2019. Yellows and reds indicate high air pressure; blues and purples indicate low pressure.
Credit: NSIDC courtesy NOAA Earth System Research Laboratory Physical Sciences Division
High-resolution image
Following May’s theme, air temperatures at the 925 hPa level (about 2,500 feet above the surface) in June were above the 1981 to 2010 average over most of the Arctic Ocean. However, the spatial patterns between the two months were different. While in May, it was particularly warm compared to average over Baffin Bay and a broad area north of Greenland, in June the maximum warmth of more than 6 to 8 degrees Celsius (11 to 14 degrees Fahrenheit) shifted to the Laptev and East Siberian Seas (Figure 2b). It was slightly cooler than average over the northern Barents and Kara Seas and over central Greenland and the western Canadian Arctic.
The atmospheric circulation at sea level featured high pressure over the north American side of the Arctic, with pressure maxima over Greenland and in the Beaufort Sea, paired with low pressure over the Eurasian side of the Arctic, with the lowest pressures over the Kara Sea (Figure 2c). This pattern drew in warm air from the south over the Laptev Sea where temperatures were especially high relative to average. This circulation pattern bears some resemblance to the Arctic Dipole pattern that is known to favor summer sea ice loss, which was particularly well developed through the summer of 2007. So far, the pattern for the 2019 melt season is very different than the past three years, which featured low pressure over the central Arctic Ocean.
June 2019 compared to previous years
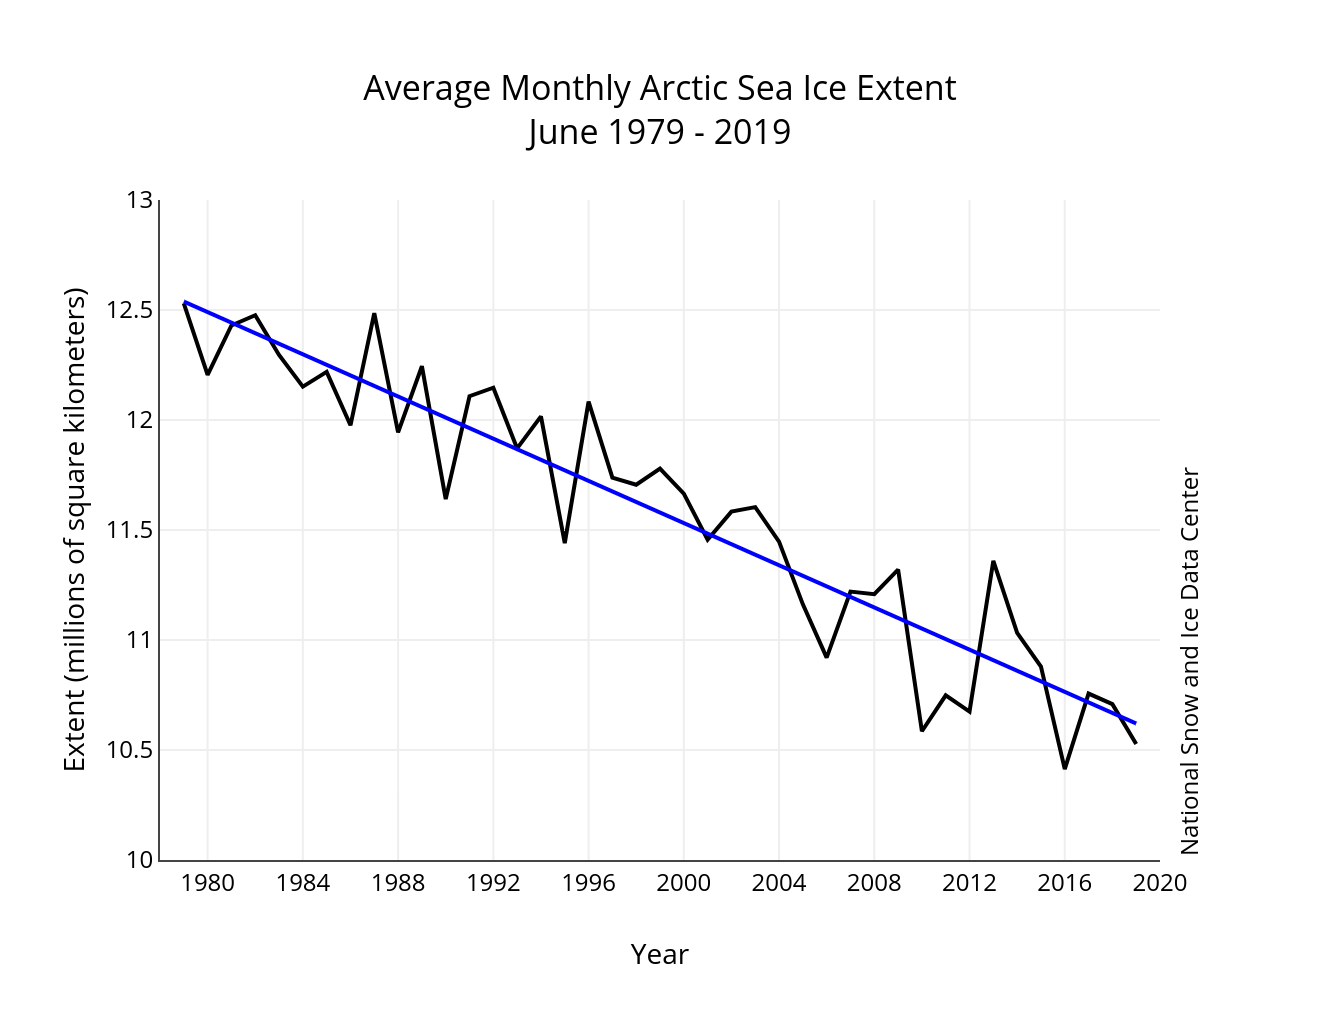
Figure 3. Monthly June ice extent for 1979 to 2019 shows a decline of 4.08 percent per decade.
Credit: National Snow and Ice Data Center
High-resolution image
The average extent for June 2019 of 10.53 million square kilometers (4.07 million square miles) ended up as the second lowest in the satellite record. The current record low of 10.41 million square kilometers (4.02 million square miles) was set in June 2016. Overall, sea ice extent during June 2019 decreased by 2.03 million square kilometers (784,00 square miles). Because of the fairly slow loss rate near the middle of the month, the overall loss rate for June ended up being fairly close to the 1981 to 2010 average. The linear rate of sea ice decline for June from 1979 to 2019 is 48,000 square kilometers (19,00 square miles) per year, or 4.08 percent per decade relative to the 1981 to 2010 average.
Sea Ice Outlook posted for June

Figure 4. This chart shows the projections of total Arctic sea ice extent based on conditions in May from 31 contributors.
Credit: Sea Ice Prediction Network
High-resolution image
The Sea Ice Prediction Network–Phase 2 recently posted the 2019 Sea Ice Outlook June report. This report focuses on projections of September sea ice extent based on conditions in May. The projections come variously from complex numerical models to statistical models to qualitative perspectives from citizen scientists. There were 31 contributions for projected total Arctic sea ice extent and of these 31, nine also provided projections for extent in Alaska waters, and six provided projections of total Antarctic extent (Figure 4). There were also seven predictions of September extent for Hudson Bay.
The median of the projections for the monthly mean September 2019 total Arctic sea ice sea-ice extent is 4.40 million square kilometers (1.70 million square miles) with quartiles (including 75 percent of the 31 projections) of 4.2 and 4.8 million square kilometers (1.62 and 1.85 million square miles). The observed record low September extent of 3.6 million square kilometers (1.39 million square miles) was set 2012. Only three of the projections are for a September 2019 extent below 4.0 million square kilometers (1.54 million square miles) and only one is for a new record at 3.06 million square kilometers (1.18 million square miles).
Thicker clouds accelerate sea decline

Figure 5. These plots show linear trends of satellite-retrieved cloud cover, percent per year, for March through June over the Arctic (70 to 90 degrees North) from 2000 to 2015. Blues depict declines in cloud cover while reds depict increases. Cloud observations are derived from CERES-MODIS SYN1 Ed3.0 product.
Credit: Huang, Y. et al., 2019, Geophysical Research Letters
High-resolution image
A new study led by Yiyi Huang of the University of Arizona presents evidence of a link between springtime cloud cover (Figure 5) over the Arctic Ocean and the observed decline in sea ice extent. Based on a combination of observations and model experiments, there may be a reinforcing feedback loop. As sea ice melts, there is more open water which promotes more evaporation from the surface and hence more water vapor in the atmosphere. More water vapor in the air then promotes the development of more clouds. This increases the emission of longwave radiation to the surface, further fostering melt. The process appears to be effective from April through June. But since the atmosphere influences the sea ice and the sea ice influences the atmosphere, separating cause and effect remains unclear.
Antarctic sea ice at record low for June
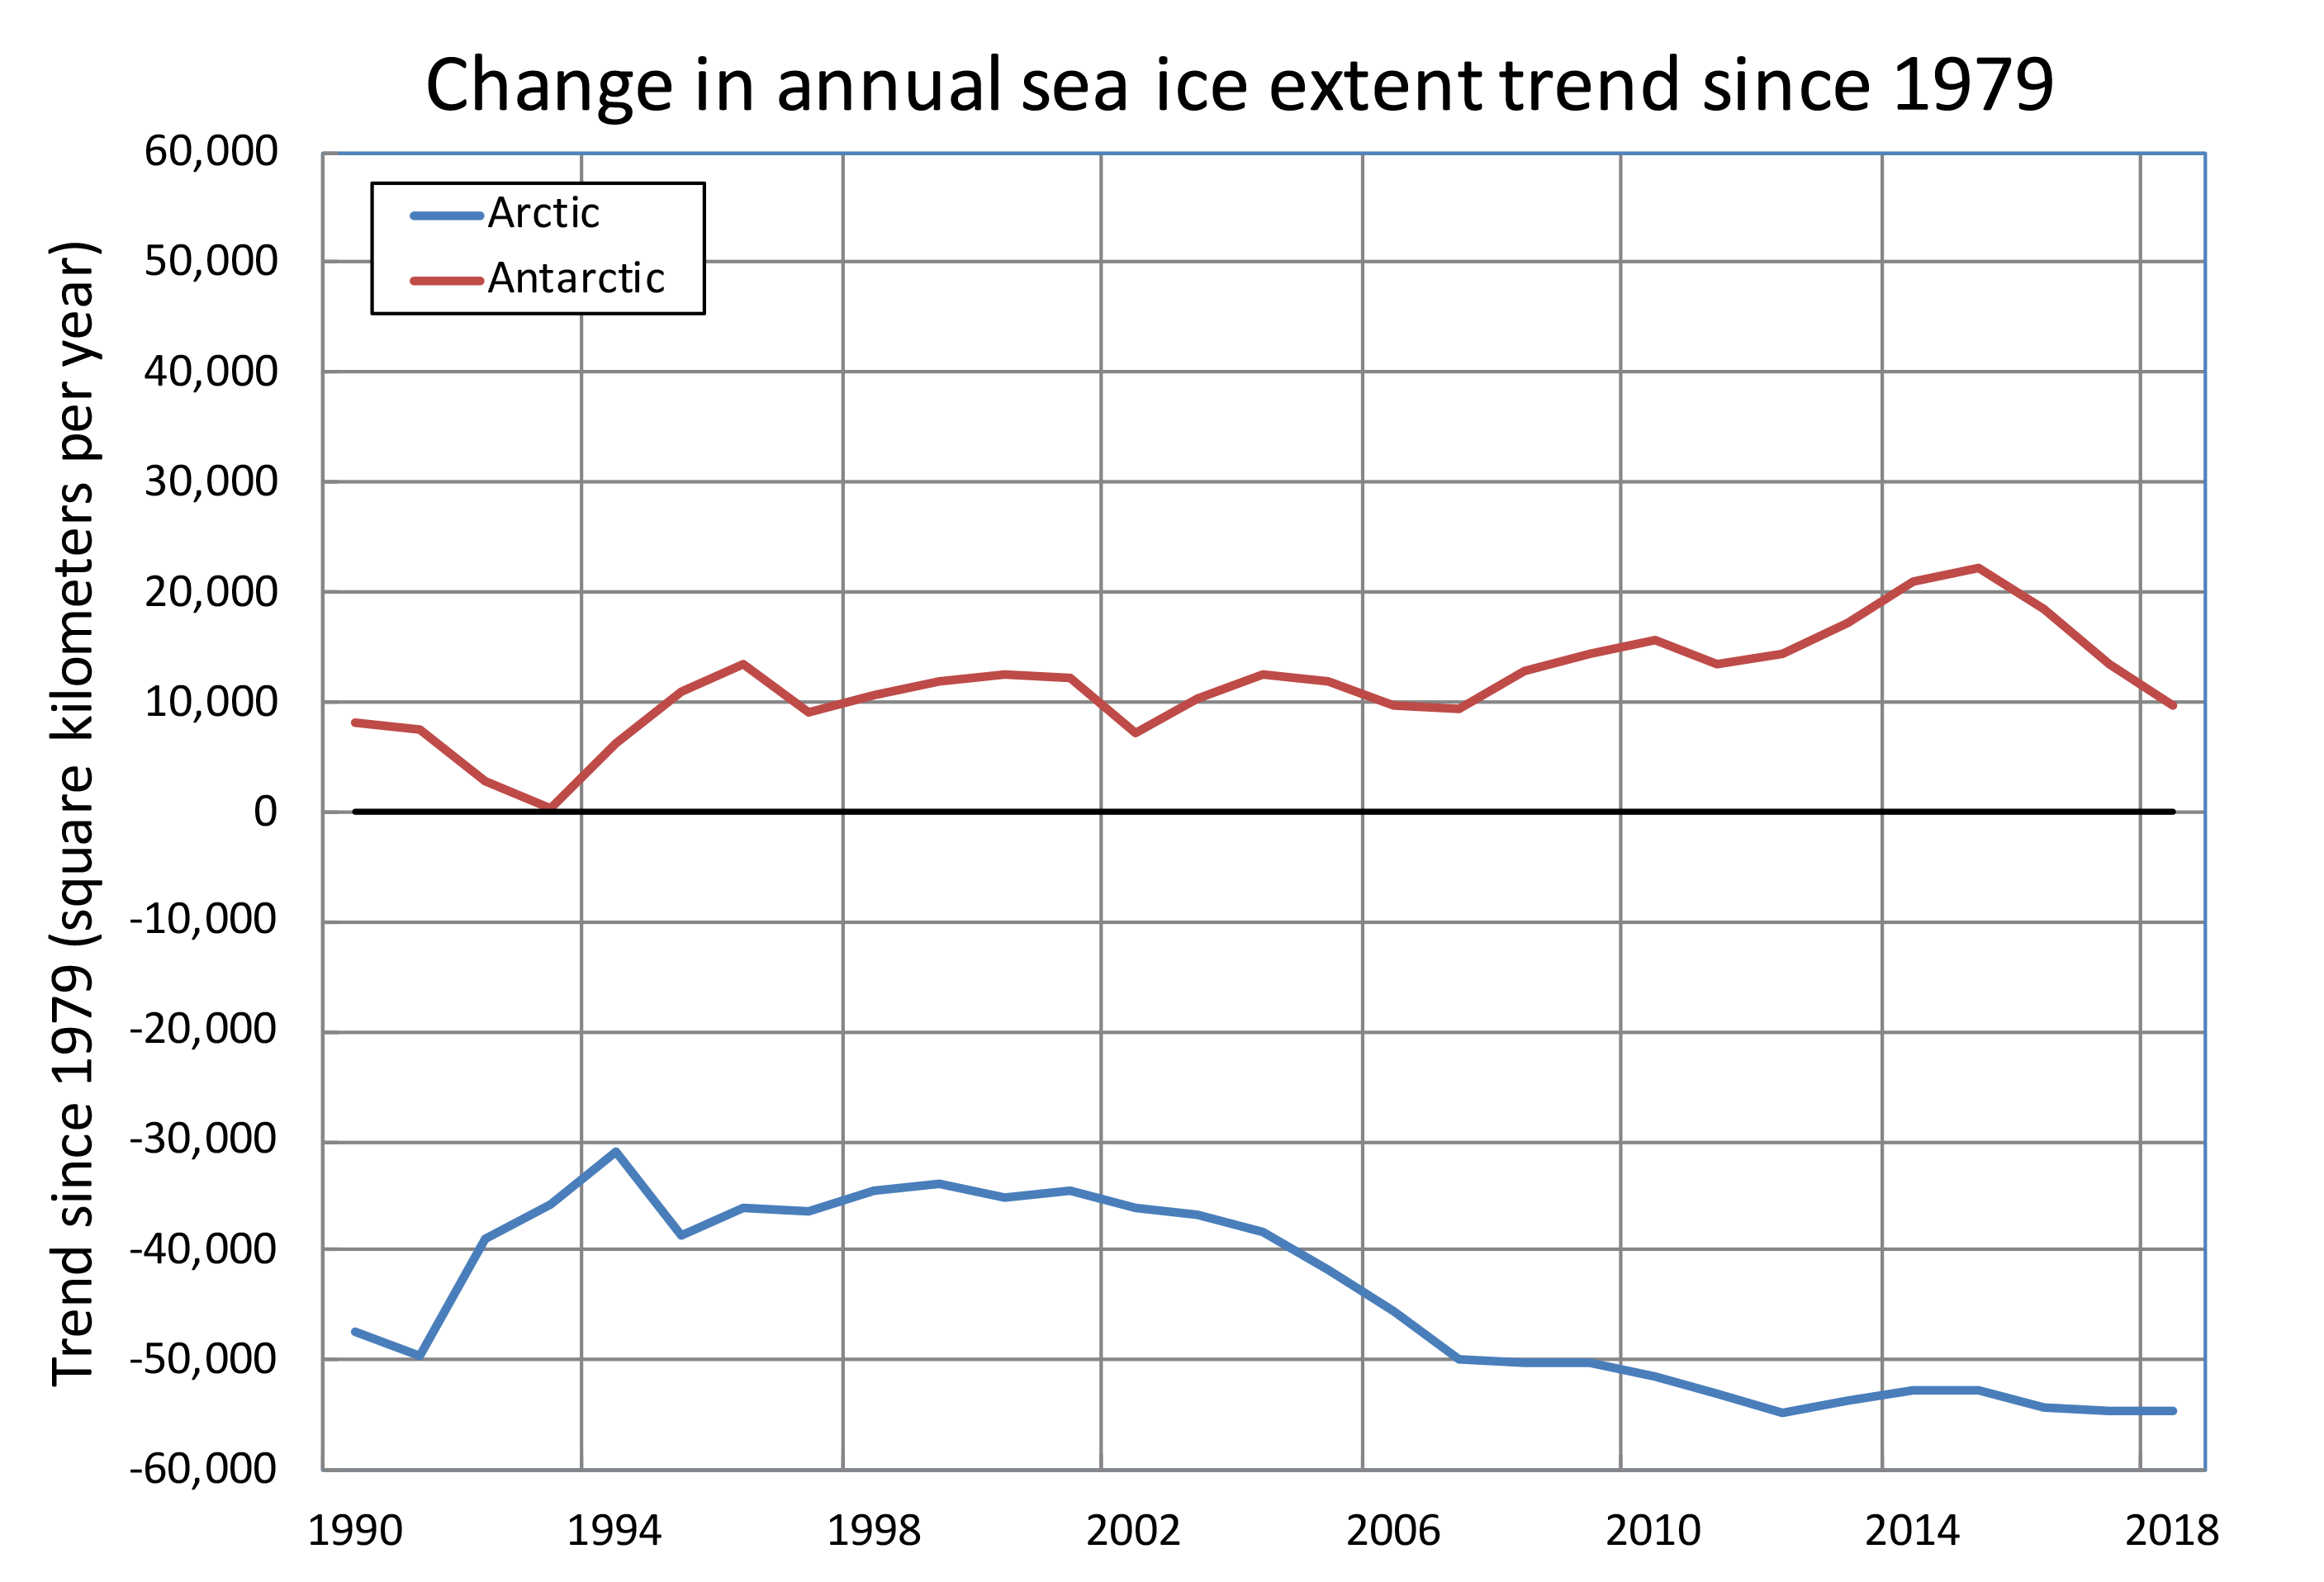
Figure 6a. This plot shows the evolution of linear trends in annual average sea ice extent for the Arctic, in blue, and Antarctic, in red. The trend was first computed from 1979 through 1990, then from 1979 through 1991, then 1979 through 1992, and so on. Even with the recent declines in Antarctic sea ice extent, the linear trend is still slightly positive. The reason for starting the trend calculation from 1979 through 1990 is that it provides a sufficient number of years to compute a trend.
Credit: W. Meier, NSIDC
High-resolution image
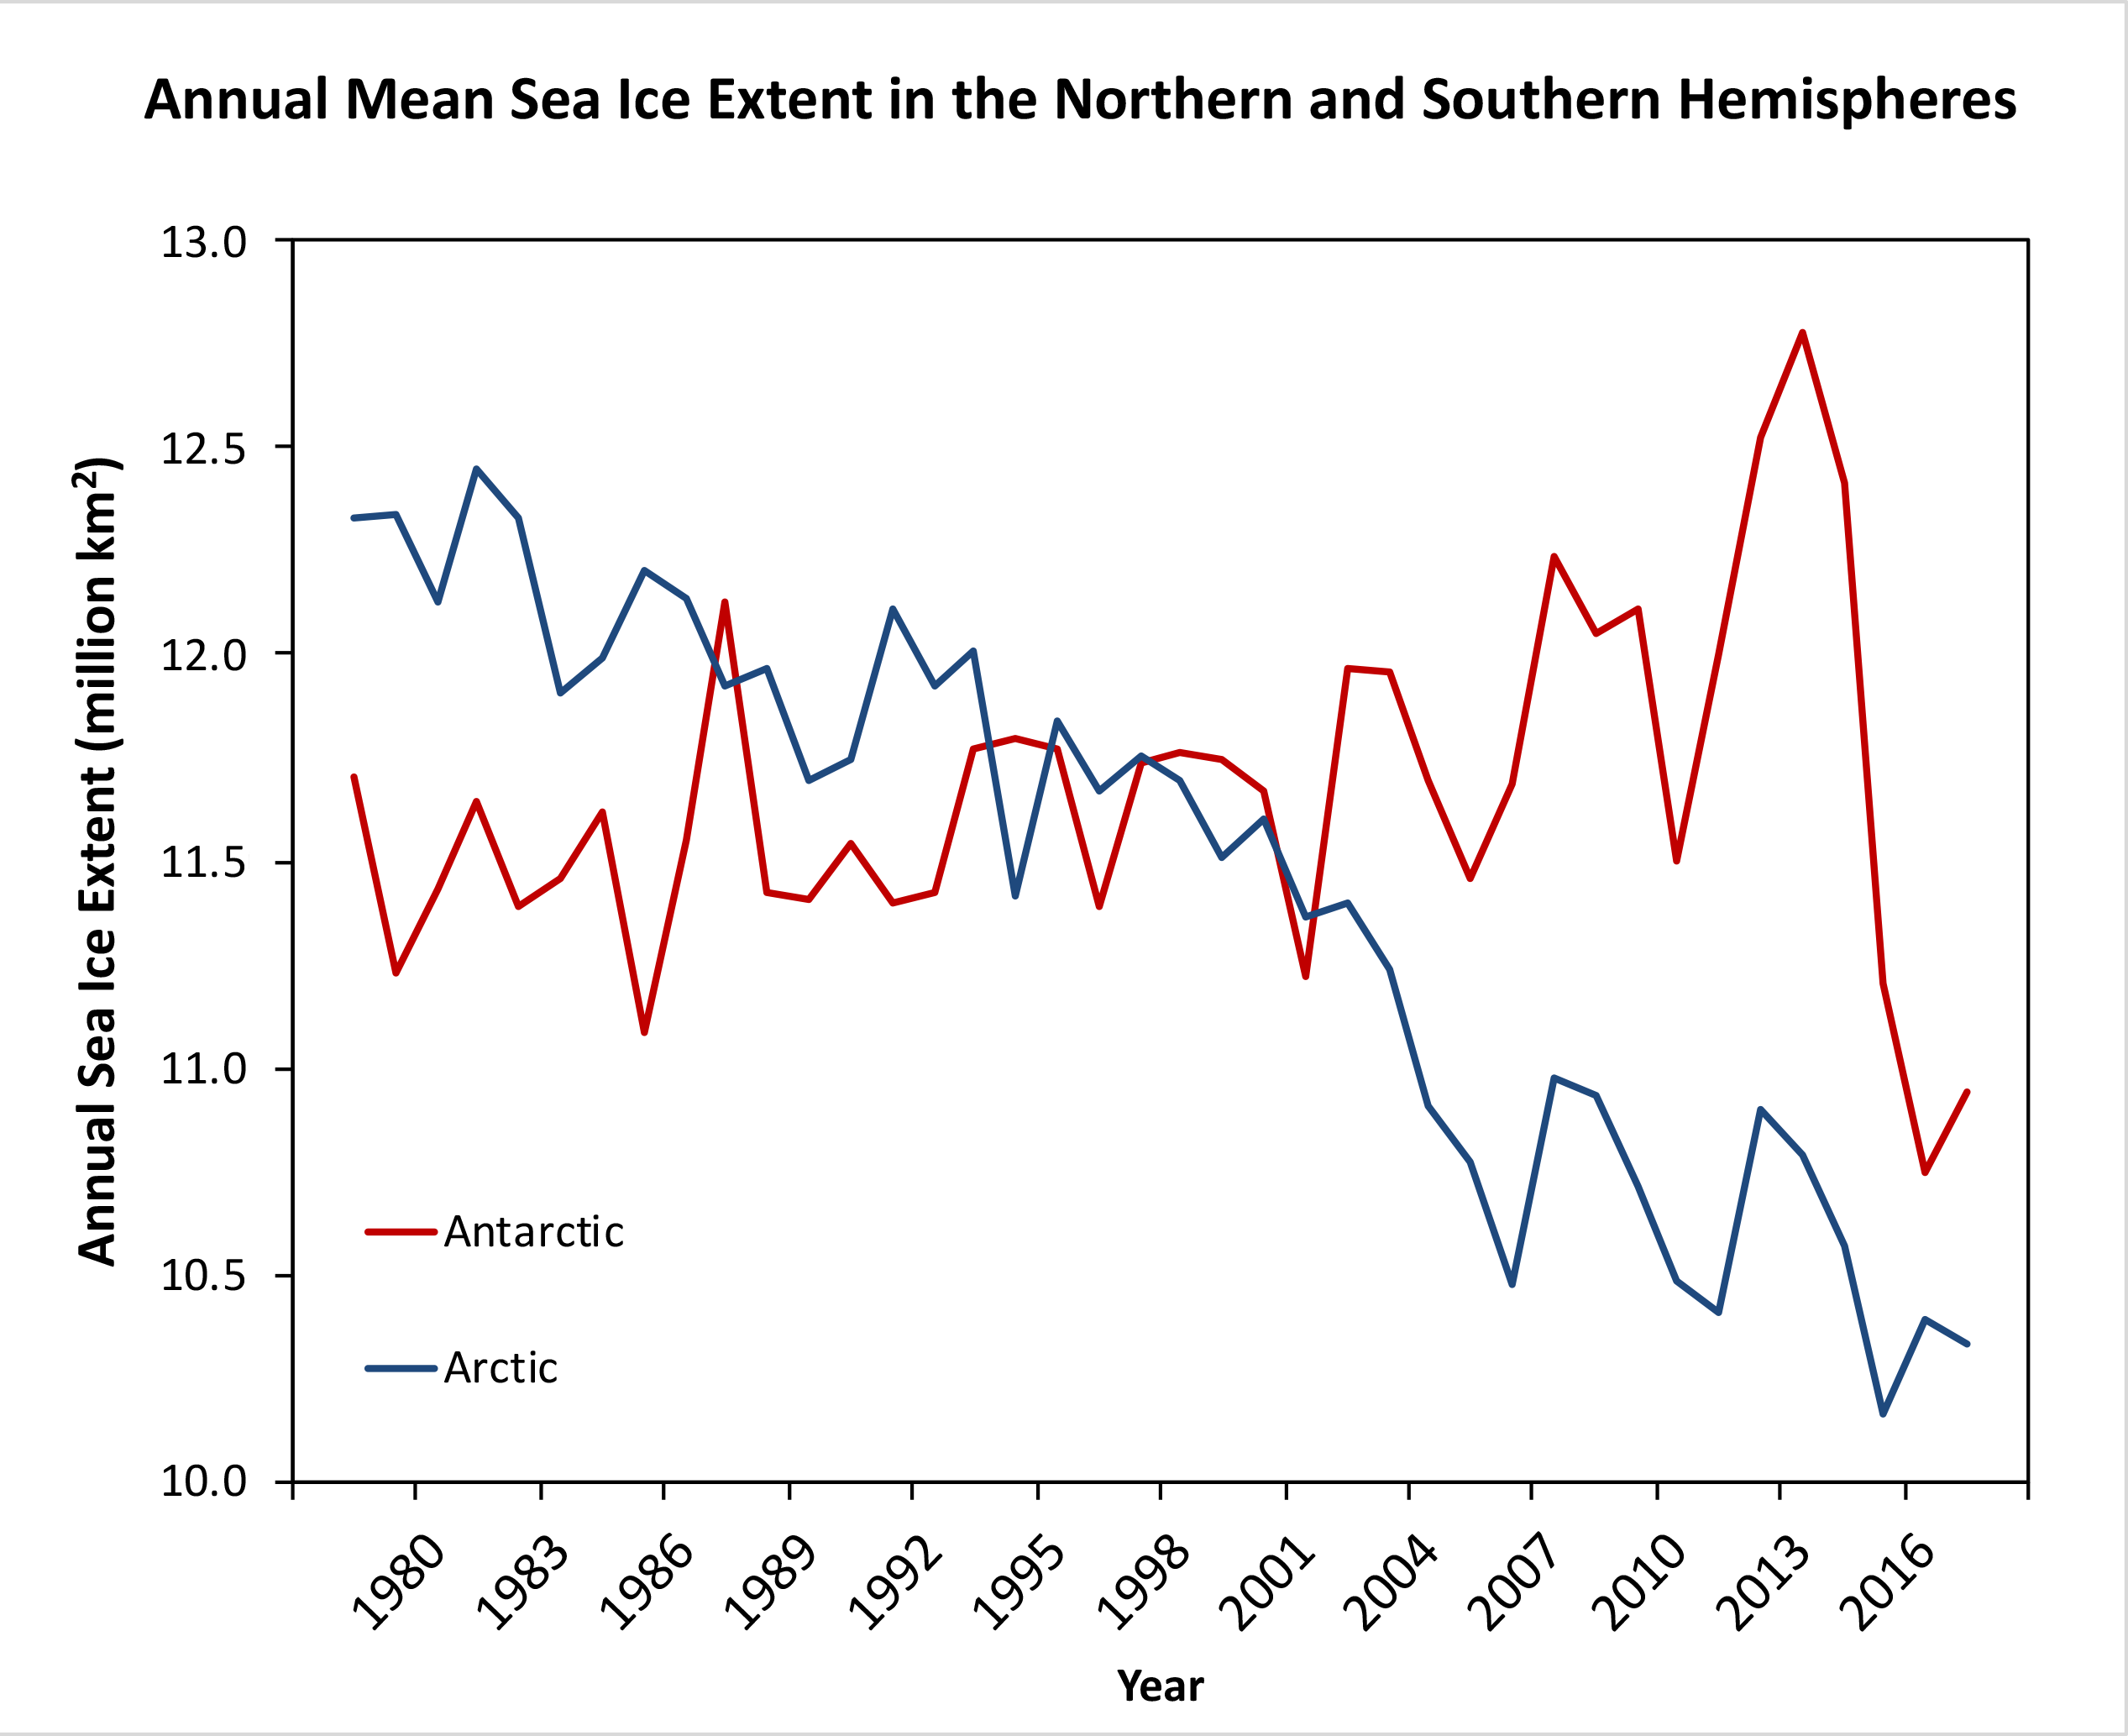
Figure 6b. This plot shows the average annual sea ice extent from 1979 through 2018 in the Arctic, in blue, and Antarctic, in red, from the Sea Ice Index using the NASA Team sea ice algorithm.
Credit: J. Stroeve, NSIDC
High-resolution image
Sea ice surrounding Antarctica was at the lowest mean monthly extent for June, surpassing 2002 and 2017. At the month’s end, sea ice averaged approximately 160,000 square kilometers (62,000 square miles) below the previous record low set in 2002, and over 1.1 million square kilometers (425,000 square miles) below the 1981 to 2010 average. Ice extent was particularly low in the eastern Weddell Sea and the region north of Enderby Land (south of the western Indian Ocean), and north of eastern Wilkes Land. No region had substantially above average sea ice extent in June.
A new paper published by our colleague Claire Parkinson at NASA Goddard Space Flight Center (GSFC) discusses the large drop in Antarctic sea ice extent between 2014 and 2017. The winter maximum for 2014 was unusually high, setting the 40-year record maximum extent. Our earlier posts noted the dramatic recent decline, particularly in the austral spring of 2016. Sea ice has remained below the 1981 to 2010 reference period extent since late 2016.
While the recent decline is noteworthy, trends in Antarctic sea ice extent over the continuous satellite record since late 1978 remain slightly positive (Figure 6a). Antarctica experiences large inter-annual variability because of its unconfined geography—open to the Southern Ocean on all sides—and strong influences of the varying Southern Annular Mode pattern of atmospheric circulation. Sparse satellite data from the 1960s indicate large swings in that decade as well. Previous studies have attributed the onset of the recent decline as a response to a series of intense storms. Unlike Arctic sea ice extent, which evinces a longterm downward trend, Antarctic sea ice extent displays enormous variability that is natural for the southern sea ice system (Figure 6b). Thus, a clear climate-related signal cannot yet be discerned for sea ice in the southern hemisphere.
Reference
Gallaher, D. W., G. G. Campbell and W. N. Meier. 2013. Anomalous variability in Antarctic sea ice extents during the 1960s with the use of Nimbus data. IEEE Journal of Selected Topics in Applied Earth Observations and Remote Sensing, 7(3), pp. 881-887. doi:10.1109/JSTARS.2013.2264391.
Huang, Y., X. Dong, D. A. Bailey, M. M. Holland, B. Xi, A. K. DuVivier, et al. 2019. Thicker clouds and accelerated Arctic sea ice decline: The atmosphere‐sea ice interactions in spring. Geophysical Research Letters, 46. doi:10.1029/2019GL082791.
Parkinson, C. L. 2019. A 40-year record reveals gradual Antarctic sea ice increases followed by decreases at rates far exceeding the rates seen in the Arctic. Proceeding of the National Academy of Sciences (PNAS), July, pp. 1-10. doi:10.1073/pnas.1906556116.
Turner, J., T. Phillips, G. J. Marshall, J. S. Hosking, J. O. Pope, T. J. Bracegirdle, and P. Deb. 2017. Unprecedented springtime retreat of Antarctic sea ice in 2016. Geophysical Research Letters, 44(13), pp. 6868-6875. doi:10.1002/2017GL073656.

