The end of the Arctic sea ice melt season is nigh. The last couple of weeks have seen small rises and falls in ice extent, primarily due to changes in wind patterns. However, falling temperatures will soon accelerate the pace of ice growth.
Overview of conditions
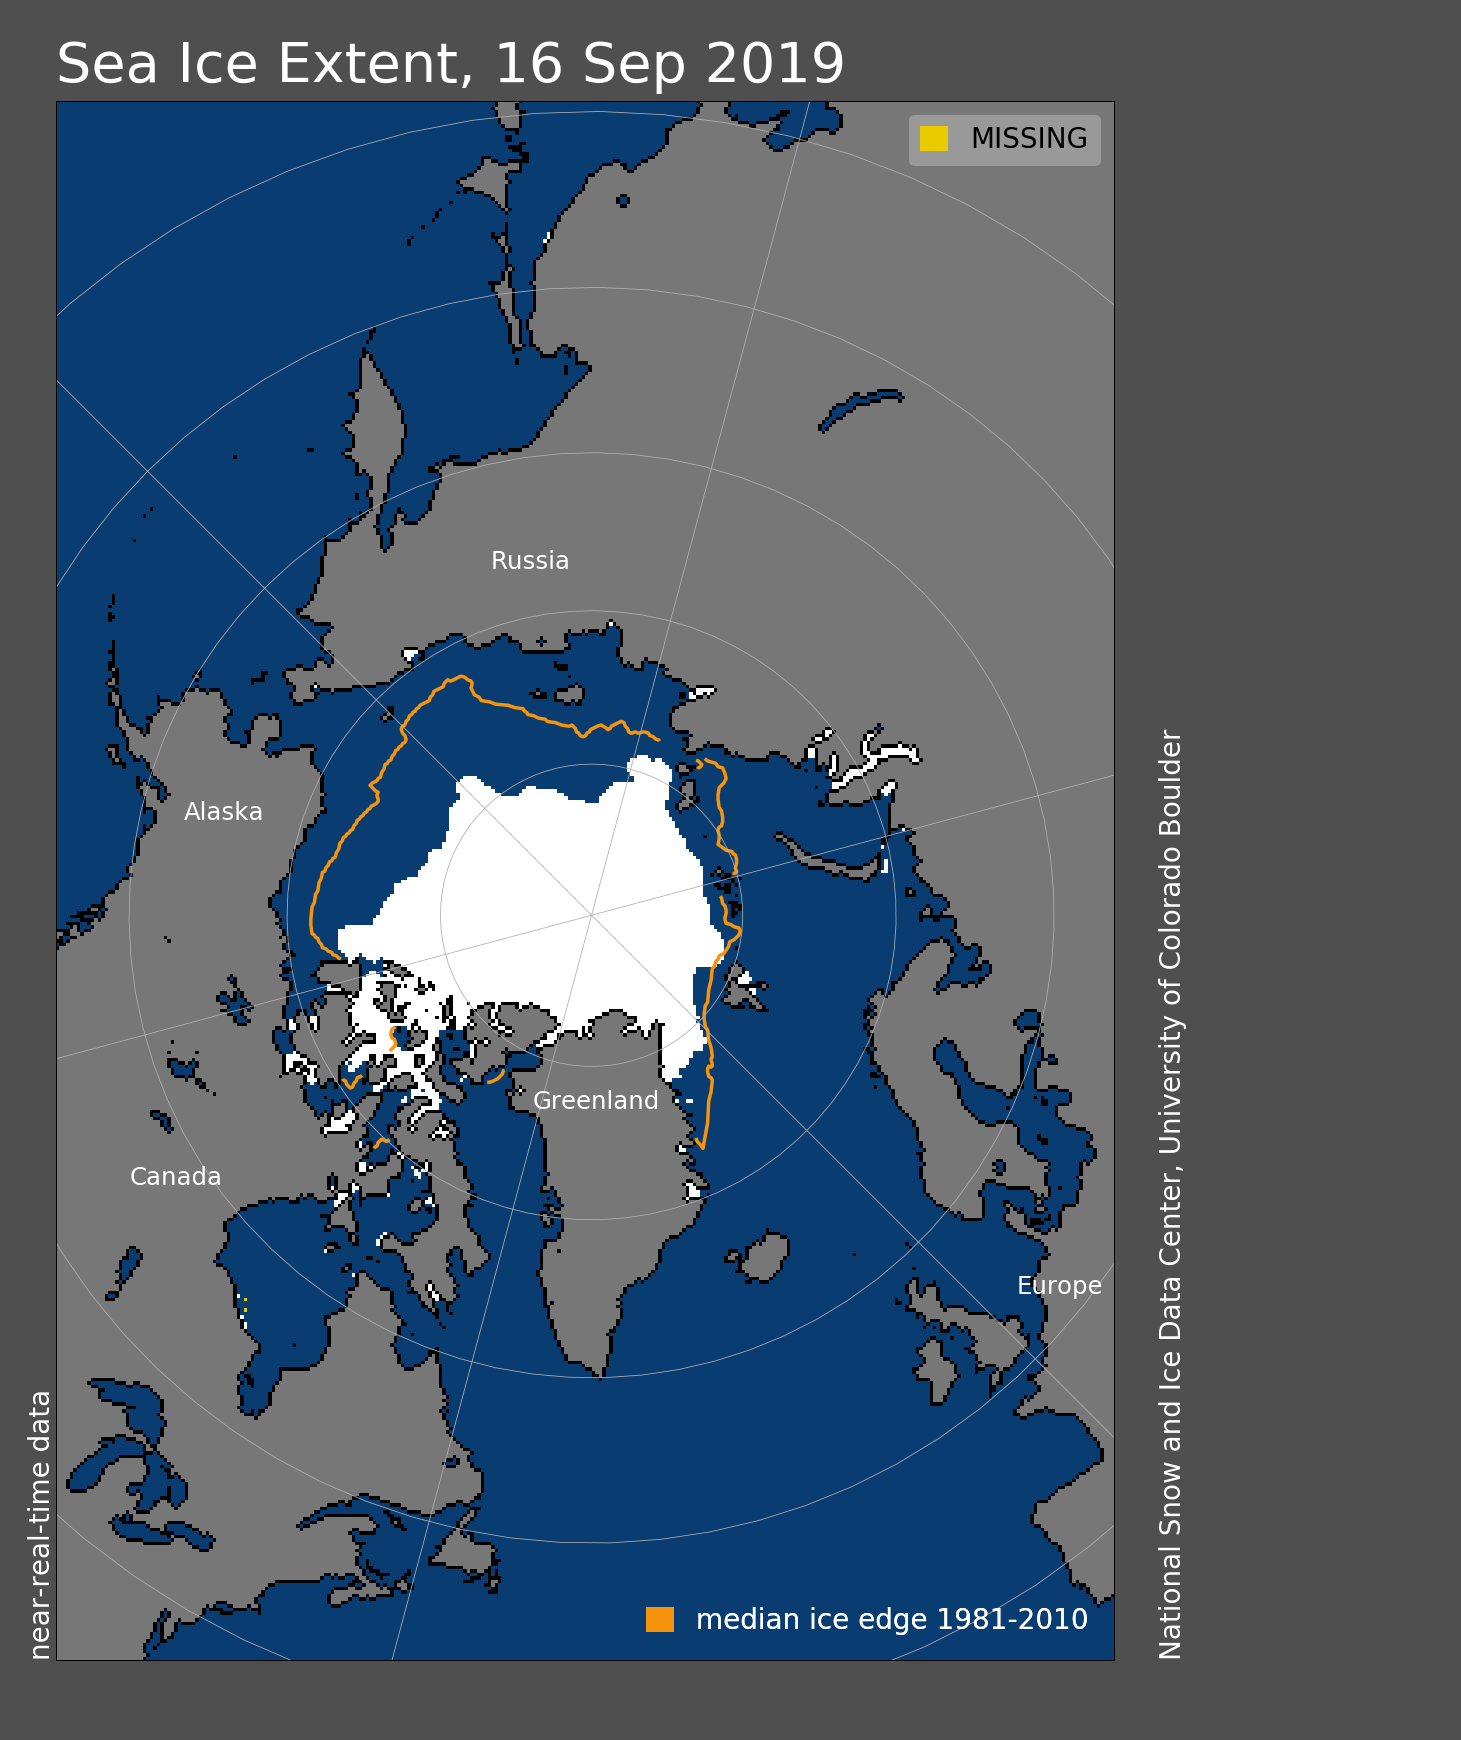
Figure 1. Arctic sea ice extent for September 16, 2019, was 4.21 million square kilometers (1.62 million square miles). The orange line shows the 1981 to 2010 average extent for that day. Sea Ice Index data. About the data
Credit: National Snow and Ice Data Center
High-resolution image
Arctic sea ice extent was 4.21 million square kilometers (1.62 million square miles) on September 16, which is likely near the seasonal minimum extent that is expected within the next week. The last two weeks have seen periods of declining extent along with periods of little change or even gains in extent. From August 30 through September 5, there was a total loss of about 320,000 square kilometers (123,600 square miles). The ice cover then experienced an increase in extent from September 7 through 10. From September 10 through 16, the decline resumed, dropping 118,000 square kilometers (45,600 square miles).
Conditions in context
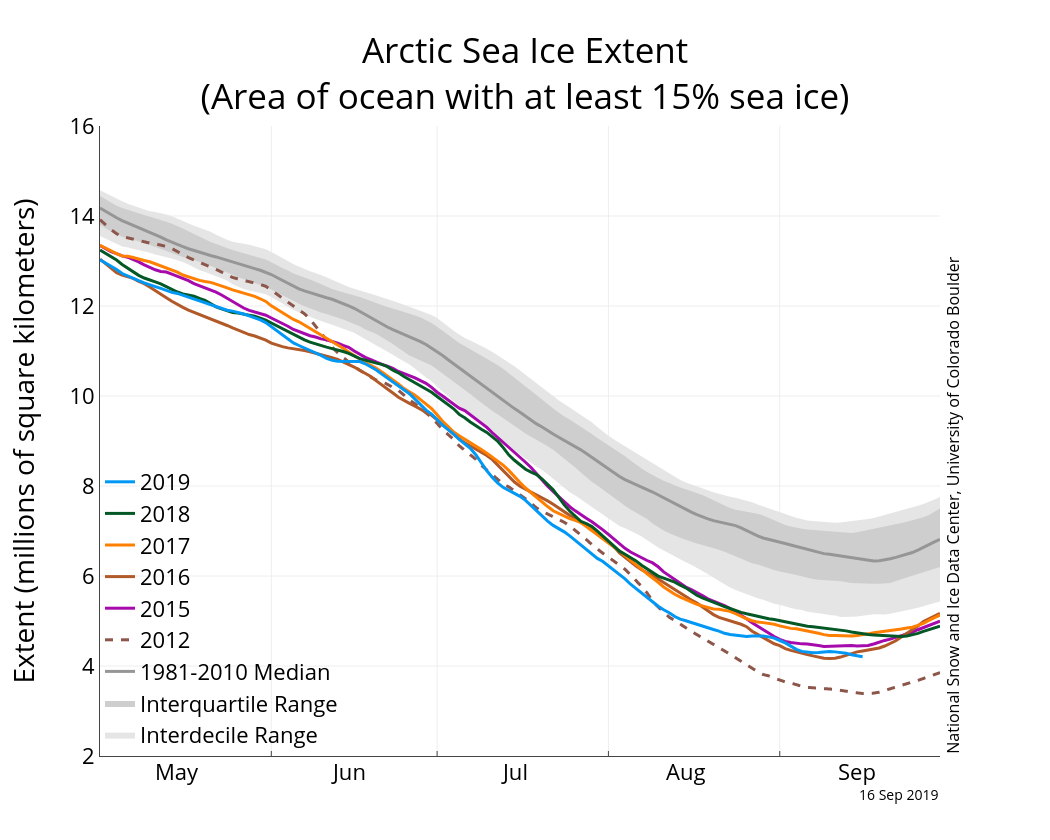
Figure 2a. The graph above shows Arctic sea ice extent as of September 16, 2019, along with daily ice extent data for four previous years and the record low year. 2019 is shown in blue, 2018 in green, 2017 in orange, 2016 in brown, 2015 in purple, and 2012 in dotted brown. The 1981 to 2010 median is in dark gray. The gray areas around the median line show the interquartile and interdecile ranges of the data. Sea Ice Index data.
Credit: National Snow and Ice Data Center
High-resolution image
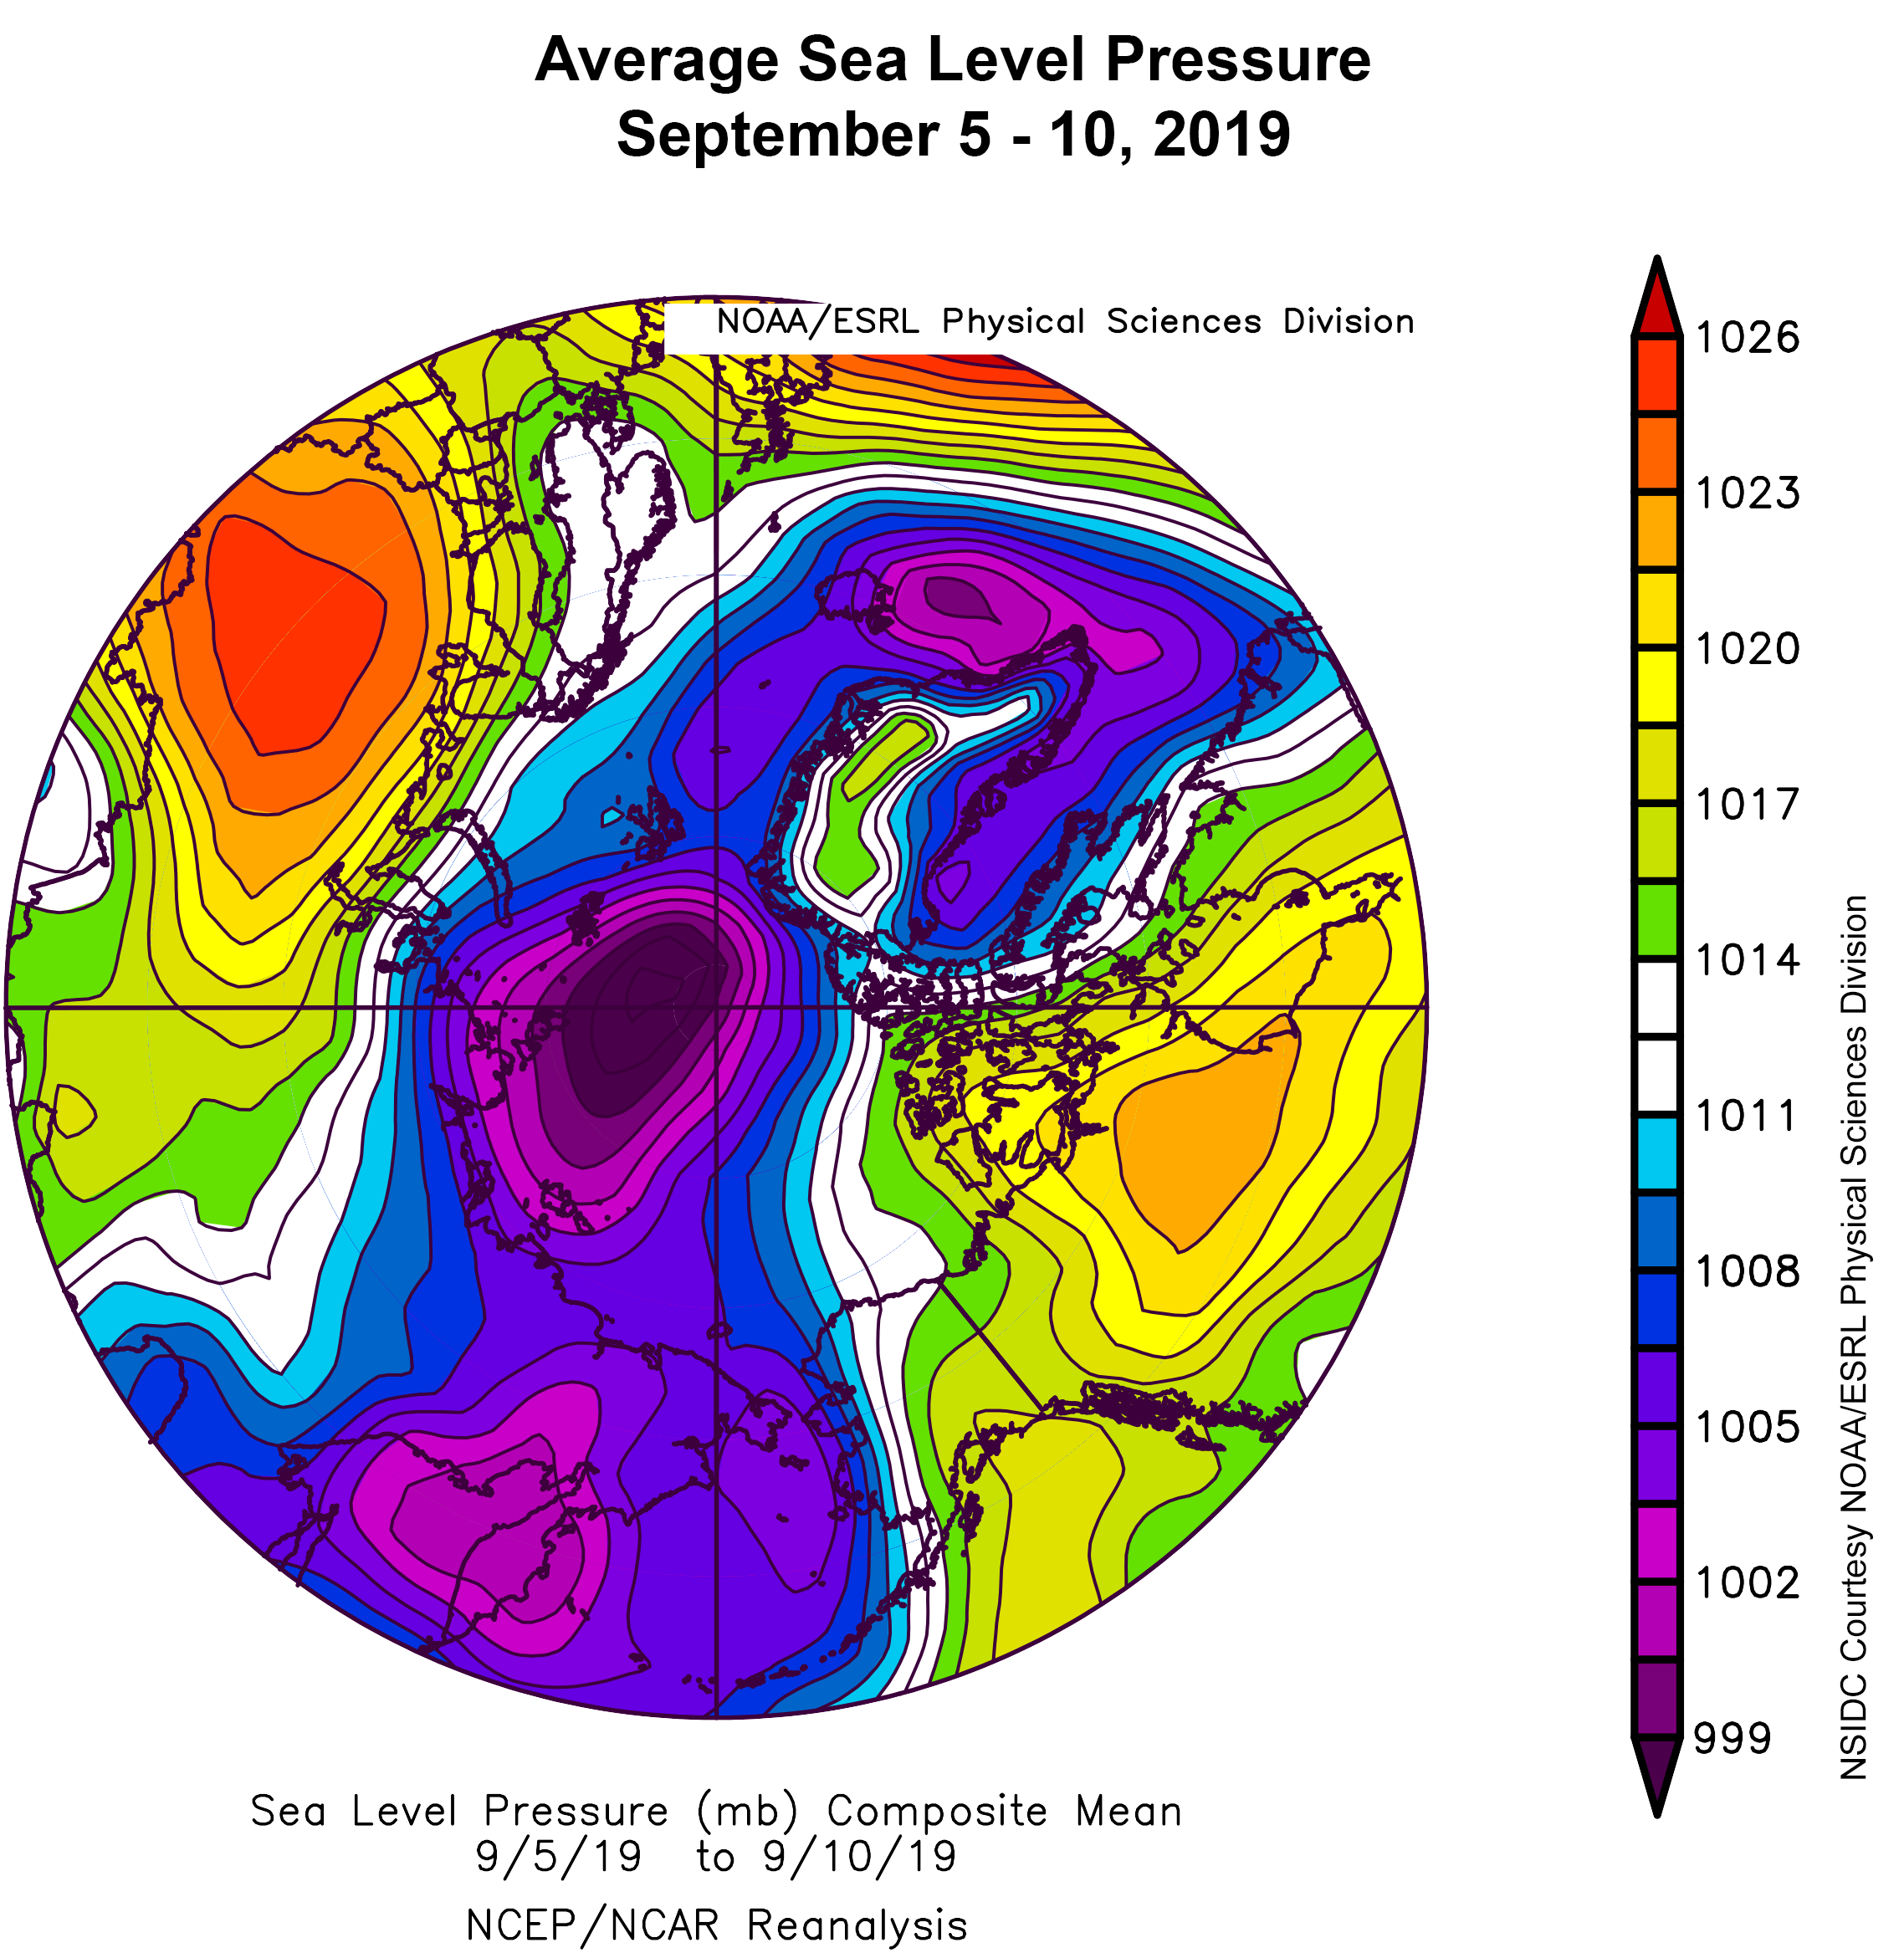
Figure 2b. This plot shows average sea level pressure in the Arctic in millibars (hPa) for September 5 to 10, 2019. Yellows and reds indicate high air pressure; blues and purples indicate low pressure.
Credit: NSIDC courtesy NOAA Earth System Research Laboratory Physical Sciences Division
High-resolution image
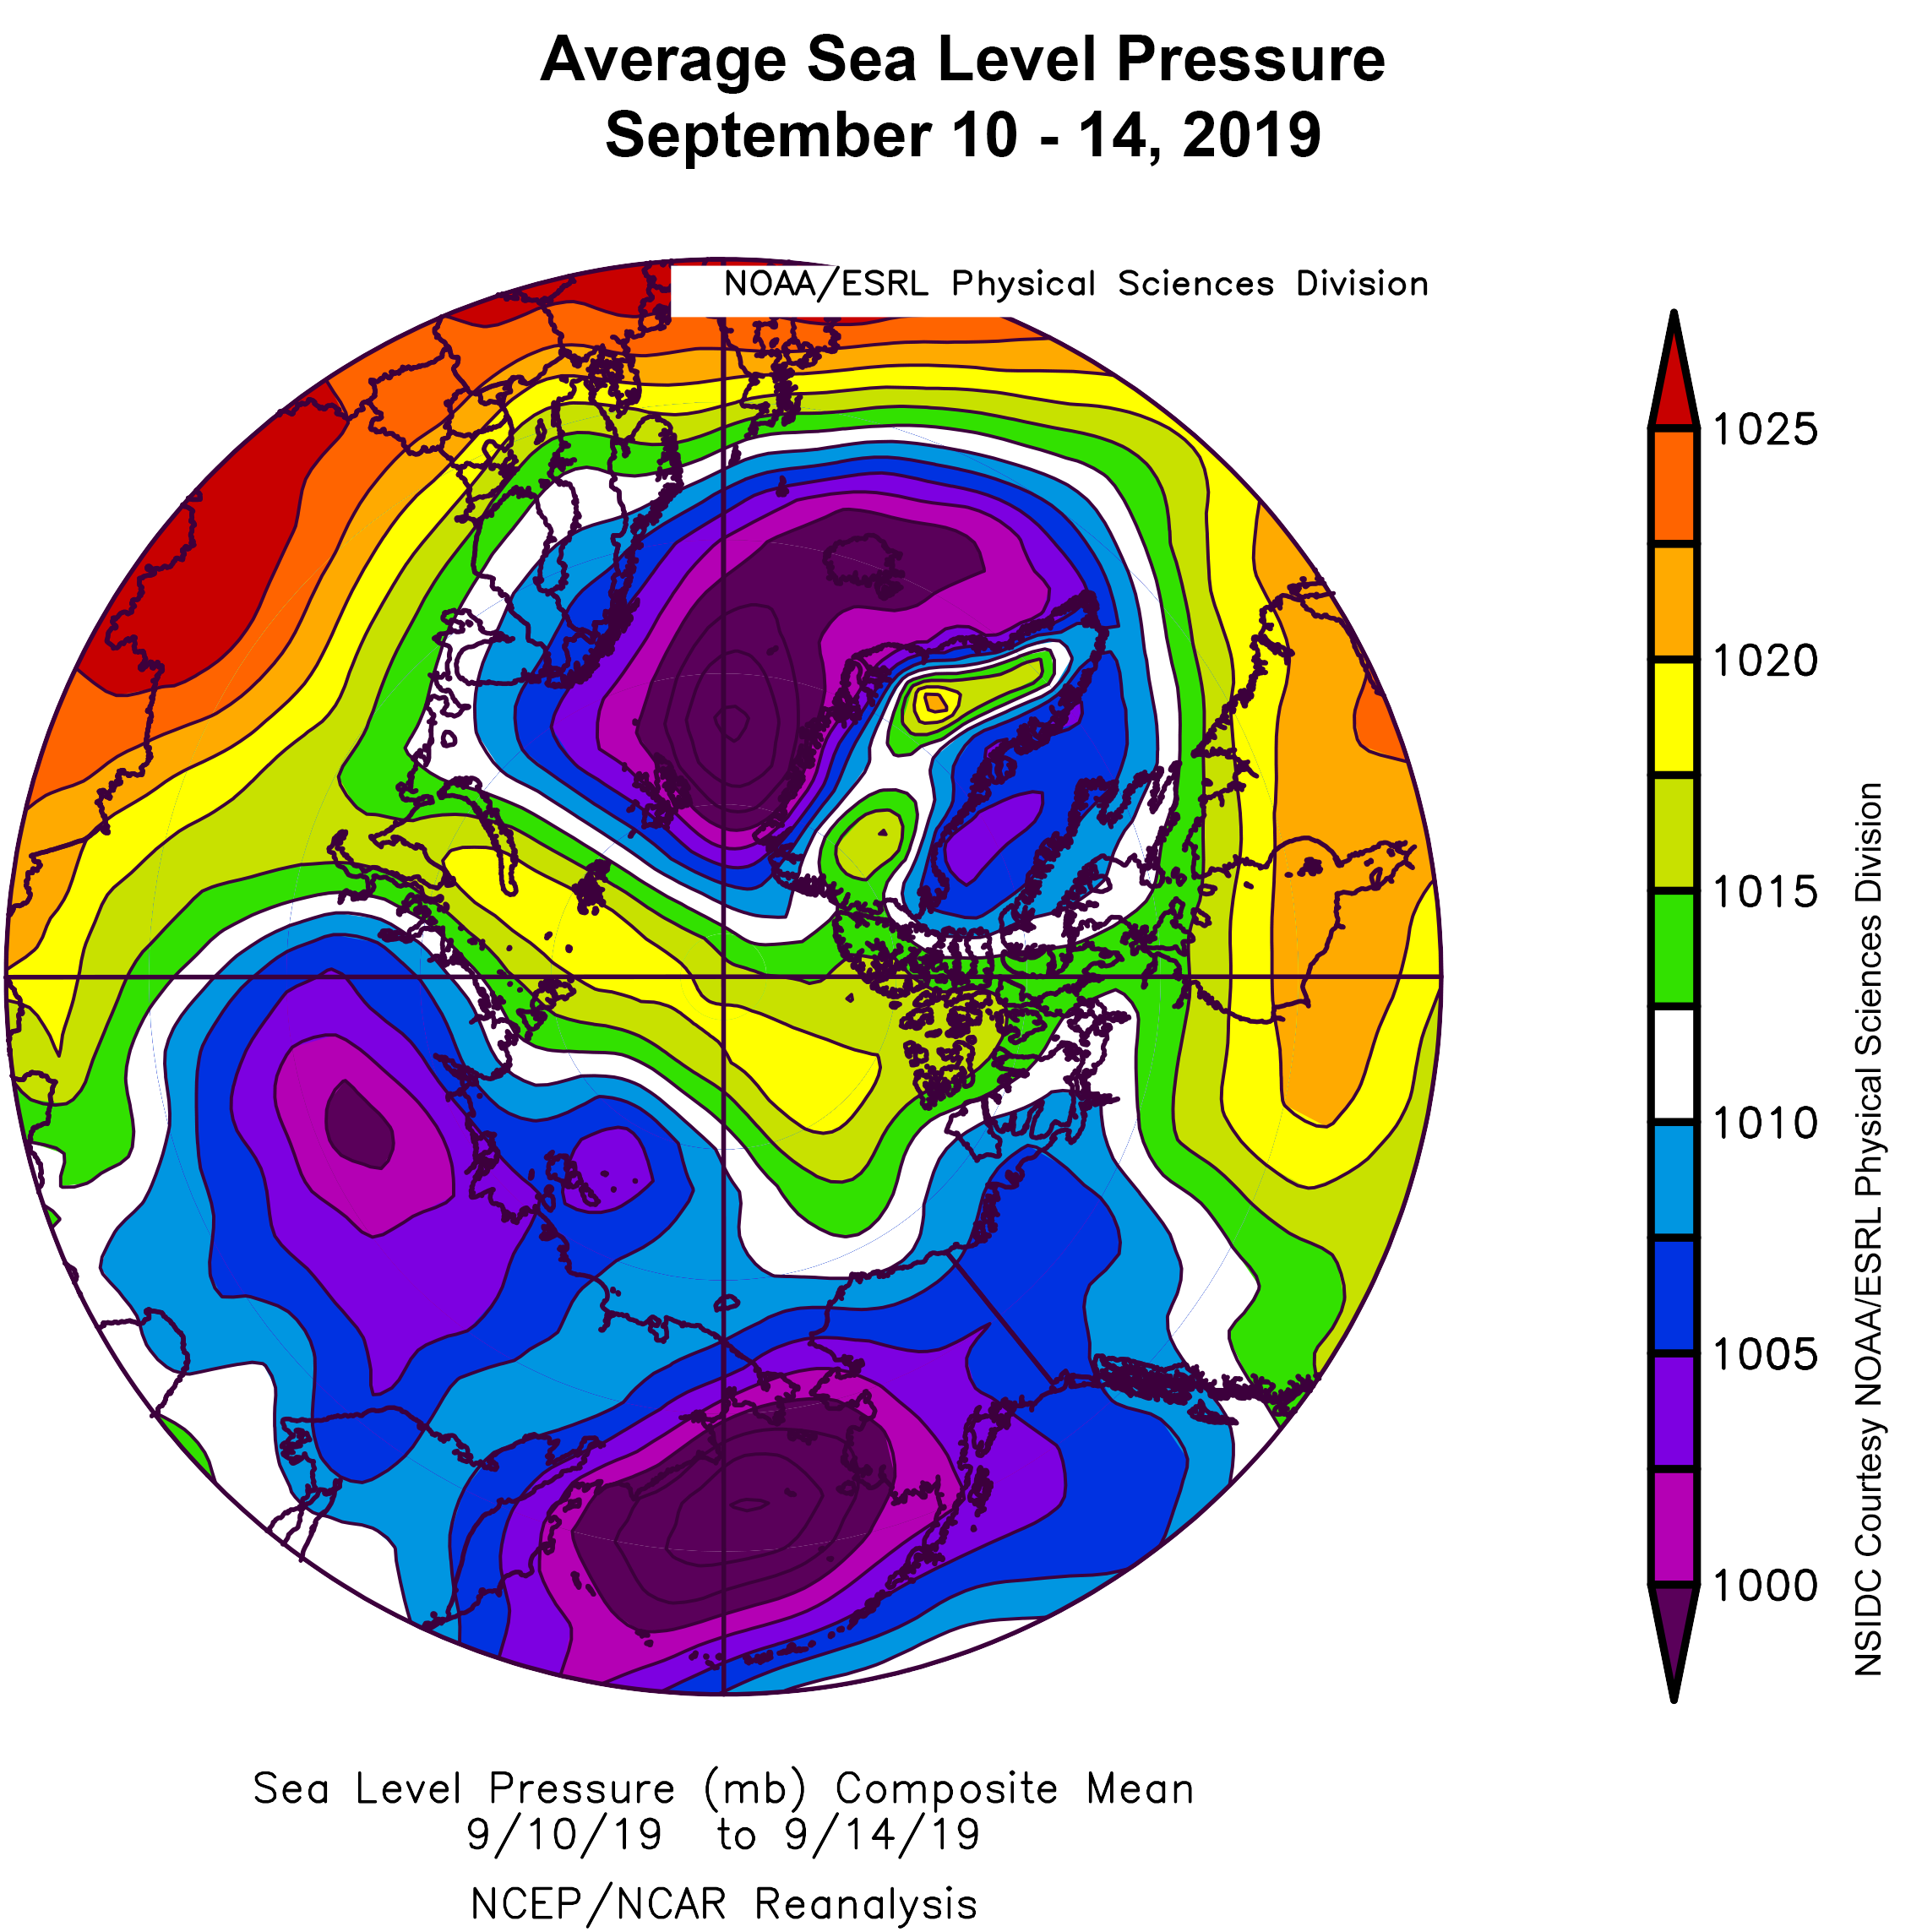
Figure 2c. This plot shows average sea level pressure in the Arctic in millibars (hPa) for September 10 to 14, 2019. Yellows and reds indicate high air pressure; blues and purples indicate low pressure.
Credit: NSIDC courtesy NOAA Earth System Research Laboratory Physical Sciences Division
High-resolution image
Rises and falls in extent are not unusual when nearing the sea ice minimum; the sea ice edge is in near-equilibrium with ocean and atmospheric temperatures. However, variable winds can either push the edge outward to increase ice extent or compact areas of lower-concentration ice to decrease ice extent. From August 26 to August 30, the overall change in extent was near zero; surface winds as depicted in the NCEP Reanalysis during this period pushed ice southward in Beaufort, Chukchi, and East Siberian Seas sectors, while winds from the south led to declines in extent in the East Greenland and Barents Seas.
From August 30 through September 5, strong winds from the south in the Beaufort, Chukchi, and East Siberian Seas pushed the ice edge northward. Essentially, the expansion at the end of August was reversed. Ice loss in the East Greenland Sea and the Canadian Archipelago also contributed to the overall extent decline during this period.
Conditions changed once again from September 5 through September 10. Extent declined only slightly until September 7 and then increased. Again, variable winds played a leading role. Winds from the north persisted on the Pacific side of the Arctic Ocean, but strong winds from the west in the Barents, Kara, and East Greenland Seas, as indicated by strong low pressure centered near the North Pole (Figure 2b), led to an increase in extent there. The Canadian Archipelago region also gained ice, reflecting low temperatures and the onset of freeze-up.
After September 10, the decline in ice extent resumed, with losses particularly north of Svalbard and between Svalbard and Franz Josef Land. This was related to northward winds as a low pressure center moved south to the east of Greenland. To a lesser degree, the ice also retreated northward on the Pacific side, also related to northward winds in the Chukchi and East Siberian Sea sectors. Southward winds prevailed in the Beaufort Sea, but these did not extend the ice edge southward, possibly because of warm waters that melted ice. Ice growth continued in the Canadian Archipelago.
Sea ice hanging on in the Beaufort Sea
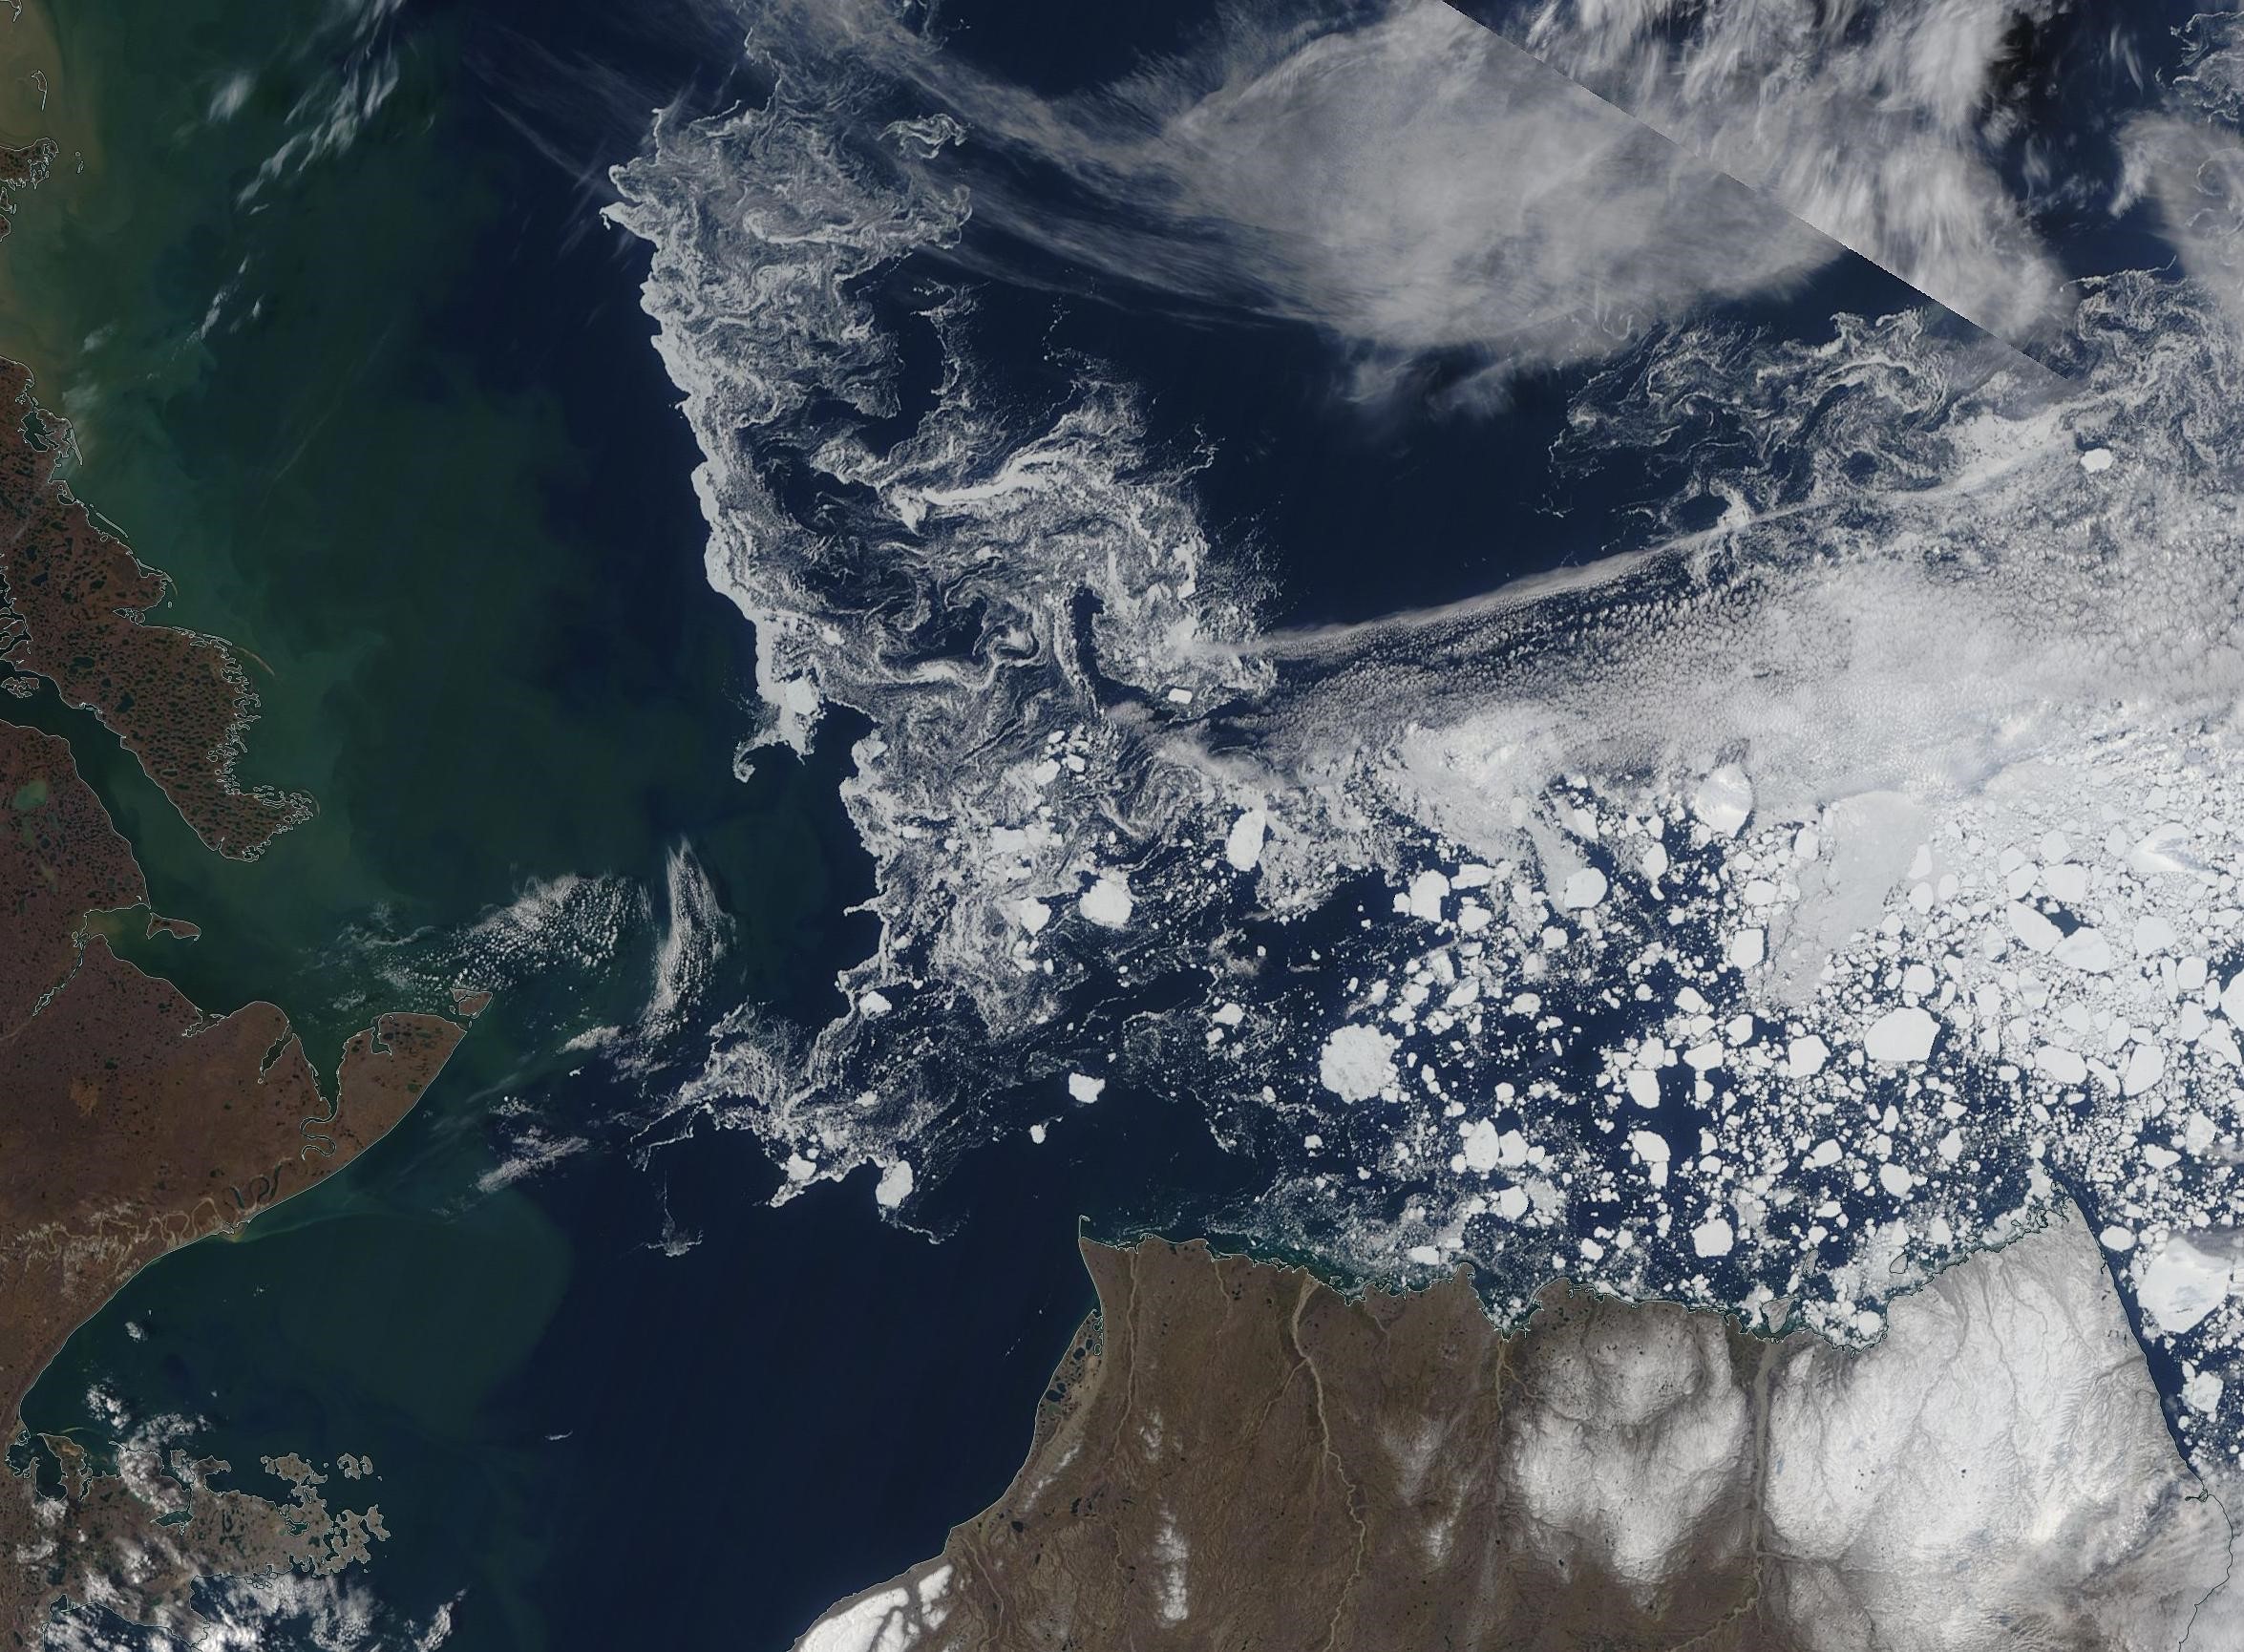
Figure 3. This shows a true-color composite image of a tongue of ice that has persisted in the eastern Beaufort Sea. This tongue mostly consists of thin, small floes of ice close to melting completely, interspersed by thicker, large floes and (likely) multi-year ice. Image taken by the Moderate Resolution Imaging Spectroradiometer (MODIS) sensor on the NASA Terra satellite on September 9, 2019.
Credit: Land Atmosphere Near-Real Time Capability for EOS (LANCE) System, NASA/GSFC.
High-resolution image
While most of the ice in the Beaufort Sea has melted out well beyond the Alaskan and Canadian coasts, a tongue of ice has persisted in the eastern Beaufort, just off the western coast of Banks Island. MODIS imagery from NASA Worldview shows that this tongue mostly consists of thin, small floes of ice close to melting completely, interspersed by thicker, large floes and (likely) multi-year ice. Most of this ice will likely survive the melt season.
Shipping passages and the MOSAiC expedition
The southern (Amundsen) route of the Northwest Passage appears to be open, but only via the narrow Bellot Strait between Somerset Island and the Boothia Peninsula; the wider passage through Peel Sound on the west side of Somerset Island still has ice in the mouth of the sound. The Northern Sea Route is open with the largest constriction just east of Severnaya Zemlya.
The German icebreaker Polarstern will leave port from Tromso, Norway, on September 20 and head north into the ice. It will be frozen into Arctic sea ice for the next year as part of the MOSAiC expedition, and scientists aboard will conduct numerous experiments—collecting data on ocean, ice, and atmospheric conditions. The U.S. lead scientist for the project, Matthew Shupe, is at the Cooperative Institute for Research in Environmental Sciences (CIRES), of which NSIDC is a part. NSIDC senior research scientist Julienne Stroeve will be on the ship for several weeks this coming winter. Readers can expect much more information on MOSAiC from CIRES in the coming months.

