As 2018 came to a close, Arctic sea ice extent was tracking at its third lowest level in the satellite record, while sea ice in the Antarctic remained at historic lows. Slightly faster growth in the first few days of the new year, mostly in the Pacific sea ice areas, has the daily sea ice extent at fifth lowest as of this post.
Overview of conditions

Figure 1. Arctic sea ice extent for December, 2018 was 11.86 million square kilometers (4.60 million square miles). The magenta line shows the 1981 to 2010 average extent for that day. Sea Ice Index data. About the data
Credit: National Snow and Ice Data Center
High-resolution image
Arctic sea ice extent for December averaged 11.86 million square kilometers (4.60 million square miles). This was the fourth lowest December average in the 1979 to 2018 satellite record, falling 980,000 square kilometers (378,000 square miles) below the 1981 to 2010 average, and 400,000 square kilometers (154,000 square miles) above the record December low set in 2016. However, slow ice growth during the second half of the month resulted in an ice extent that was tracking third lowest for December 31. Since then, growth has sped up, especially within the Sea of Okhotsk and to a lesser degree in the southwestern Kara Sea, bringing the daily sea ice extent up to the fifth lowest in the satellite record.
As has been typical the last few winters, sea ice extent remained below average within the Kara and Barents Seas, tracking third lowest in the Barents Sea as of December 31 and second lowest for the month of December as a whole. December extent in the Kara Sea was the fifth lowest for the month. Much of the area around Svalbard remains ice free. Elsewhere, ice extent tracked near average for this time of year, including in the Chukchi Sea where the ice was slow to form this past winter.
Conditions in context
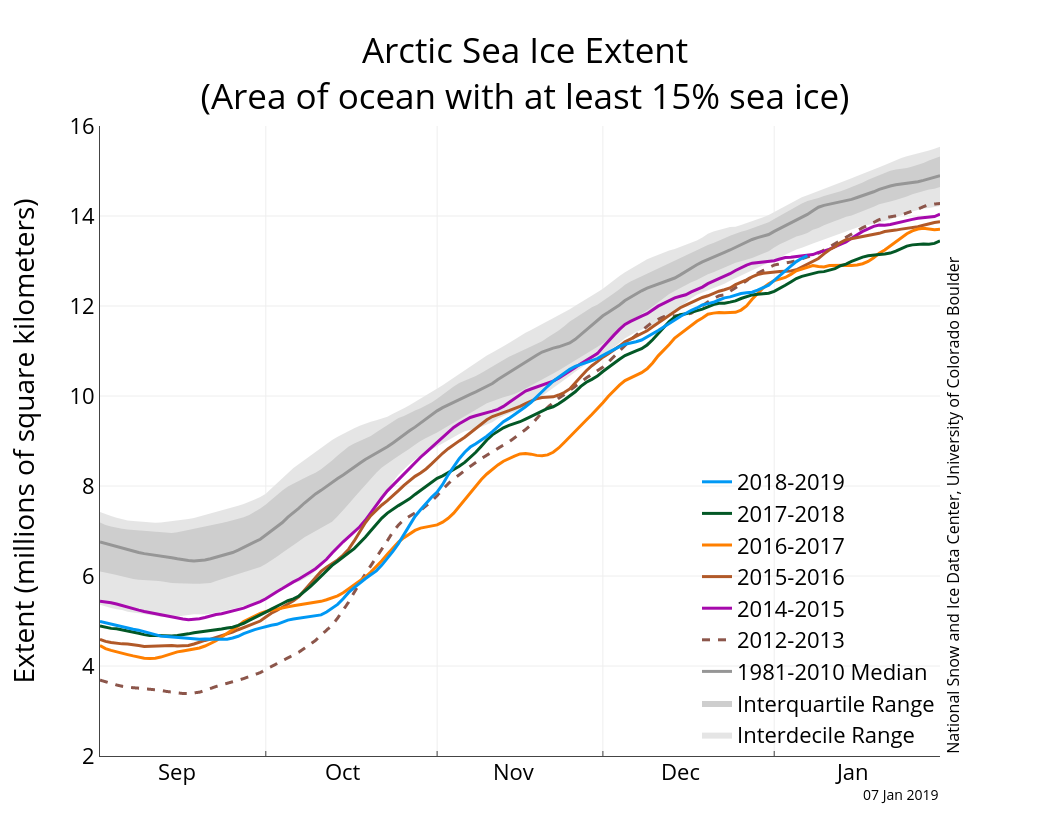
Figure 2a. The graph above shows Arctic sea ice extent as of January 7, 2018, along with daily ice extent data for four previous years and the record low year. 2018 to 2019 is shown in blue, 2017 to 2018 in green, 2016 to 2017 in orange, 2015 to 2016 in brown, 2014 to 2015 in purple, and 2012 to 2013 in dotted brown. The 1981 to 2010 median is in dark gray. The gray areas around the median line show the interquartile and interdecile ranges of the data. About the data
Credit: National Snow and Ice Data Center
High-resolution image
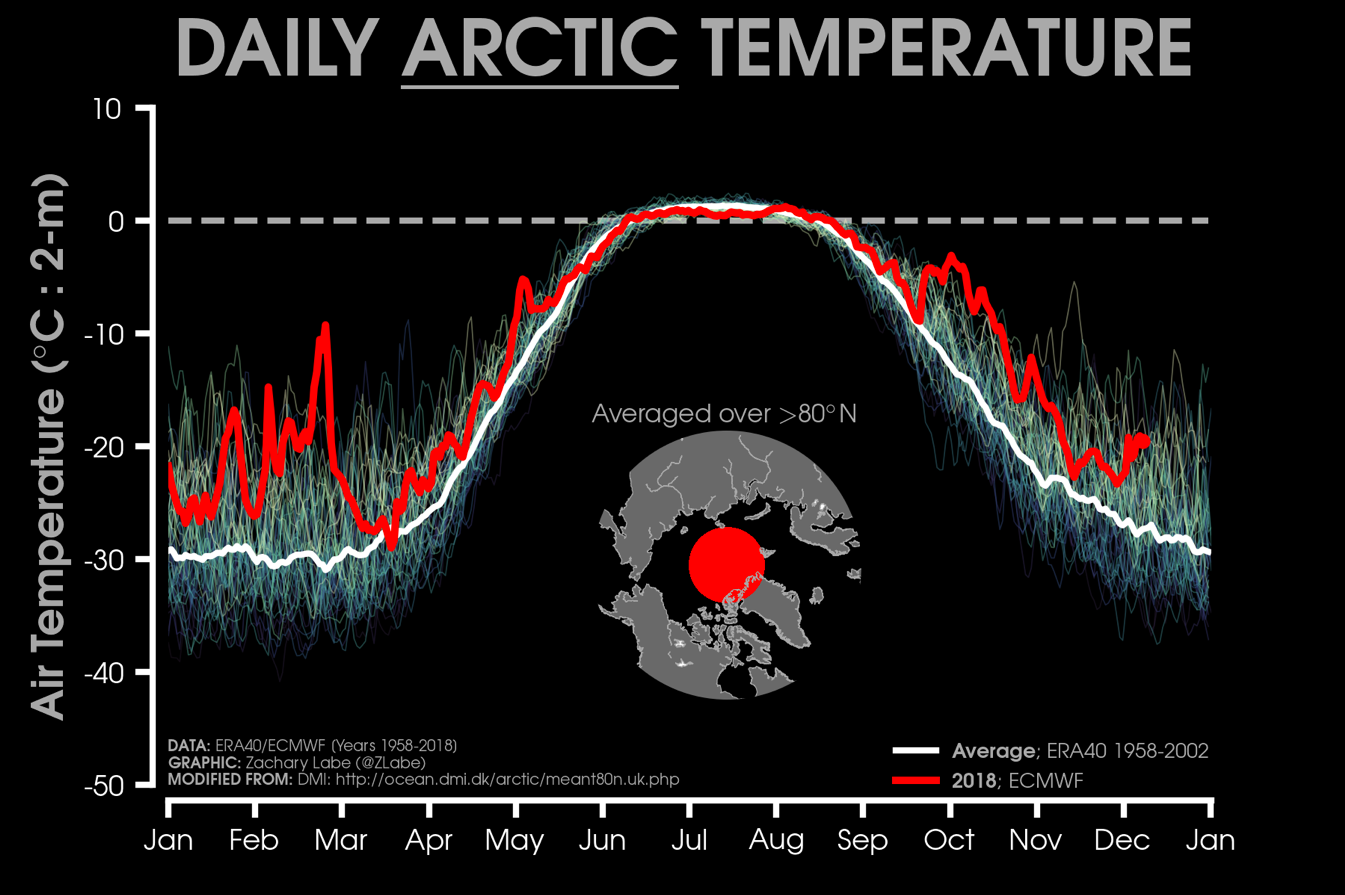
Figure 2b. This graph shows daily air temperatures at 2 meters for the Arctic averaged above 80 degrees North from Zachary Labe, using ERA40 for the 1958 to 2002 climatology (blue line) and the operational European Centre for Medium-Range Weather Forecasts (ECMWF) for the current year (in red).
Figure is modified from the Danish Meteorological Institute
High-resolution image
Unfortunately, as a result of the partial government shutdown, we are unable to access the National Oceanic and Atmospheric Administration (NOAA) pages to retrieve information on atmospheric air temperatures and sea level pressure patterns. Instead, we turn to daily (2 meters above the surface) mean air temperatures north of 80 degrees North from the European Centre for Medium-Range Weather Forecasts (ECMWF) operational model. This analysis shows that air temperatures remained above the 1958 to 2002 average for all of December (Figure 2b).
December 2018 compared to previous years

Figure 3. Monthly December ice extent for 1979 to 2018 shows a decline of 3.7 percent per decade.
Credit: National Snow and Ice Data Center
High-resolution image
Overall, sea ice extent during December 2018 increased 1.63 million square kilometers (629,000 square miles). This is 358,000 square kilometers (138,000 square miles) less ice gained than the December 1981 to 2010 average. The linear rate of sea ice decline for December is 47,200 square kilometers (18,200 square miles) per year, or 3.7 percent per decade relative to the 1981 to 2010 average.
Southern exposure
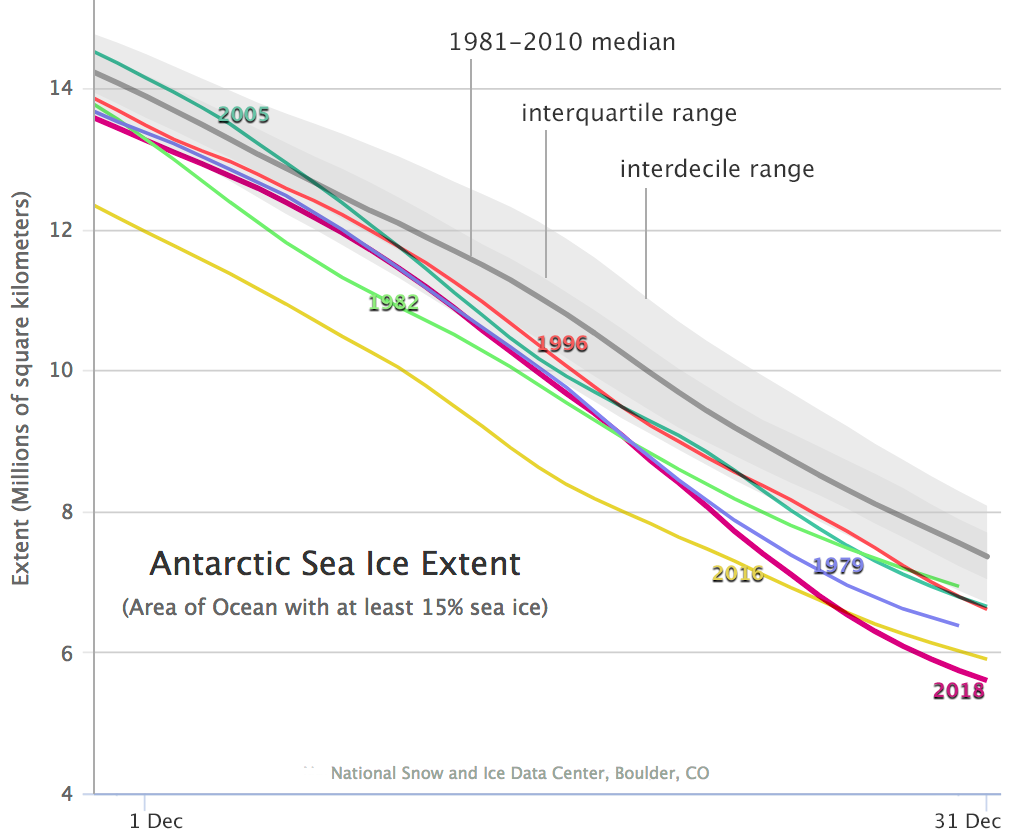
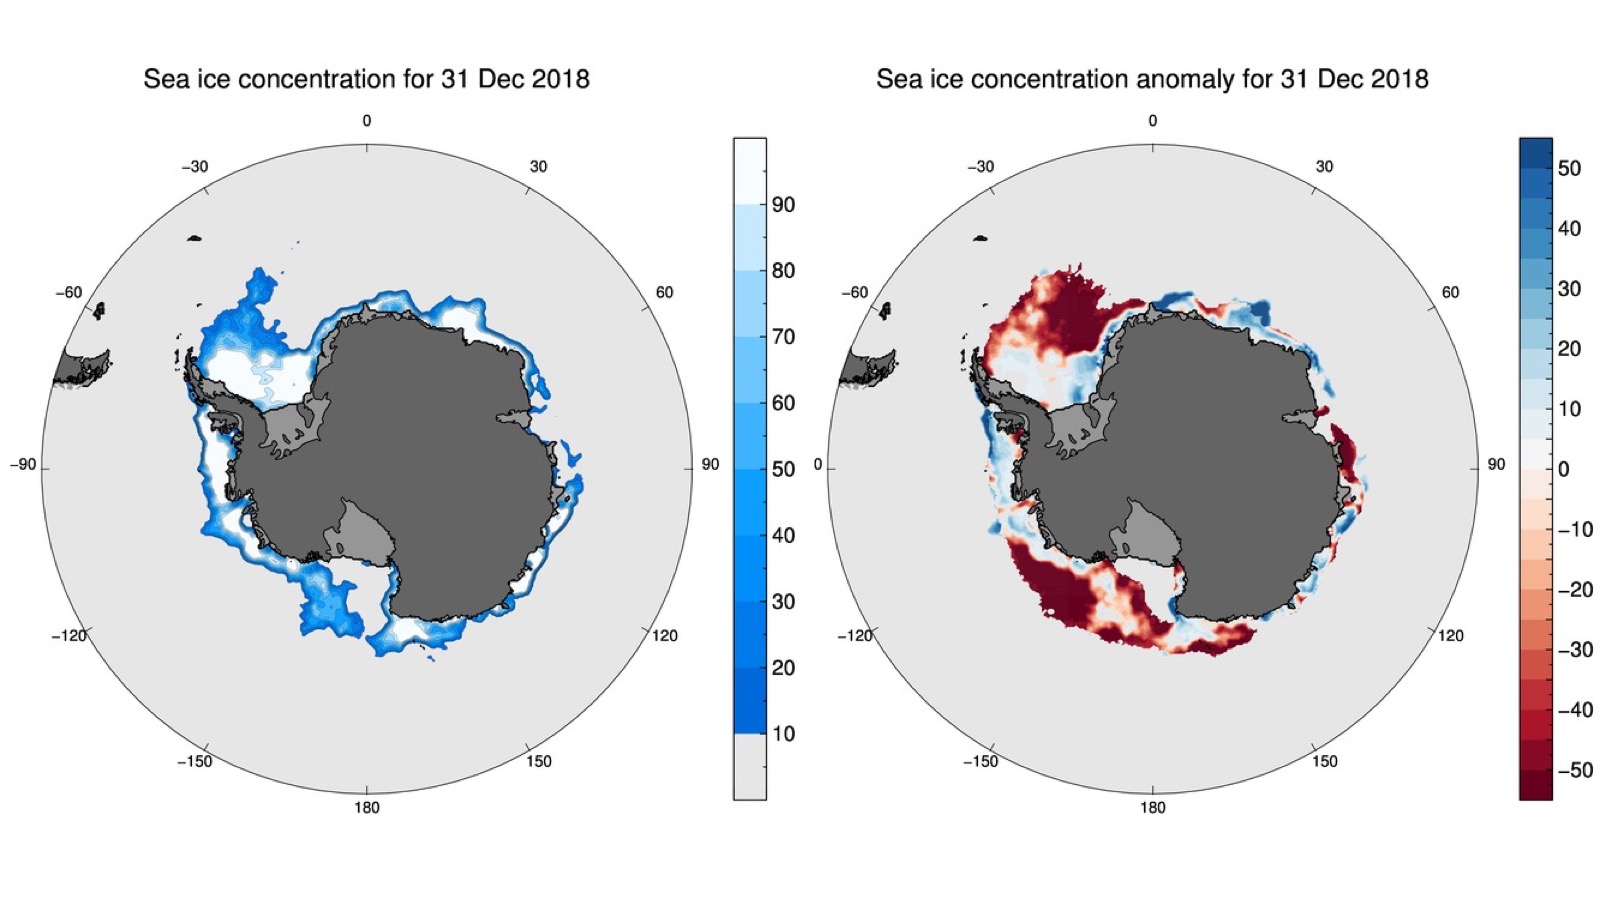
As noted in our post last week, Antarctic sea ice declined at a rate well above the 1981 to 2010 average for the last three weeks of December, leading to record low extent for this time of year. This pattern has continued through the first week of 2019, with areas of the northern and eastern Weddell Sea and the central Ross Sea losing ice extent.
2018 year in review

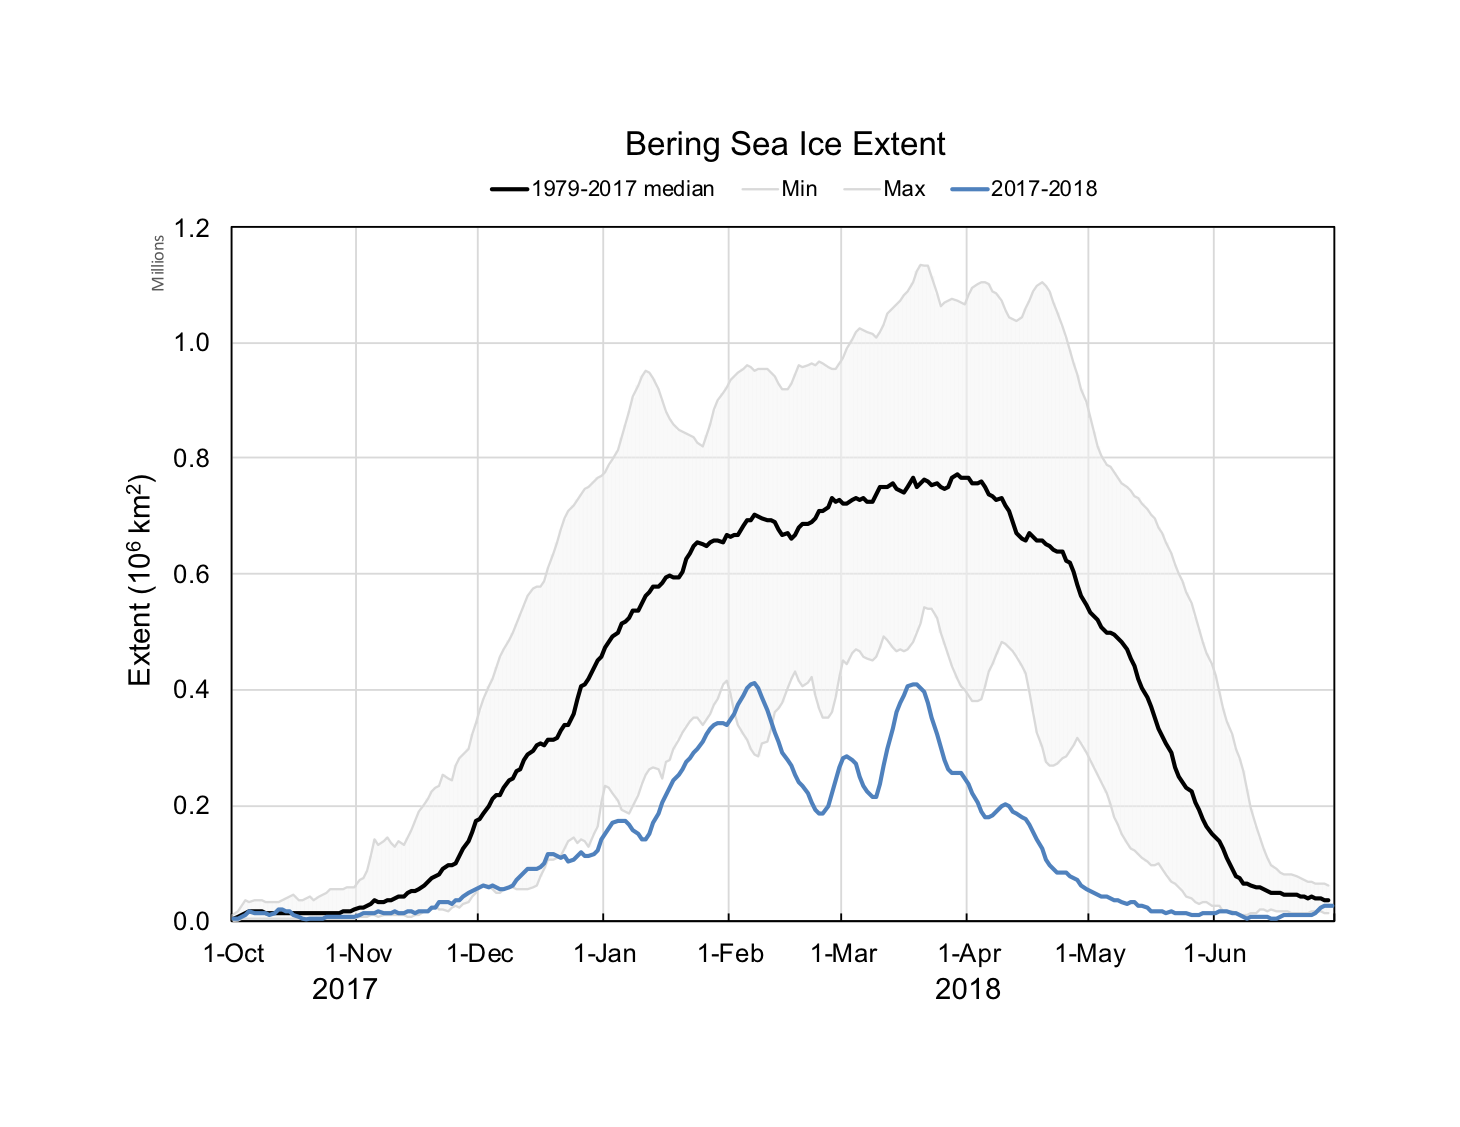
Figure 4. This graph shows the Bering Sea ice extent for 2017 to 2018 (blue) compared to the 1979 to 2017 median (black) and the 1979 to 2017 minimum to maximum range (gray shading).
Credit: W. Meier, NSIDC
High-resolution image

Figure 5. This figure shows departures from average sea ice extent in the Arctic Ocean relative to 1981 to 2010 from 1850 to 2018. Above average extent is shown by red and orange colors, while below average extent is shown in blue colors.
Credit: Updated from Walsh et al., 2015. Gridded Monthly Sea Ice Extent and Concentration, 1850 Onward, Version 1
High-resolution image
January 2018 began the year with record low sea ice extents for the Arctic as a whole. Regionally, below average ice extent characterized both the Kara and Barents Seas and the Chukchi and Bering Seas. This pattern continued into February and early March. The low sea ice conditions in the Bering Sea persisted throughout the entire winter and were the lowest ever recorded during the satellite record (Figure 4). In particular, the ice in the region significantly declined in February—normally the time when extent is reaching its seasonal maximum. As reported in the NOAA Arctic Report Card, during a two and a half week period in mid-February, the Bering Sea ice extent dropped by over 225,000 square kilometers (87,000 square miles), an area roughly the size of Idaho.
The seasonal maximum, reached on March 17, 2018, was the second lowest in the satellite record. While low extent persisted through April and May, sea ice loss during early summer was unremarkable despite above average 925 hPa air temperatures over the Arctic Ocean and Eurasia. Antarctica reached its second-lowest annual minimum on February 20 and 21, and extent remained low throughout the year. However, the locations of the regional departures from average shifted during the year, as is often the case. Extent in the northern and eastern margins of the Weddell Sea were persistently low.
Air temperatures over the Arctic Ocean in July were below average, followed by above average temperatures in August. In fact, on average, August temperatures were higher than July temperatures in 2018. This is highly unusual in the Arctic and something not seen in at least 40 years. Overall the June, July, and August mean 925 hPa air temperatures over the Arctic Ocean ranked as the sixth highest since 1979.
The September 2018 seasonal minimum extent ended up slightly above the long-term linear trend line, tying with 2008 for the sixth lowest in the satellite record. After the minimum, the ocean was slow to freeze up, and October sea ice extent ended up as the third lowest. However, ice growth was very rapid in November, such that November 2018 extent approached the interquartile range of the 1981 to 2010 median. Nevertheless, large amounts of open water remained in the Barents and Chukchi Seas. By the end of December, ice conditions in the Chukchi Sea were back to average, while extent remained unusually low in the Barents Sea.
Coverage of old ice (greater than 4 years old) over the Arctic continued to decline. Such old ice covers only 5 percent of the area it used to in 1980s.
It is interesting to compare these conditions to historical reconstructions. Today’s departures from average conditions are quite remarkable when viewed over the last 160+ years (Figure 5). While some lower than average (computed 1981 to 2010) winter and summer sea ice conditions occurred prior to the satellite data record, they were not as large in magnitude or as persistent as recent departures have been. Further, recent years have shown unusually low sea ice extent persisting well into autumn and winter, reflecting a distinct change in seasonality in the Arctic compared to earlier years with low summer ice conditions.


