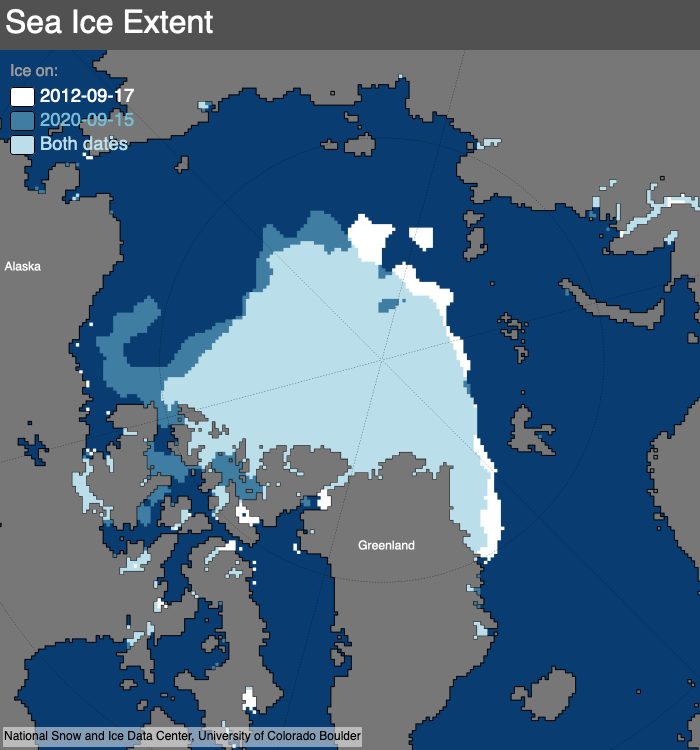
As of July 13, Arctic sea ice extent was tracking just below the 2012 record and very close to 2020, the years with the lowest and second lowest (tied with 2007) minimum ice extent in the satellite record. The Laptev Sea is essentially ice free. Multiyear ice persists close to the Alaskan shoreline near Utqiaġvik (formerly Barrow), and low atmospheric pressure persists over the central Arctic Ocean, forcing a pronounced cyclonic (counterclockwise) ice motion pattern.
Overview of conditions
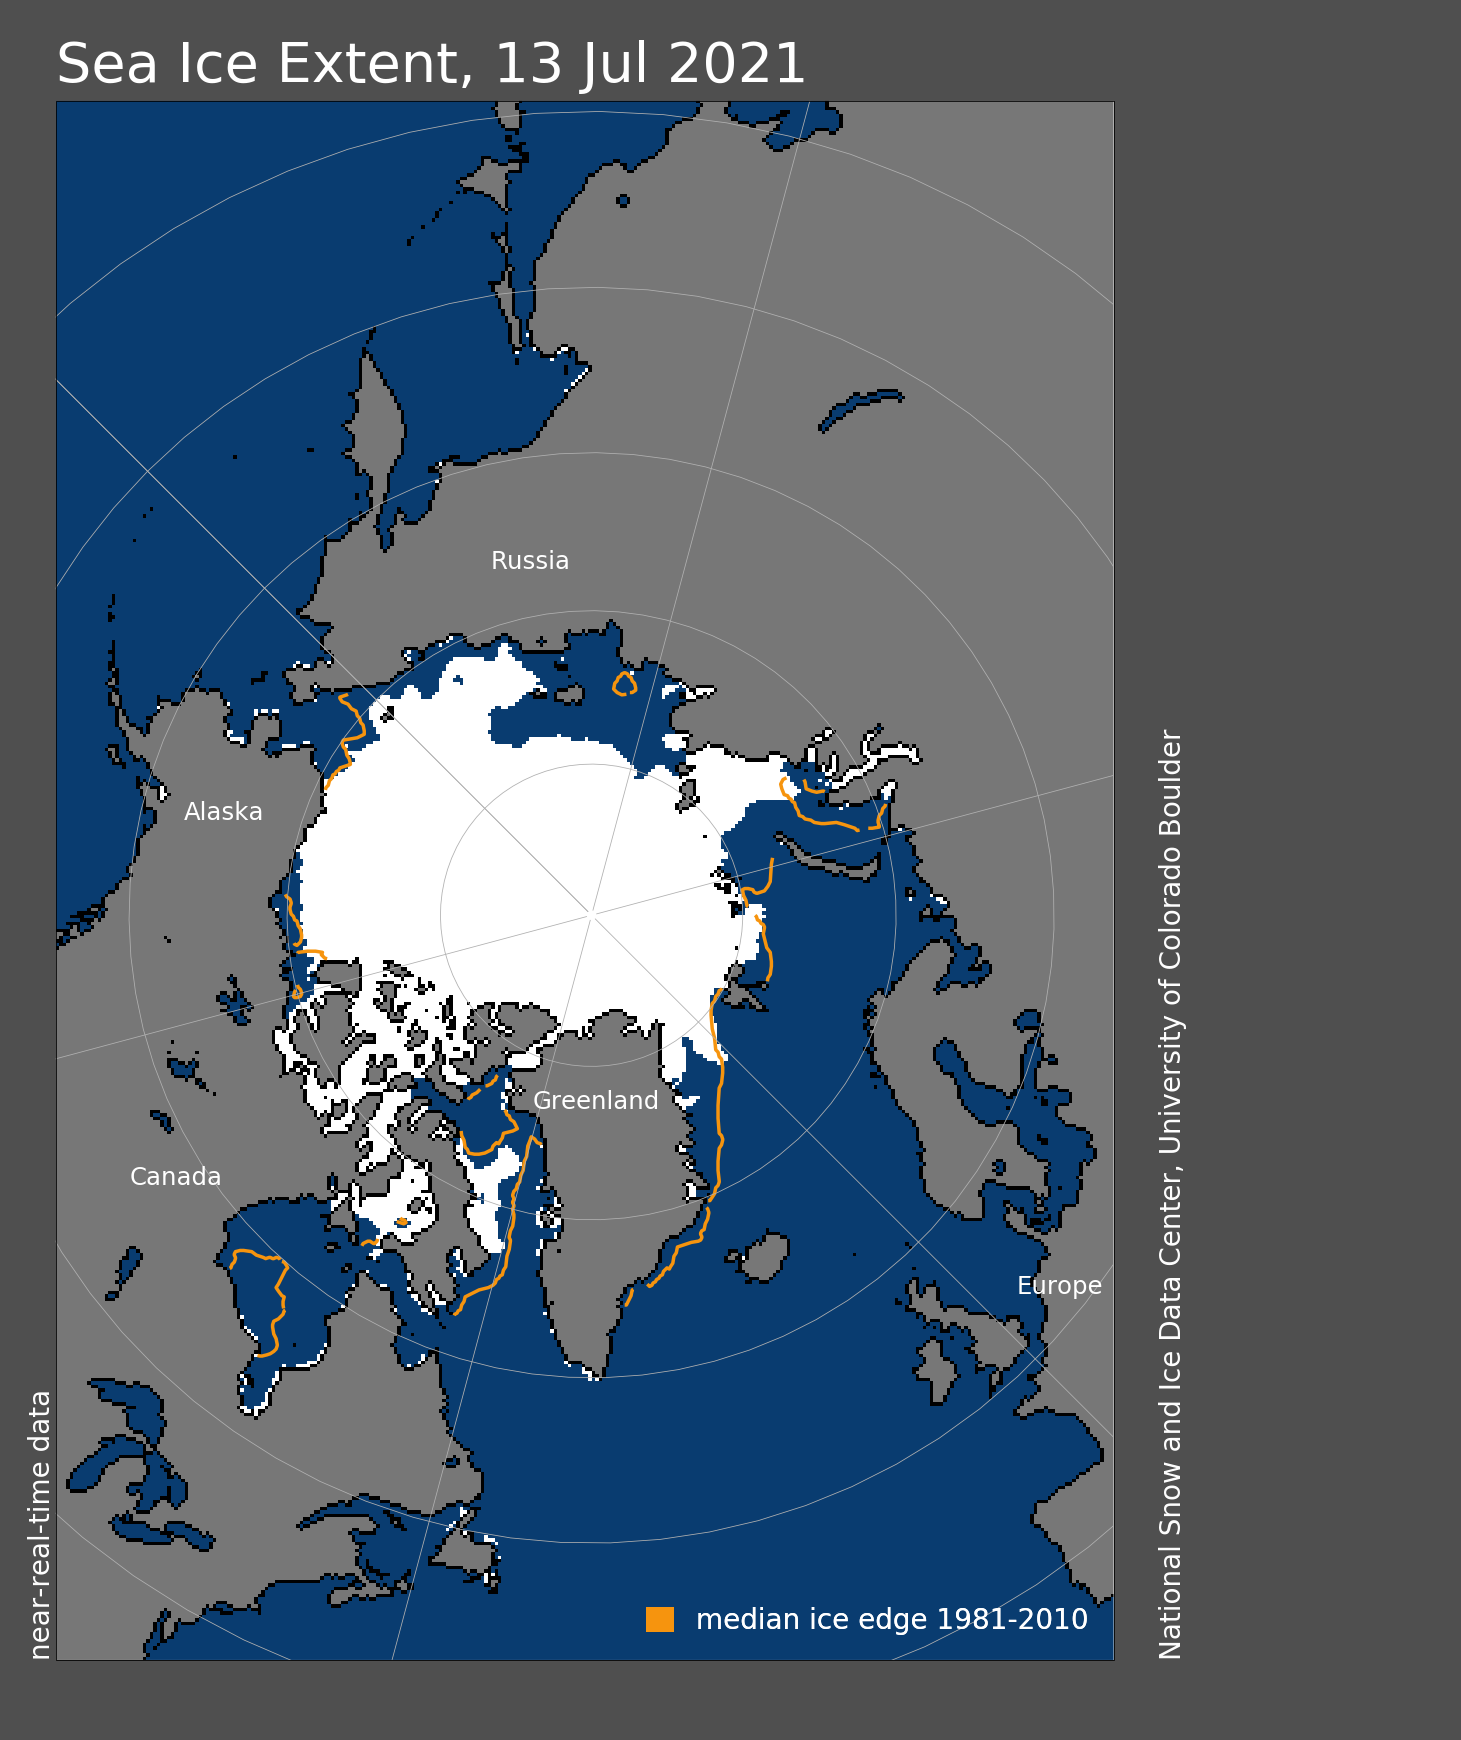
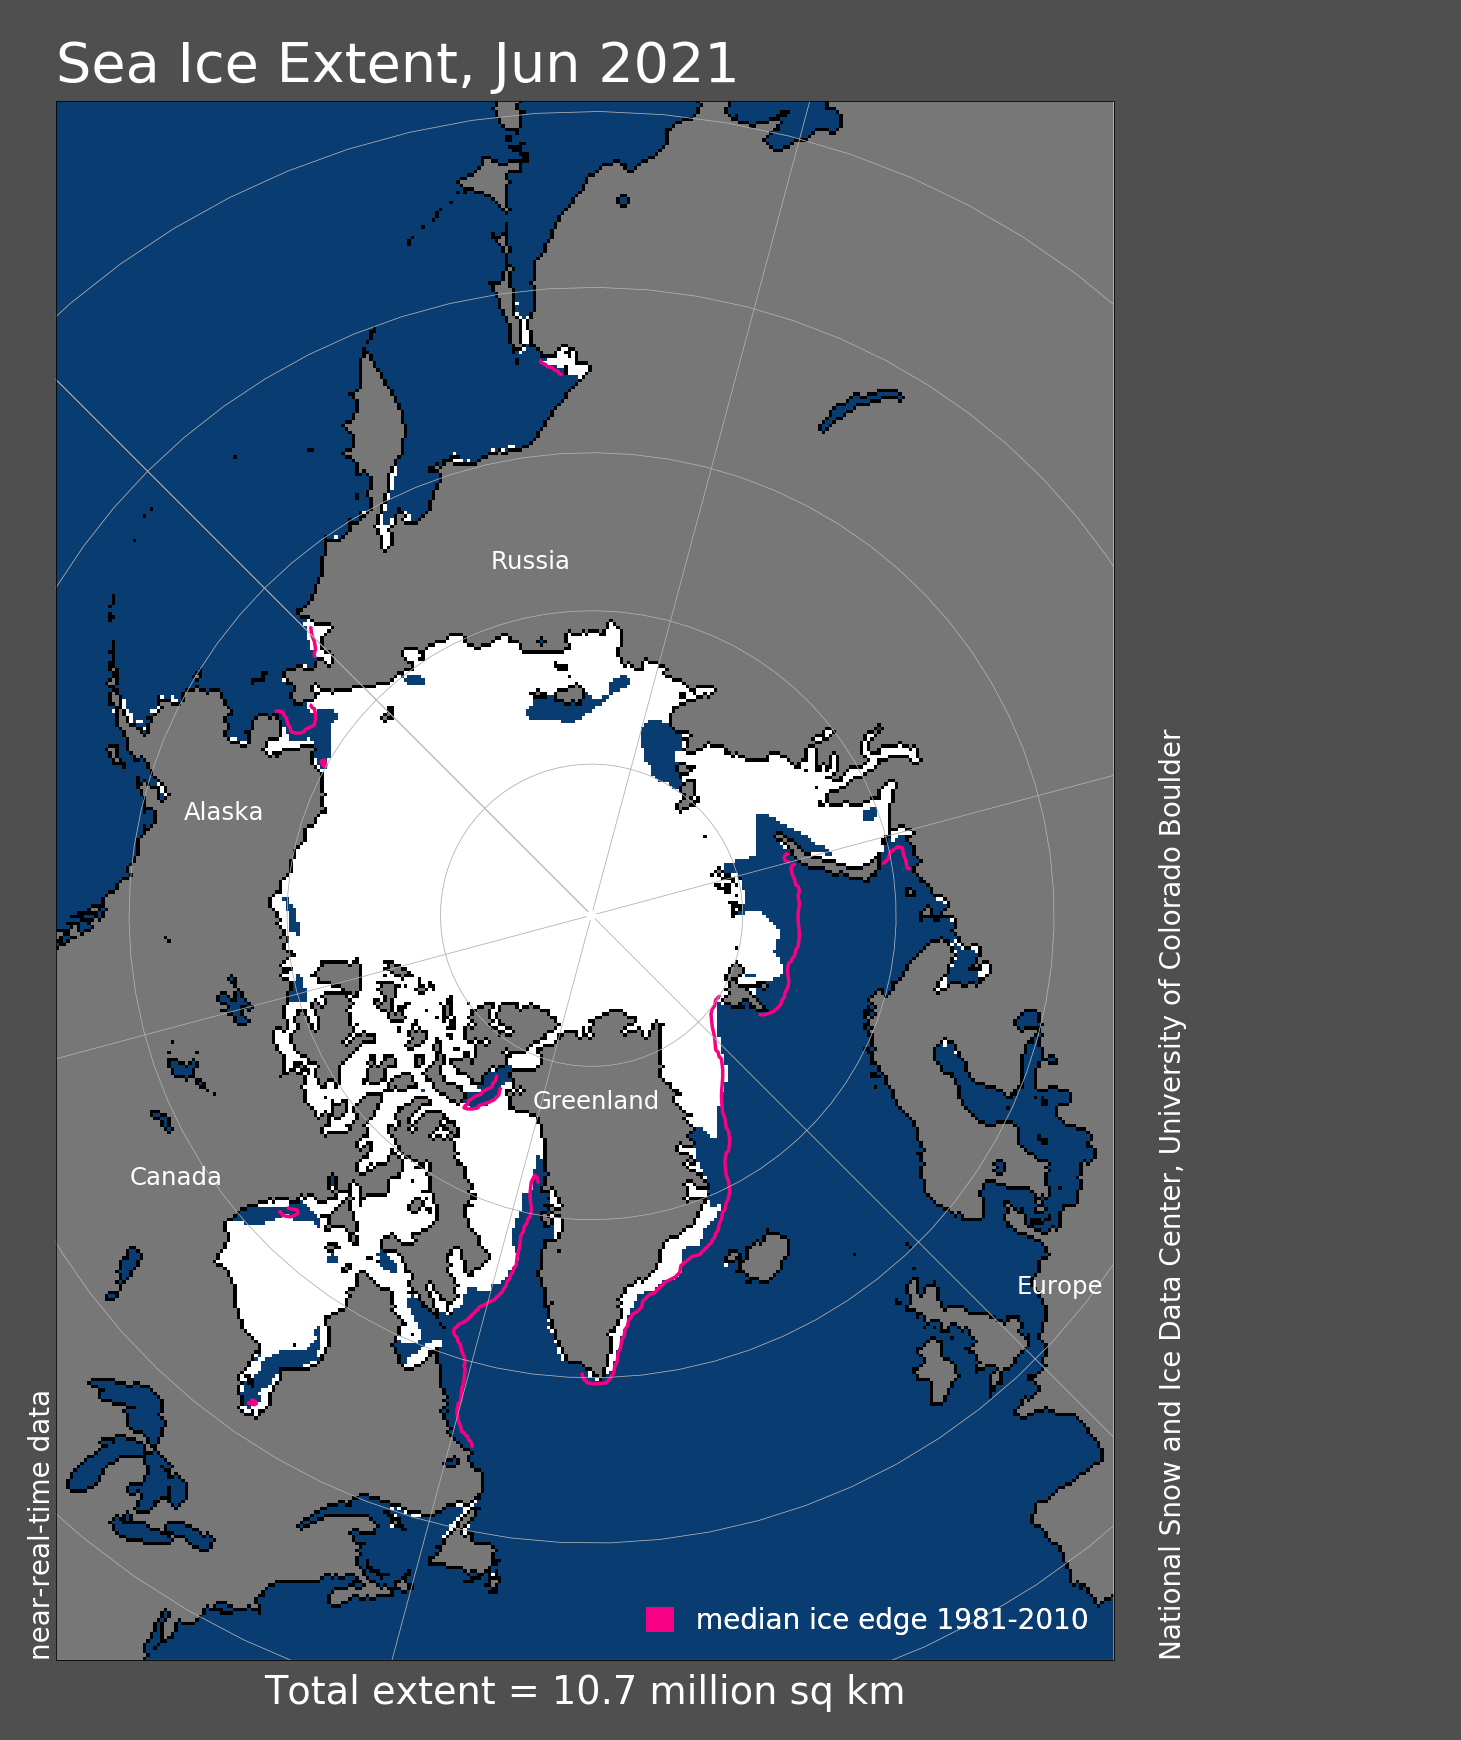
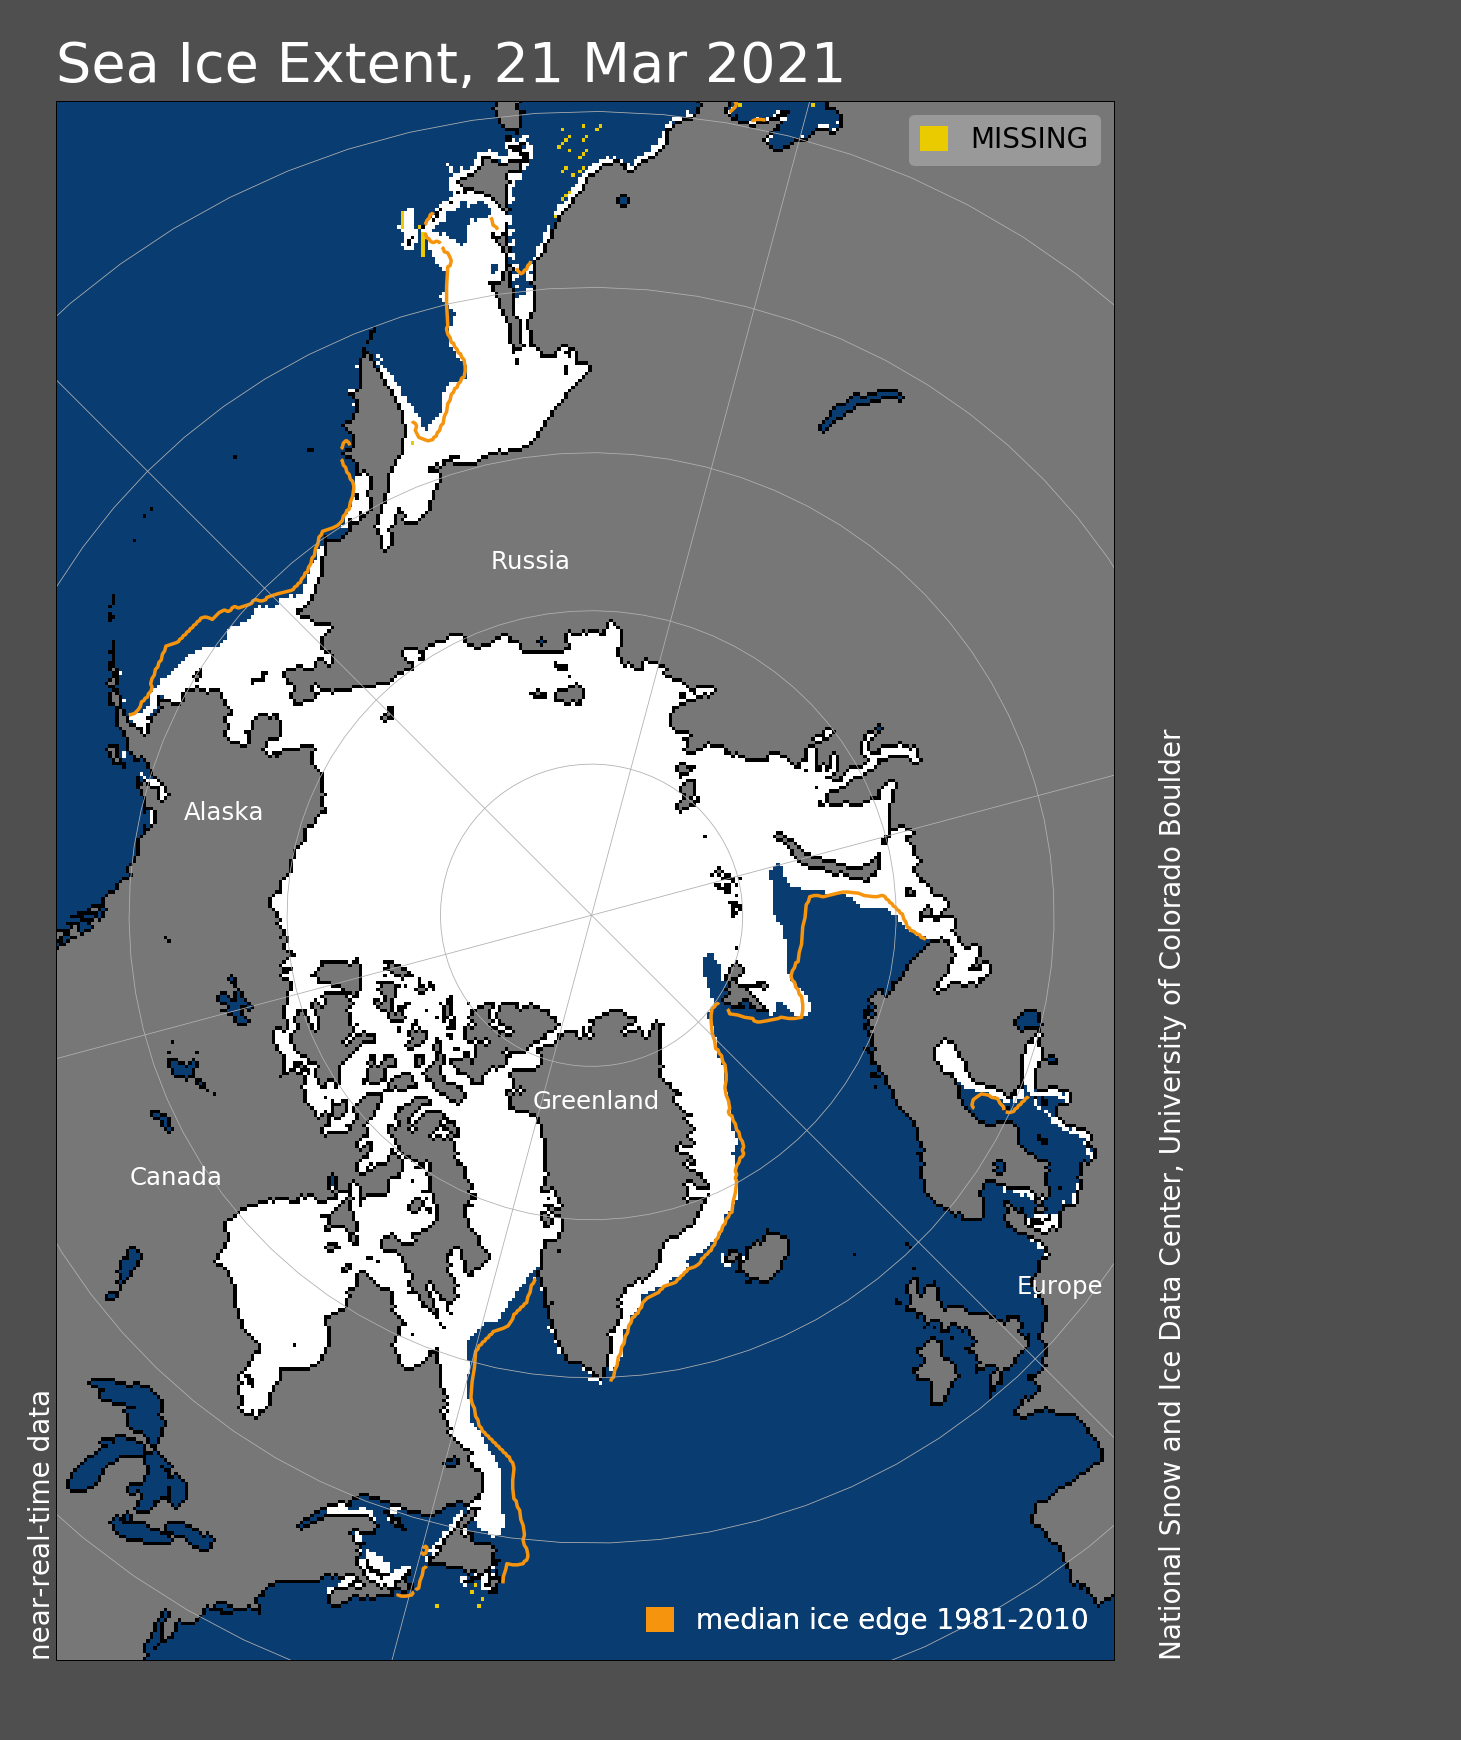
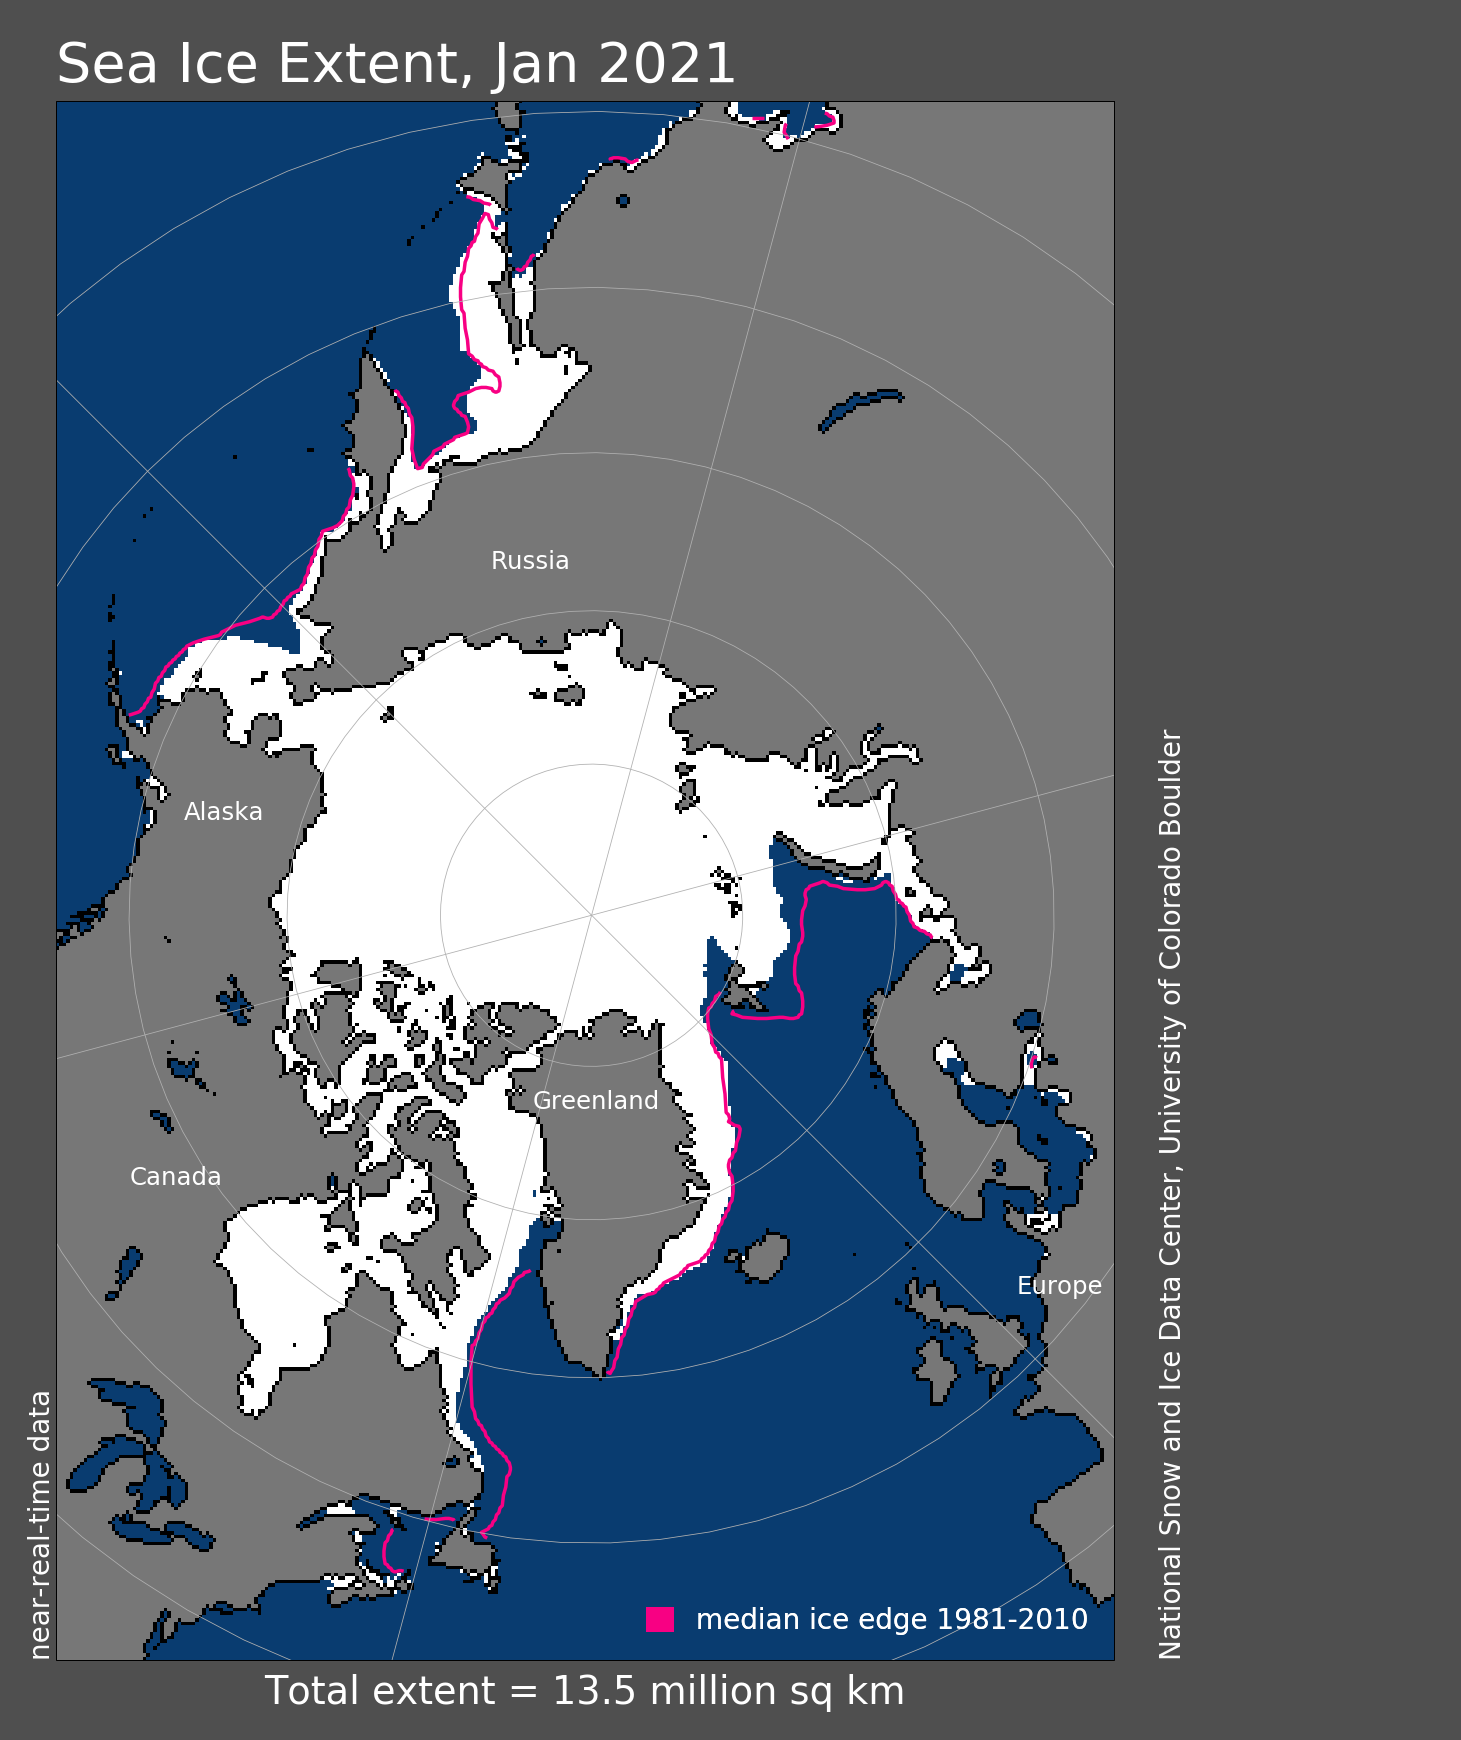
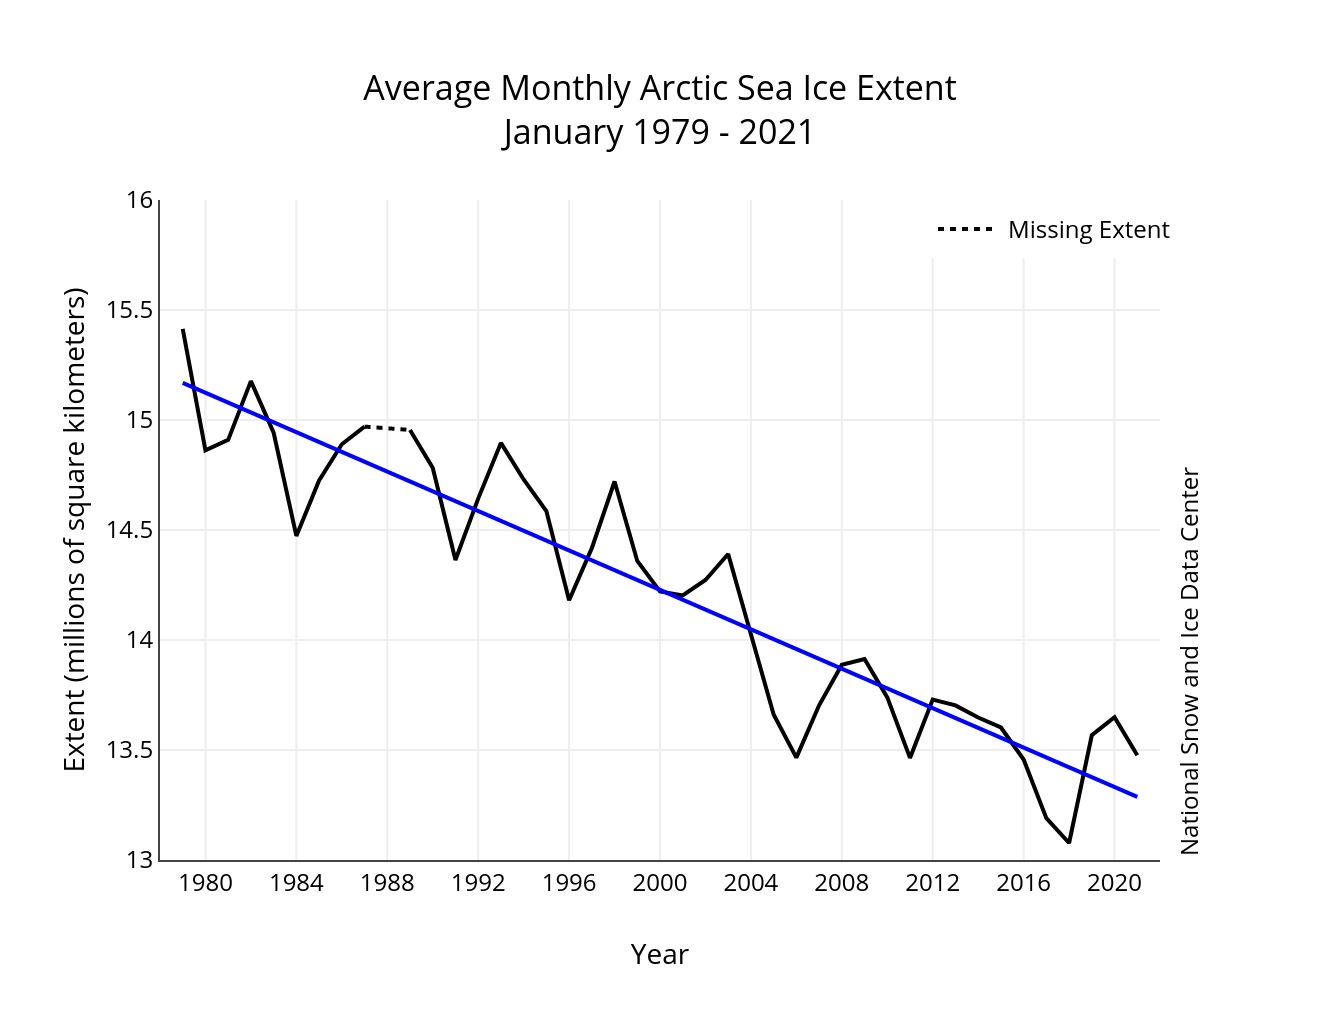
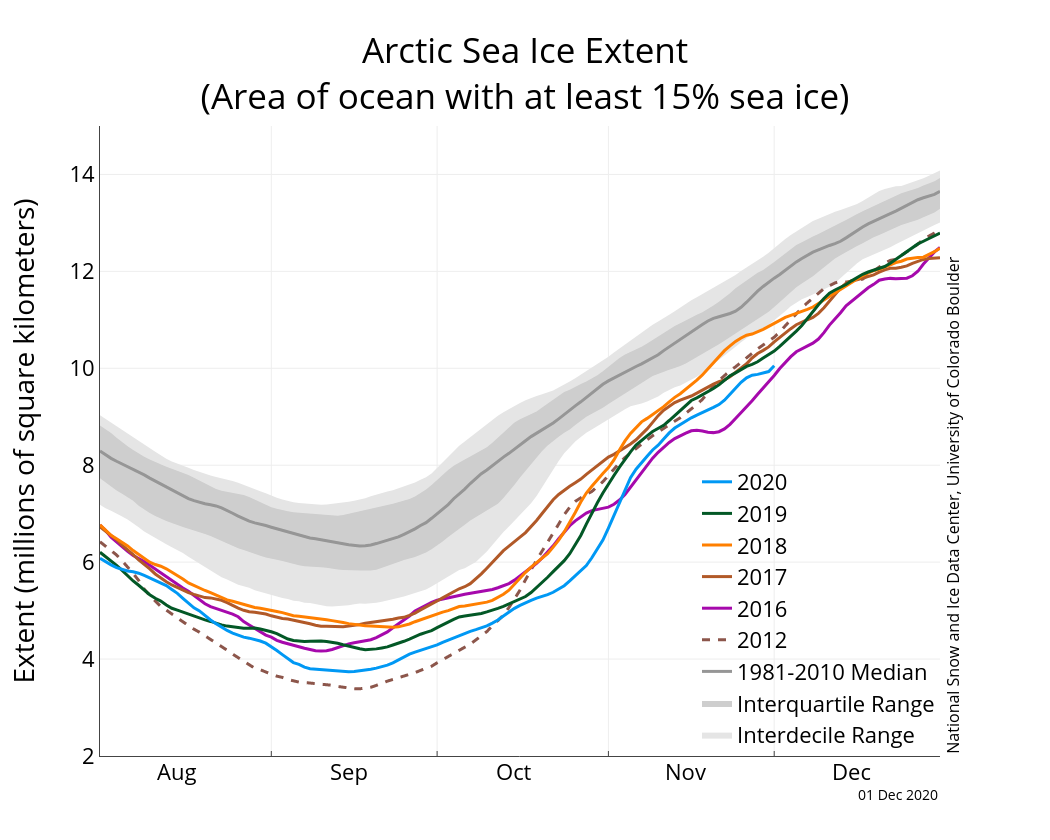
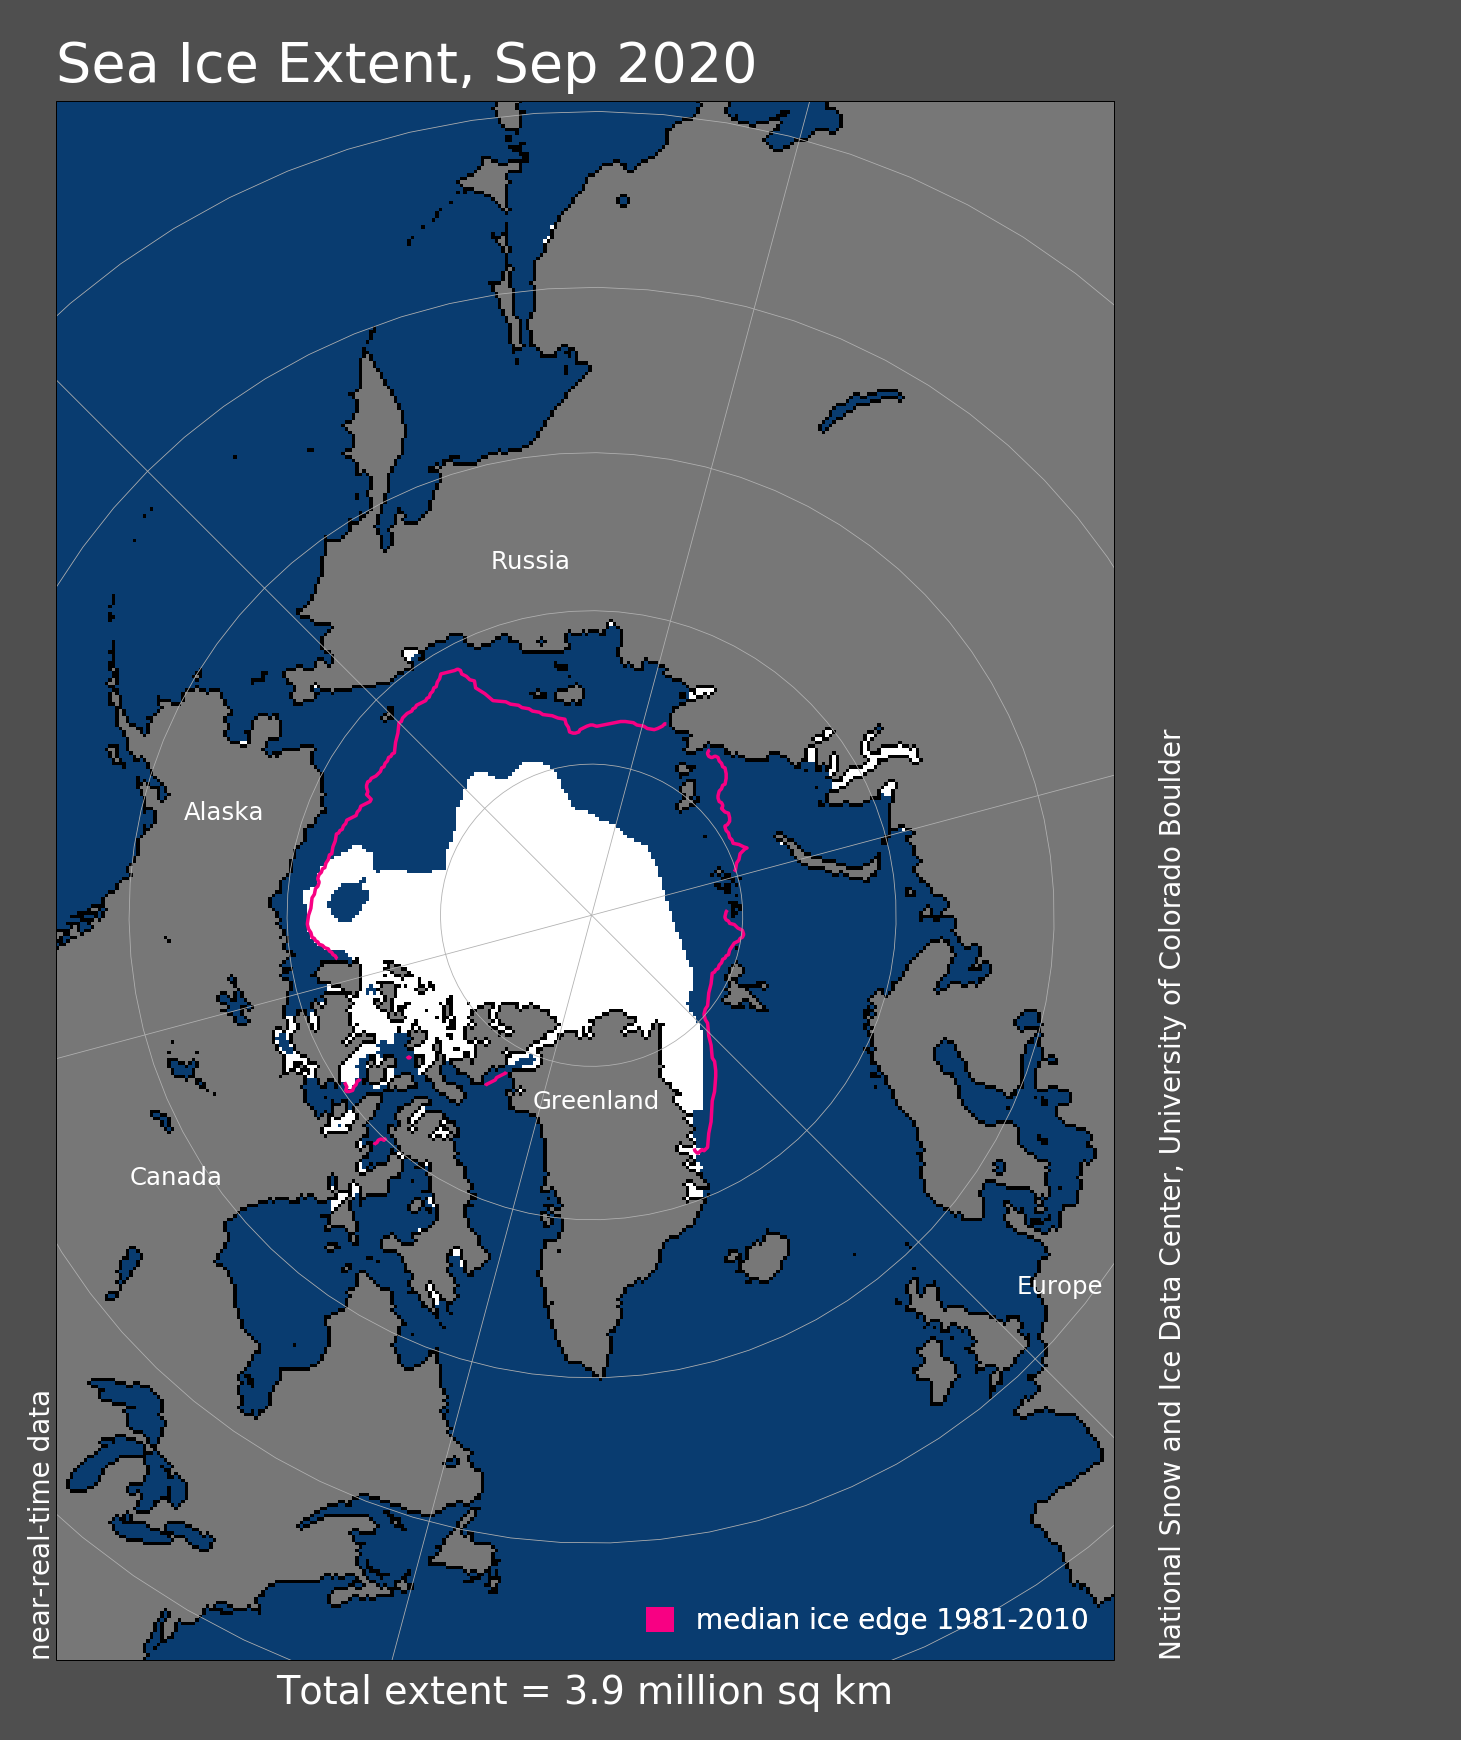
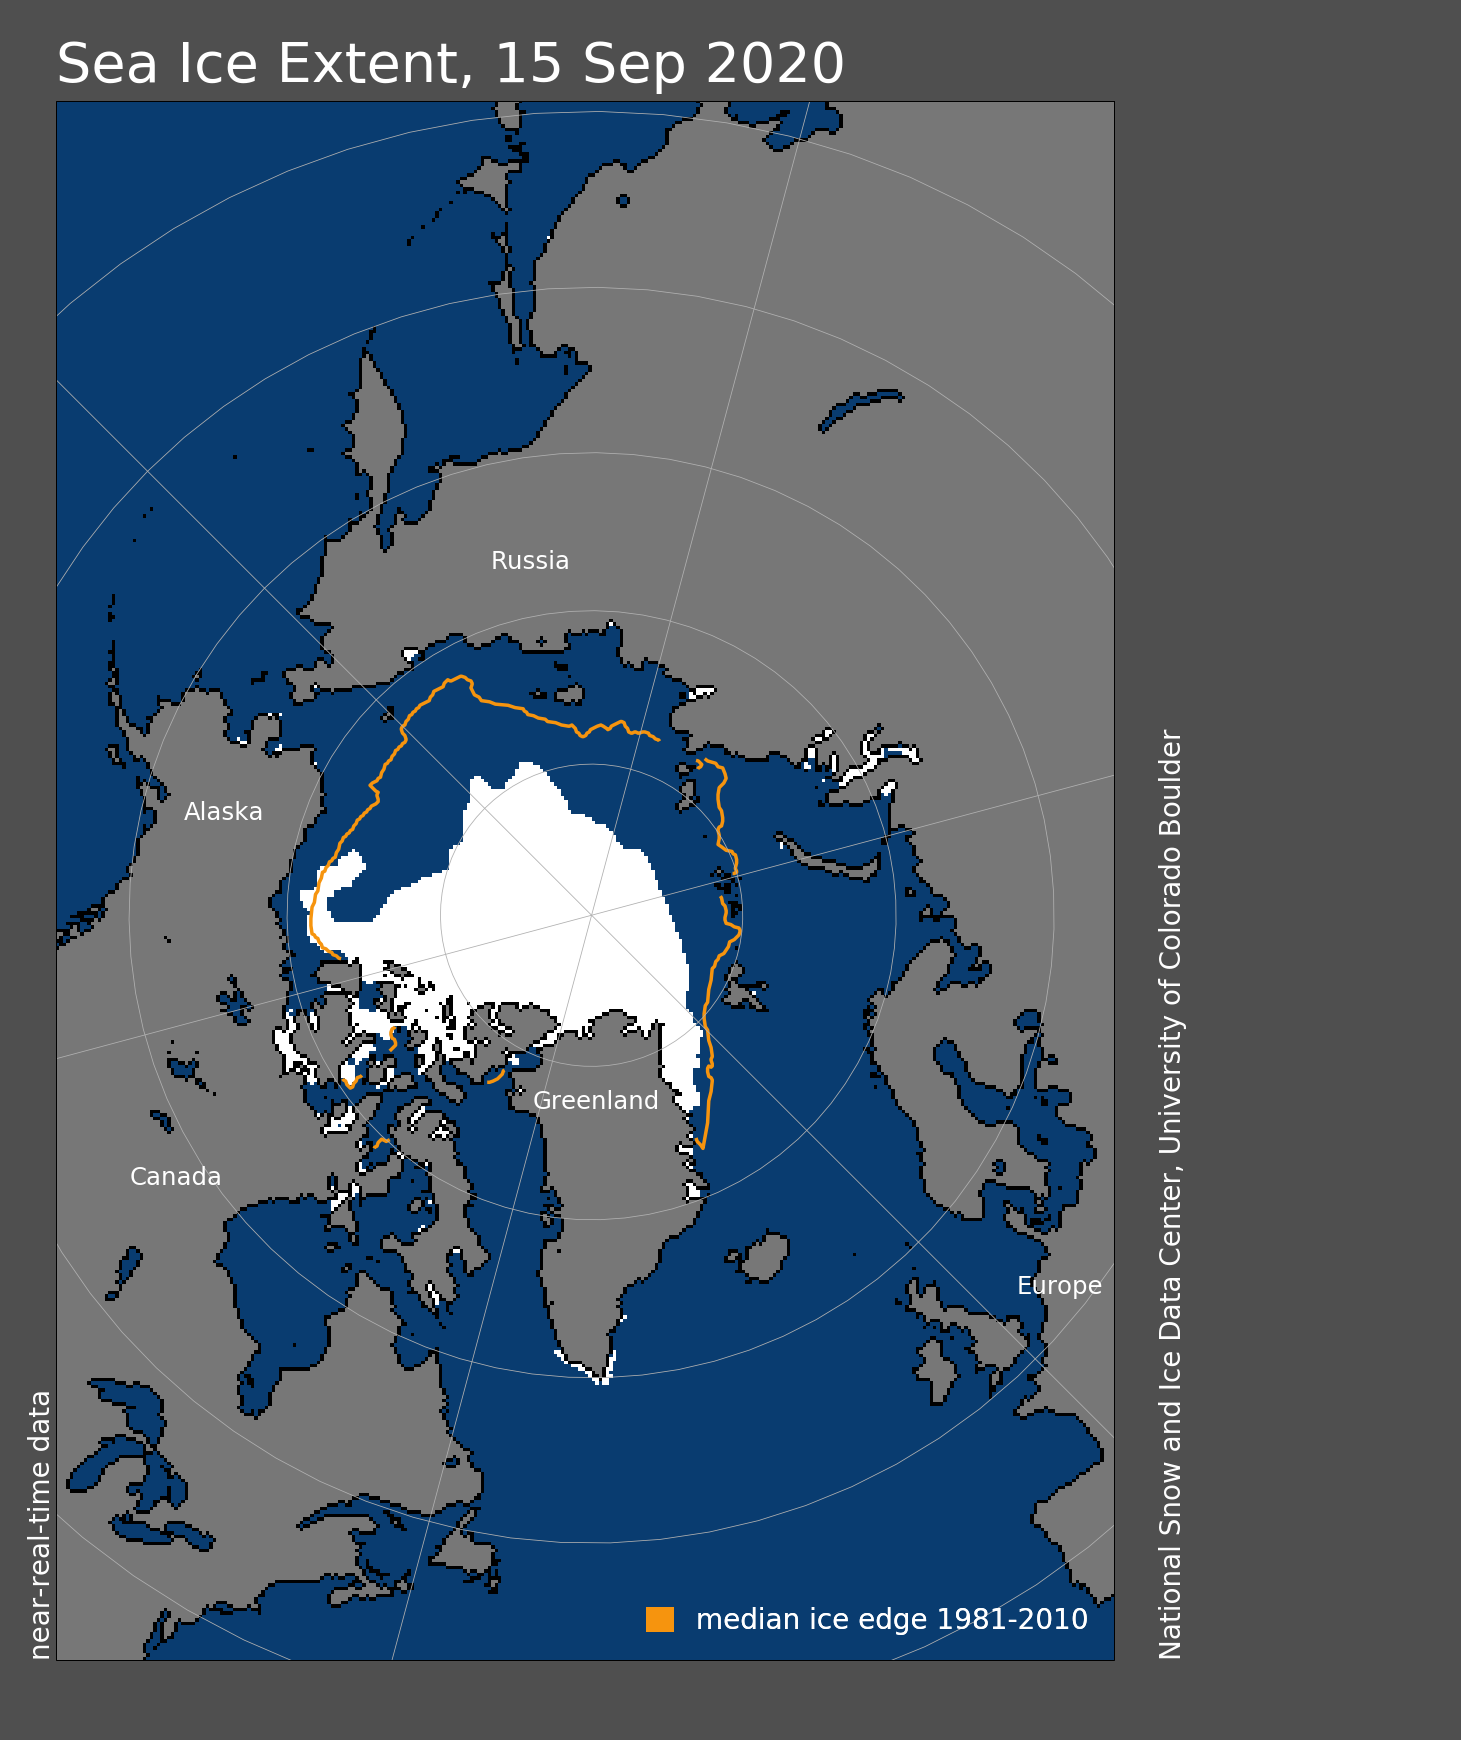
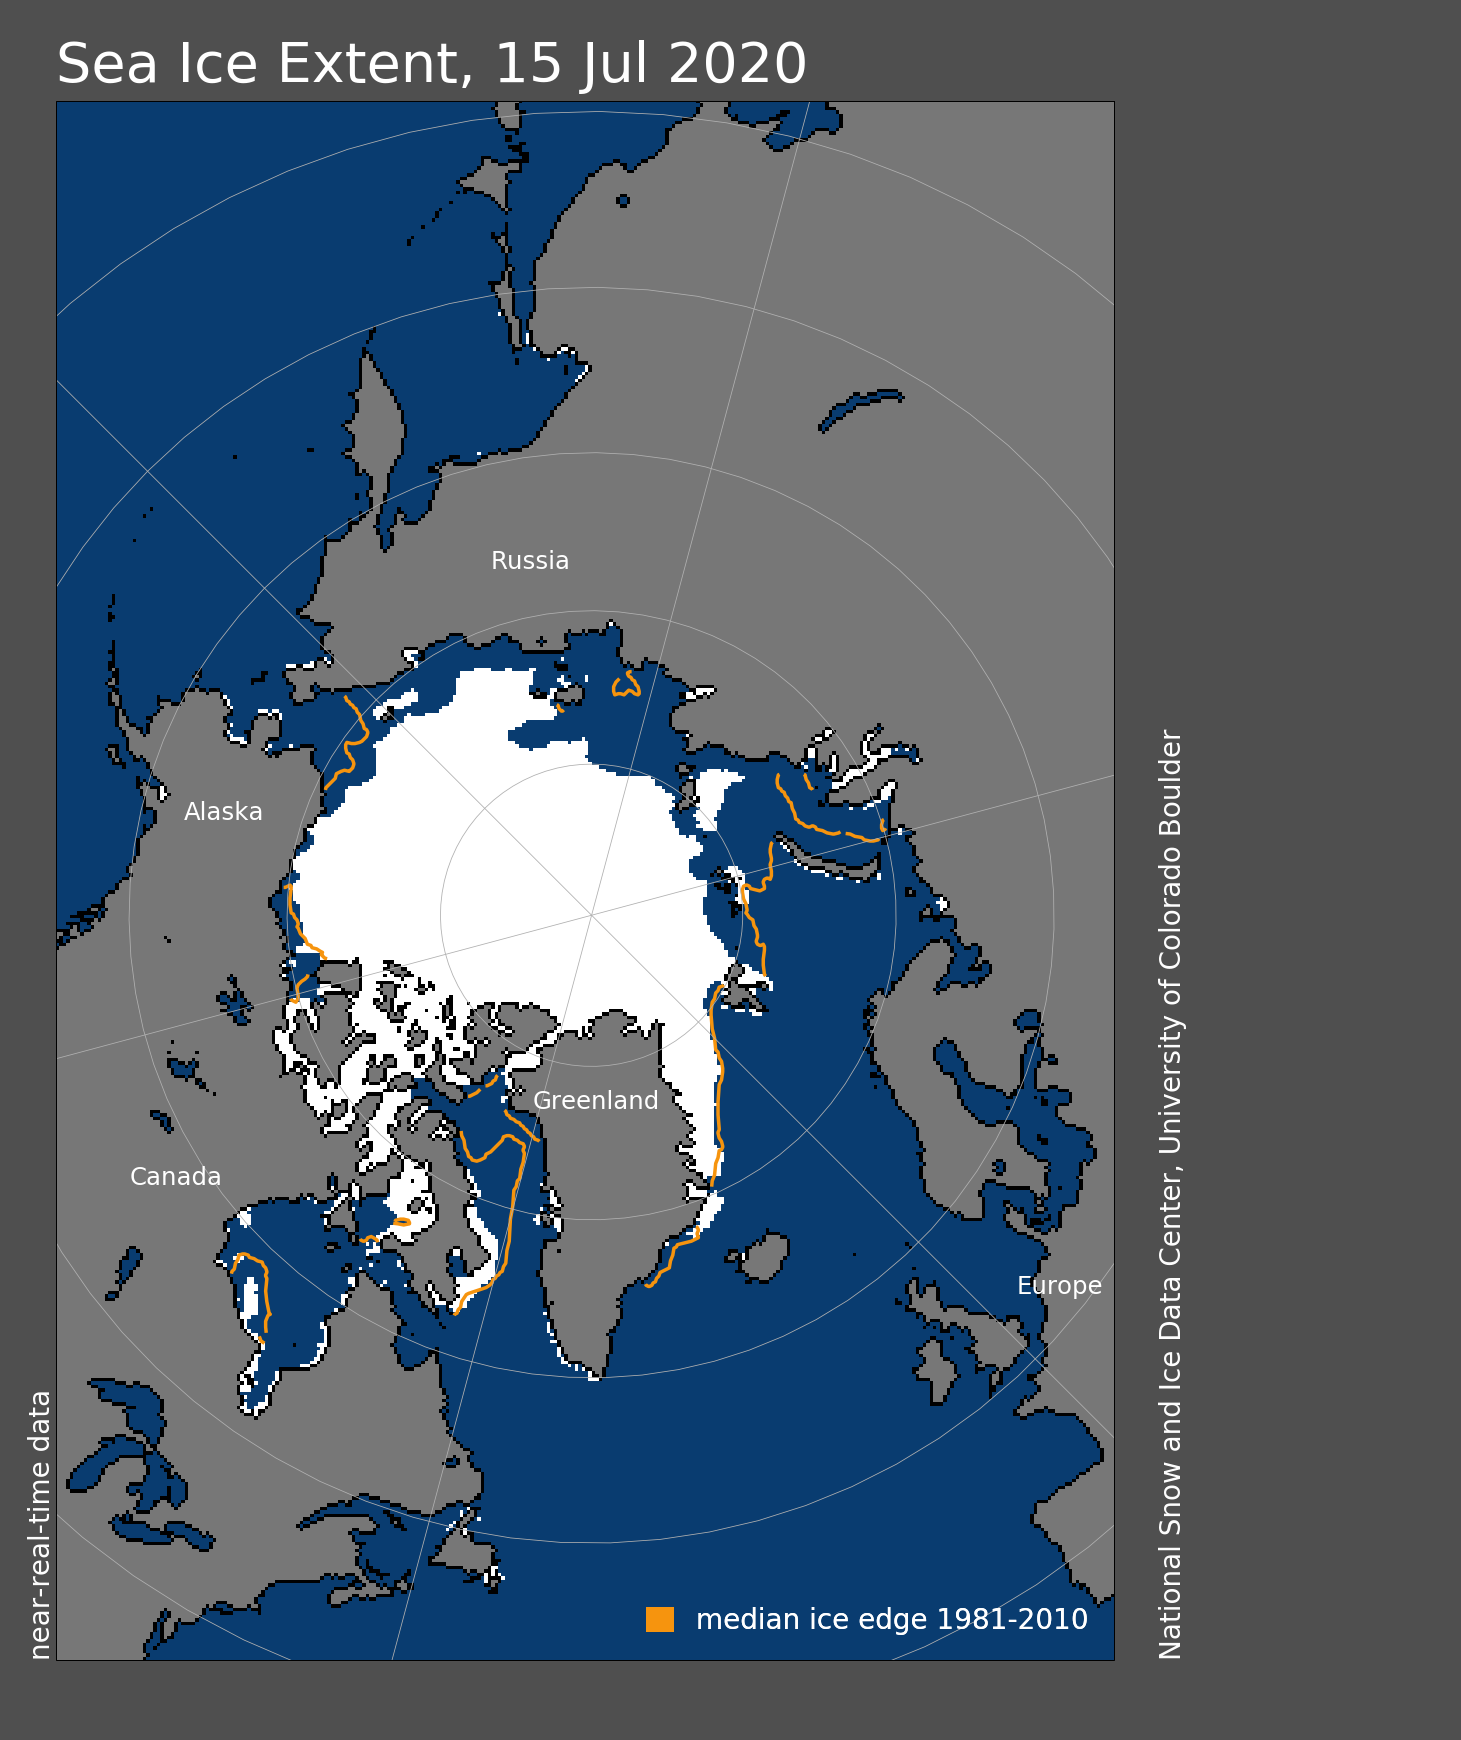
Figure 1. Arctic sea ice extent for July 13, 2021 was 7.95 million square kilometers (3.07 million square miles). The orange line shows the 1981 to 2010 average extent for that day. Sea Ice Index data. About the data
Credit: National Snow and Ice Data Center
High-resolution image
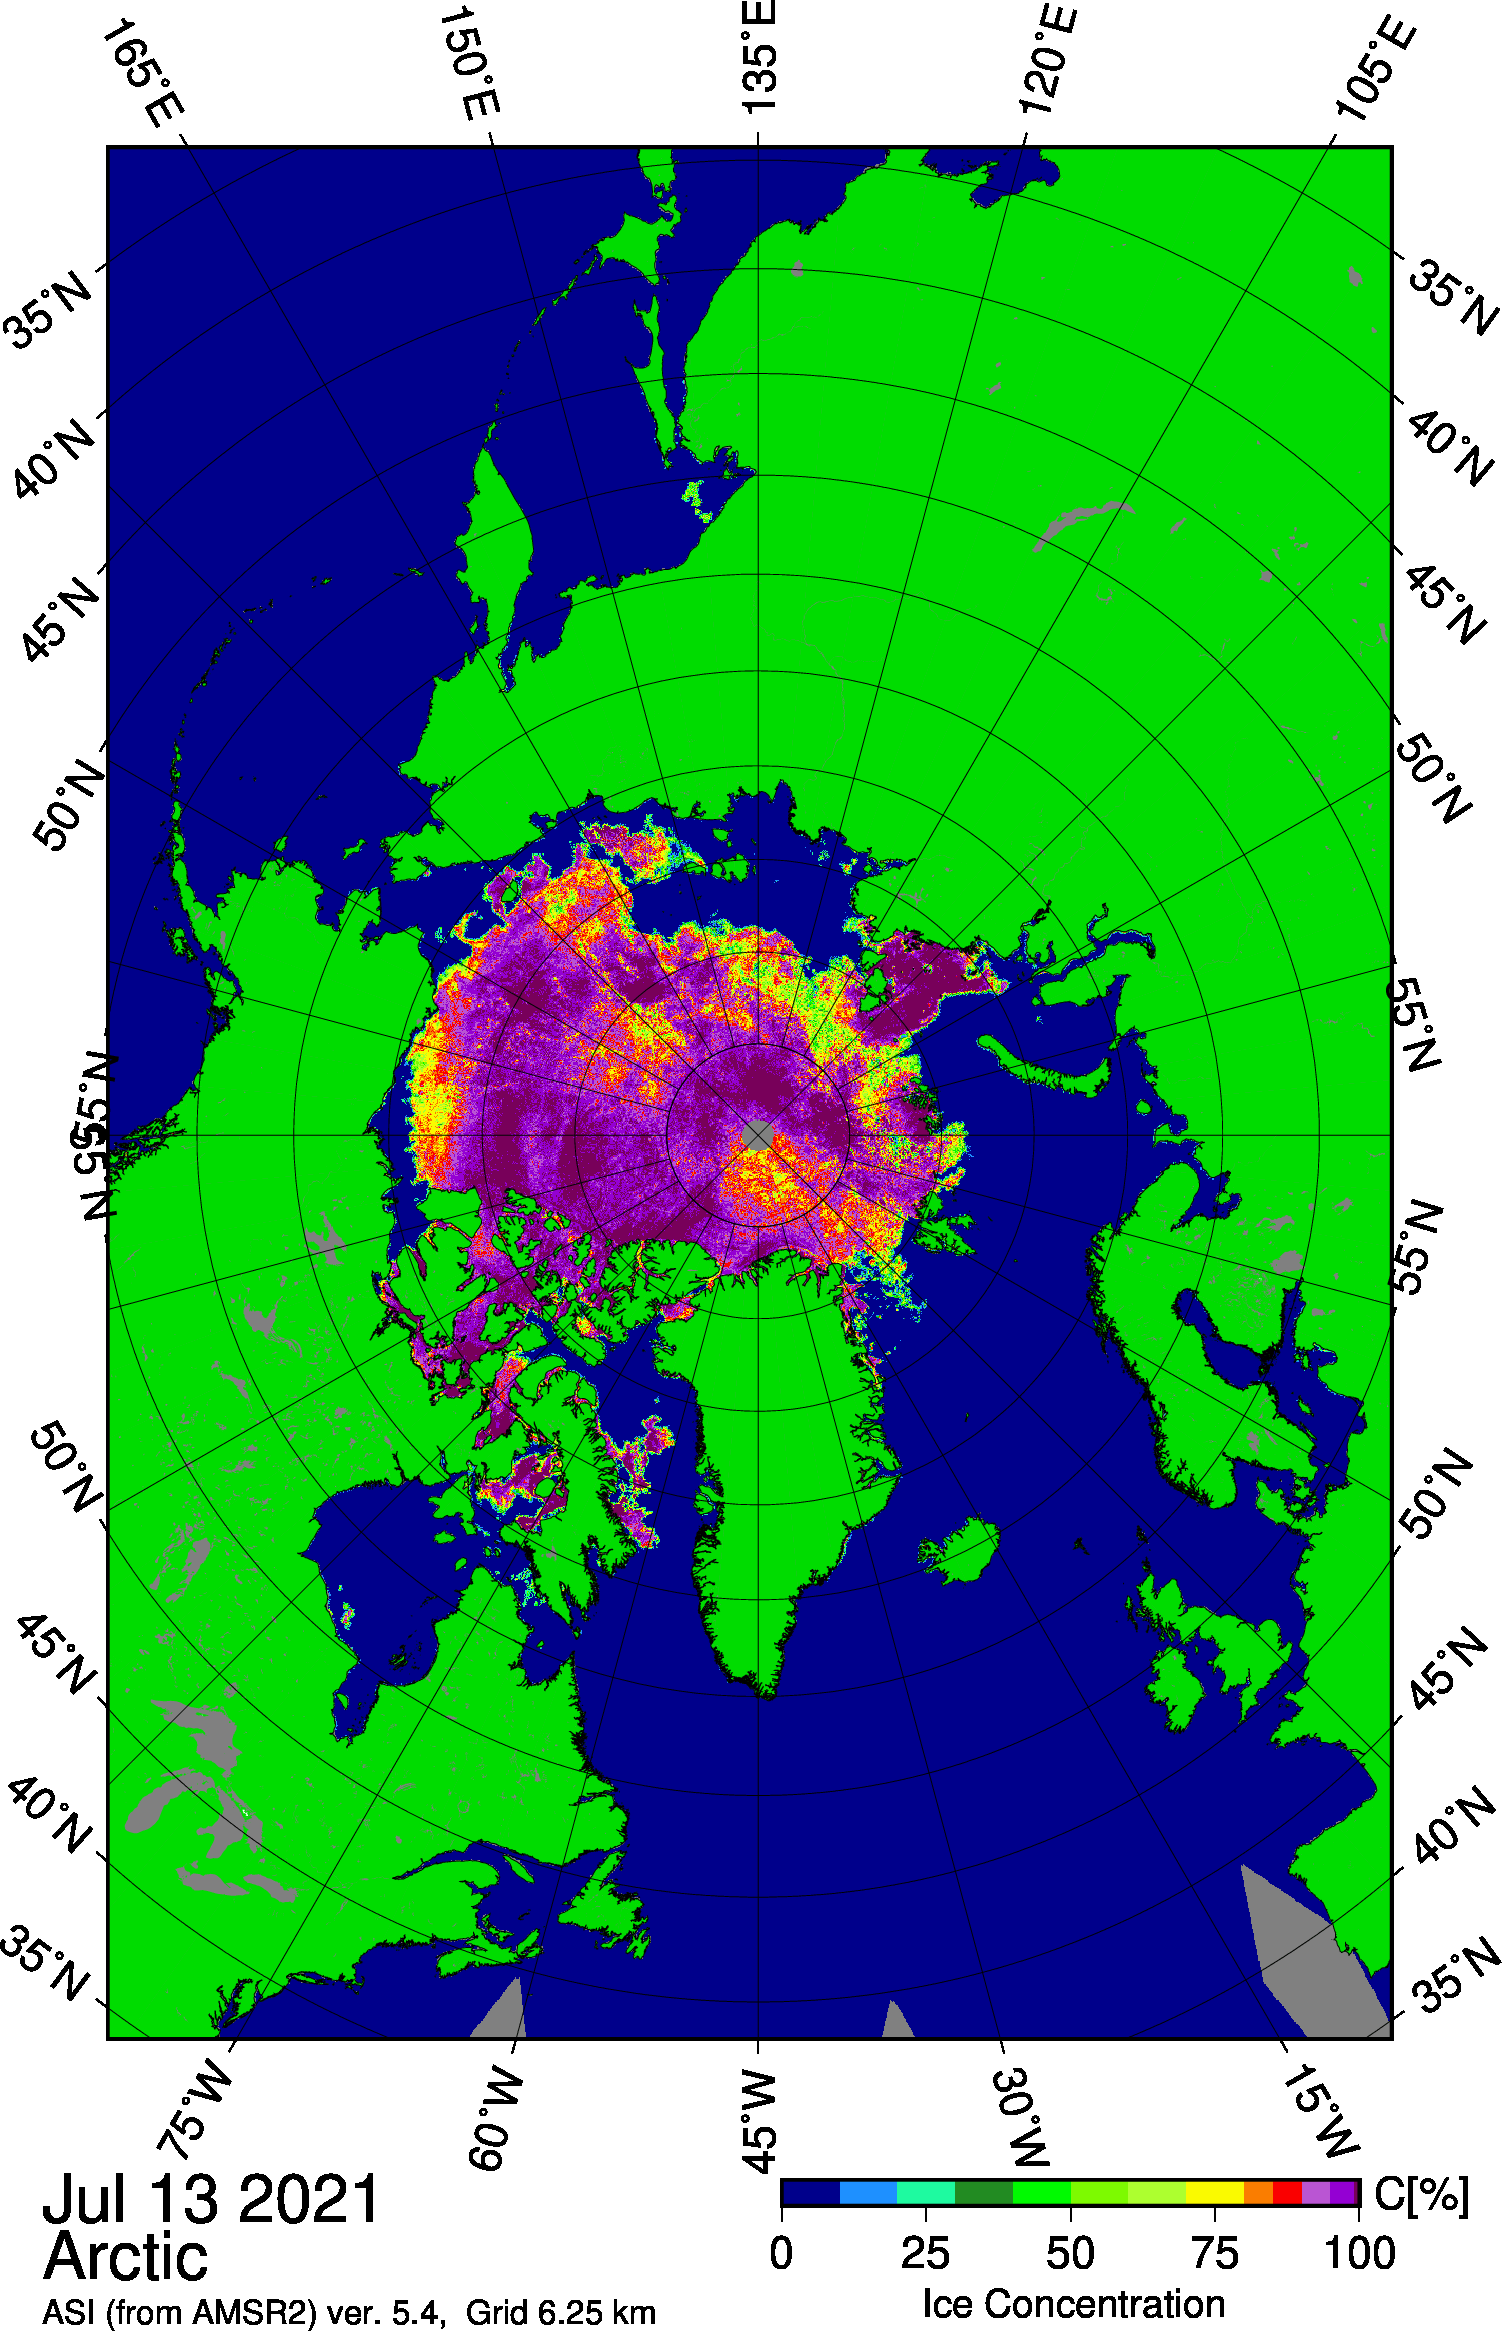
Figure 1b. This map shows Arctic sea ice concentration based on data from the Advanced Microwave Scanning Radiometer 2 (AMSR2) data. Yellows indicate sea ice concentration of 75 percent, dark purples indicate sea ice concentration of 100 percent.
Credit: University of Bremen
High-resolution image
Sea ice loss continued at a brisk pace through the first two weeks of July. On July 13, Arctic sea ice extent stood at 7.95 million square kilometers (3.07 million square miles). This is 1.98 million square kilometers (764,000 square miles) below the 1981 to 2010 average. This extent is also just below the 2012 record and very close to 2020, the years with the lowest and second lowest (tied with 2007) minimum in the satellite record, respectively. By July 13, the Laptev Sea area, which began melting out much earlier than is typical for this time of year, was almost completely free of sea ice. This is broadly similar to last summer’s pattern, which holds the record for the lowest sea ice extent within the Laptev Sea at this time of year. The Northern Sea Route along the Russian coast is not yet ice free, and not really even close; as shown in the Advanced Microwave Scanning Radiometer 2 (AMSR-2) imagery from the University of Bremen (Figure 1b), a substantial area of high concentration ice persists north of the Taymyr Peninsula and west of the Severnaya Zemlaya islands (the traditional “choke point”). The Northwest Passage through the channels of the Canadian Arctic Archipelago also remains choked with ice. Continuing the pattern discussed in our previous post, sea ice remains close to the shore north of Utqiaġvik, AK.
Conditions in context
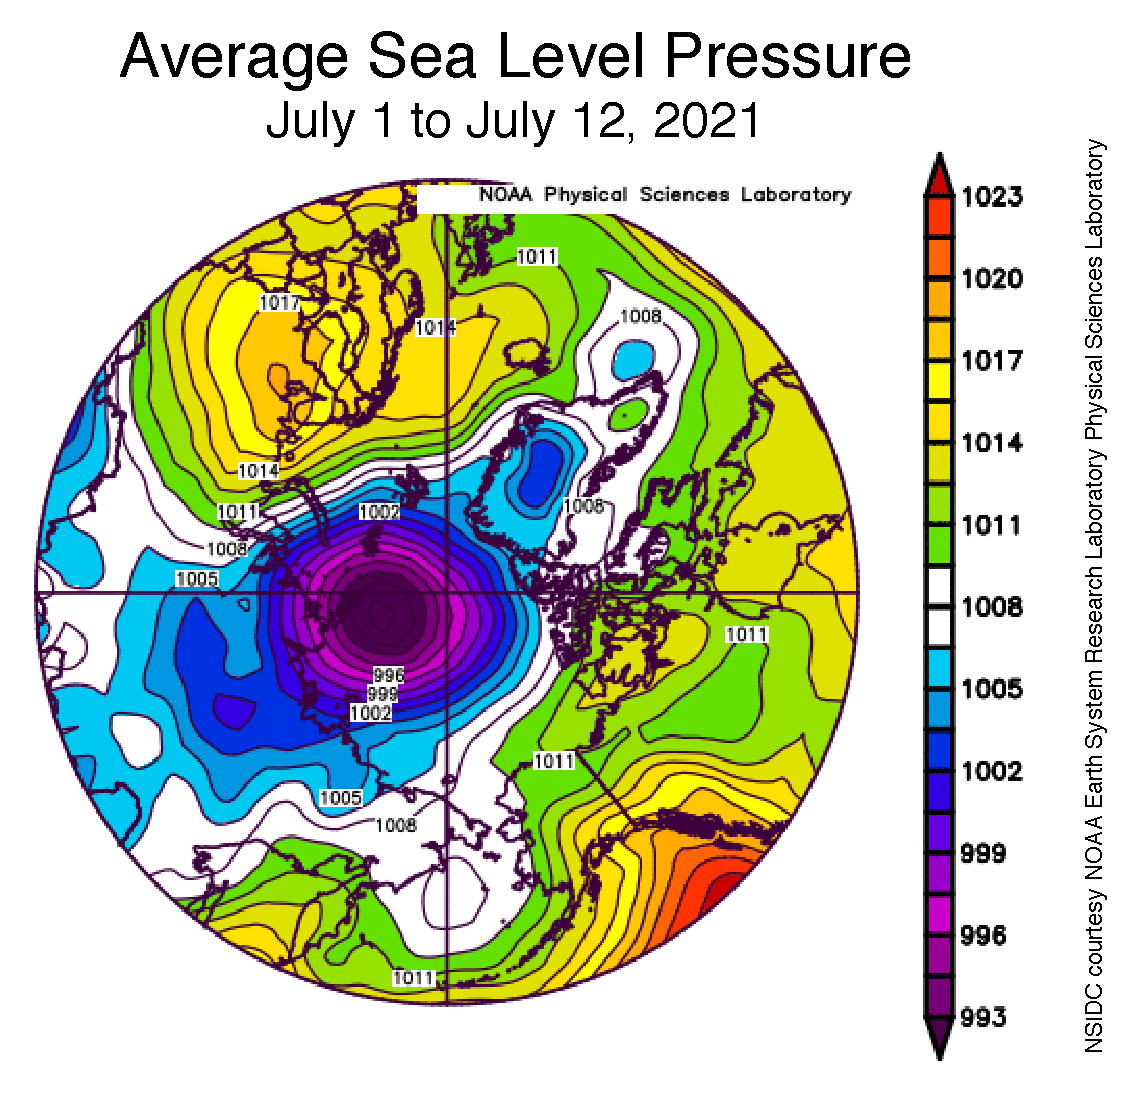
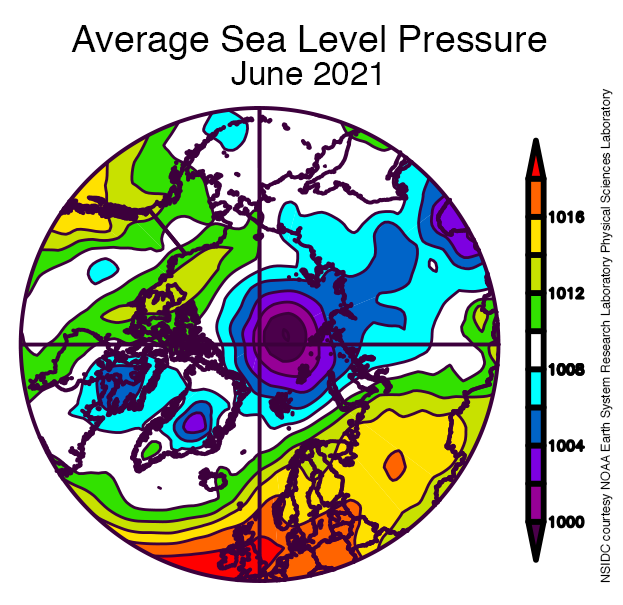
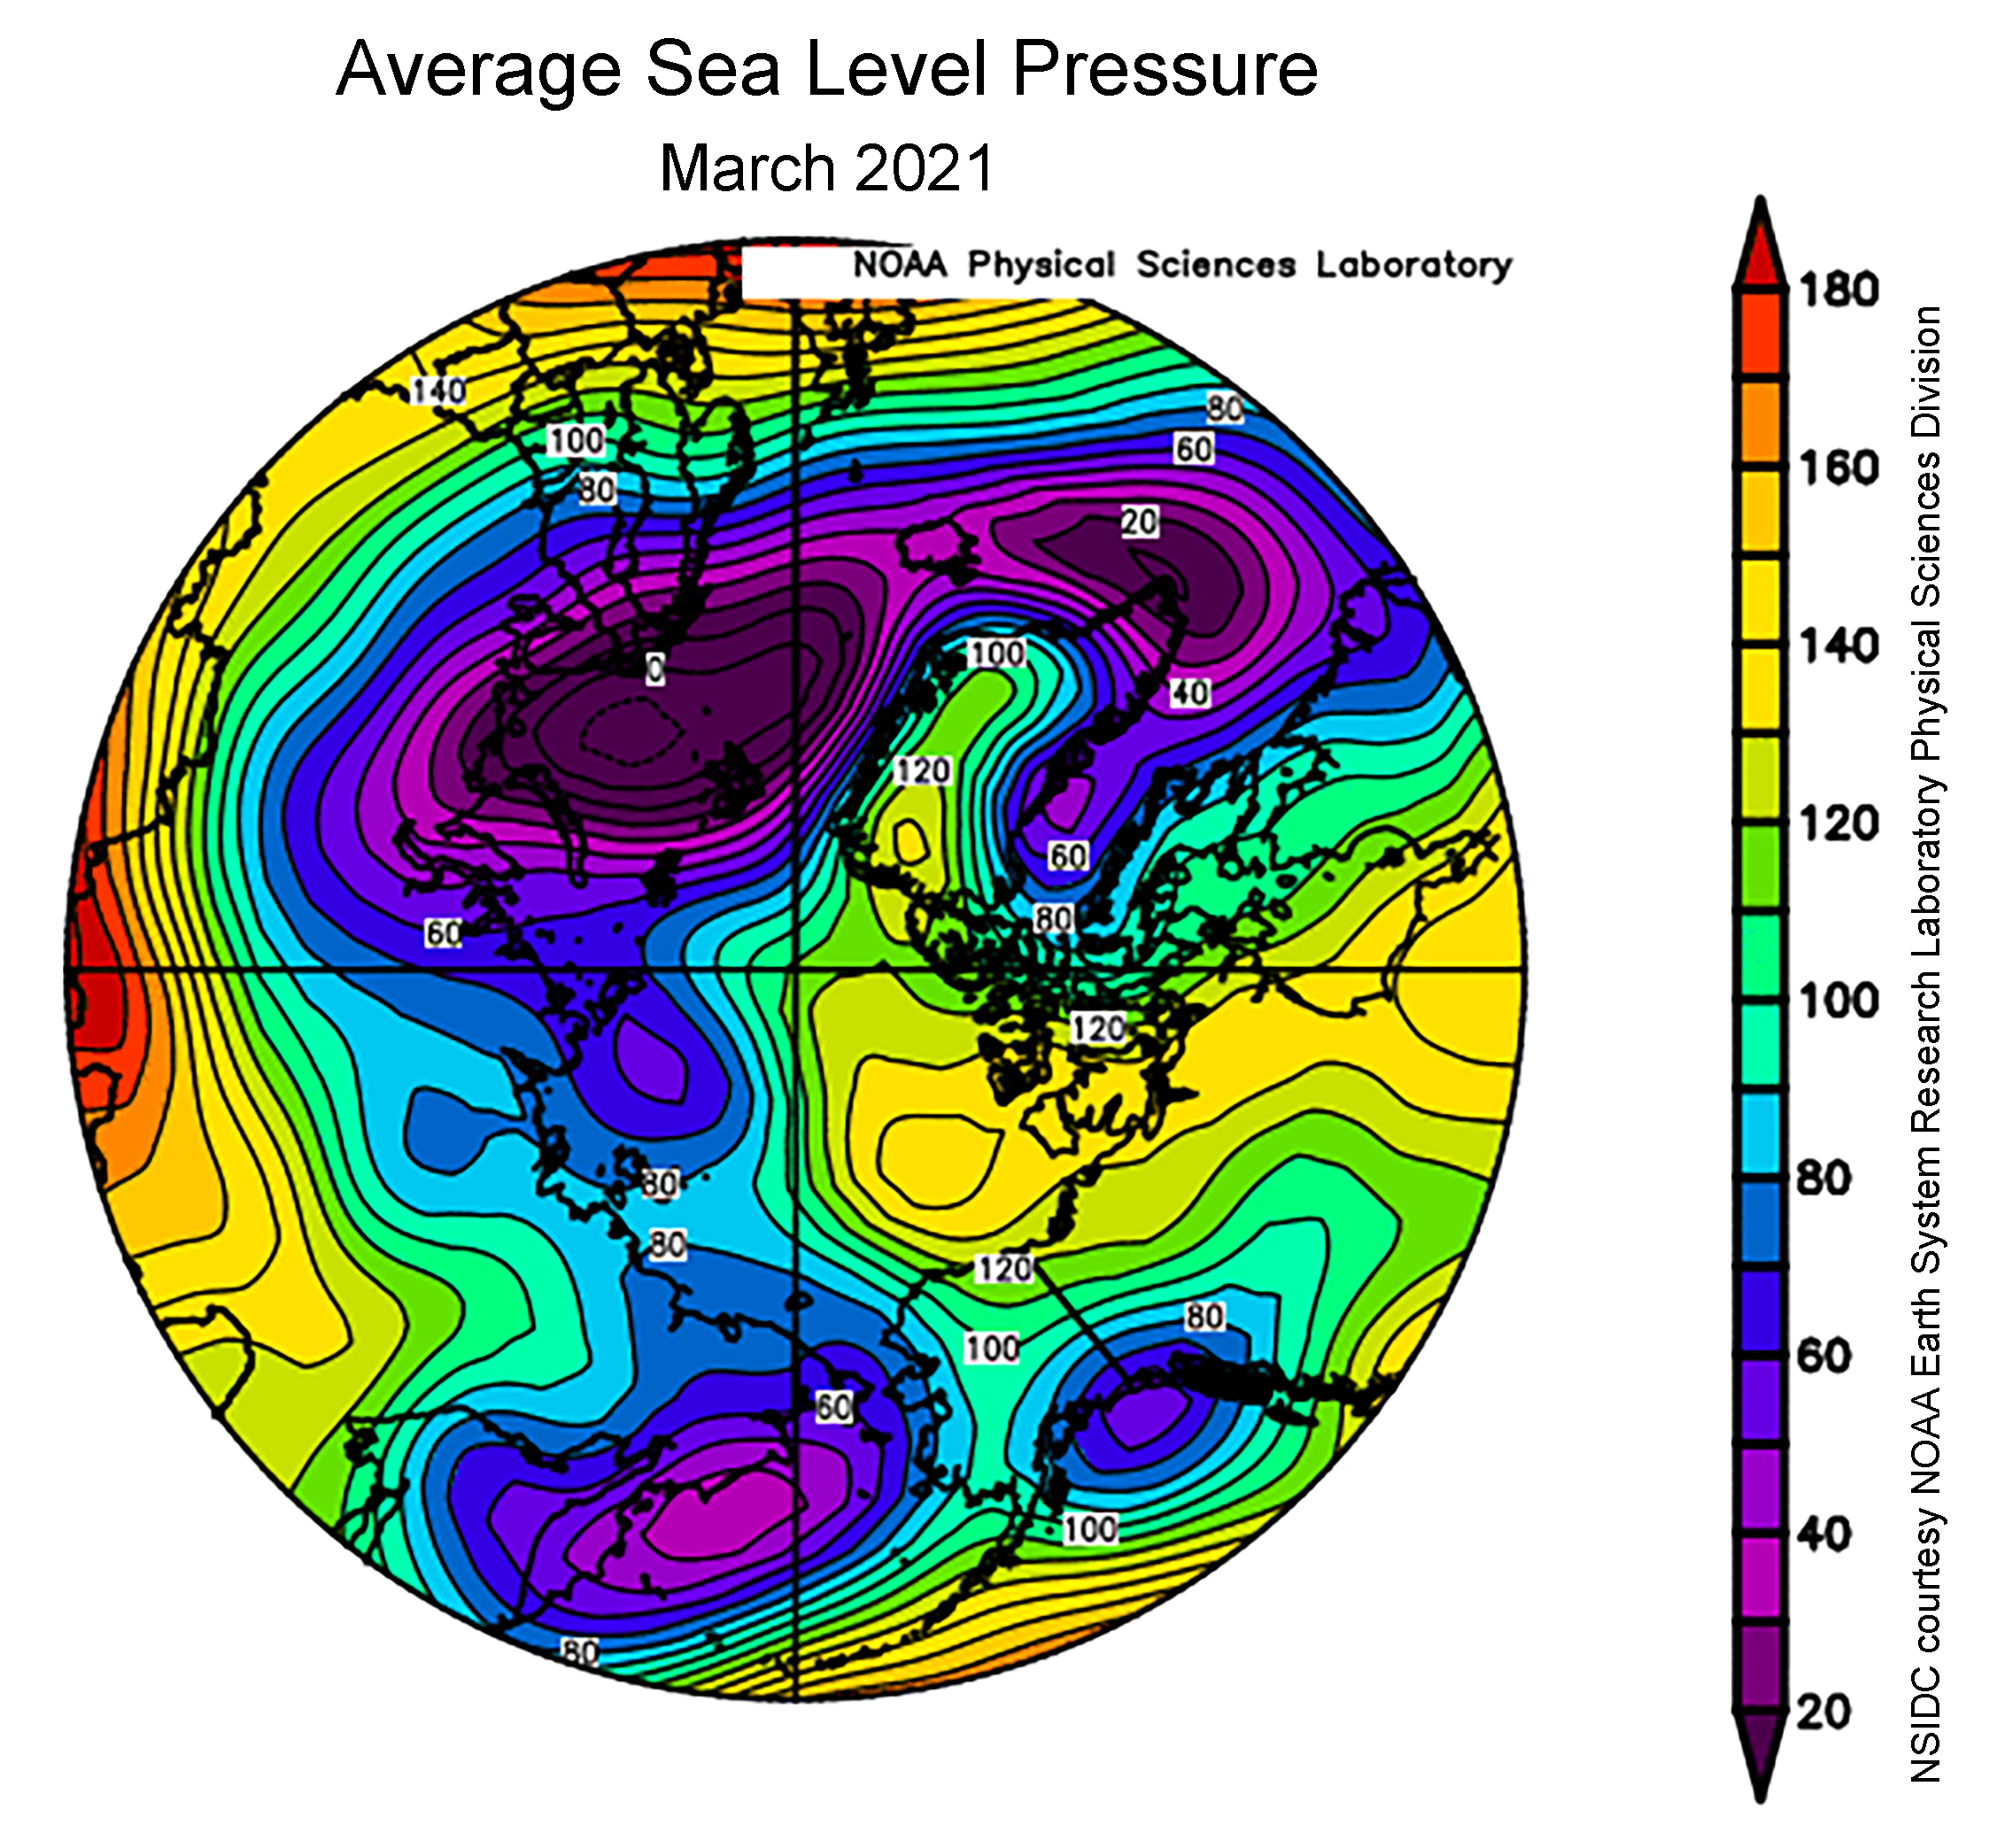
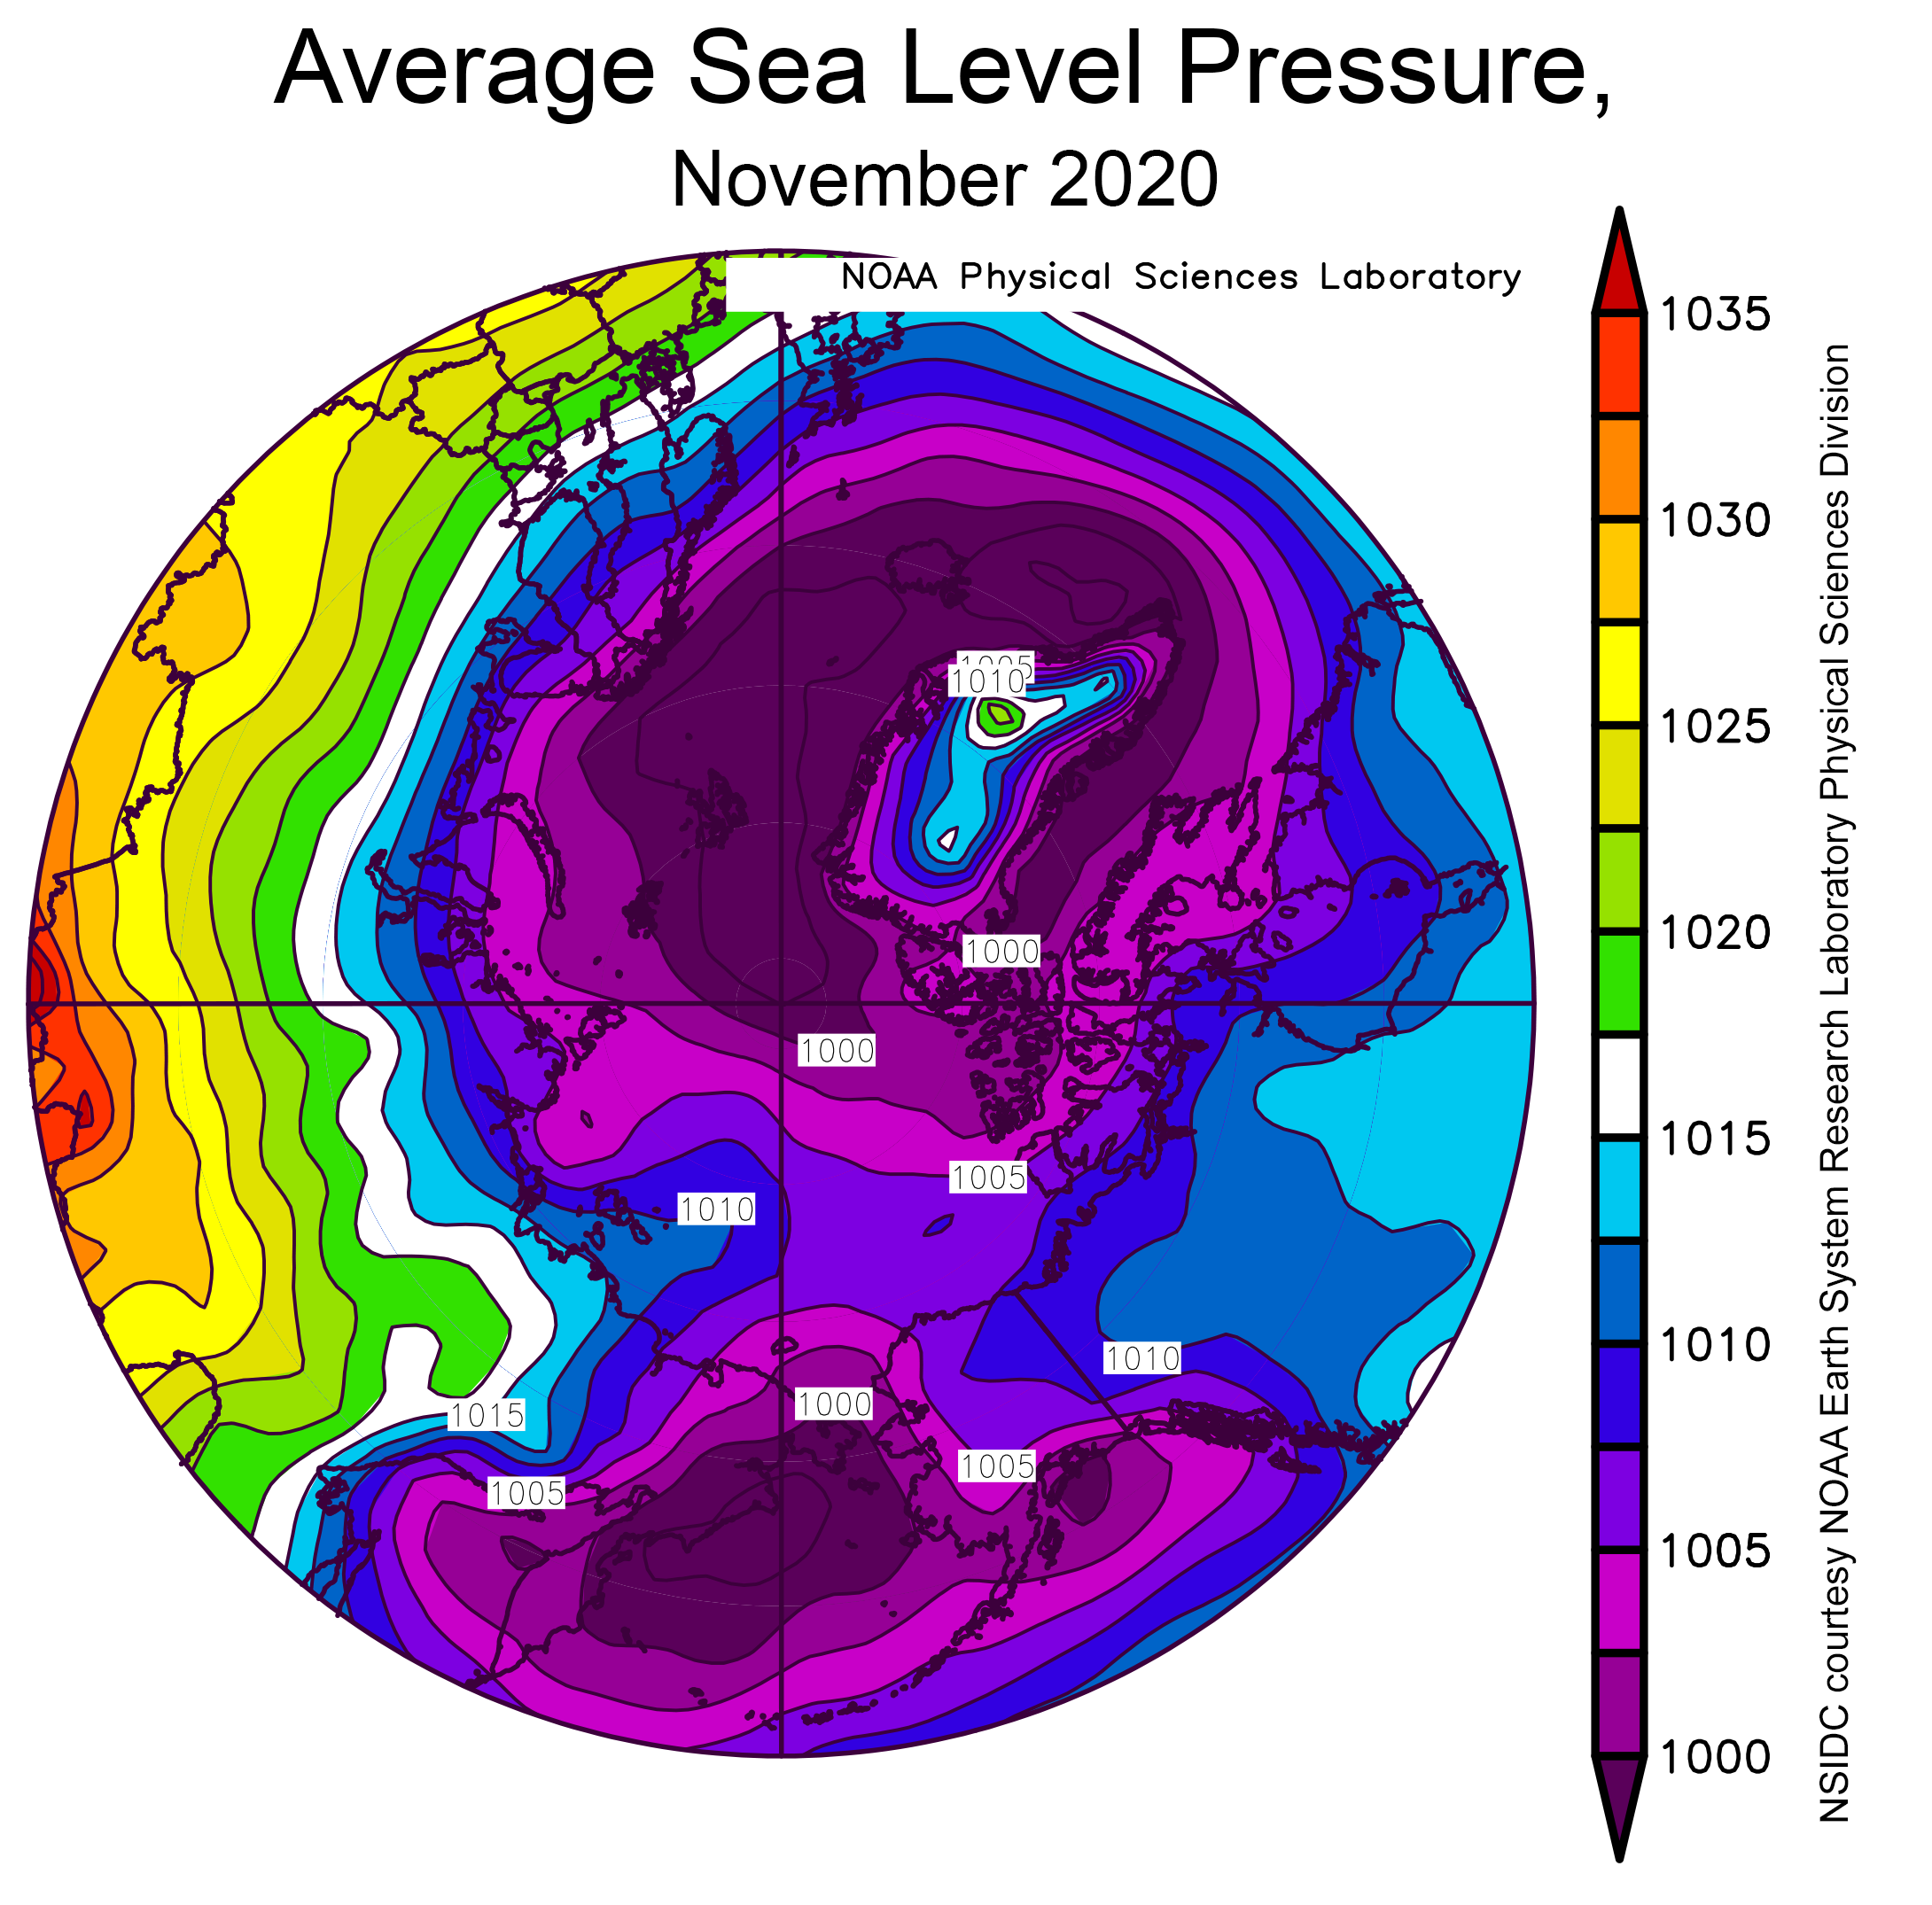
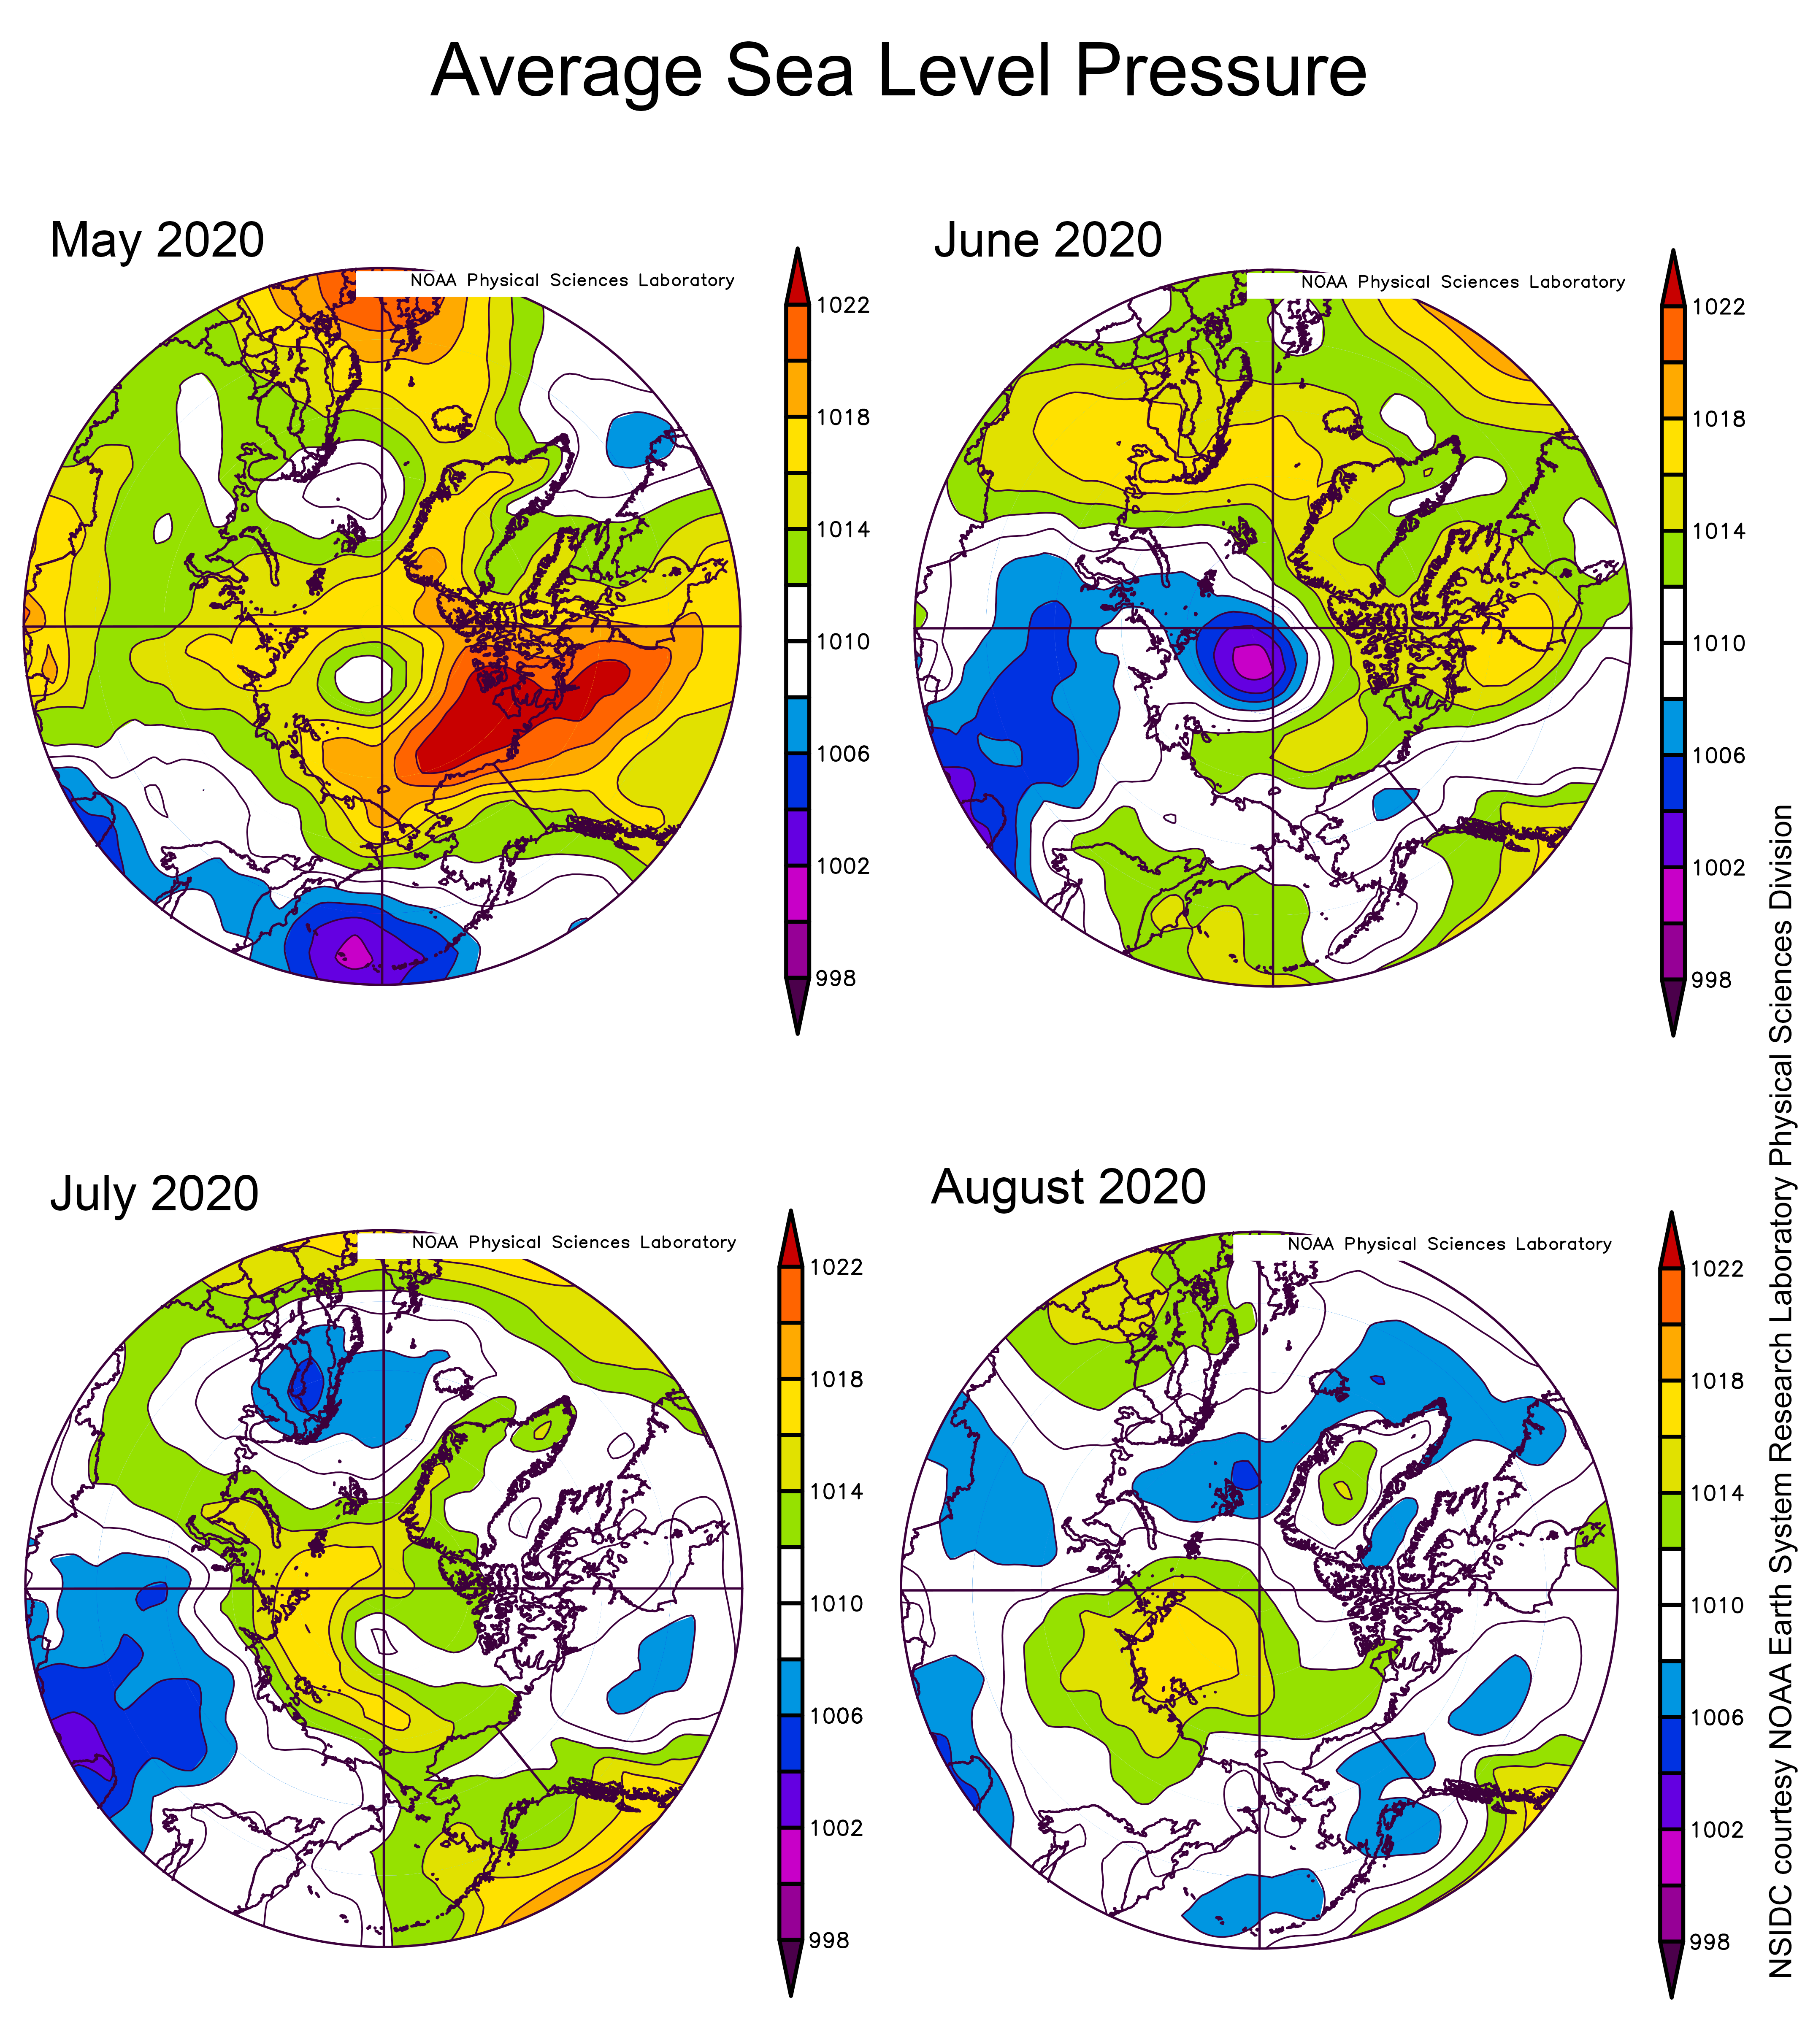
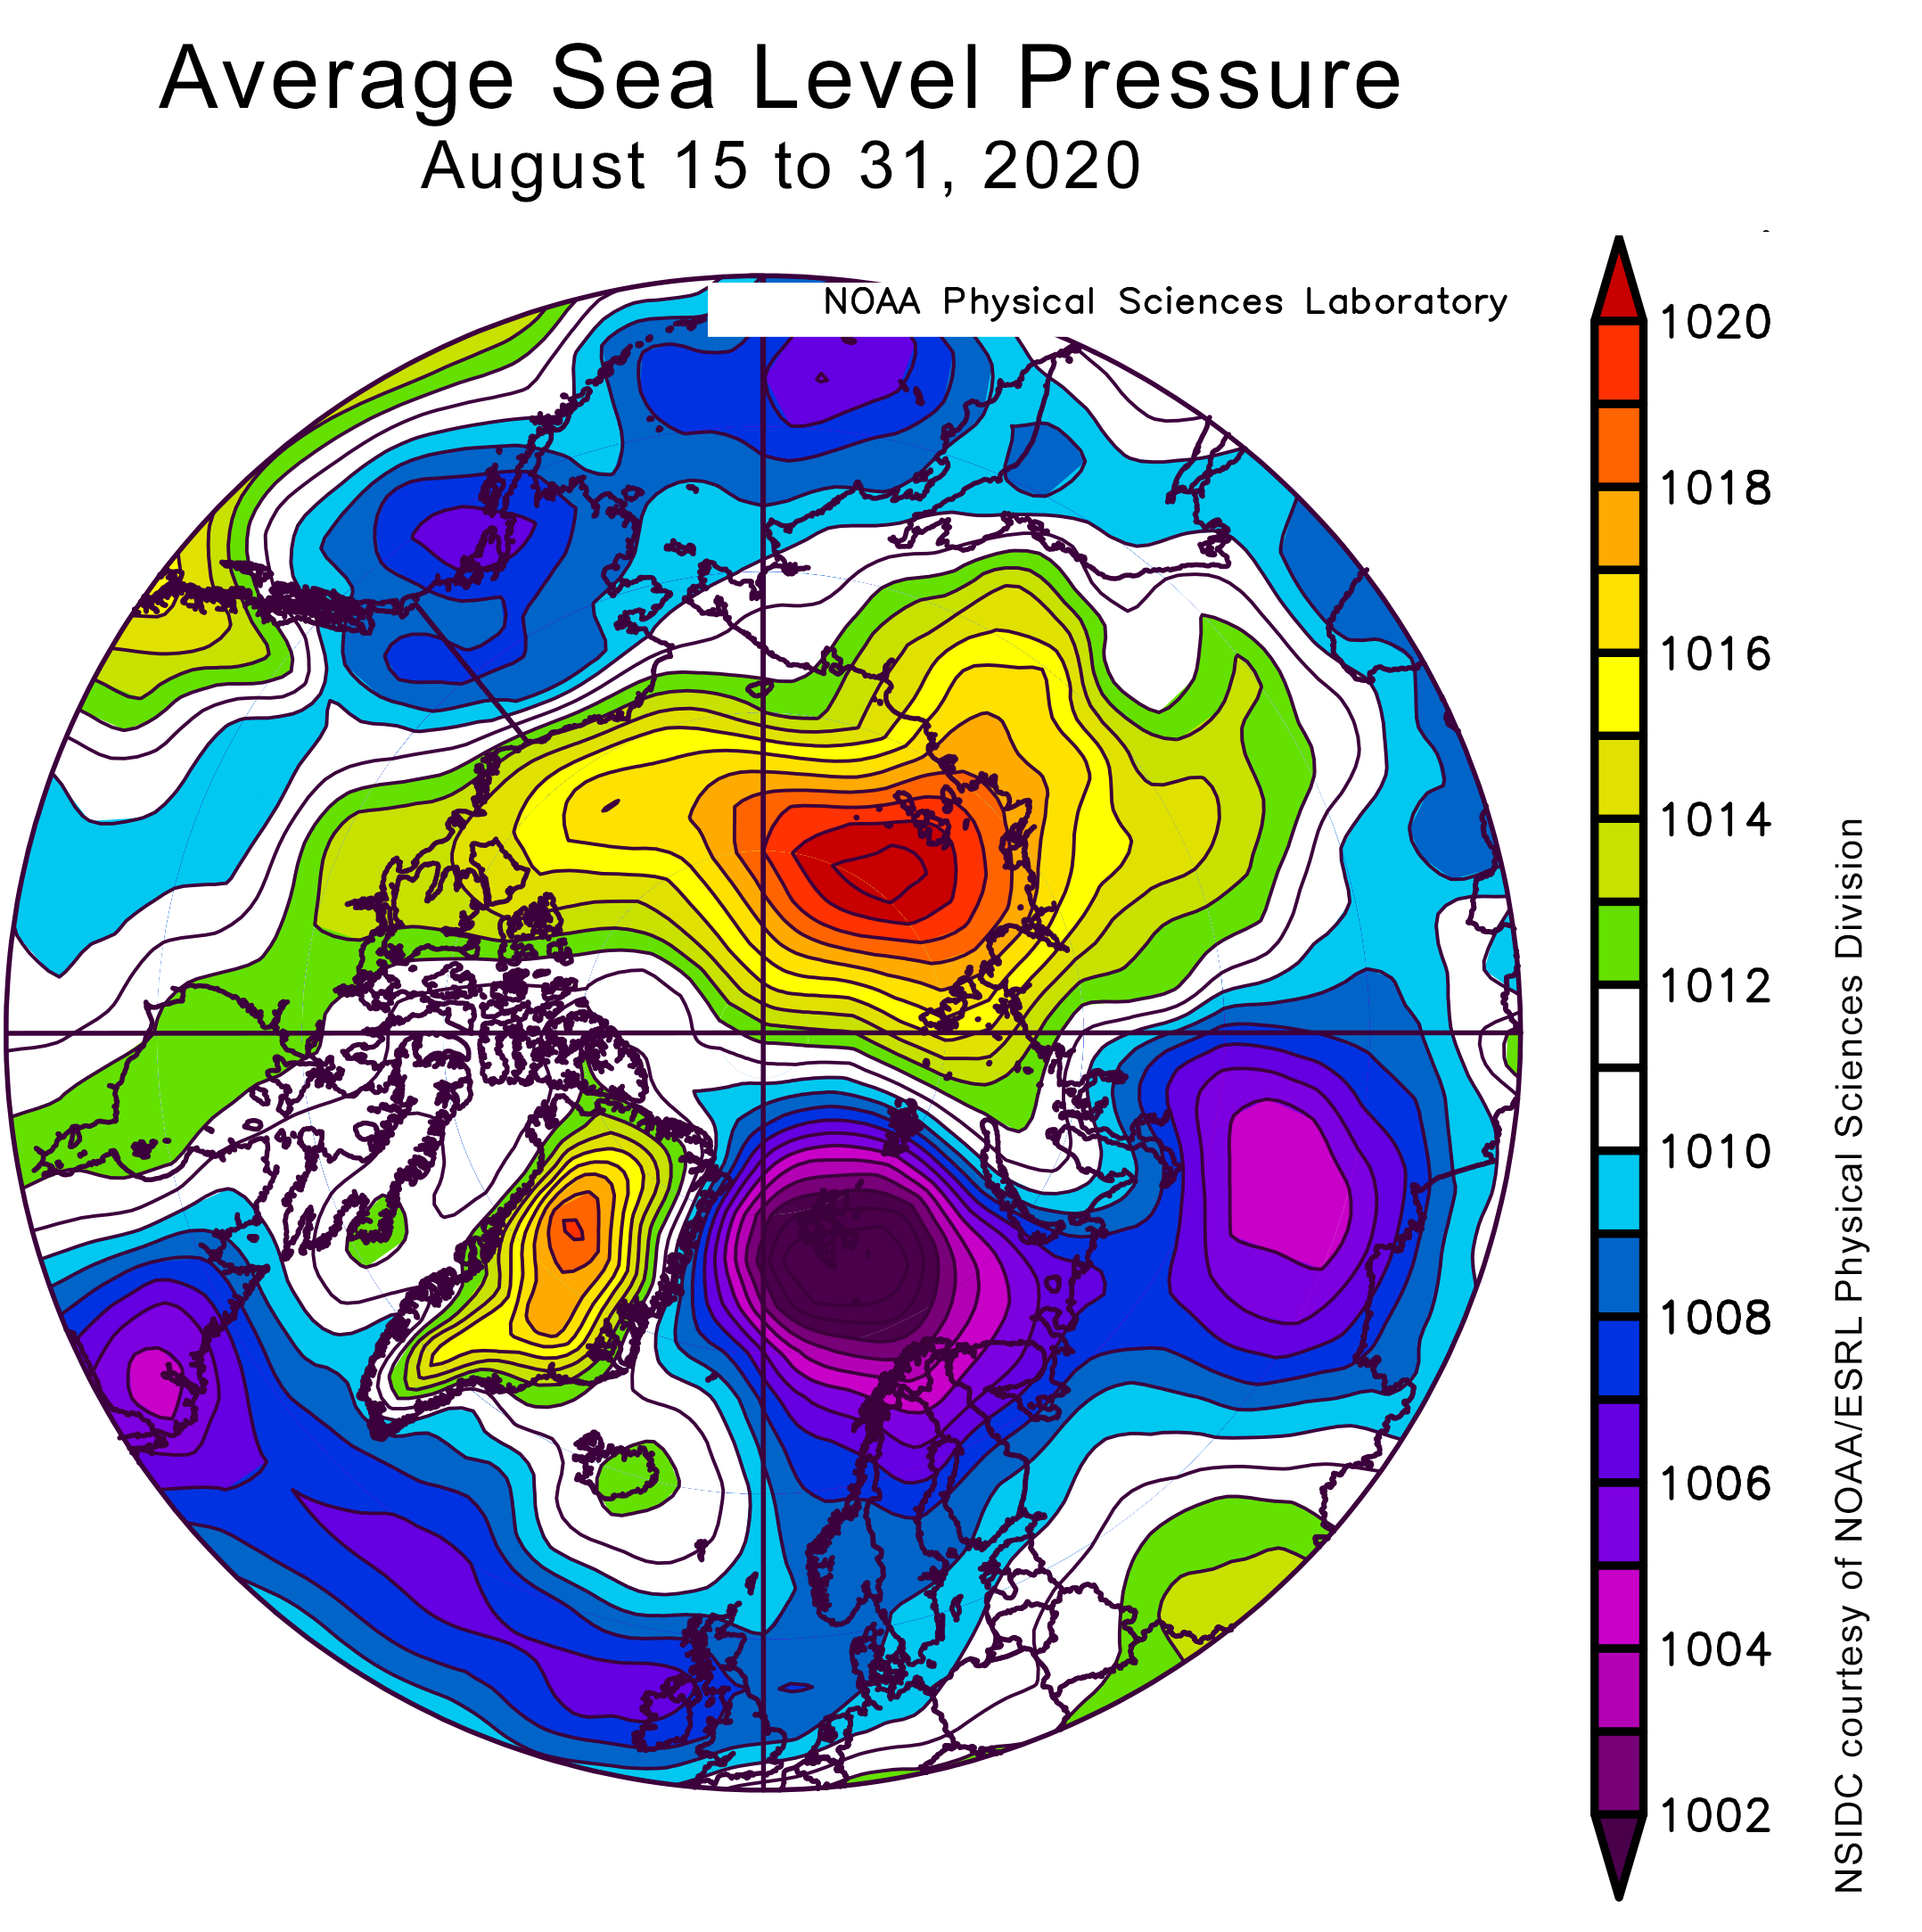
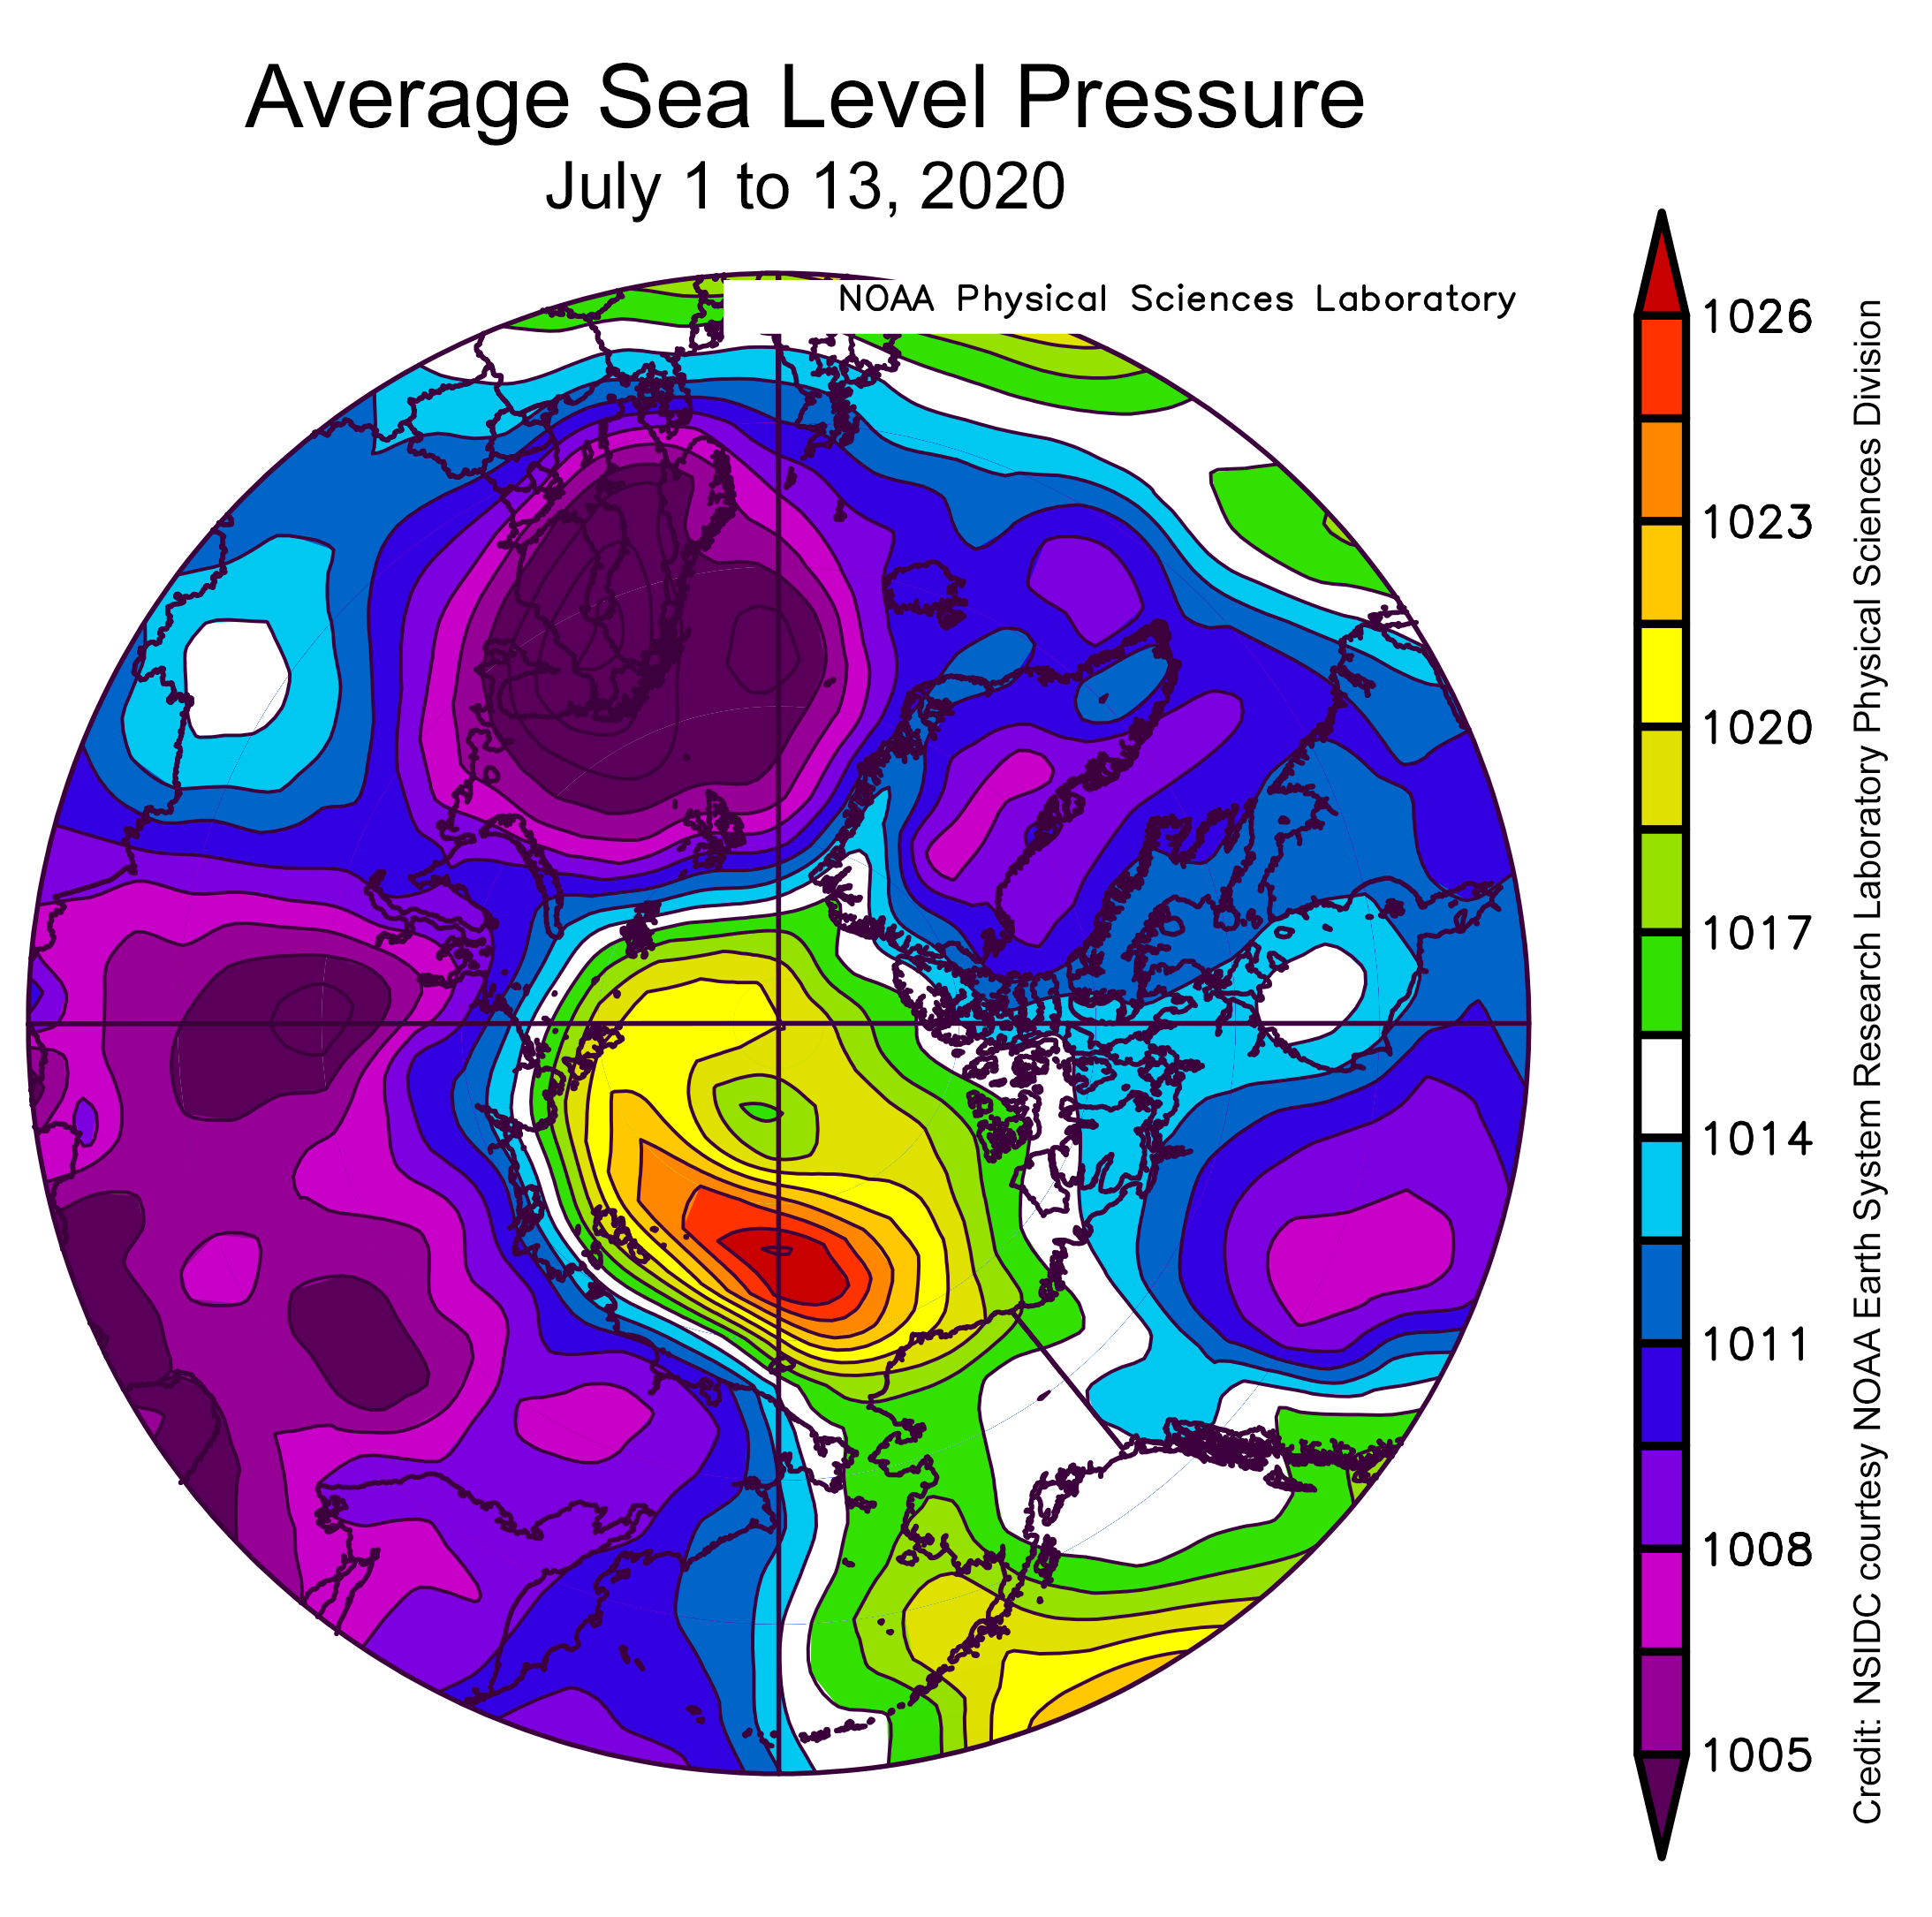
Figure 2a. This plot shows average sea level pressure in the Arctic in millibars from July 1 to 12, 2021. Yellows and reds indicate high air pressure; blues and purples indicate low pressure.
Credit: NSIDC courtesy NOAA Earth System Research Laboratory Physical Sciences Laboratory
High-resolution image
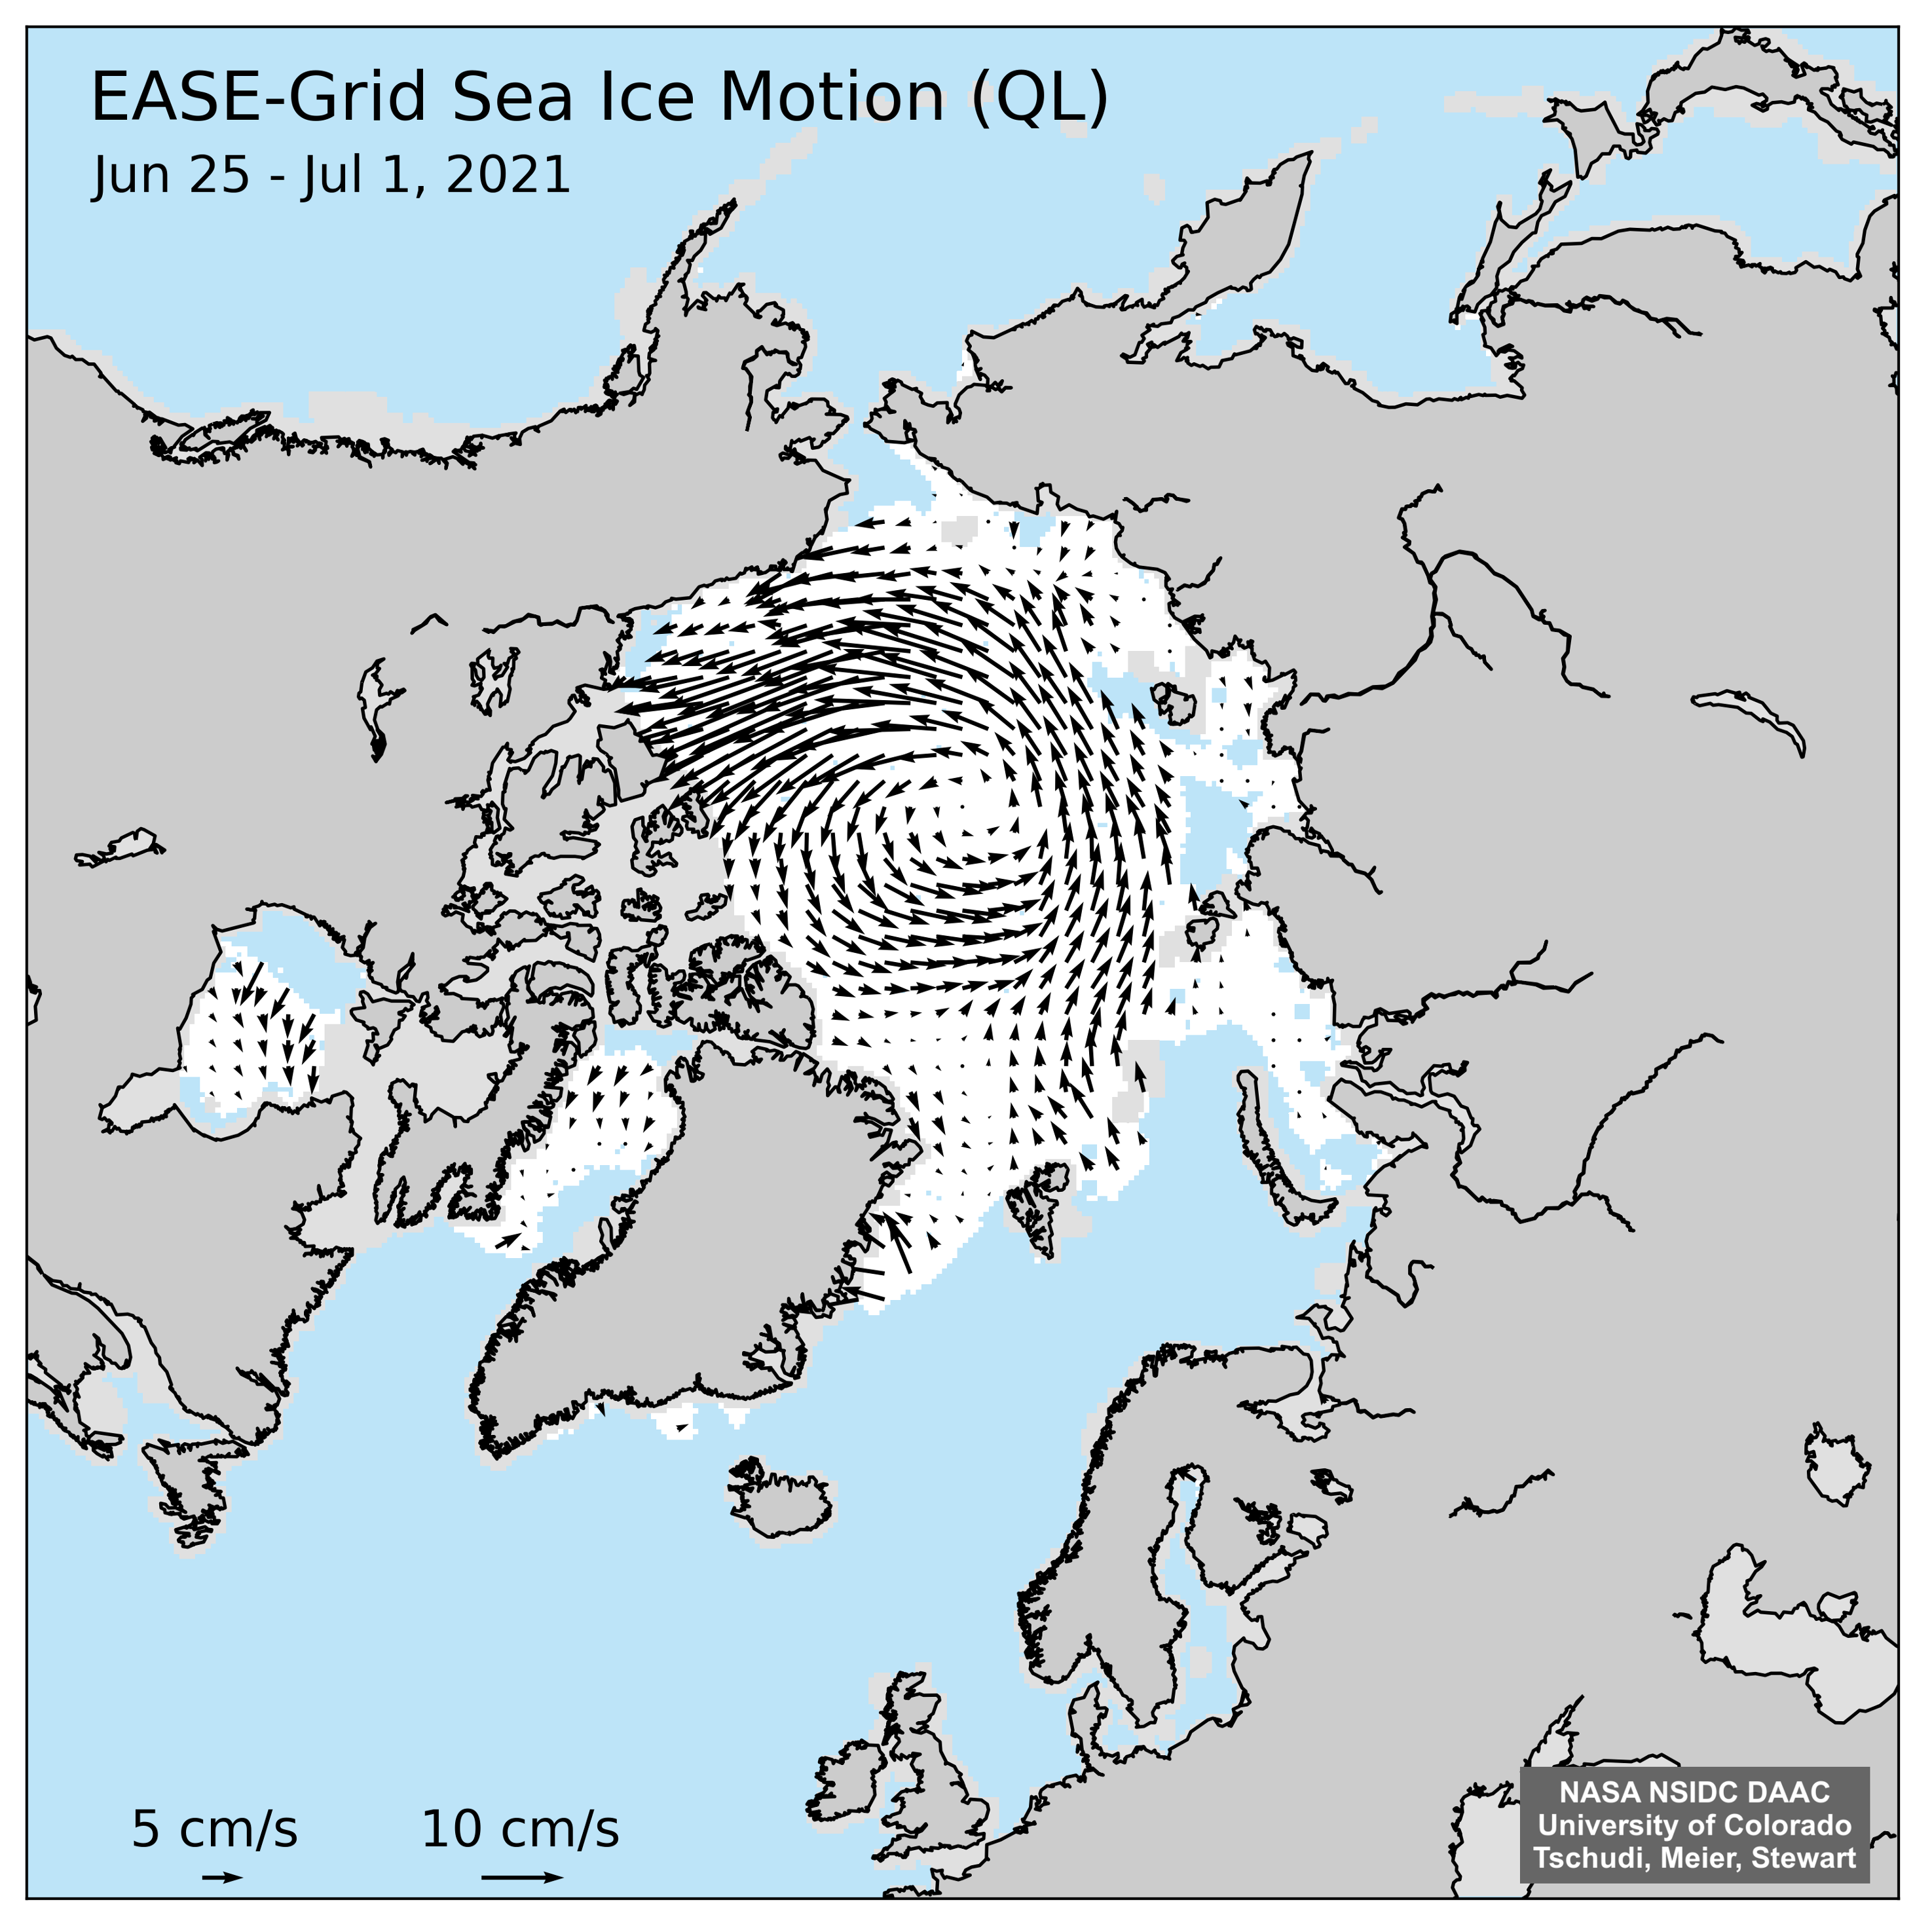
Figure 2b. This plot shows the direction of sea ice motion for the period between June 25 and July 1, 2021. Data are from the Quicklook Arctic Weekly EASE-Grid Sea Ice Motion Vector, a NASA NSIDC DAAC data product.
Credit: M. Tschudi, W. Meier, and Stewart/NASA National Snow and Ice Data Center Distributed Active Archive Center (NSIDC DAAC)
High-resolution image
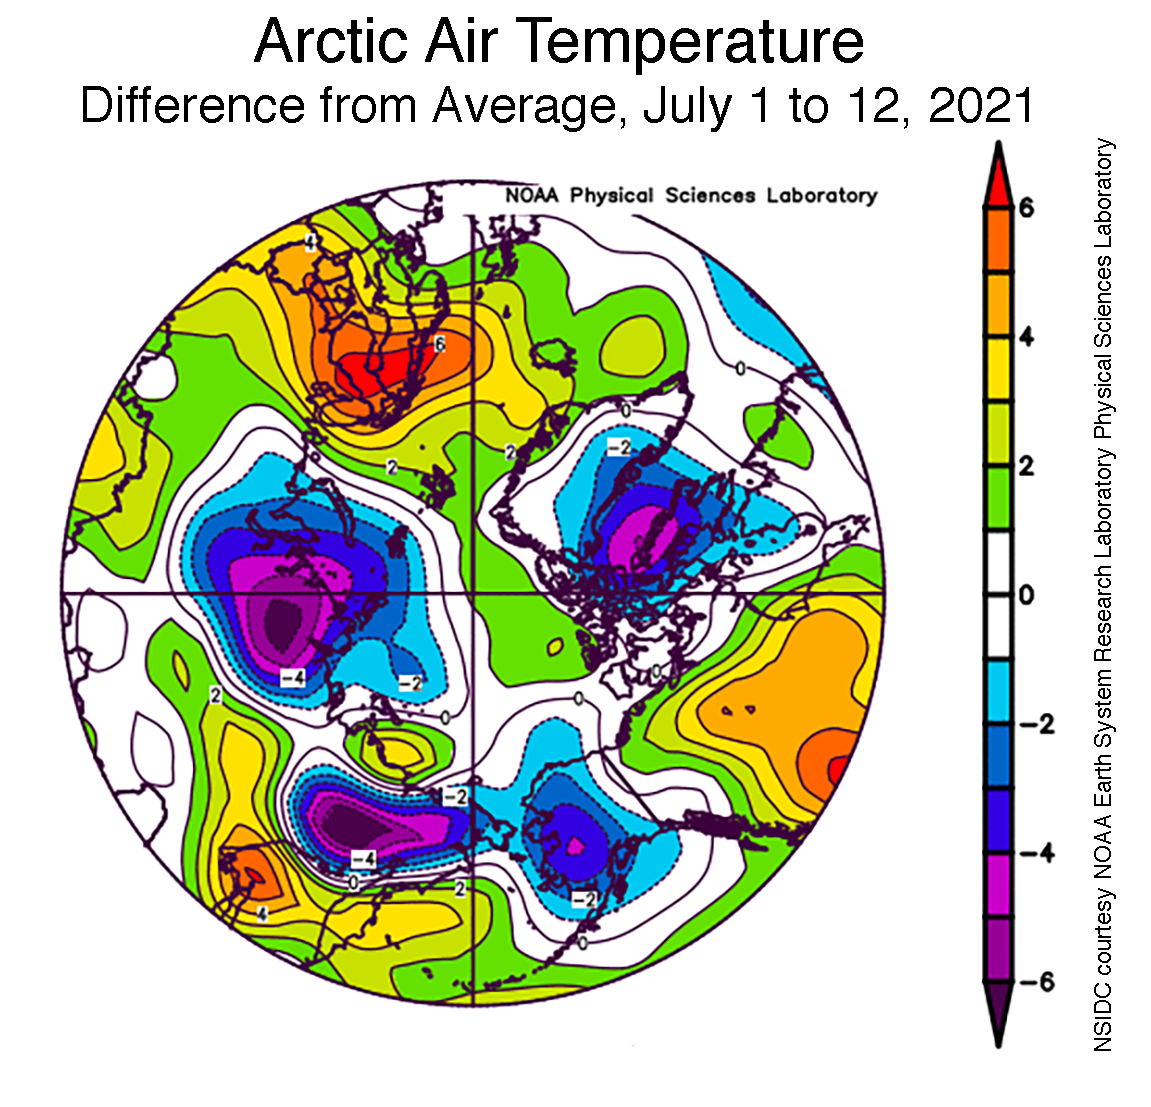
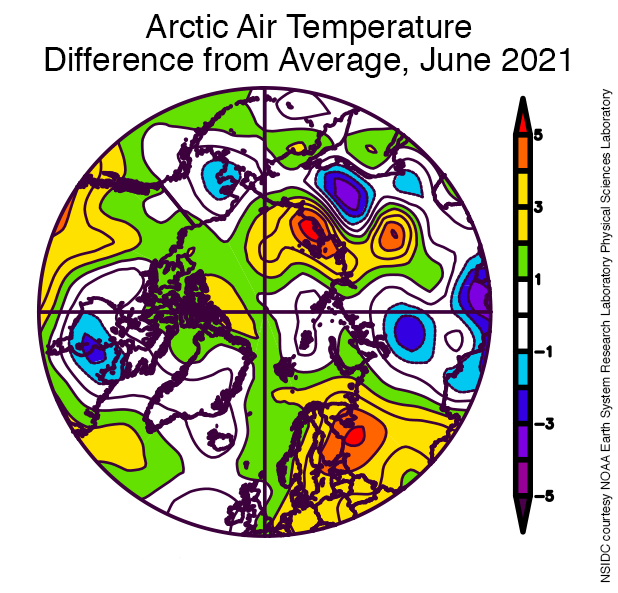
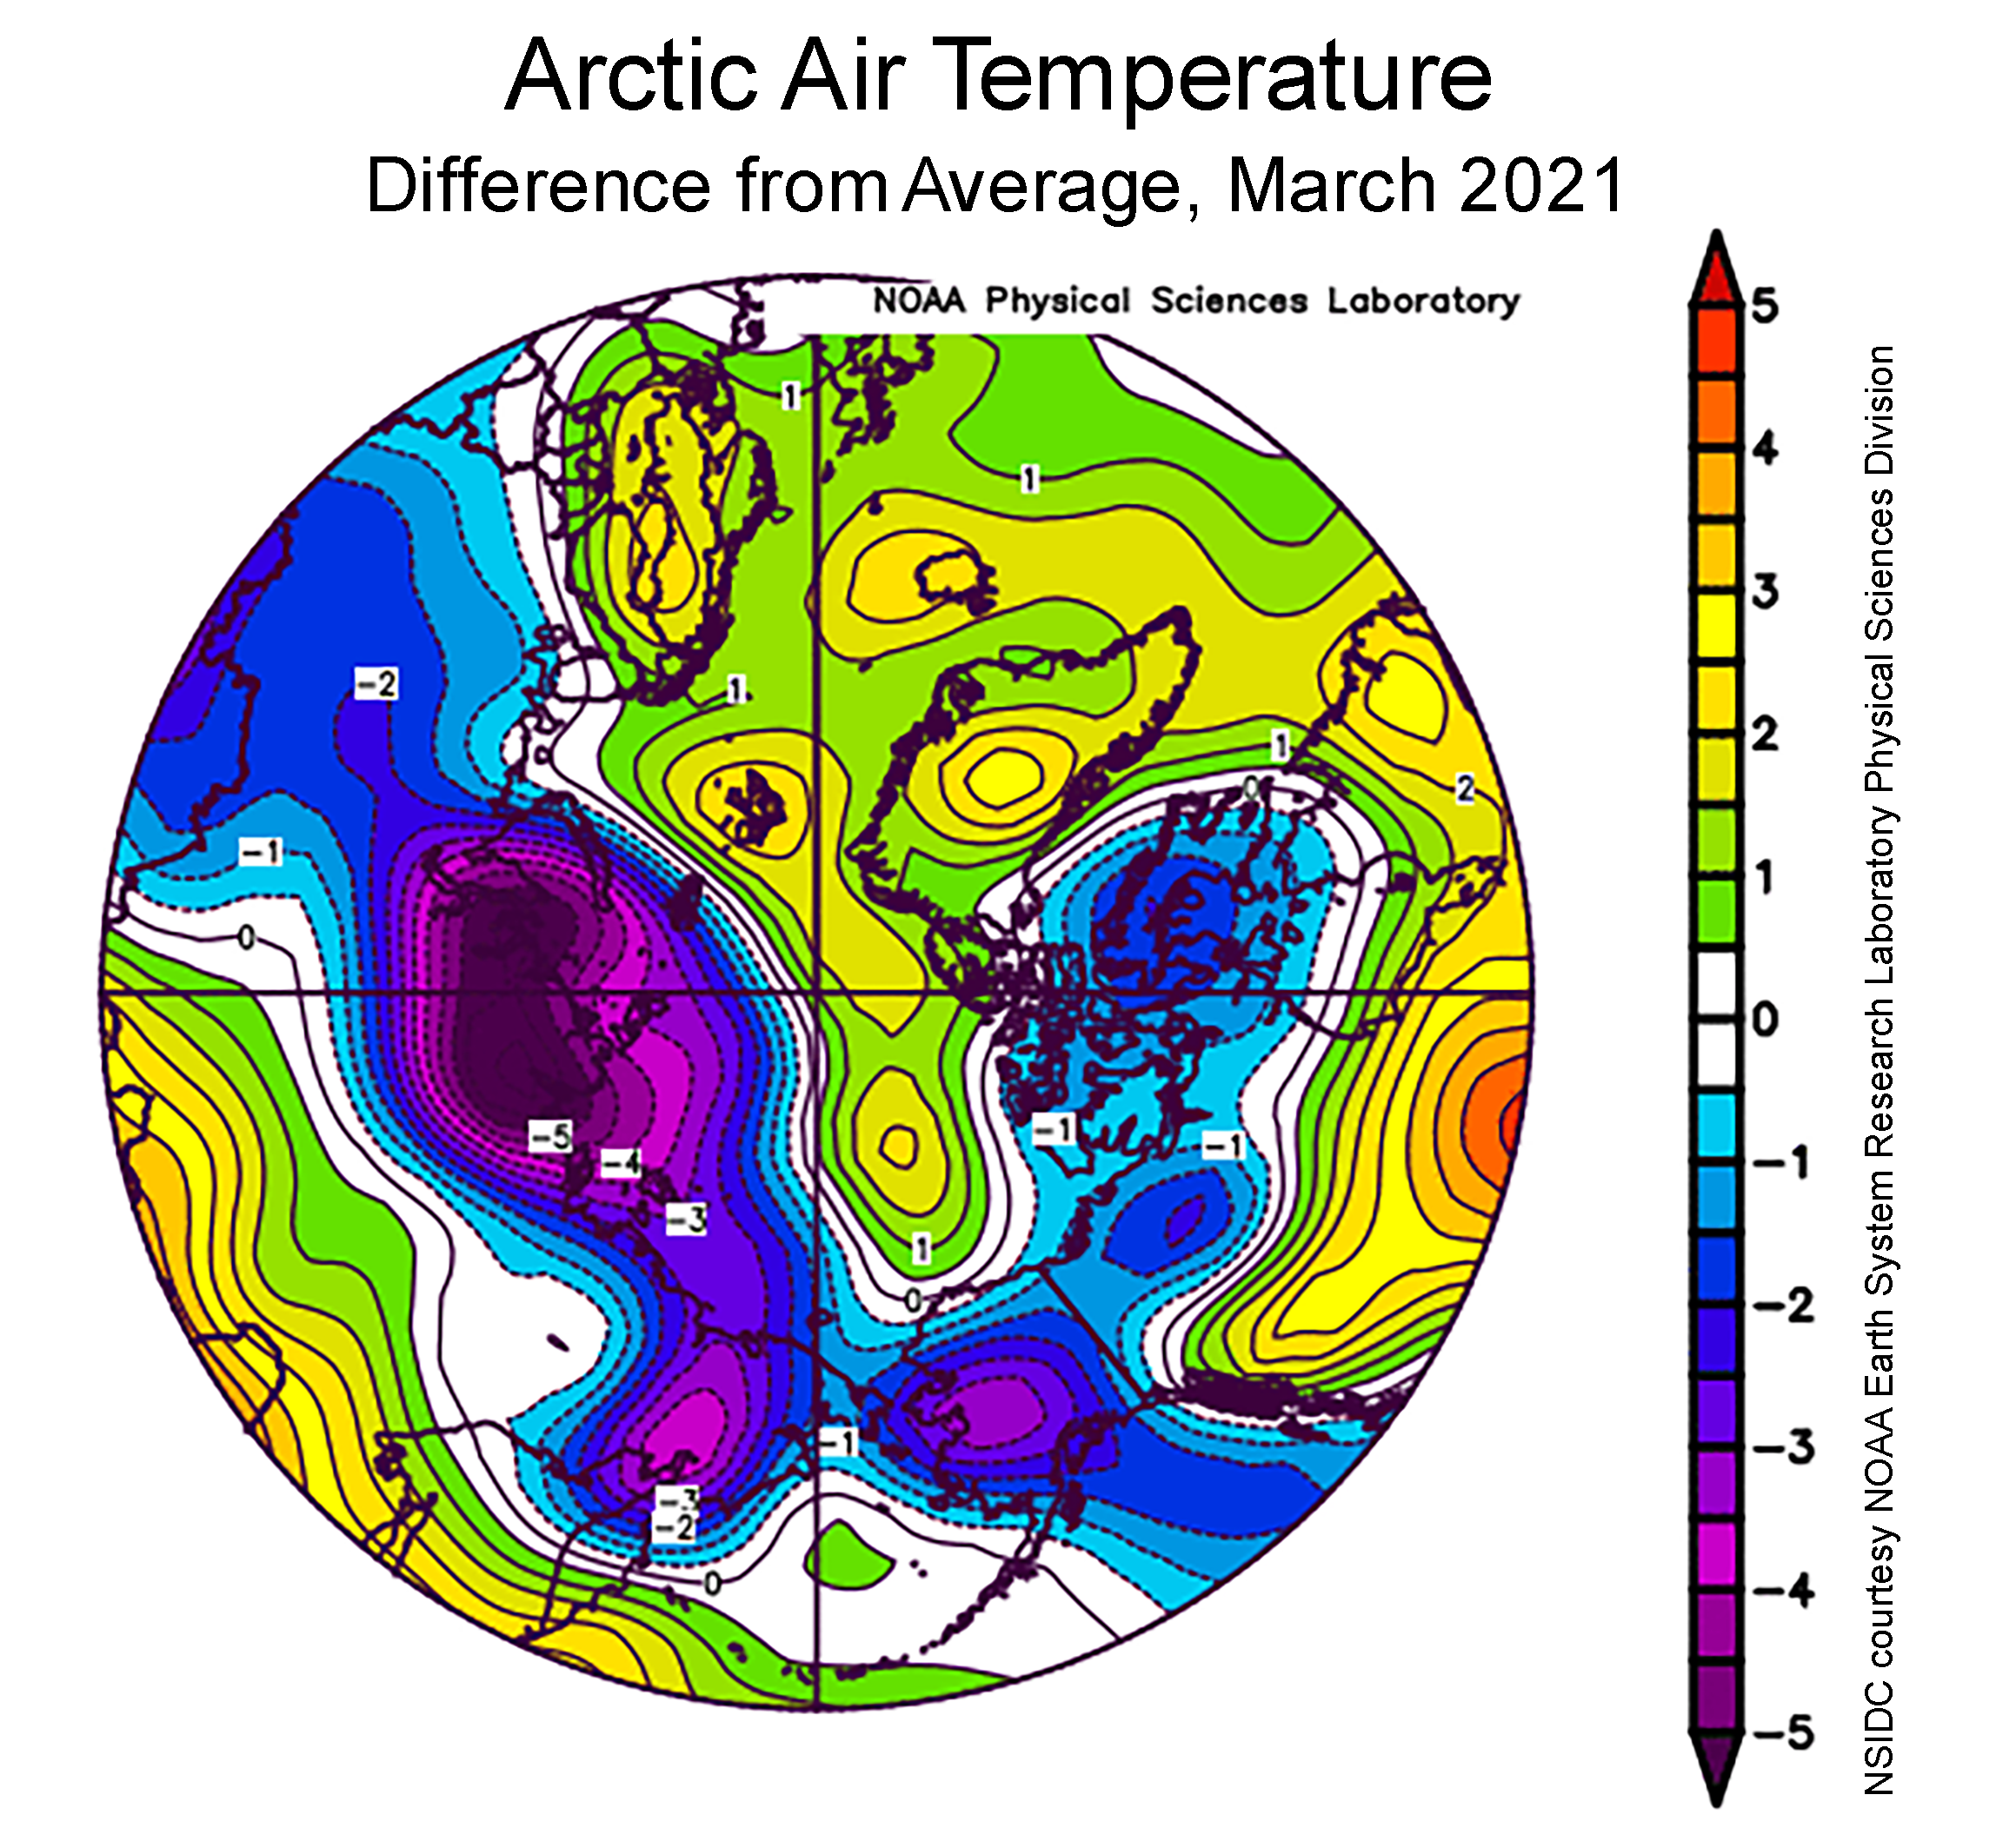
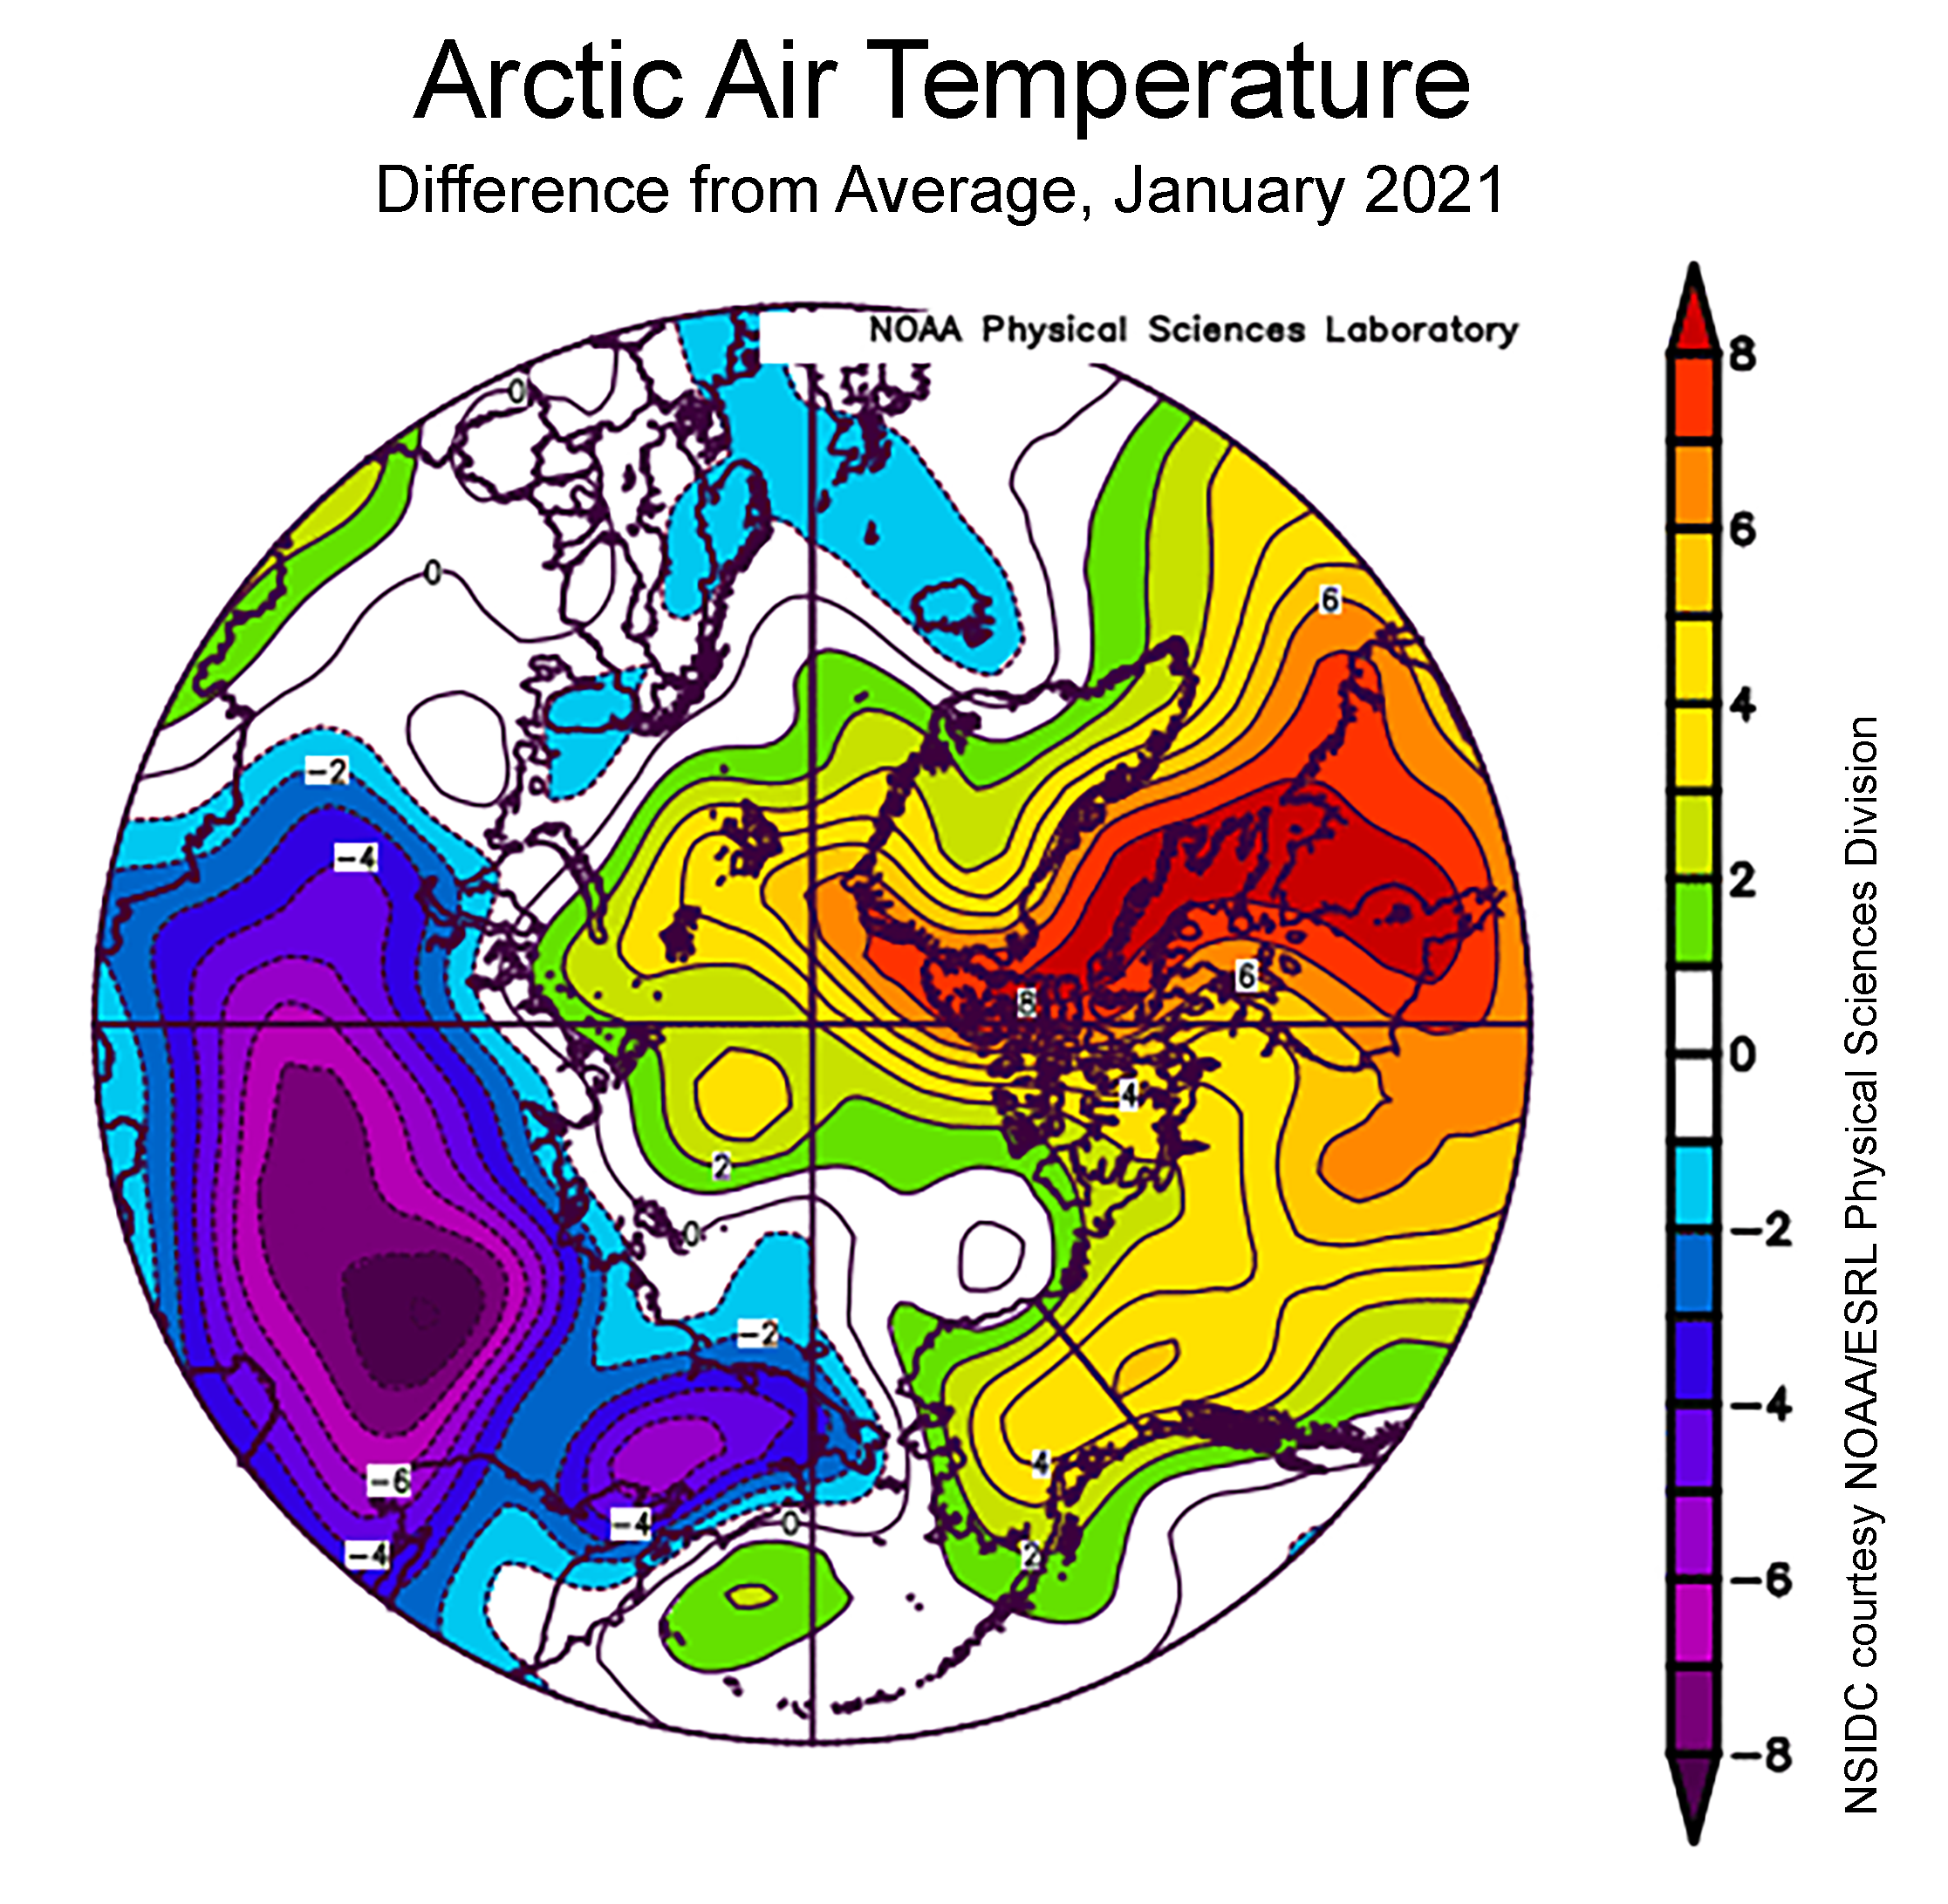
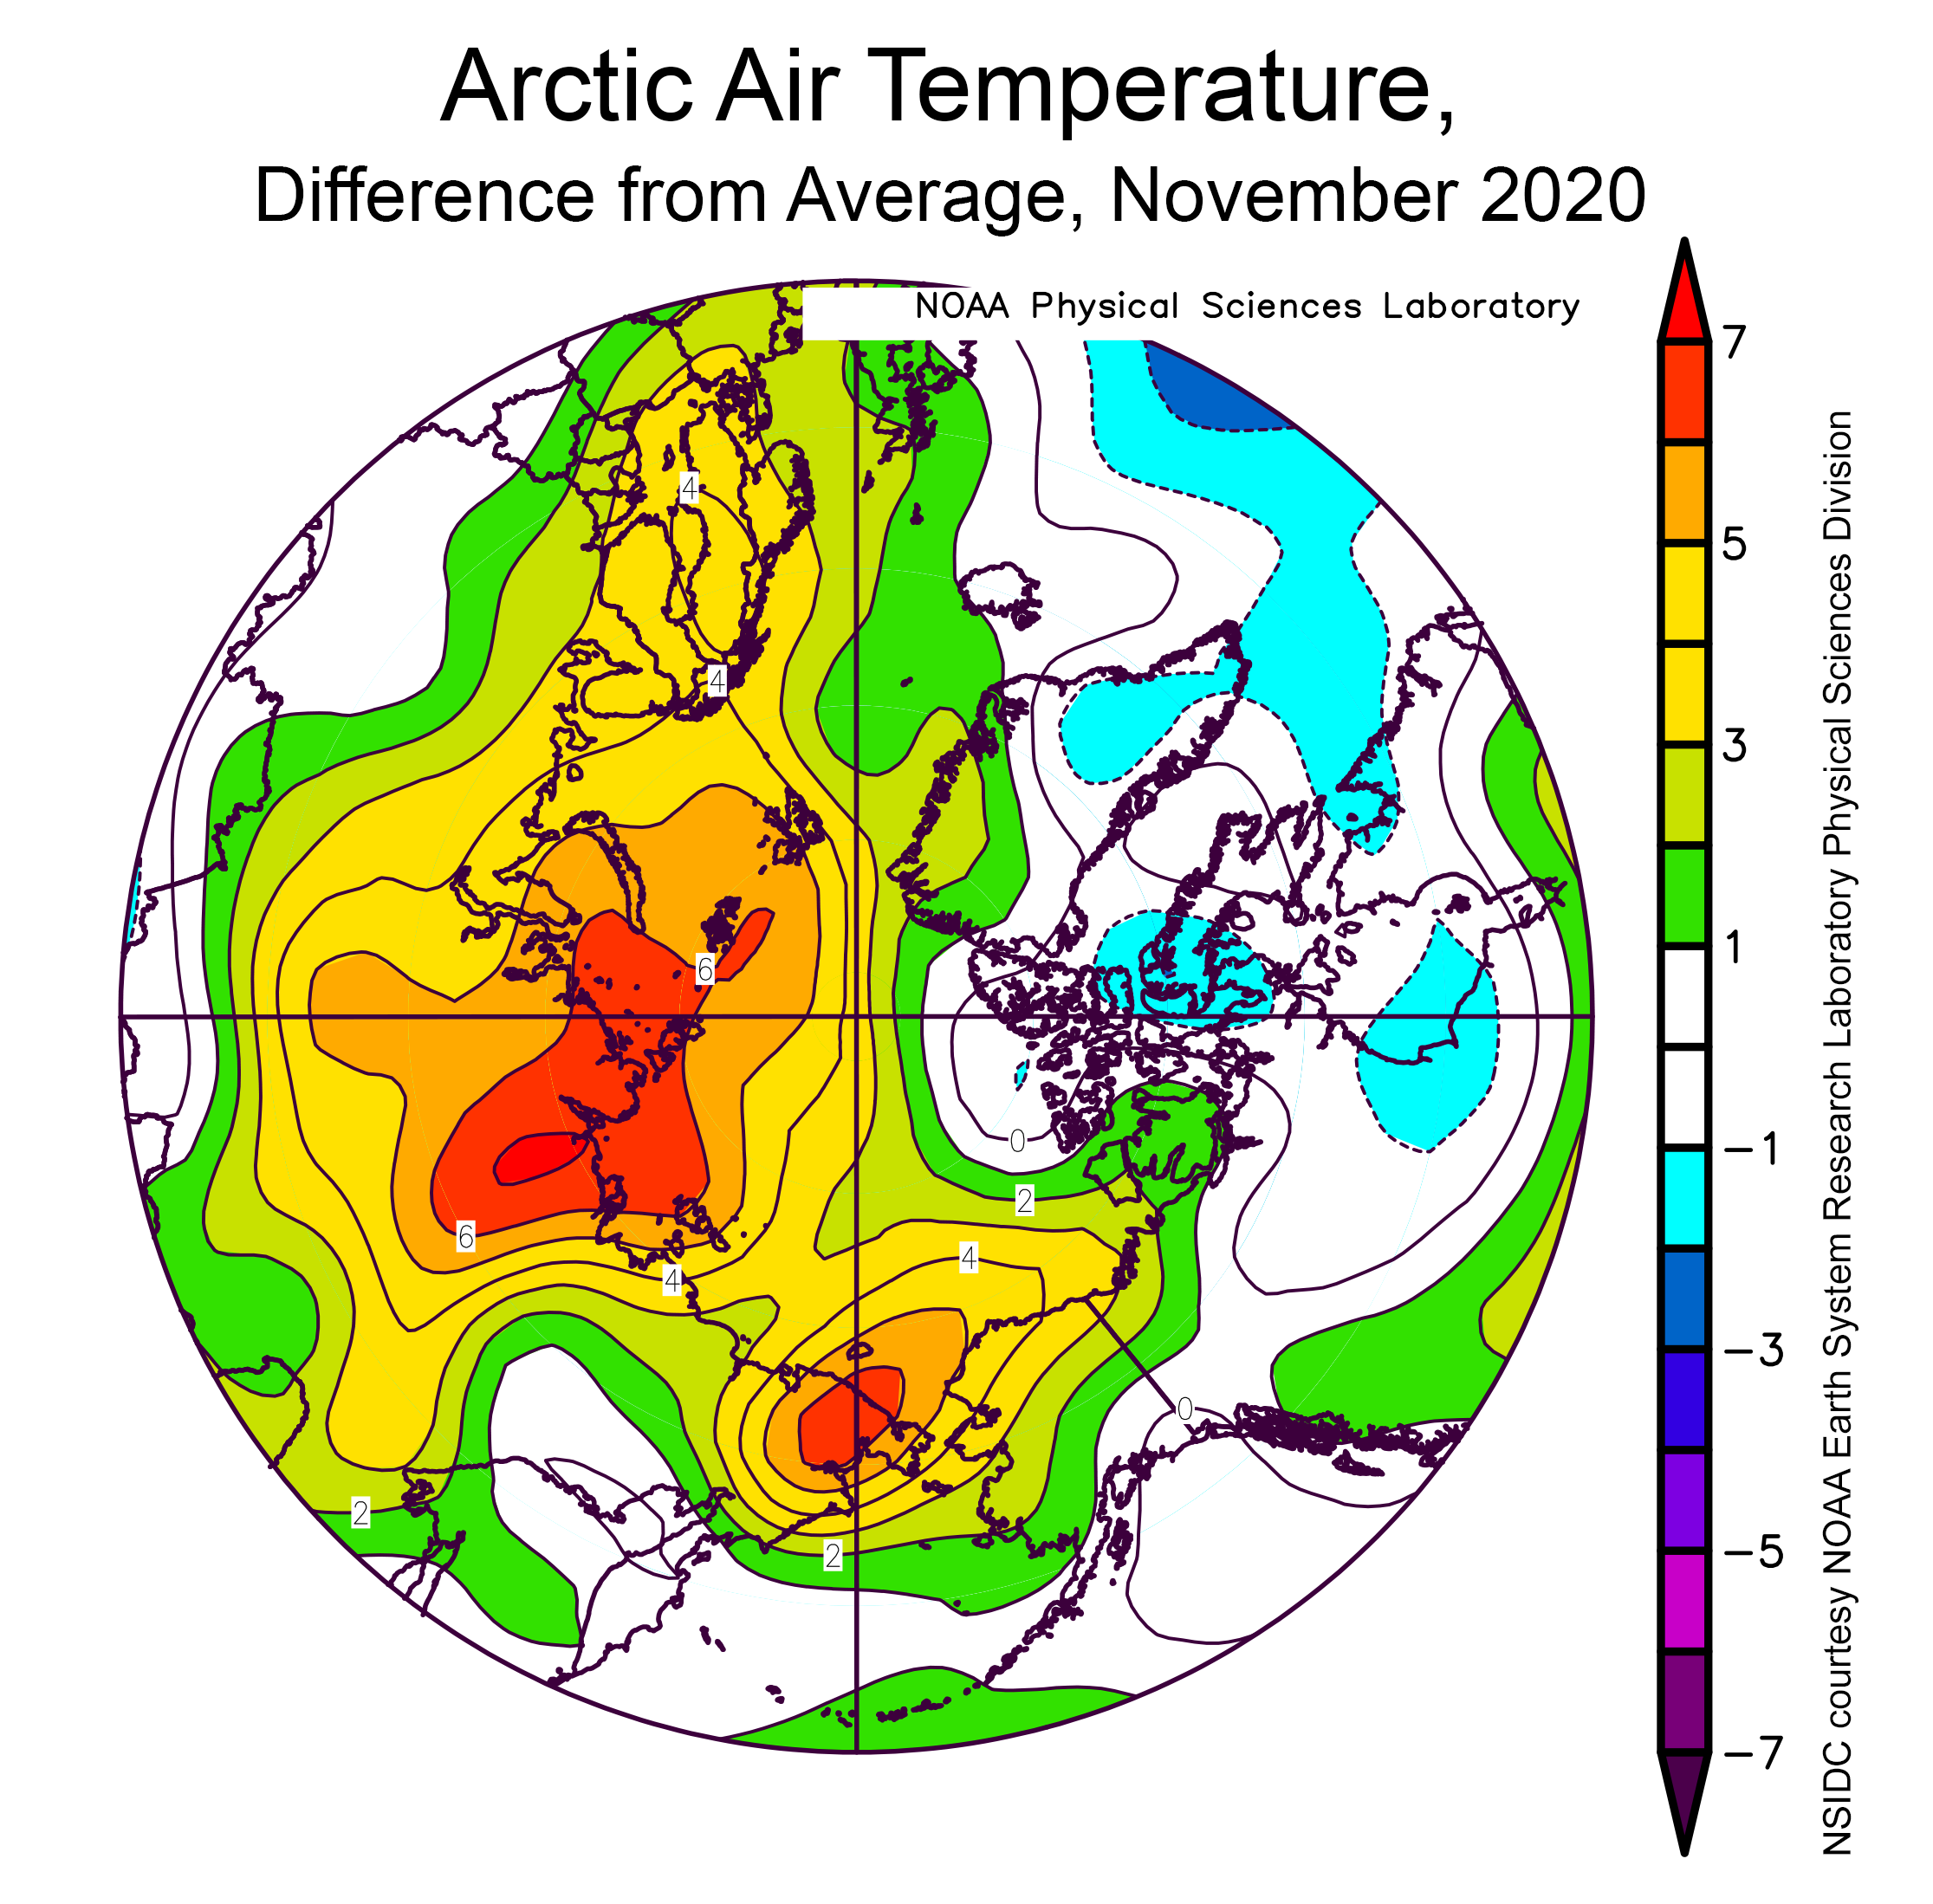
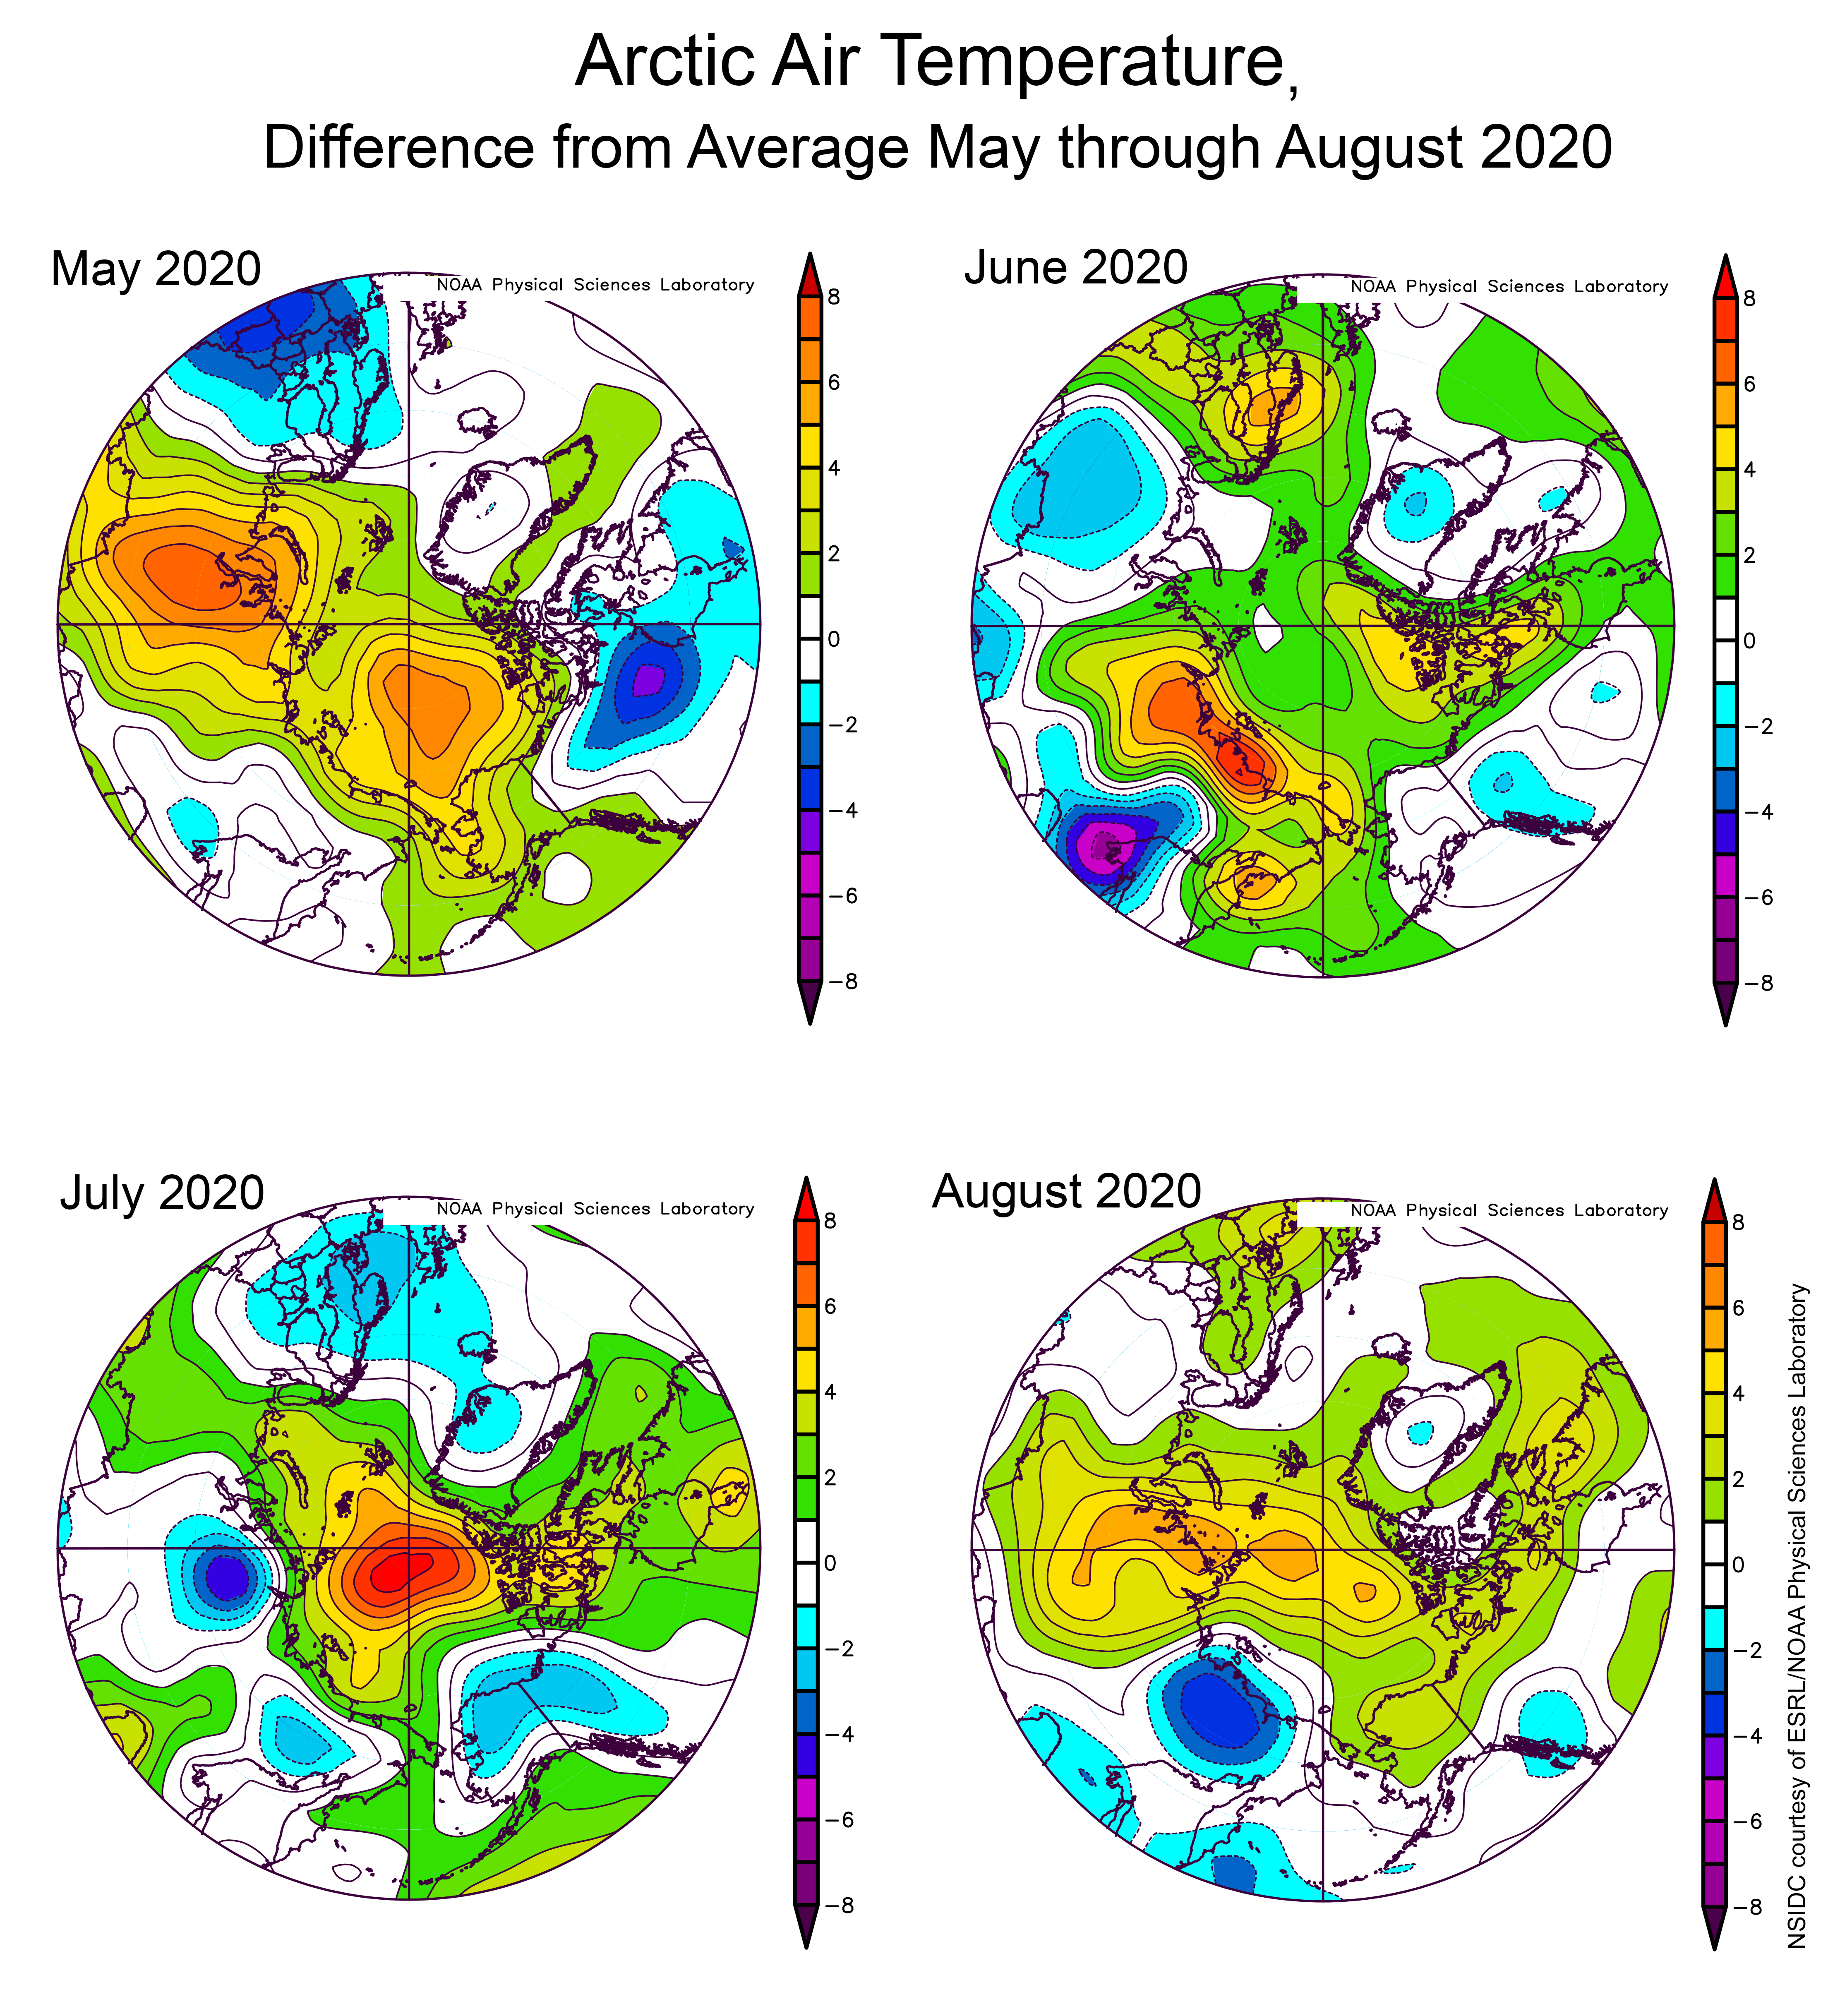
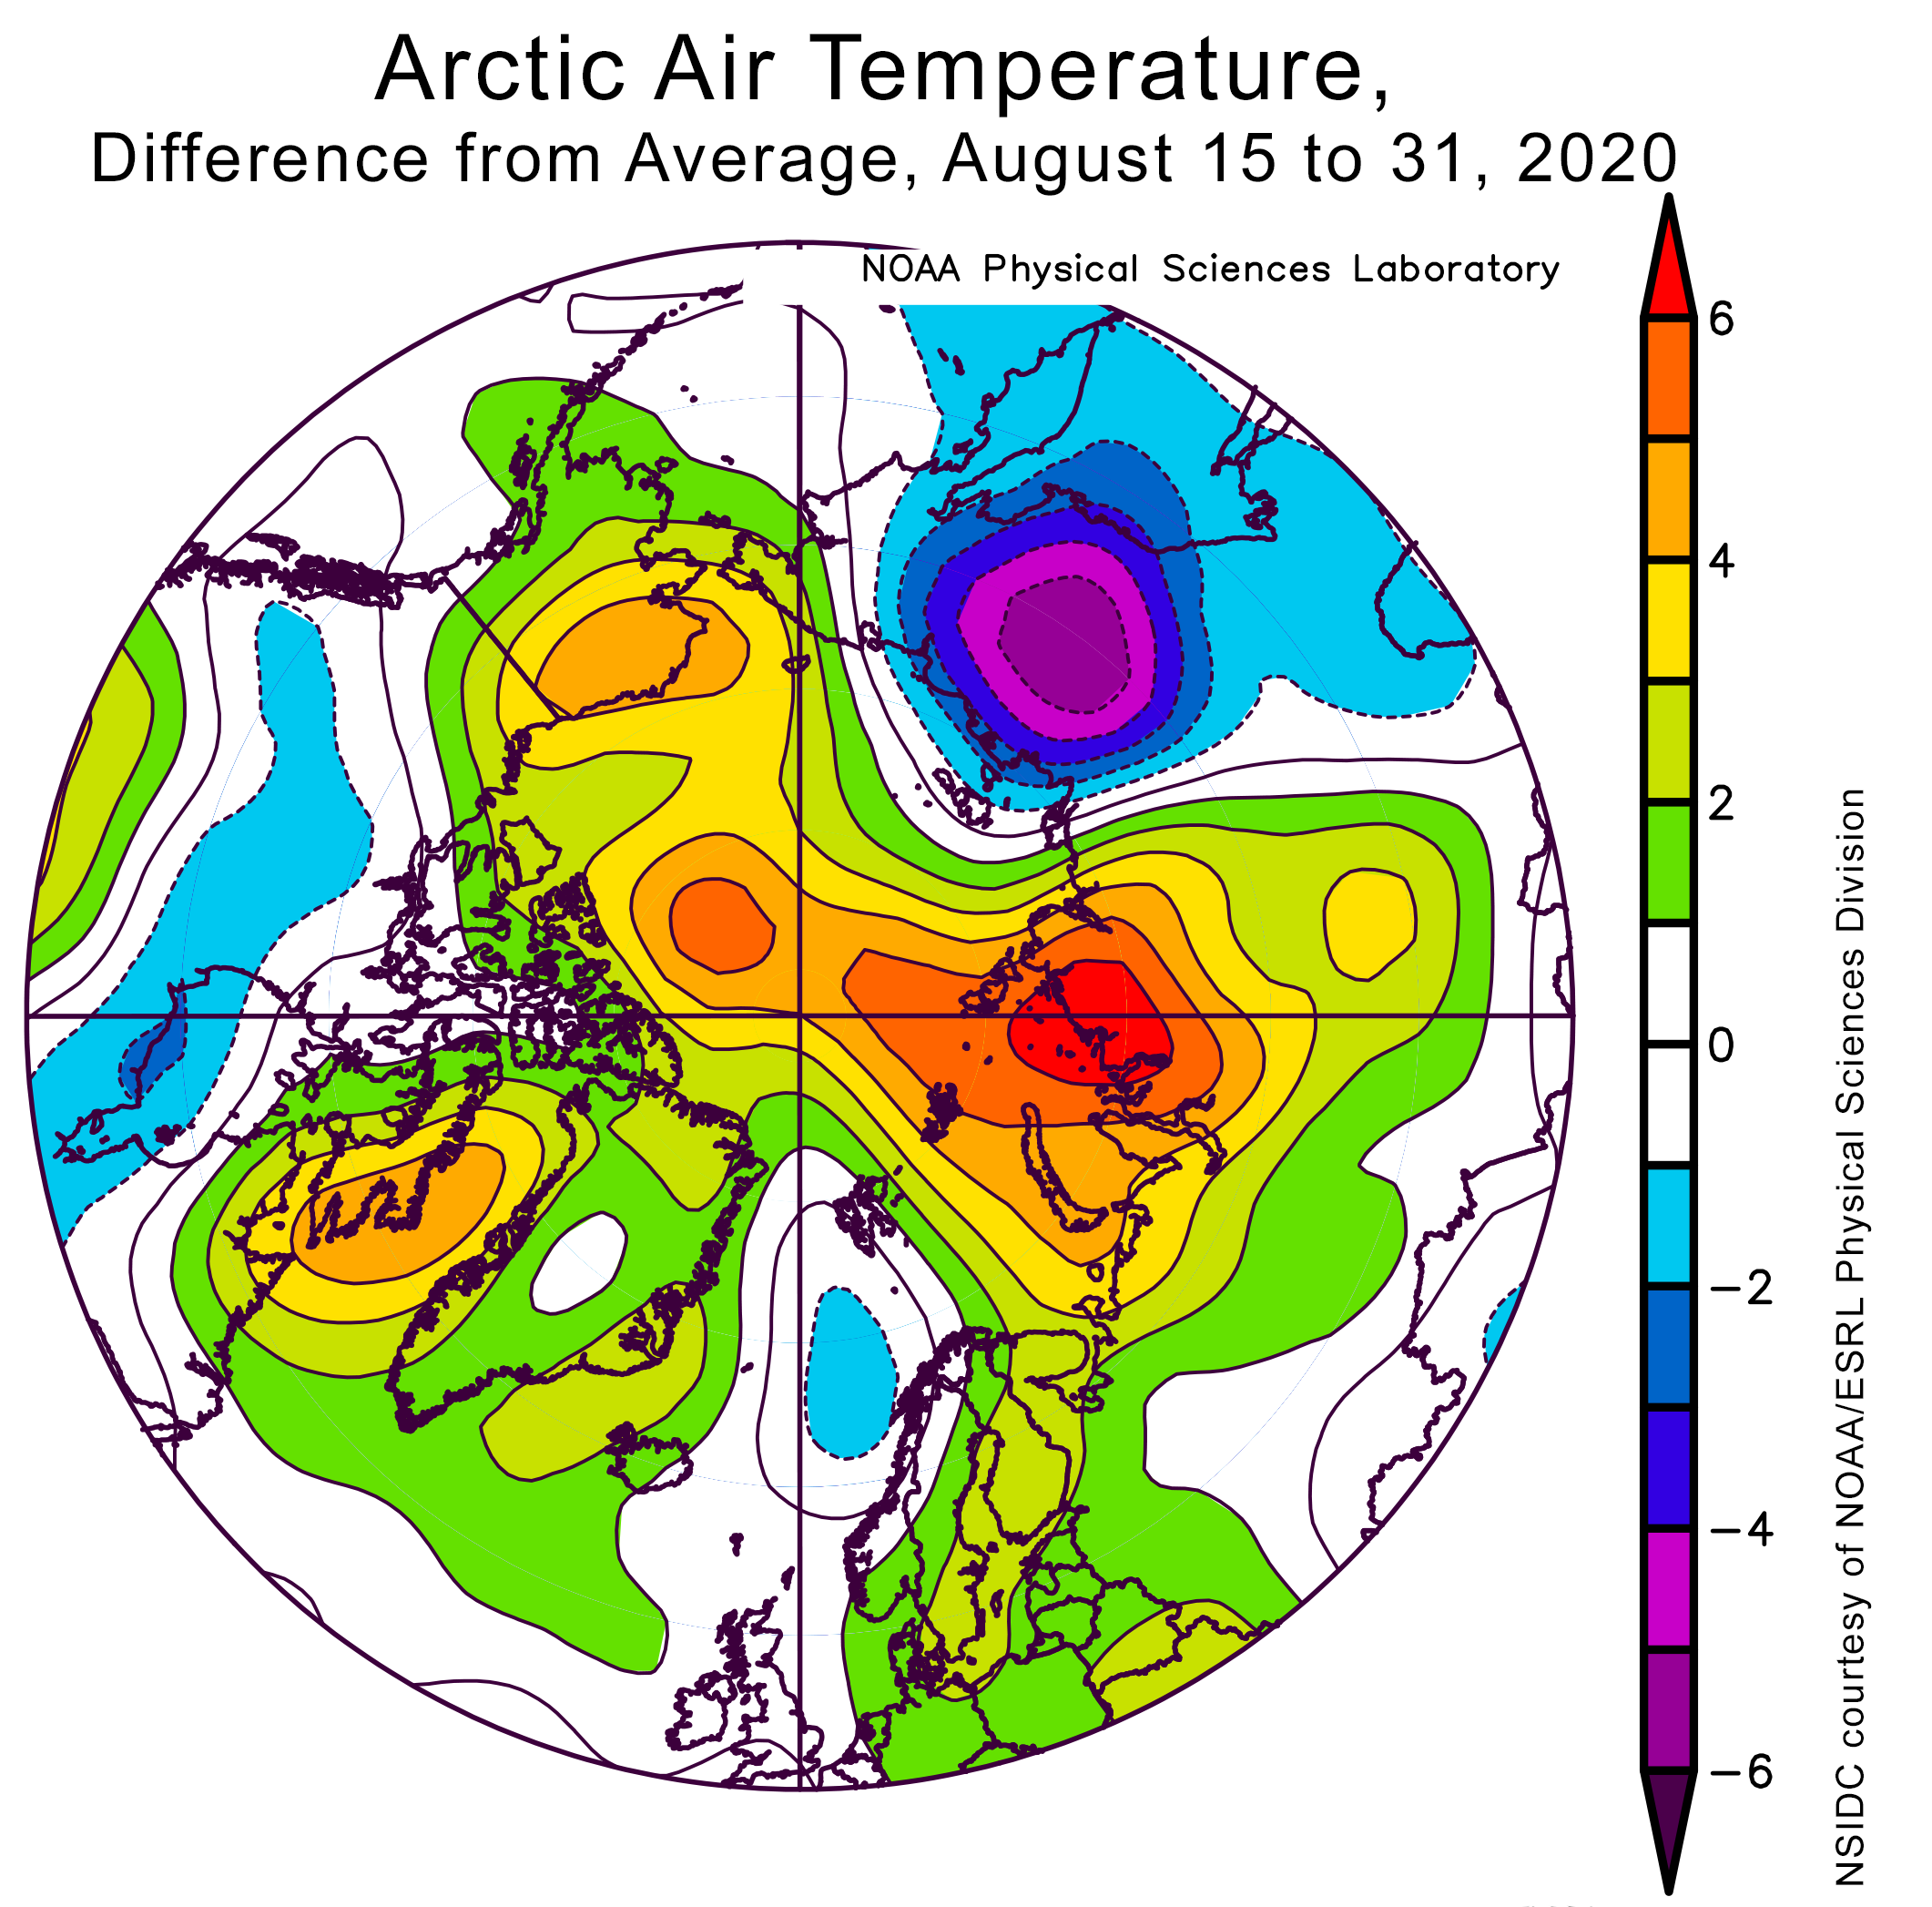
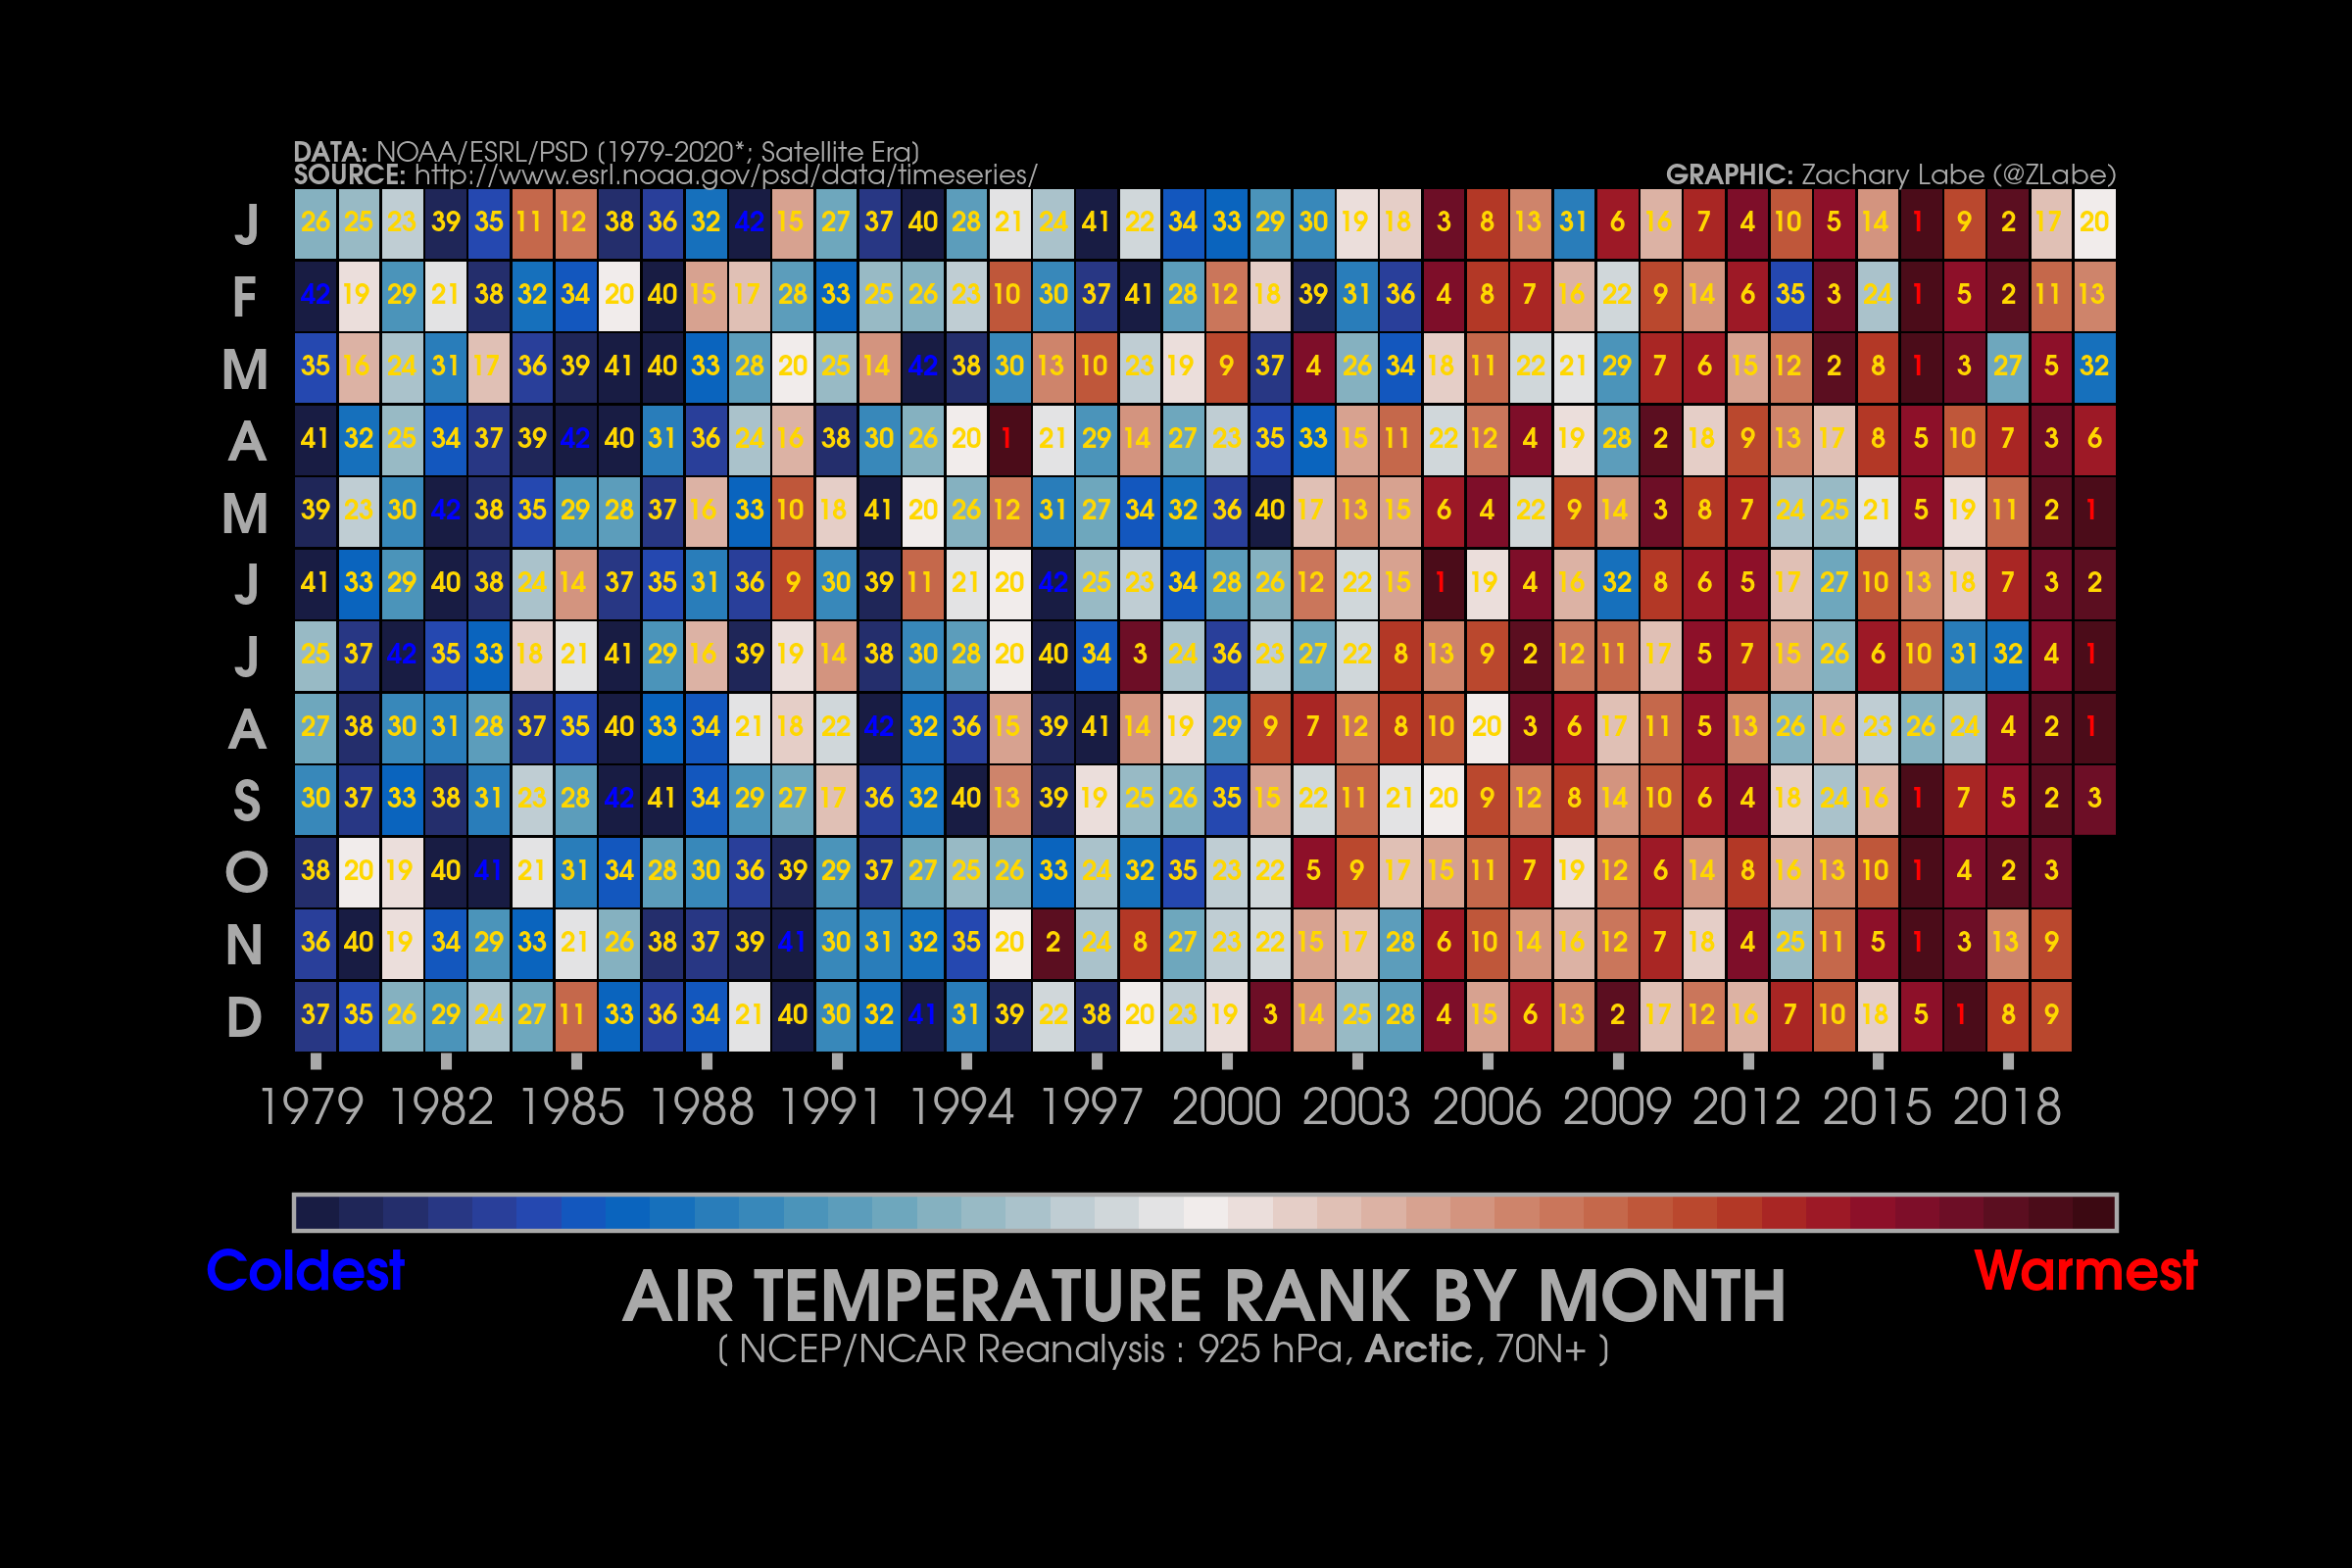
Figure 2c. This plot shows the departure from average sea level pressure in the Arctic at the 925 hPa level, in degrees Celsius, from July 1 to 12, 2021. Yellows and reds indicate higher than average air pressures; blues and purples indicate lower than average air pressures.
Credit: NSIDC courtesy NOAA Earth System Research Laboratory Physical Sciences Laboratory
High-resolution image
A pattern of unusually strong low pressure near the North Pole continued to dominate the average atmospheric circulation pattern for the first 12 days of July (Figure 2a). The pressure at the center of the system was up to 15 millibars below average. It is not unusual to see such a persistent pattern of low pressure set up near the pole in summer, but the center of low pressure is usually located towards the Bering Strait side of the central Arctic. Past research has shown that the low-pressure region is maintained by cyclones moving into the region from Eurasia and as well as the generation of lows (cyclogenesis) over the Arctic Ocean itself.
This persistent low pressure pattern has had a pronounced effect on sea ice motion based on NSIDC DAAC data (Figure 2b). Since winds blow counterclockwise around low pressure centers (in the Northern Hemisphere) the sea ice motion has taken on the same counterclockwise pattern, the opposite of the long-term average. This may have an effect on the compaction and survival of multiyear ice later this season.
Compared to averages over the 1981 to 2010 period, air temperatures at the 925 level (about 2,500 feet above the surface) are mostly below average over most of the Arctic Ocean, particularly over north central Russia, part of the Kara Sea, northeastern Russia, Alaska, and the Canadian Arctic Archipelago (Figure 2c). Scandinavia has seen record high temperatures this summer; for the first half of July, 925 hPa temperatures in this area were up to 6 degrees Celsius (11 degrees Fahrenheit) above the 1981 to 2010 average, and relatively warm conditions extended into the largely ice-free Barents Sea. The extreme warmth that has plagued the Pacific Northwest has also influenced much of western Canada and has been linked to a string of forest fires in British Columbia.
Comparison to previous years
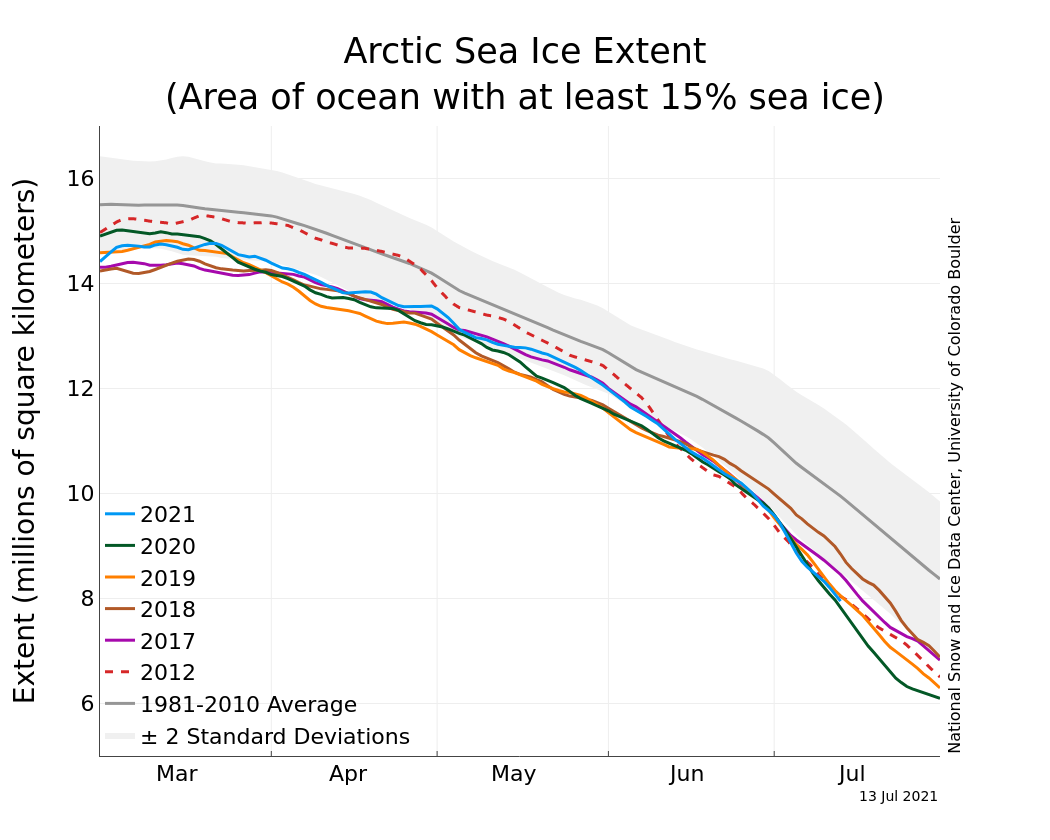
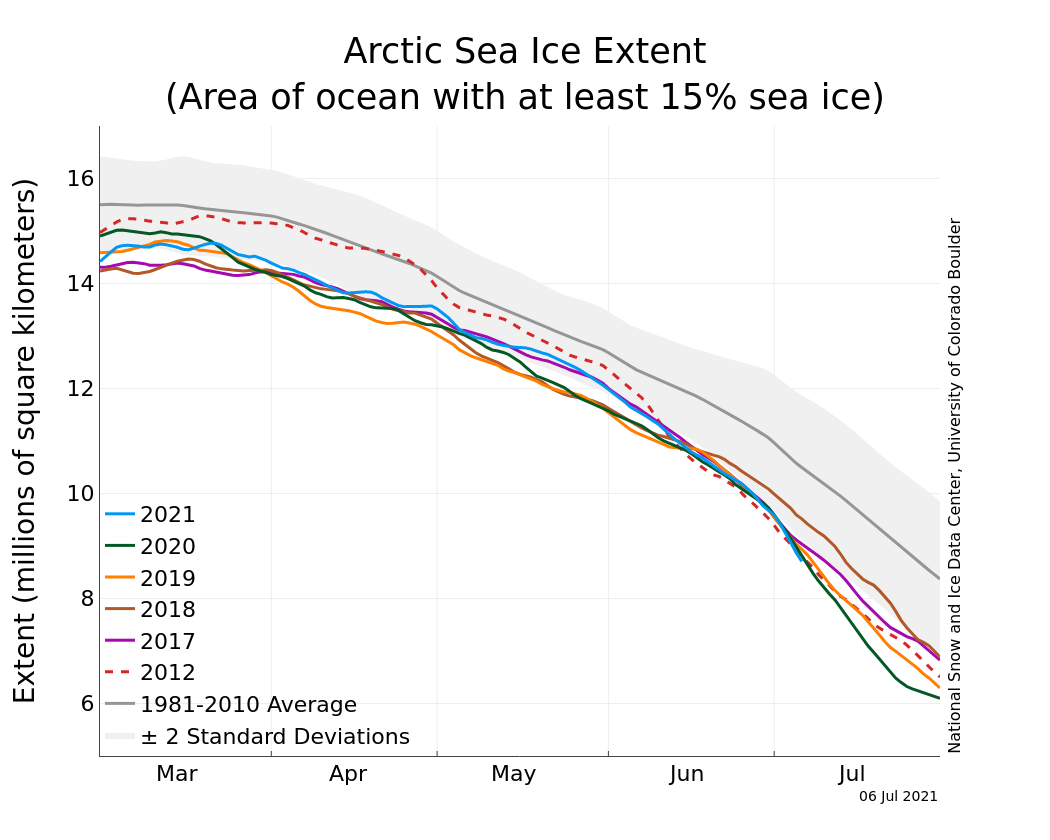
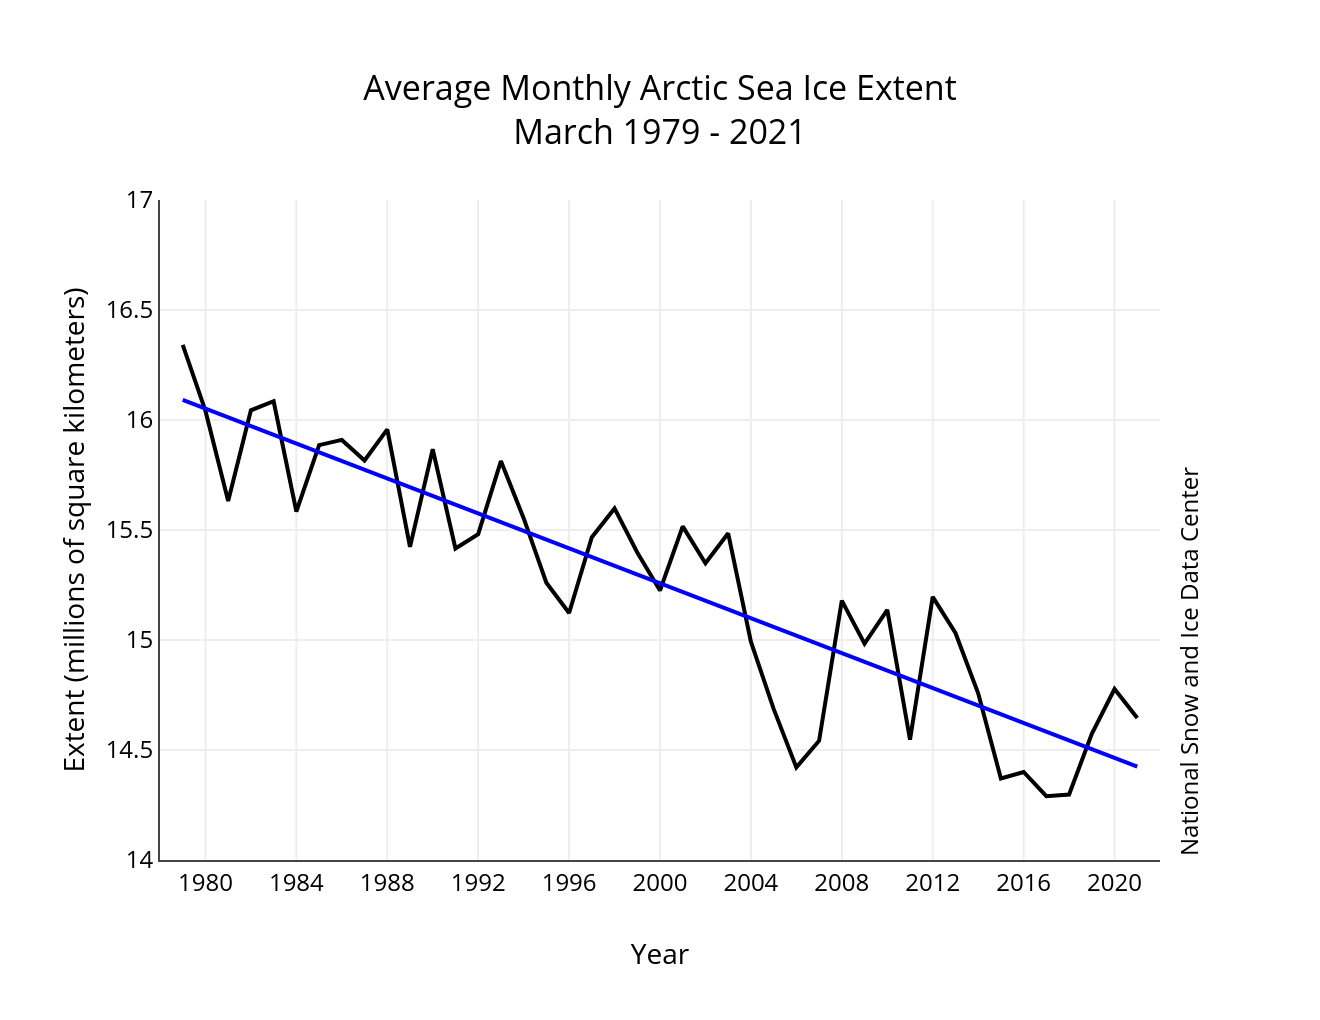
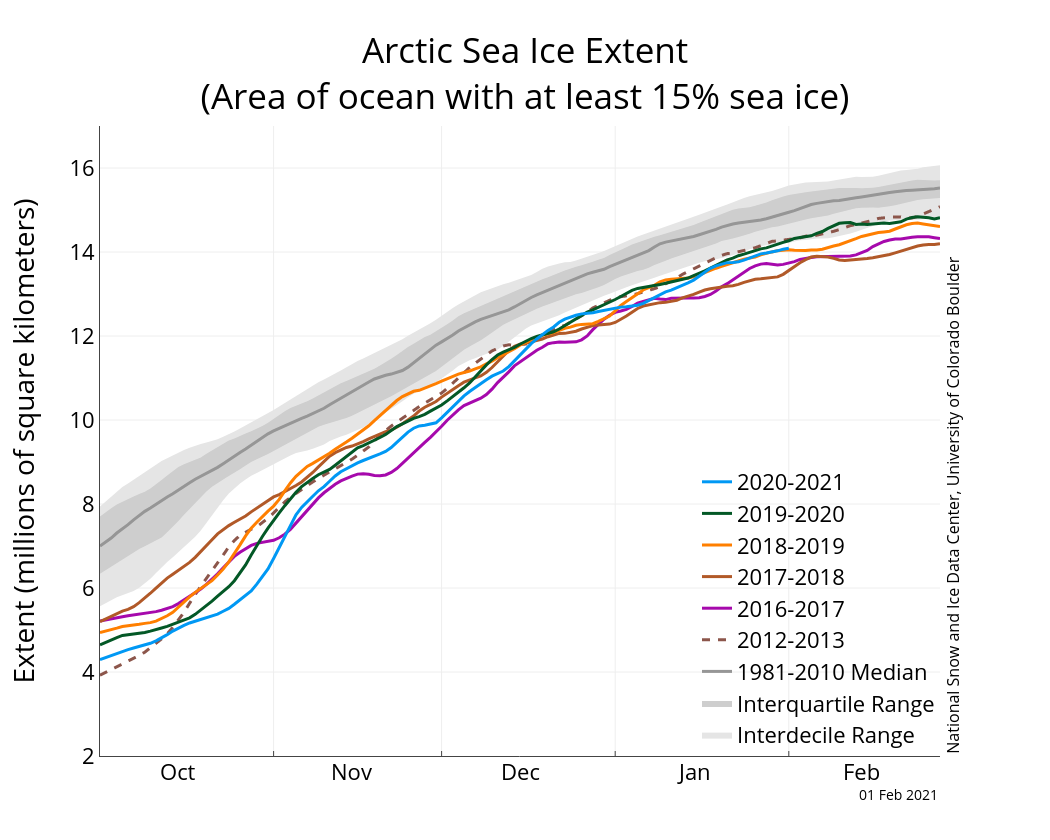
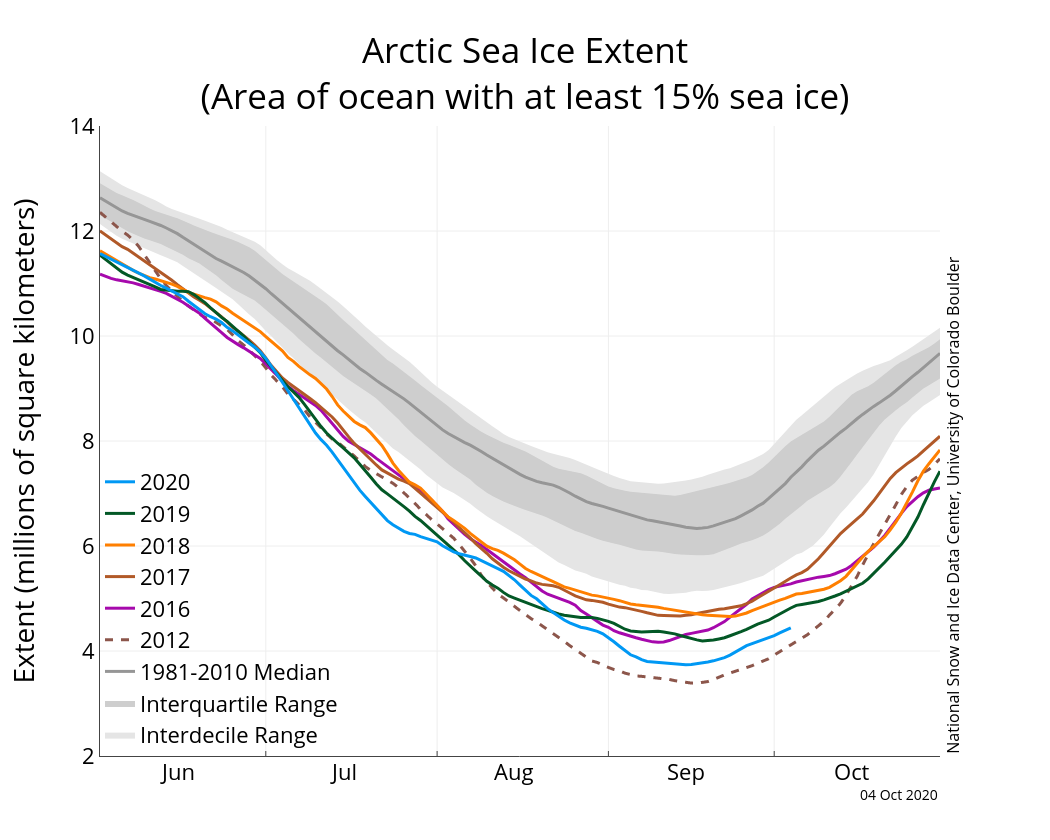
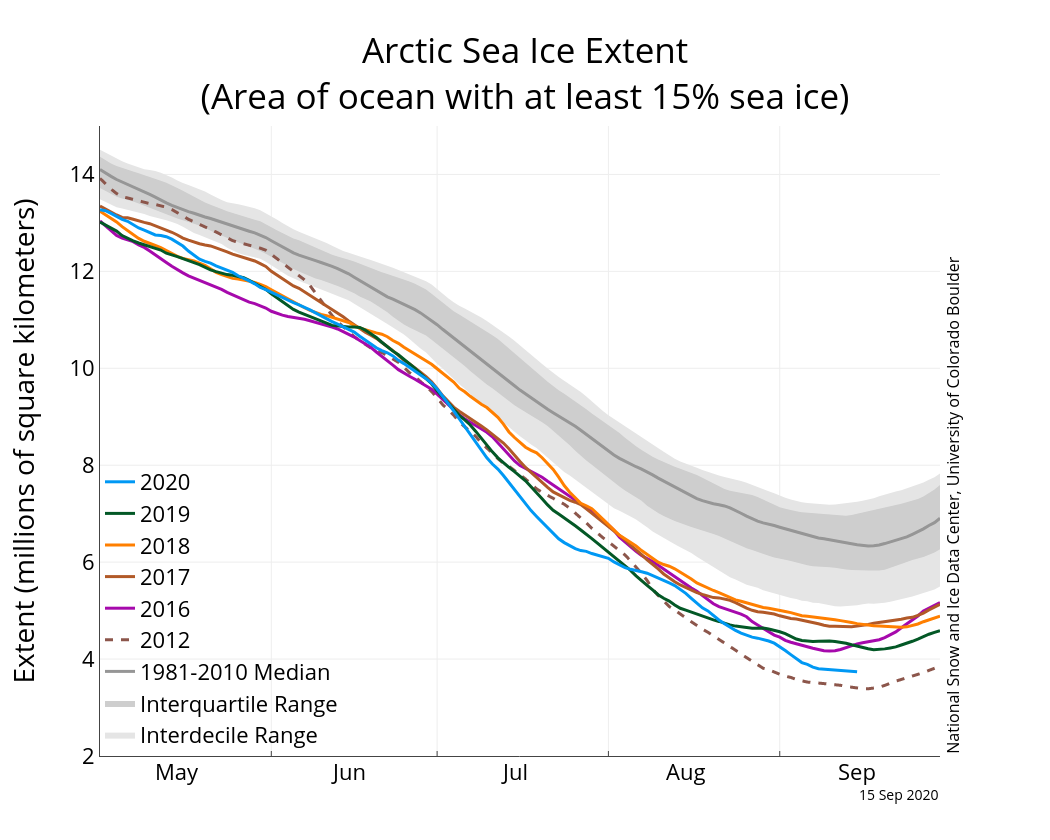
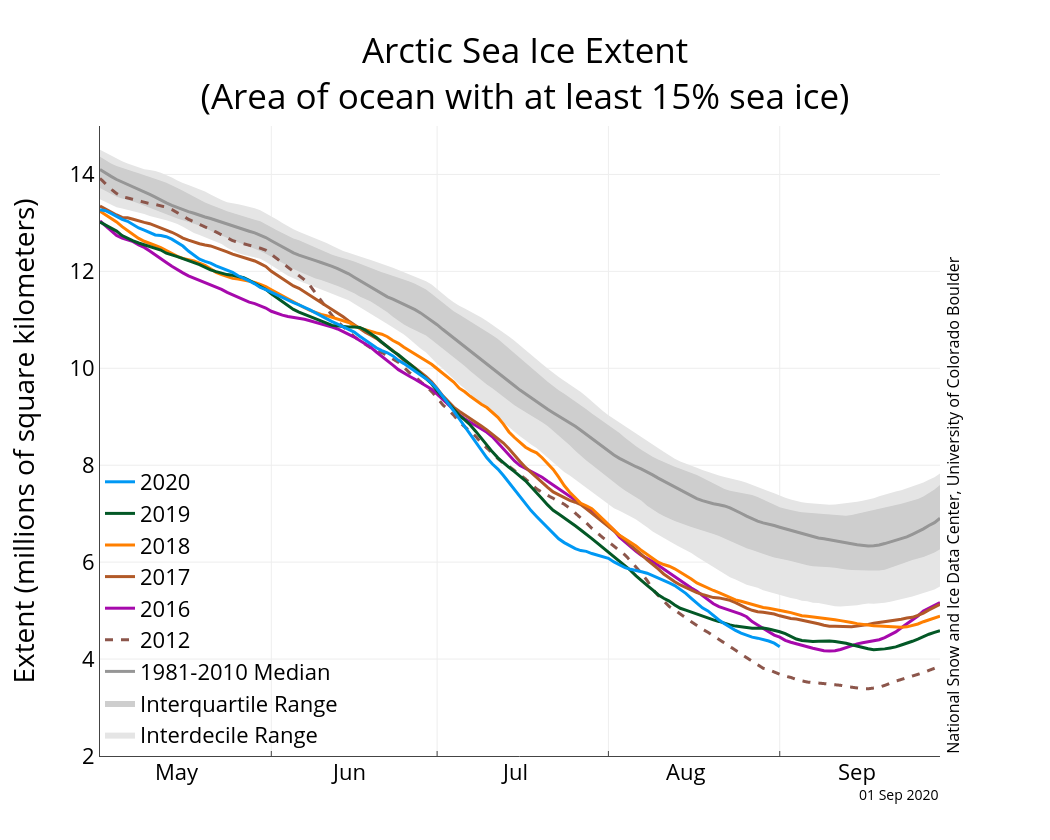
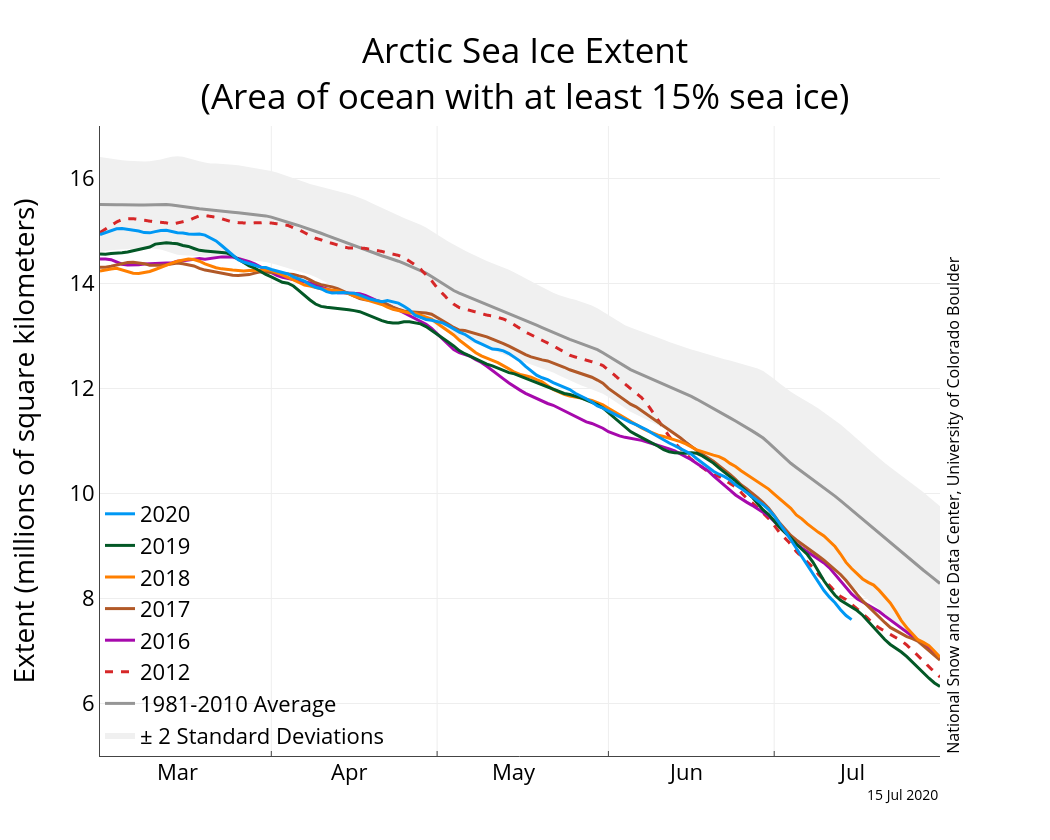
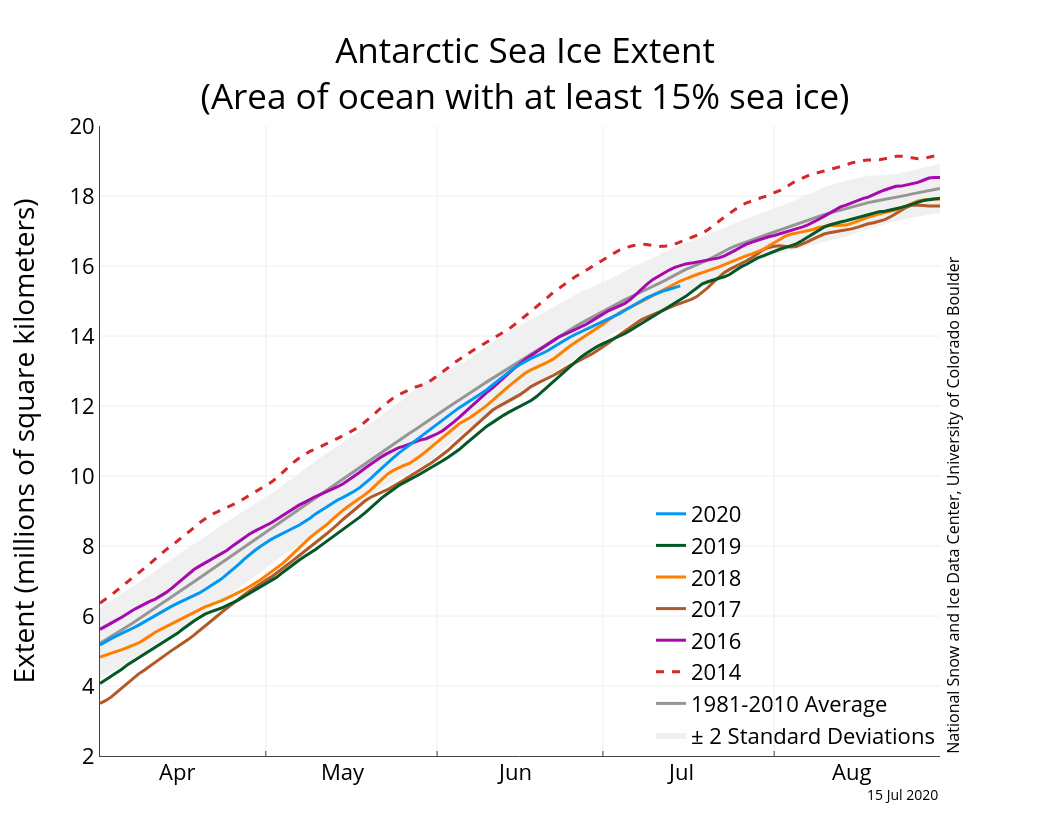
Figure 3. The graph above shows Arctic sea ice extent as of July 13, 2021, along with daily ice extent data for five previous years and the record low year. 2021 is shown in blue, 2020 in green, 2019 in orange, 2018 in brown, 2017 in magenta, and 2012 in dashed red. The 1981 to 2010 median is in dark gray. The gray areas around the median line show the interquartile and interdecile ranges of the data. Sea Ice Index data.
Credit: National Snow and Ice Data Center
High-resolution image
The brisk pace of ice loss for the first half of July was at 124,000 square kilometers (47,900 square miles) per day, exceeding the long-term average of 80,000 square kilometers (30,900 square miles) per day. From June 1 through July 13, the Arctic Ocean lost a total of 1.73 million square kilometers (668,000 square miles) of sea ice. This is roughly equivalent in size to the state of Florida.
Thick ice in the Beaufort Sea
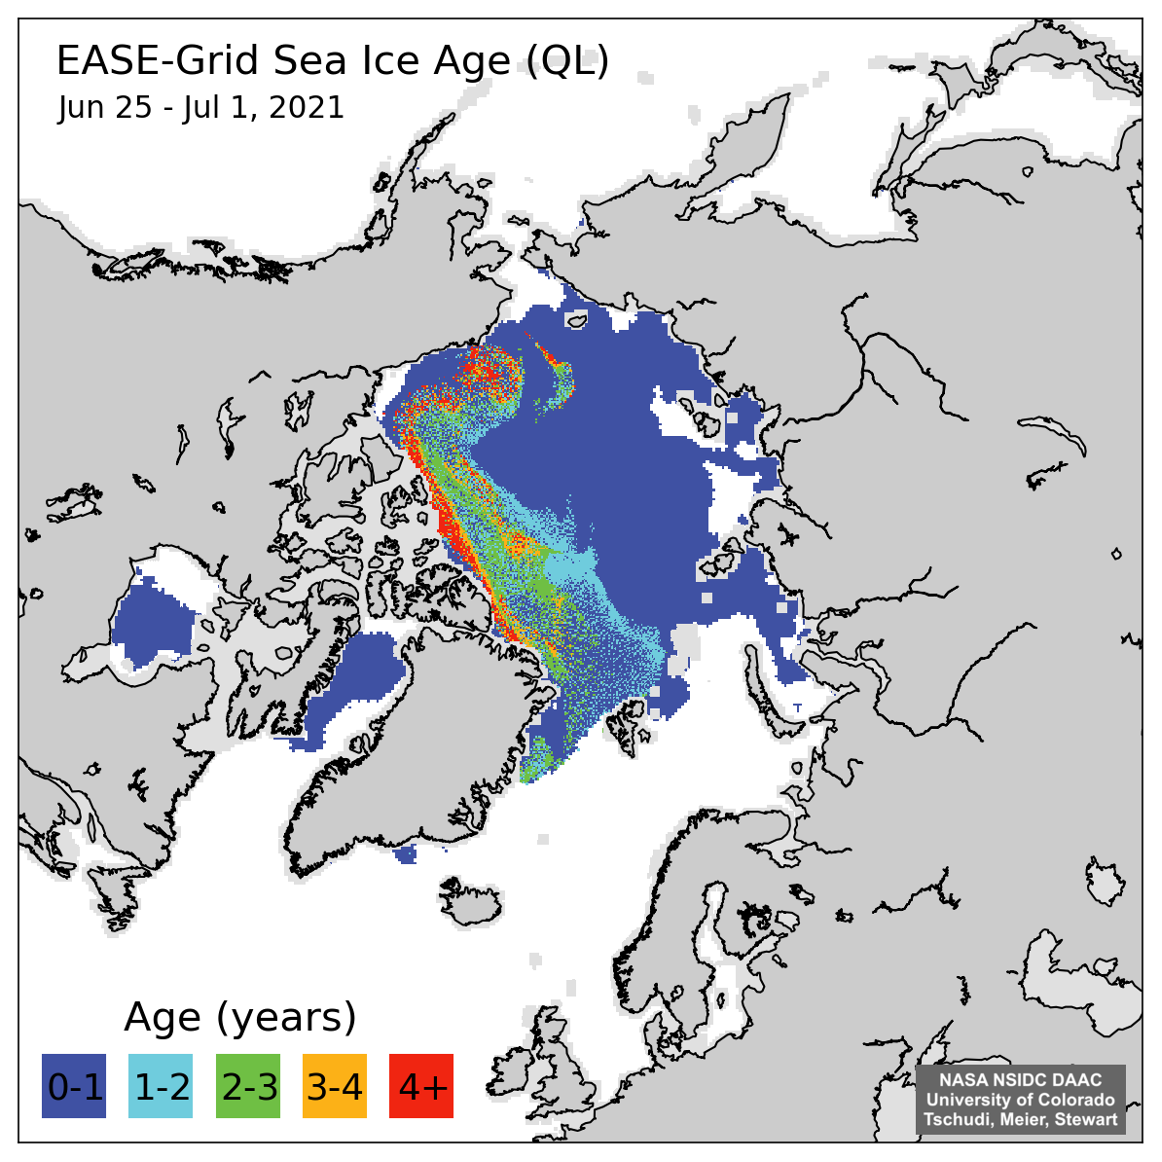
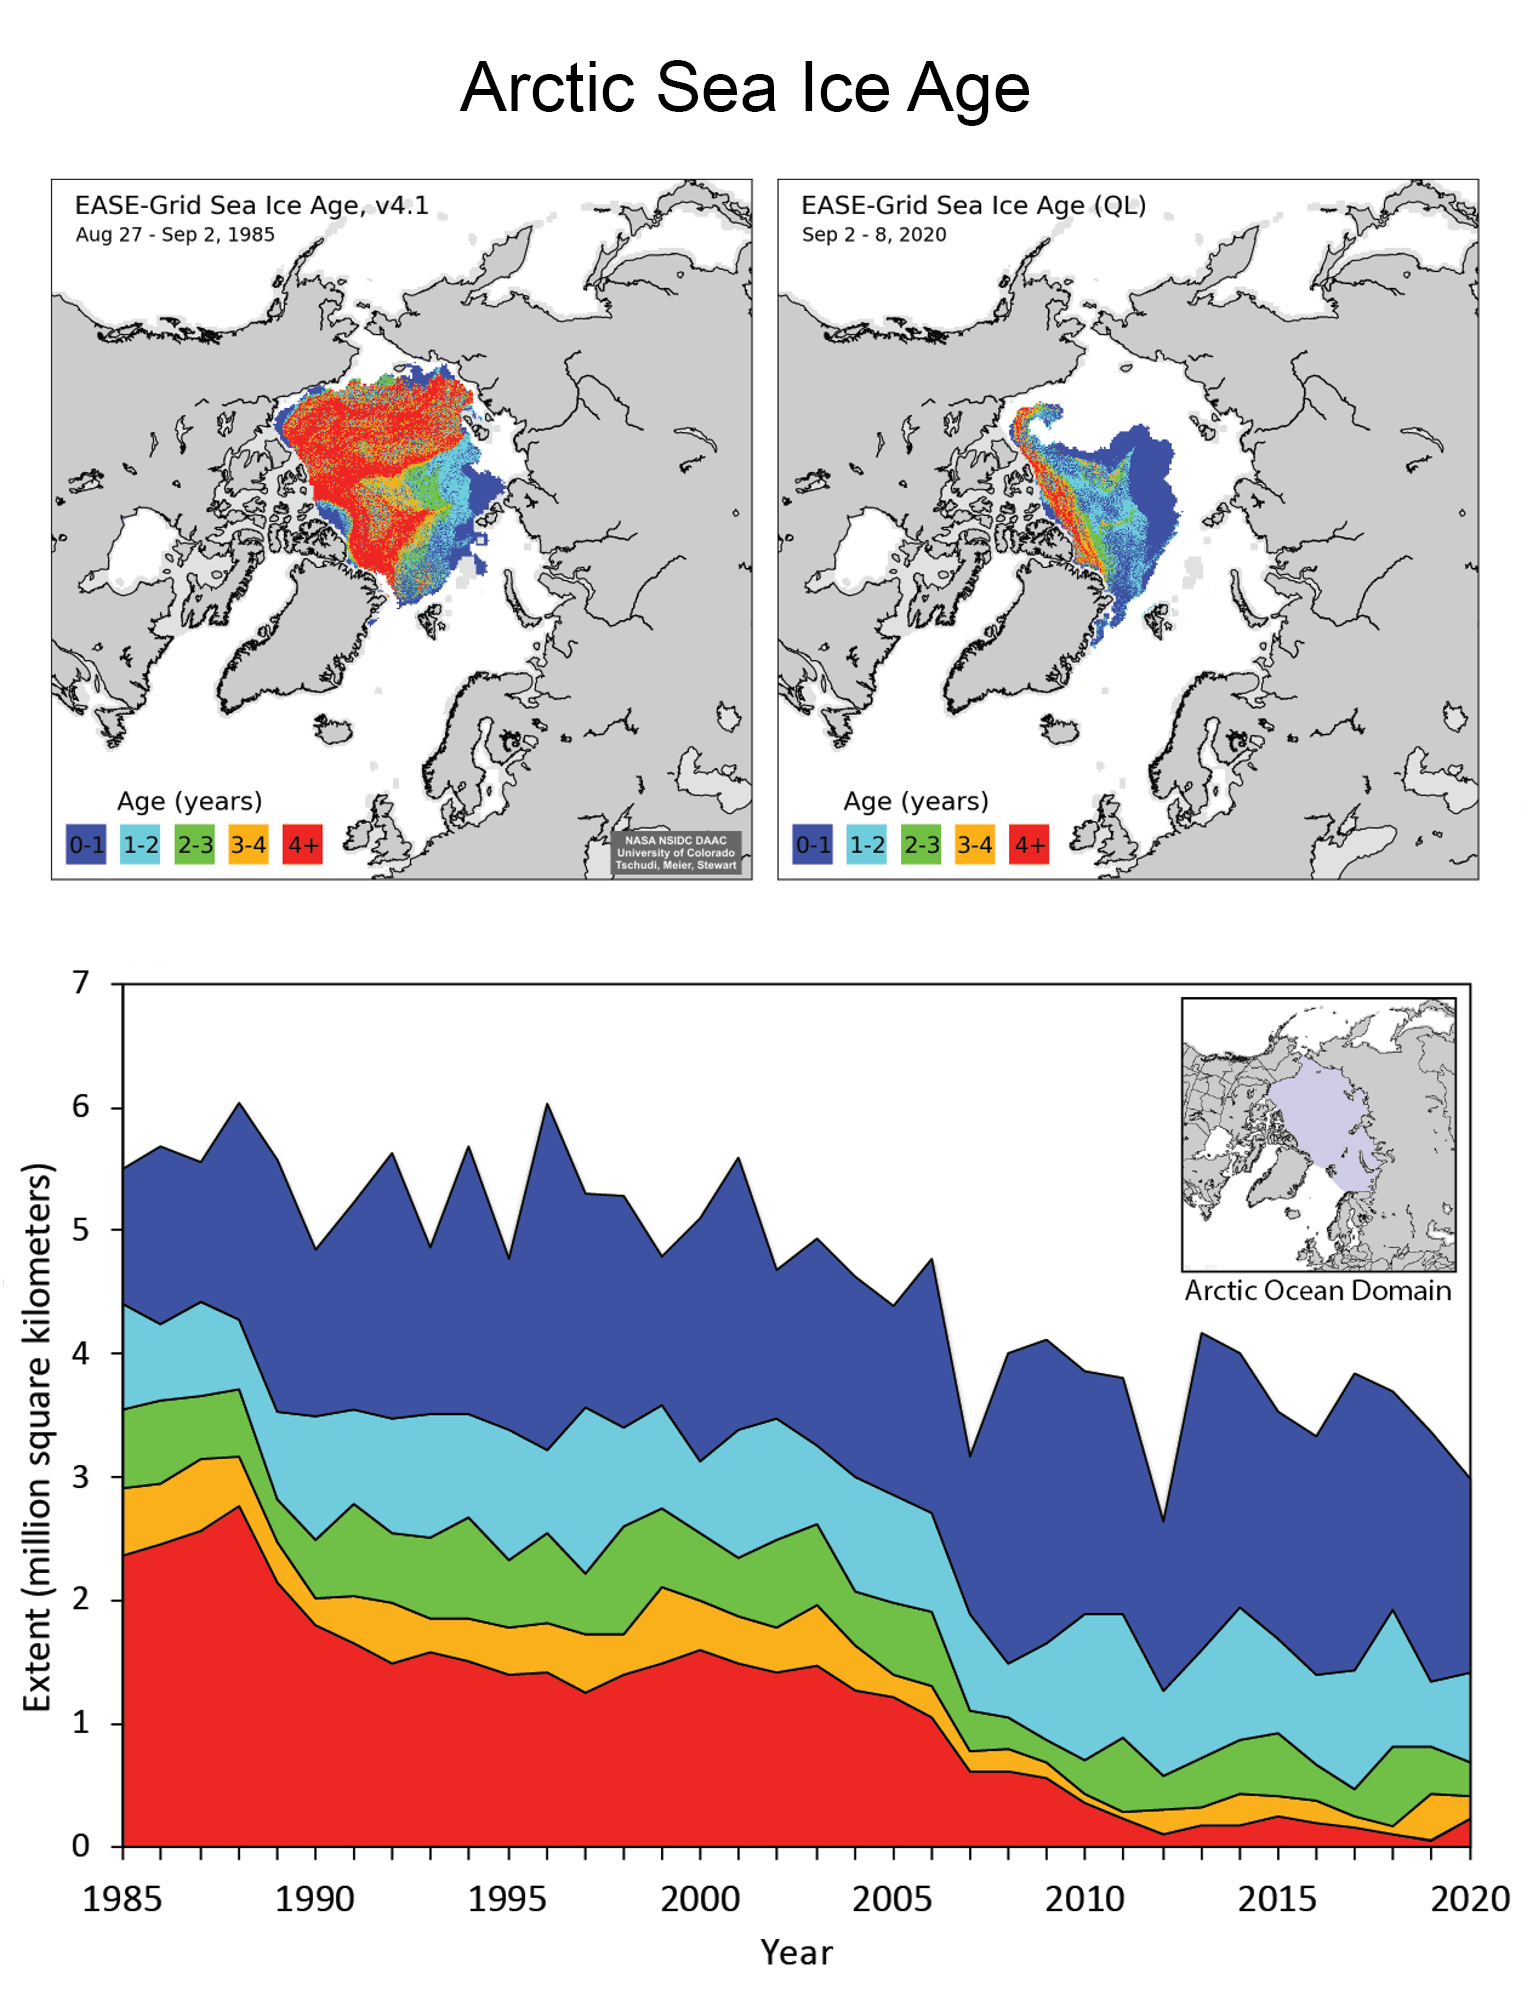
Figure 4a. This map shows the age of Arctic sea ice for the June 25 to July 1 period. Note the lingering multiyear ice north of the Alaskan coast.
Credit: M. Tschudi, W. Meier, and Stewart, NASA NSIDC DAAC
High-resolution image
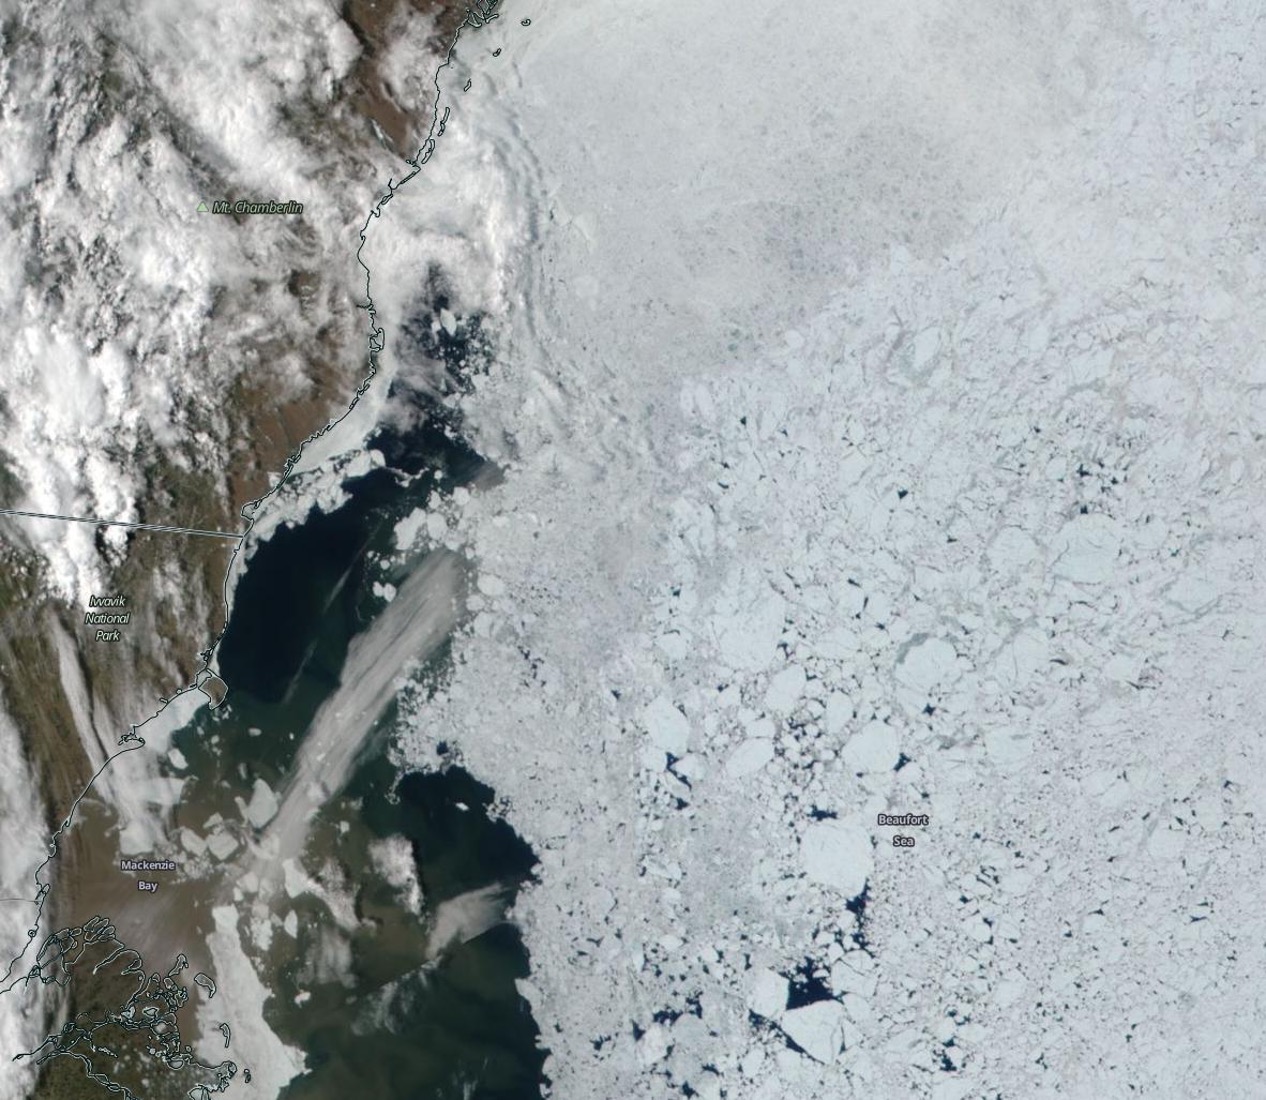
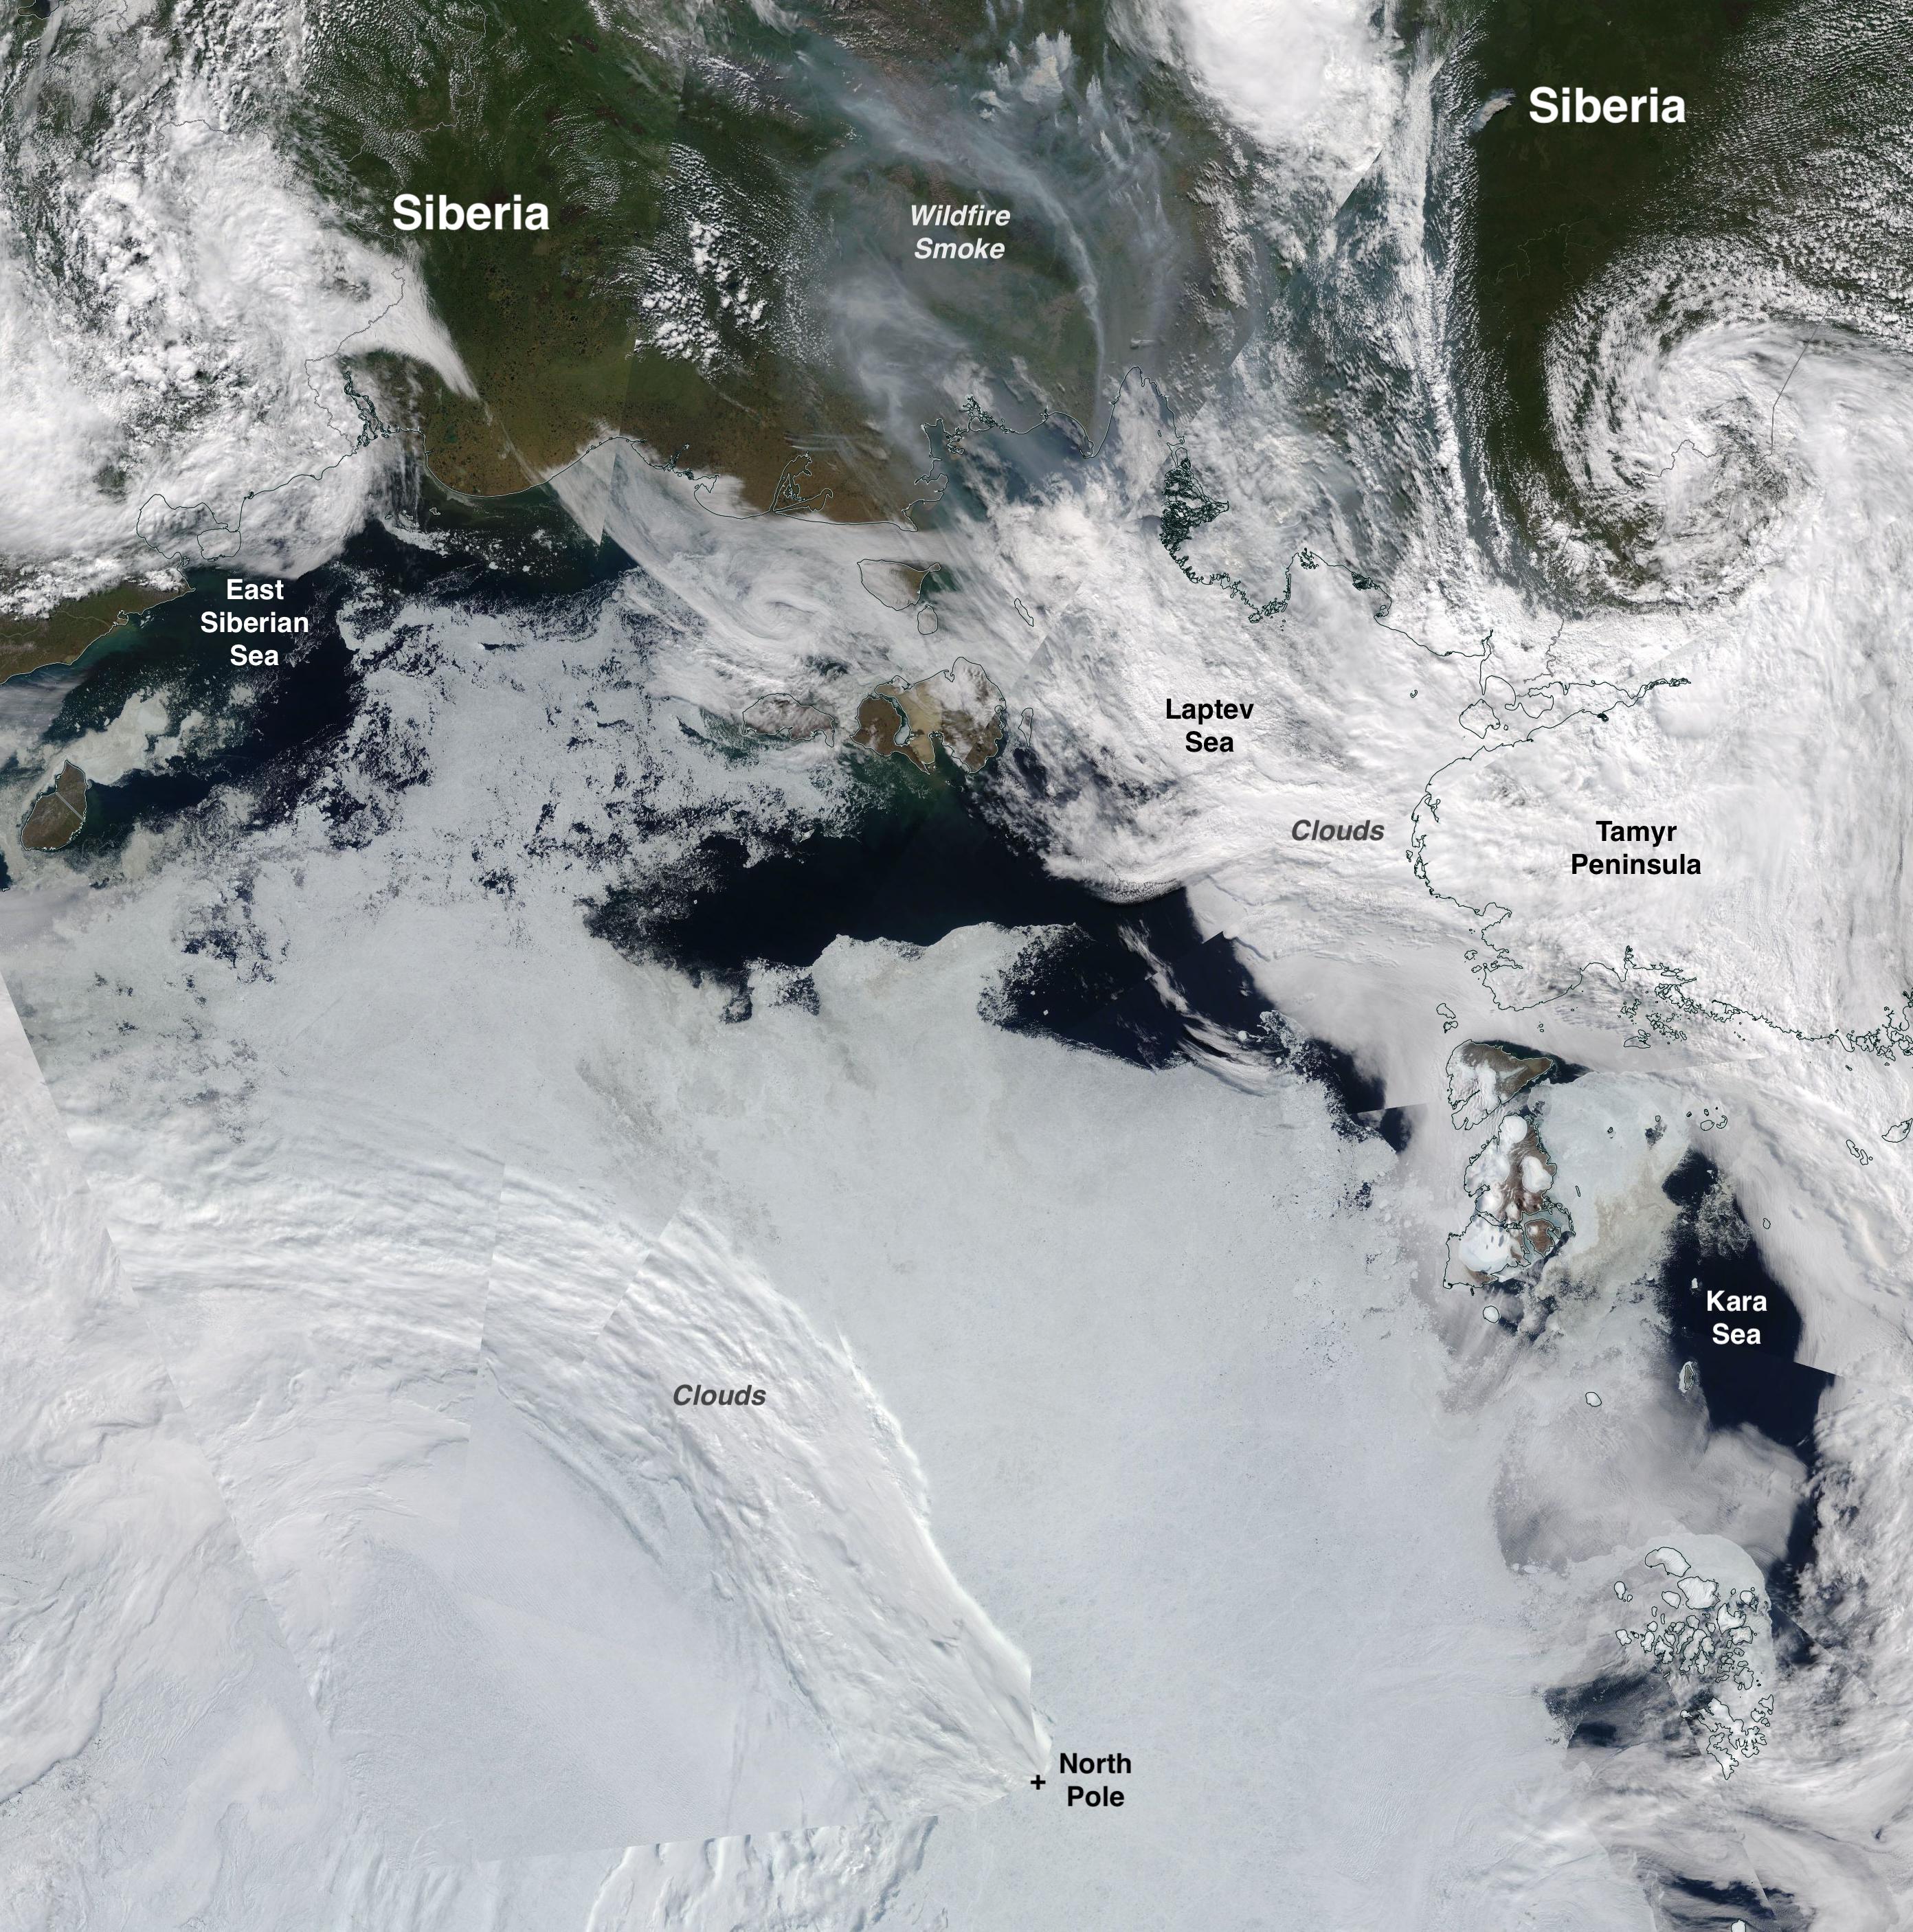
Figure 4b. This true-color image shows sea ice off the coast of Alaska in the Beaufort Sea, taken by the Moderate Resolution Imaging Spectroradiometer (MODIS) sensor on the NASA Terra satellite on June 26, 2021. The more bluish ice—toward the right side of the image, with the bigger visible floes—is the multiyear ice. The grayish ice, more towards the coast is first-year ice.
Credit: NASA Worldview
High-resolution image
While ice extent is very low for the Arctic Ocean as a whole, with a nearly ice-free Laptev Sea, ice extent in the Beaufort Sea remains extensive and in areas extends to the Alaskan shores. This is explained by the presence of a tongue of fairly thick multiyear ice in the region that is resistant to melting out (Figure 4a). Some of this ice is at least four years old. As shown in a study in press led by R. Mallett and colleagues, winds associated with a period of strong high pressure transported this tongue of ice into the Beaufort Sea this past winter from the central Arctic Ocean and the shores of the Canadian Arctic Archipelago. The image from the NASA Moderate Resolution Imaging Spectroradiometer for June 26, shows the difference between first-year ice close to the shore and the high concentration of multiyear ice farther north (Figure 4b). Whether this thick ice melts away through the remainder of this summer in the fairly warm waters of the Beaufort Sea remains to be seen; if it does, it will reduce the Arctic’s remaining store of multiyear ice.
Further Reading
Serreze, M. C. and A.P. Barrett. 2008. The summer cyclone maximum over the central Arctic Ocean. Journal of Climate, 21, 1048-1065, doi:10.1175/2007JCLI1810.1.


