The Siberian heat wave continued into June with a record high temperature in Verkhoyansk, just north of the Arctic Circle. The heat also affected the Laptev Sea, where ice extent dropped to a record low for this time of year. Sea ice extent was low overall in the Arctic Ocean, though not at record levels. Late June into early July is the period of most rapid ice loss in the Arctic.
Overview of conditions
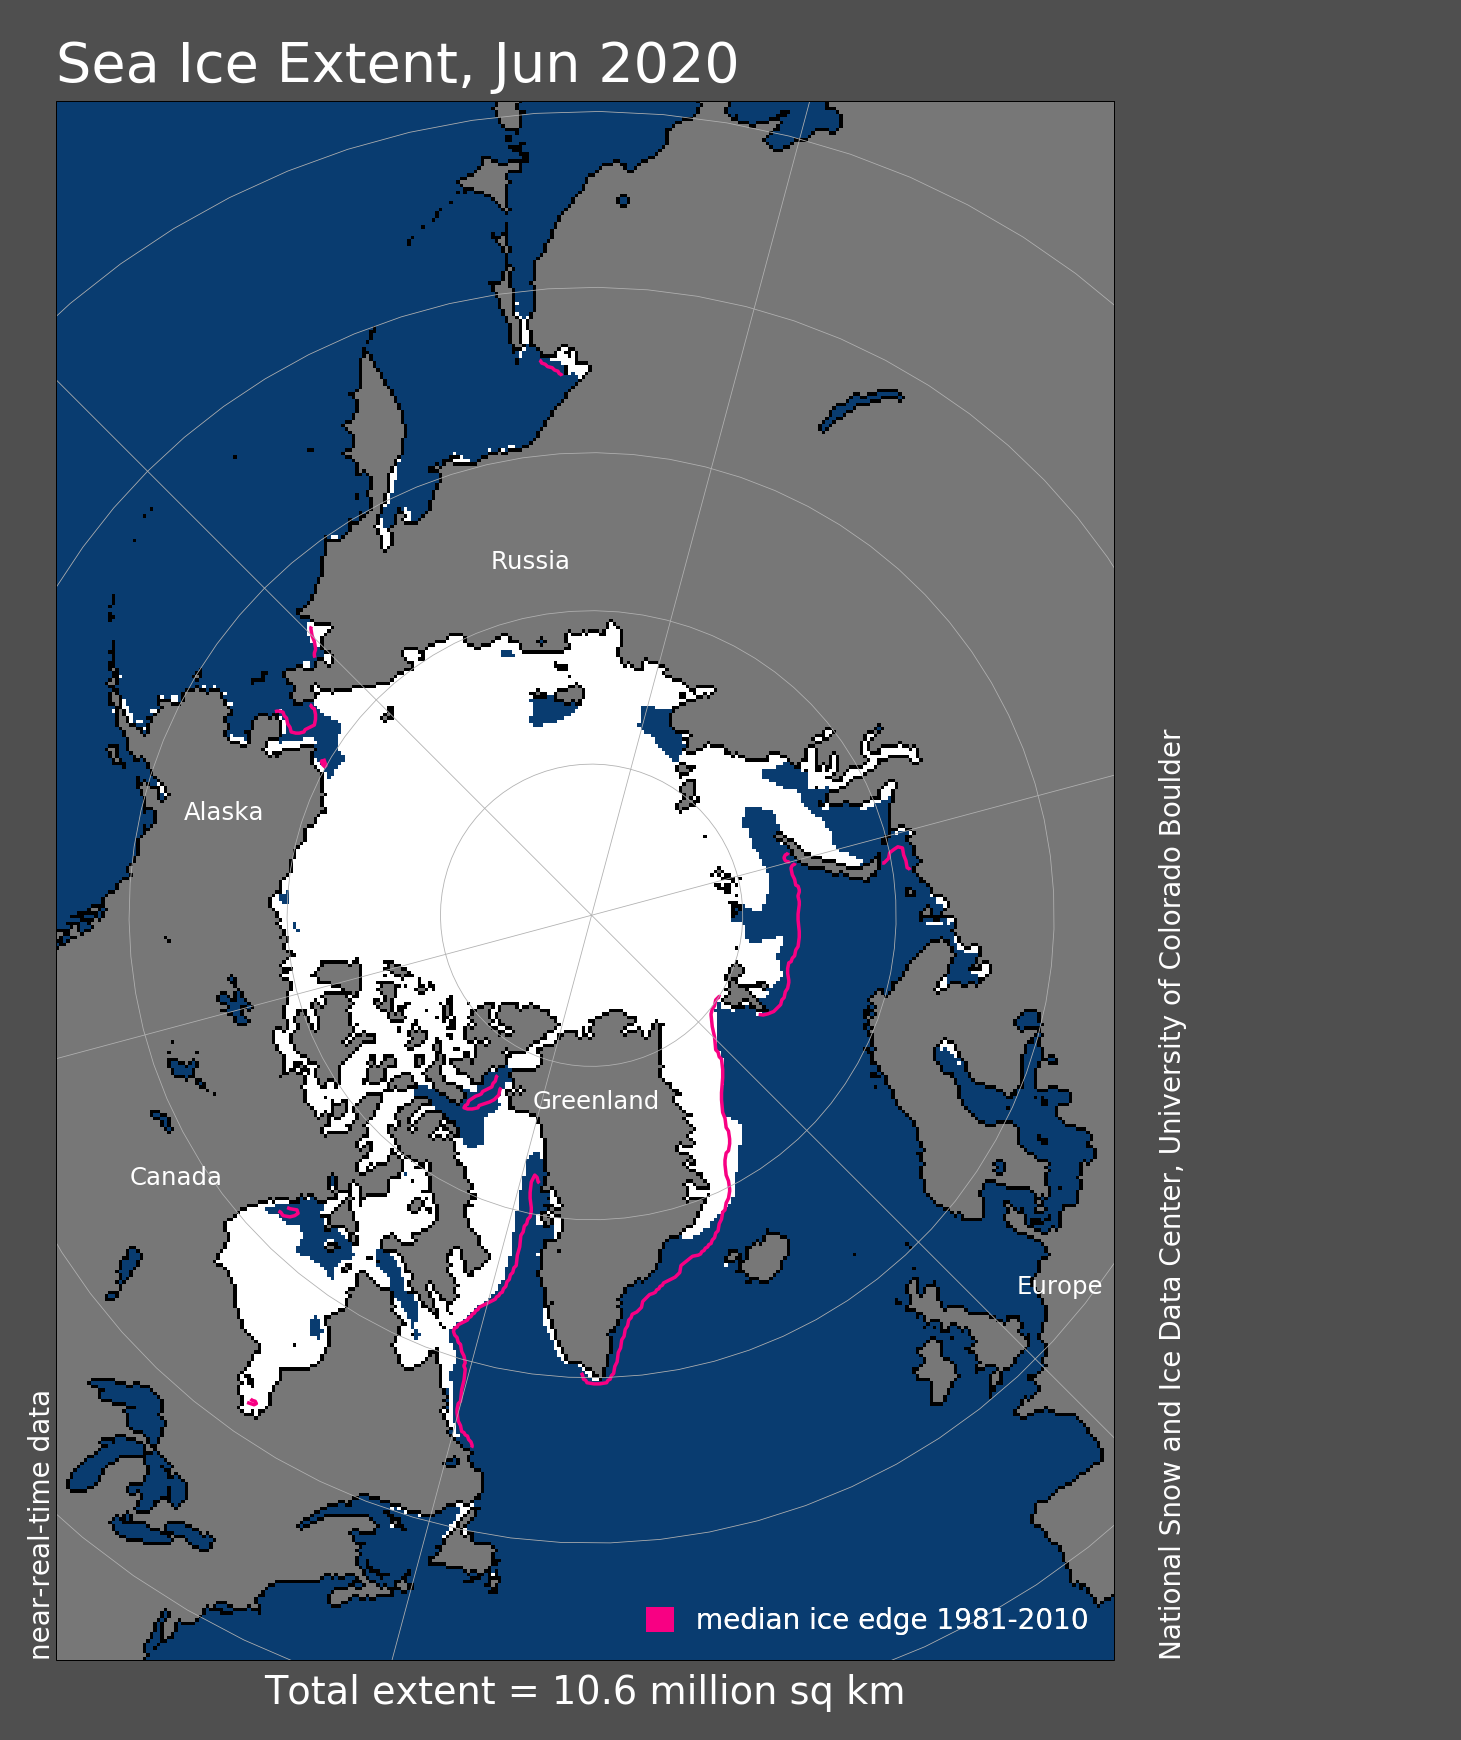
Figure 1. Arctic sea ice extent for June 2020 was 10.58 million square kilometers (4.08 million square miles). The magenta line shows the 1981 to 2010 average extent for that month. Sea Ice Index data. About the data
Credit: National Snow and Ice Data Center
High-resolution image
June 2020 sea ice extent averaged 10.58 million square kilometers (4.08 million square miles), placing it at third lowest in the satellite record for the month. This was 170,000 square kilometers (65,600 square miles) above the record low set in 2016. Ice loss during June was particularly pronounced in the Kara and Laptev Seas, where extent was well below average. In other areas of the Arctic Ocean, extents were near or slightly below average. Since June 19, sea ice extent in the Laptev Sea has been at a record low for this time of year.
Conditions in context
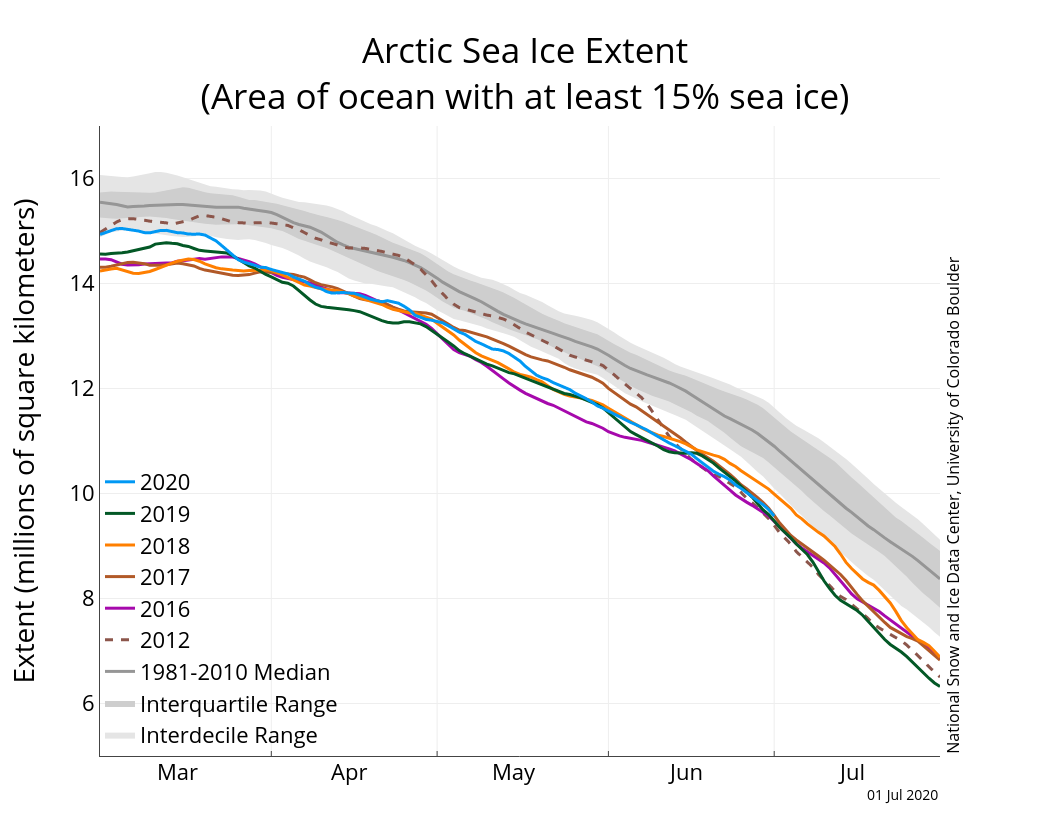
Figure 2a. The graph above shows Arctic sea ice extent as of July 1, 2020, along with daily ice extent data for four previous years and 2012, the record low year. 2020 is shown in blue, 2019 in green, 2018 in orange, 2017 in brown, 2016 in purple, and 2012 in dashed brown. The 1981 to 2010 median is in dark gray. The gray areas around the median line show the interquartile and interdecile ranges of the data. Sea Ice Index data.
Credit: National Snow and Ice Data Center
High-resolution image
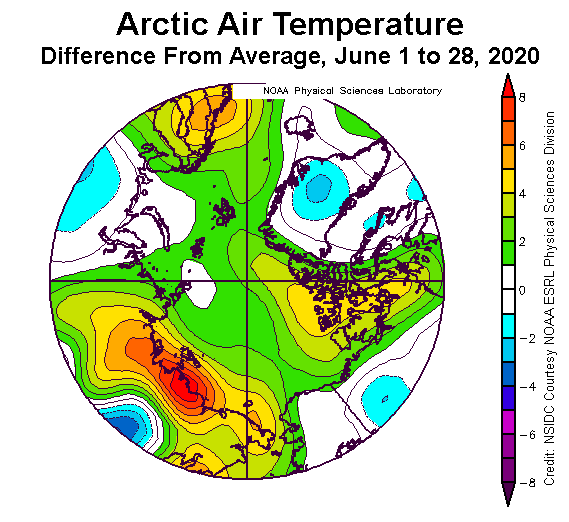
Figure 2b. This plot shows the departure from average air temperature in the Arctic at the 925 hPa level, in degrees Celsius, for June 1 to 28, 2020. Yellows and reds indicate higher than average temperatures; blues and purples indicate lower than average temperatures.
Credit: NSIDC courtesy NOAA Earth System Research Laboratory Physical Sciences Division
High-resolution image
Through the month, sea ice extent declined by an average of 64,300 square kilometers (40,000 square miles) per day—about 20 percent faster than the 1981 to 2010 average (Figure 2a).
Air temperatures at the 925 mb level (about 2,500 feet above sea level) were 1 to 4 degrees Celsius (2 to 7 degrees Fahrenheit) above average over most of the Arctic Ocean (Figure 2b). Along the Siberian coast of the eastern Laptev Sea, temperatures were 8 degrees Celsius (14 degrees Fahrenheit) above average. After persisting in a winter-long strong positive phase, the Arctic Oscillation has been in a mostly neutral phase since early May.
June 2020 compared to previous years

Figure 3. Monthly June ice extent for 1979 to 2020 shows a decline of 4.06 percent per decade.
Credit: National Snow and Ice Data Center
High-resolution image
Through 2020, the linear rate of decline for June sea ice extent is 4.06 percent per decade, which corresponds to 47,700 square kilometers (18,400 square miles) per year, about twice the size of the state of Vermont. The cumulative June ice loss over the 42-year satellite record is 1.96 million square kilometers (757,000 square miles), based on the difference in linear trend values in 2020 and 1979. This is about 12 percent larger than the state of Alaska.
Record set in the Laptev Sea
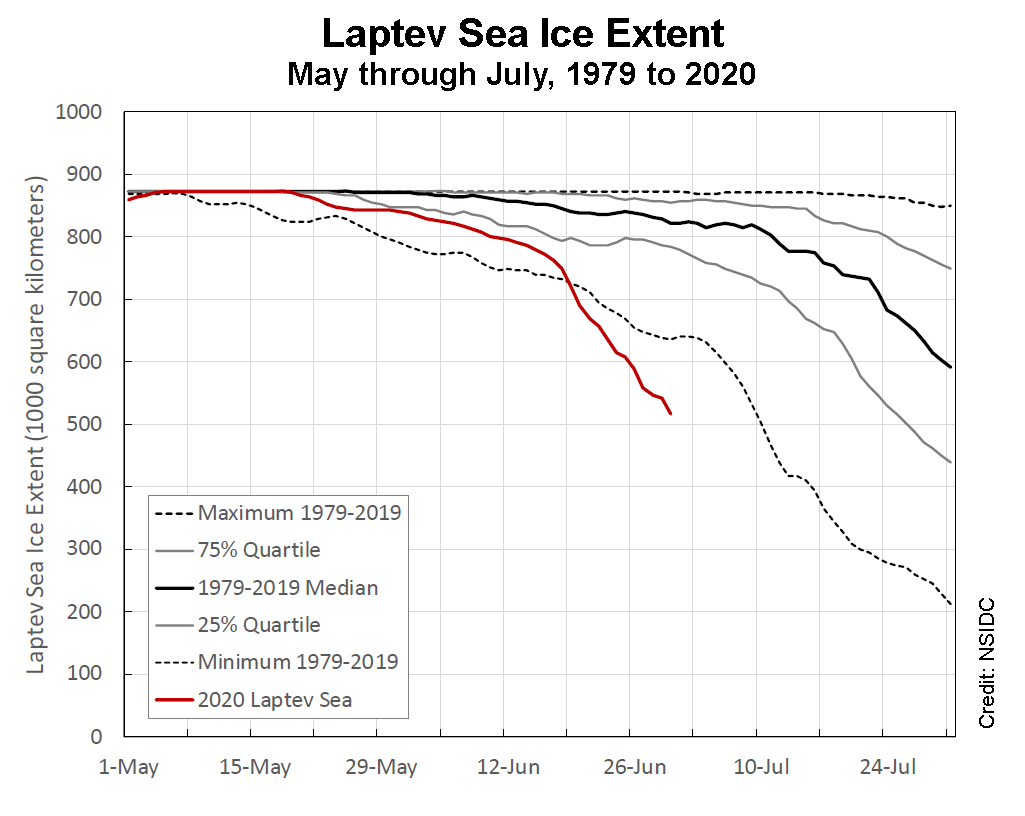
Figure 4a. This graph shows Laptev Sea ice extent for May 1 through July 31 for the 1979 to 2019 median (black) as well as the sea ice extent for May 1 through June 30, 2020 (red). Extent is shown in thousands of square kilometers. The graph also includes the 25 percent and 75 percent quartiles (gray), and the minimum and maximum sea ice extent (dashed black).
Credit: National Snow and Ice Data Center
High-resolution image
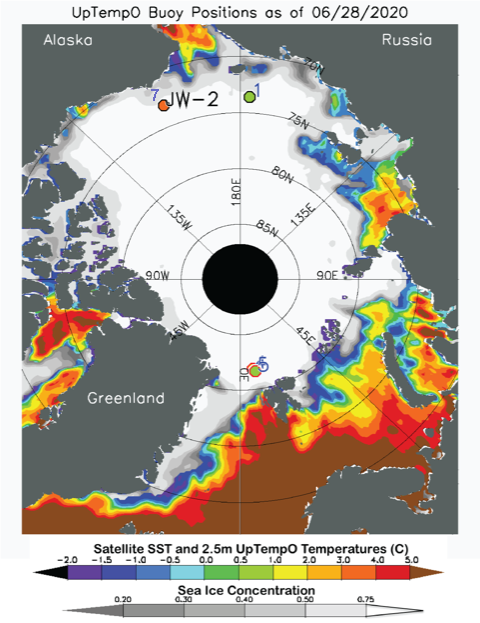
Figure 4b. This map shows sea surface temperature and ice concentration for June 28, 2020. The locations of three Upper layer Temperature of the Polar Oceans (UpTempO) drifting buoys are marked as 1, 2, and 7. Sea surface temperature data are from the National Oceanic and Atmospheric Administration daily Optimum Interpolation Sea Surface Temperature (OISST), and ice concentration from the NSIDC Sea Ice Index. Download data from UptempO drifting buoy locations.
Credit: University of Washington
High-resolution image
As noted above, northern Siberia and the Laptev Sea have seen particularly high temperatures compared to average. This contributed to early ice loss in the Laptev Sea. The strongly positive phase of the Arctic Oscillation (AO) over winter likely also played a role; studies have shown that strong offshore motion of the sea ice along the coast of Siberia during the positive AO fosters new ice growth, which is thinner and easier to melt out once summer arrives. Sea ice extent in the Laptev Sea was at record low from June 19 through the end of the month. With the early opening of the Laptev Sea, ocean sea surface temperatures (SST) have already risen up to 4 degrees Celsius (7 degrees Fahrenheit) above freezing, according to NOAA SST data provided by the Upper layer Temperature o the Polar Oceans (UpTemp0) buoy site (Figure 4b). River runoff may also be contributing to the warm surface waters in the region.
News from the South Pole
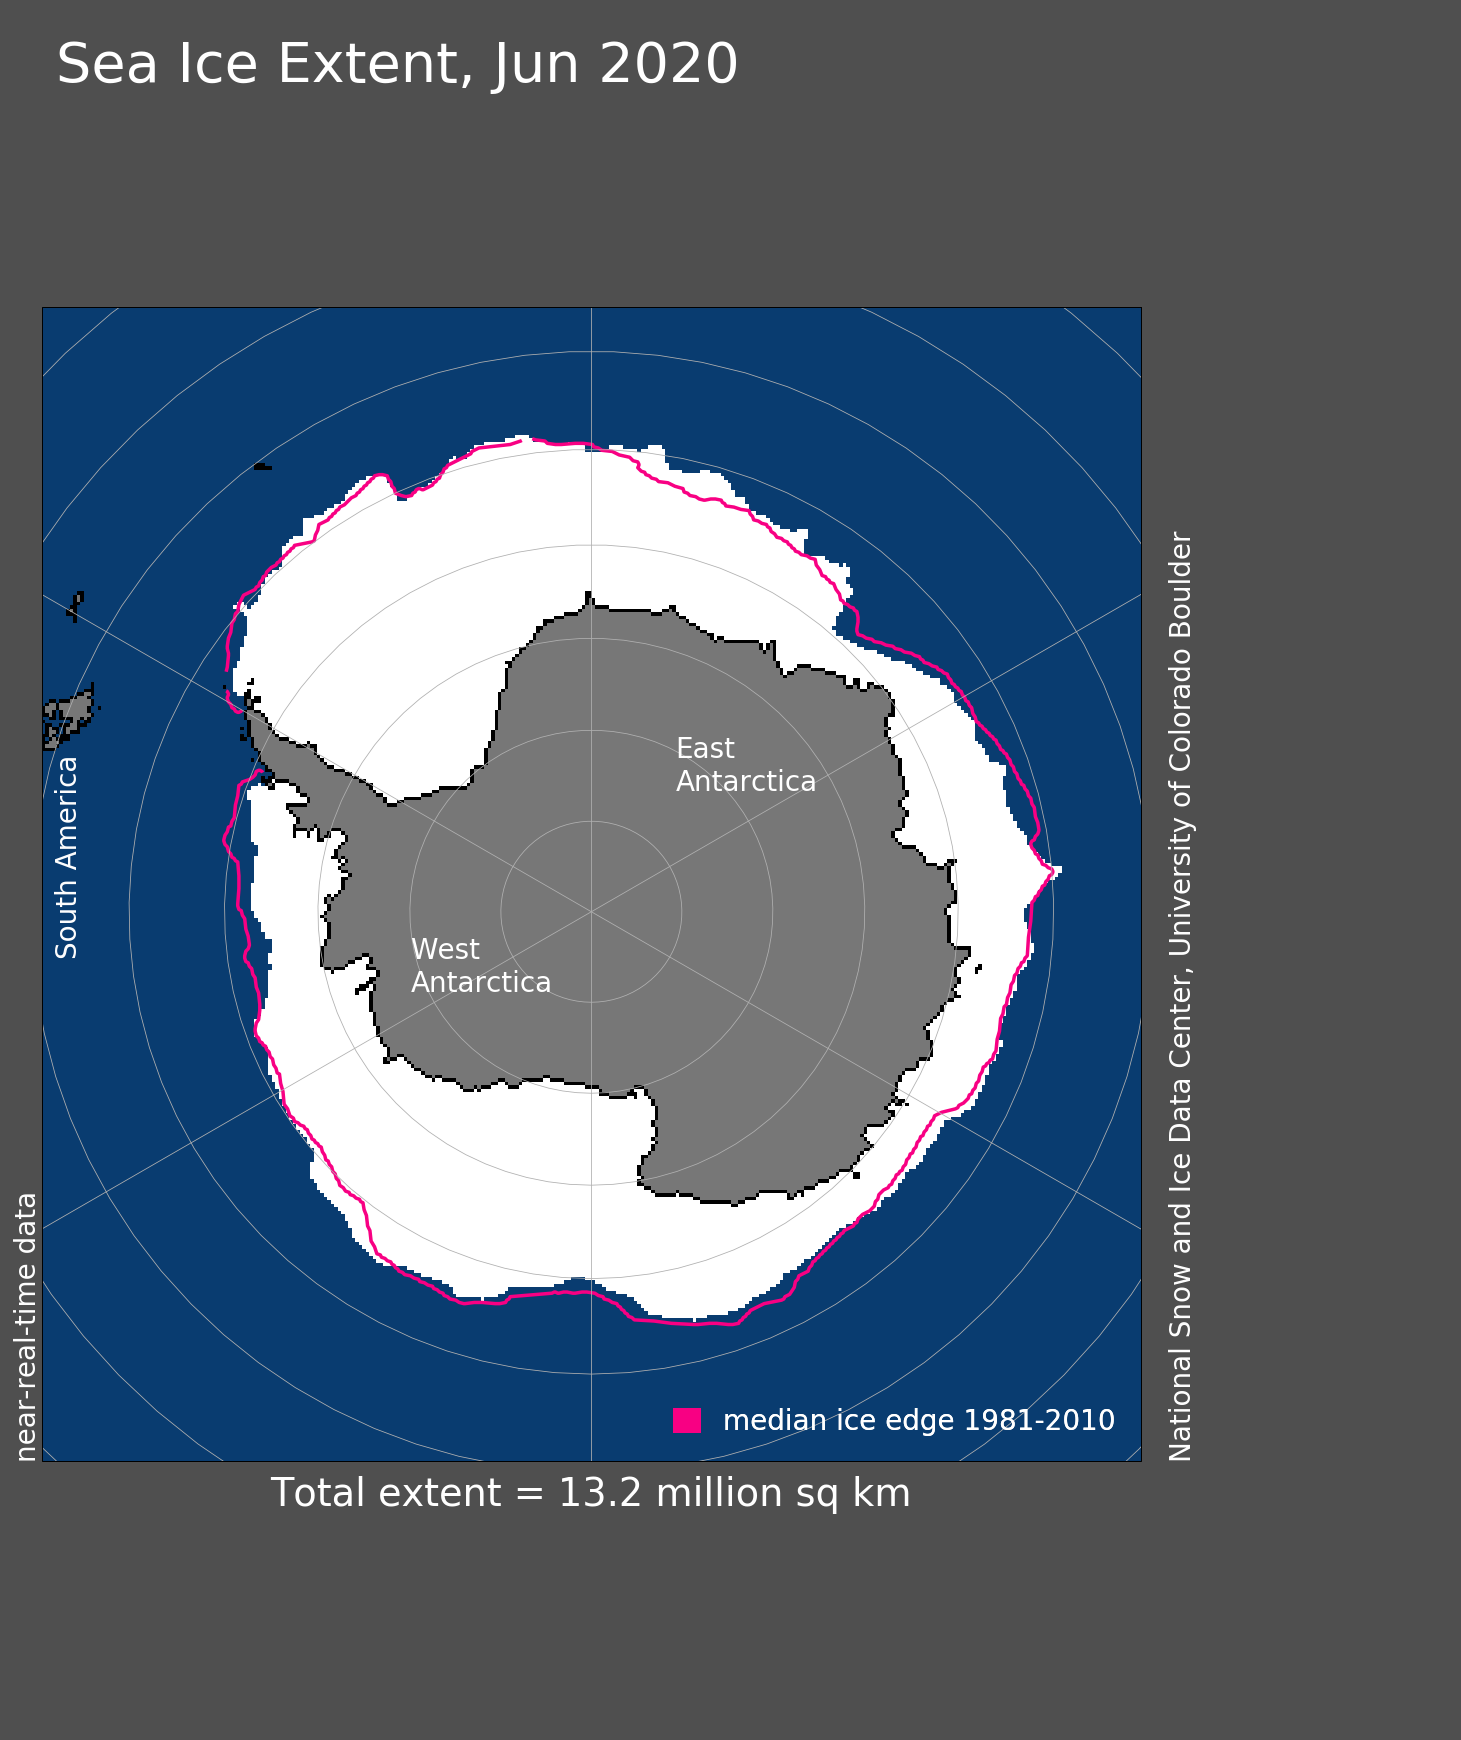
Figure 5a. Antarctic sea ice extent for June 2020 was 13.20 million square kilometers (5.10 million square miles). The magenta line shows the 1981 to 2010 average extent for that month. Sea Ice Index data. About the data
Credit: National Snow and Ice Data Center
High-resolution image
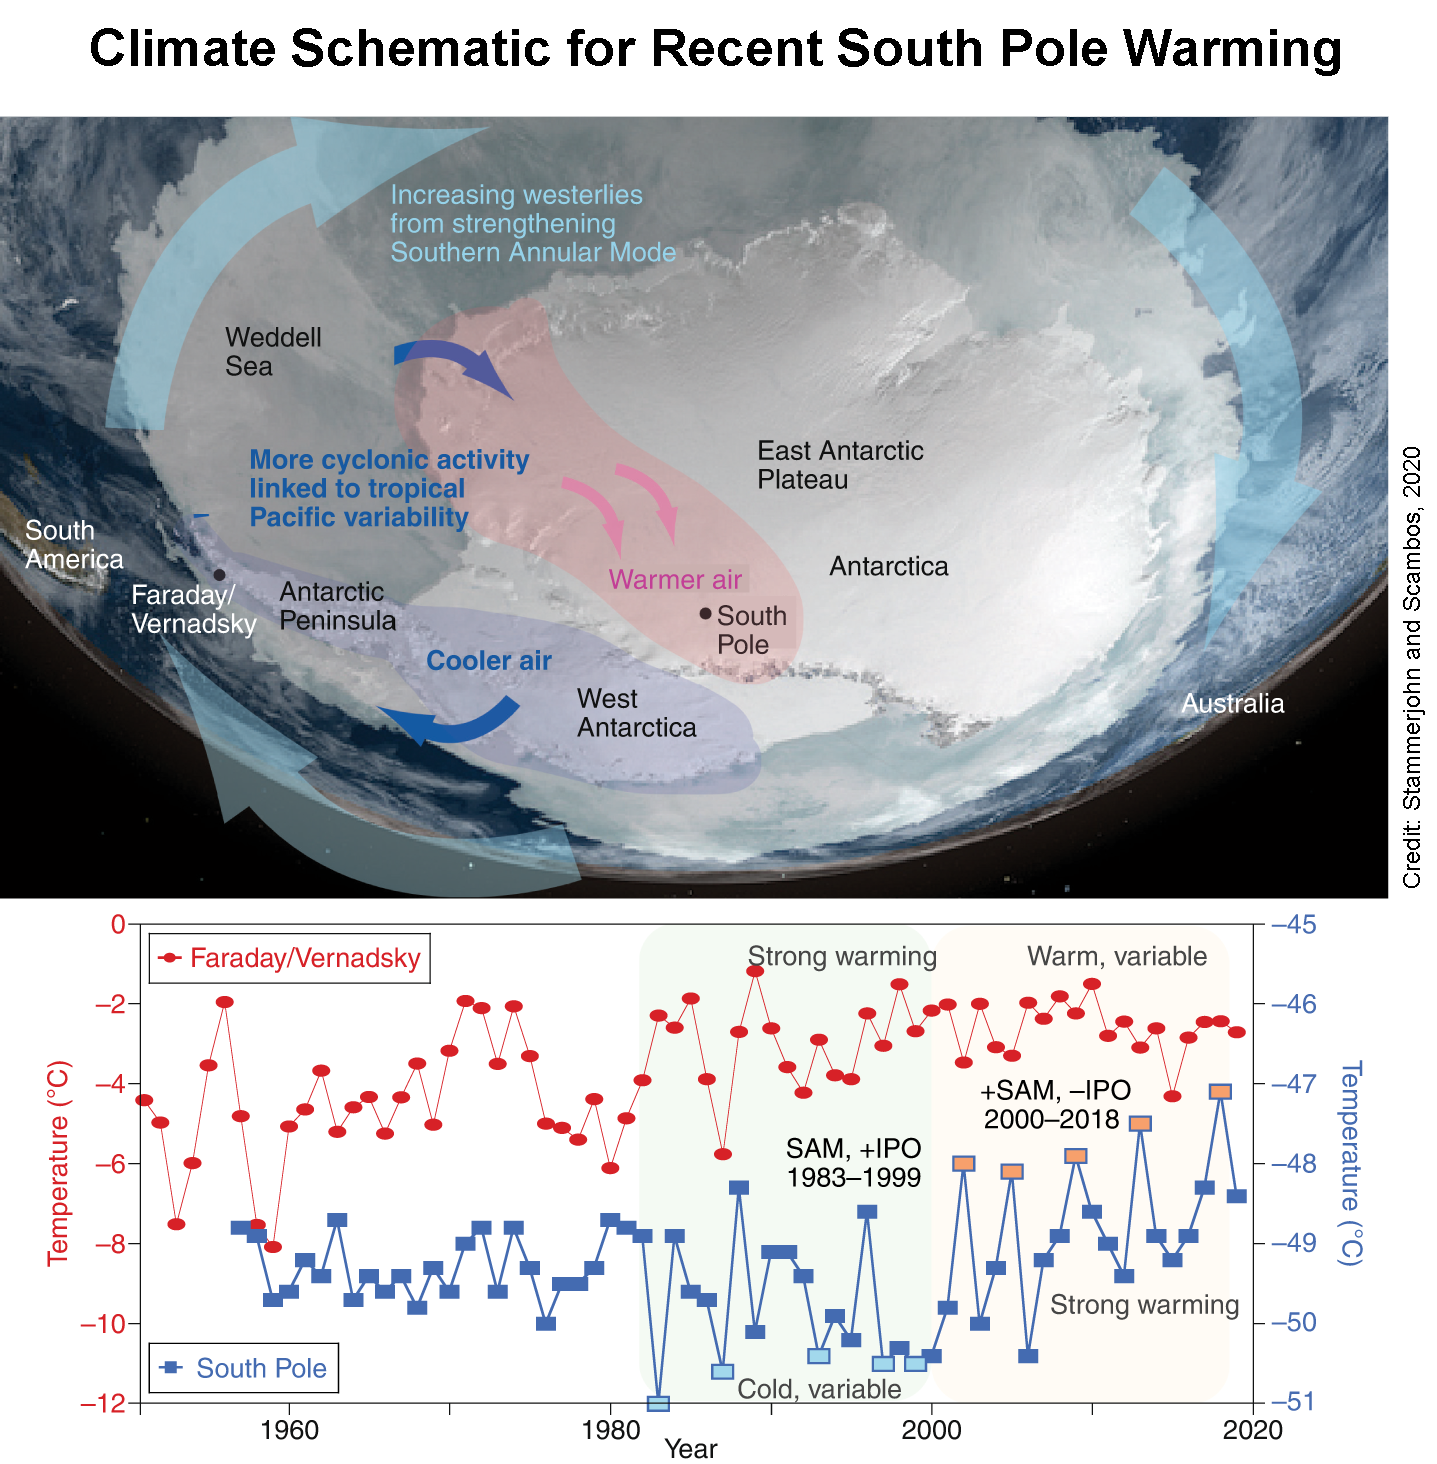
Figure 5b. The top figure shows a map of Antarctica as seen from space with the mechanisms discussed in Clem et al., 2020, overlain onto the map. Stronger westerlies driven by warming at lower latitudes combined with changes in the storm track due to the Interdecadal Pacific Oscillation produce enhanced cyclonic activity in the Weddell Sea (illustrated with dark blue arrows). This increases the advection of warm moist air into the high Antarctic interior (illustrated with red arrows), but shifts wind direction over the Peninsula, slowing the warming there. The bottom figure shows mean annual air temperatures at Faraday/Vernadsky Station in the Antarctic Peninsula and at Amundsen-Scott South Pole Station, the locations of which are shown in top image. This figure illustrates near-record lows from the 1980s to late-1990s followed by a series of record and near-record highs since about 2000.
Credit: Stammerjohn and Scambos, the Institute of Alpine and Arctic Research and the Cooperative Institute for Research in Environmental Sciences, 2020
High-resolution image
Antarctic sea ice extent tracked slightly below the 1981 to 2010 average extent for the month of June, as it has for all but a few days since August 2016. Areas of below average ice extent are west of Enderby Land and the Bellingshausen Sea. Ice growth during the month was near average, and ice extent increased primarily in the eastern Weddell Sea, Ross Sea, and Bellingshausen Sea, as winter growth continued rapidly towards the maximum, which generally occurs in early October. An indentation in the sea ice edge in the Cosmonaut Sea region—near 50 degrees E longitude—suggests that a polynya may form there in July or August as the ice edge advances outward. At this time, there is no indication of the Maud Rise Polynya forming near 0 degrees longitude.
Air temperatures at the South Pole are climbing rapidly, according to a recent study led by our colleague, Kyle Clem. During the past 30 years, temperatures there have risen at three times the global average rate—0.6 degrees Celsius (1.1 degree Fahrenheit) per decade at the South Pole versus about 0.2 degrees Celsius per decade (0.4 degrees Fahrenheit) for the recent global average. The warming is tied to atmospheric circulation patterns, the positive trend of westerly winds around Antarctica as represented by the Southern Annular Mode (SAM) and its index, and the Interdecadal Pacific Oscillation (IPO), an El Niño-La Niña-like multi-decadal pattern of surface temperatures in the Pacific. Since the late 1990s, warming in the western tropical Pacific, which is associated with the ‘negative’ or La Niña-like phase of the IPO and climate trends of warmer sea surface temperatures, combined with the long-term trend of faster westerly winds around Antarctica has led to an increase in cyclone activity, i.e. more low- pressure systems, in the Weddell Sea, which tend to drive warm air towards the pole.
An earlier study of 50 years of weather data at South Pole by our colleague Matt Lazzara and others noted the trend towards warming beginning in the mid-1990s, although the larger causes of the warming were not clear at that time.
All of that said, the South Pole is still the South Pole, and that means cold. Following the rapid warming that Clem and his colleagues describe, average annual temperatures set a record in 2018 of -47 degrees Celsius (-53 degrees Fahrenheit).
Further reading
Clem, K. R., R. L. Fogt, J. Turner, B. R. Lintner, G. Marshall, J. R. Miller, and J. A. Renwick. 2020. Record warming at the South Pole during the past three decades. Nature Climate Change. doi:10.1038/s41558-020-0815-z.
Lazzara, M. A., L. M. Keller, T. Markle, and J. Gallagher. 2012. Fifty-year Amundsen–Scott South Pole station surface climatology. Atmospheric Research. doi:10.1016/j.atmosres.2012.06.027.
Stammerjohn, S., and T. Scambos. 2020. Warming reaches the South Pole. Nature Climate Change. doi: 10.1038/s41558-020-0827-8.

