Sunlight has returned to the highest latitudes in the Arctic, while in the Antarctic autumn is settling in. The seasonal decline of Arctic sea ice extent since the March 6 annual maximum has been slow, but daily extent has remained among the third to sixth lowest in the satellite record. Since the seasonal minimum reached on February 21, Antarctic sea ice has expanded at a fairly typical pace.
Overview of conditions
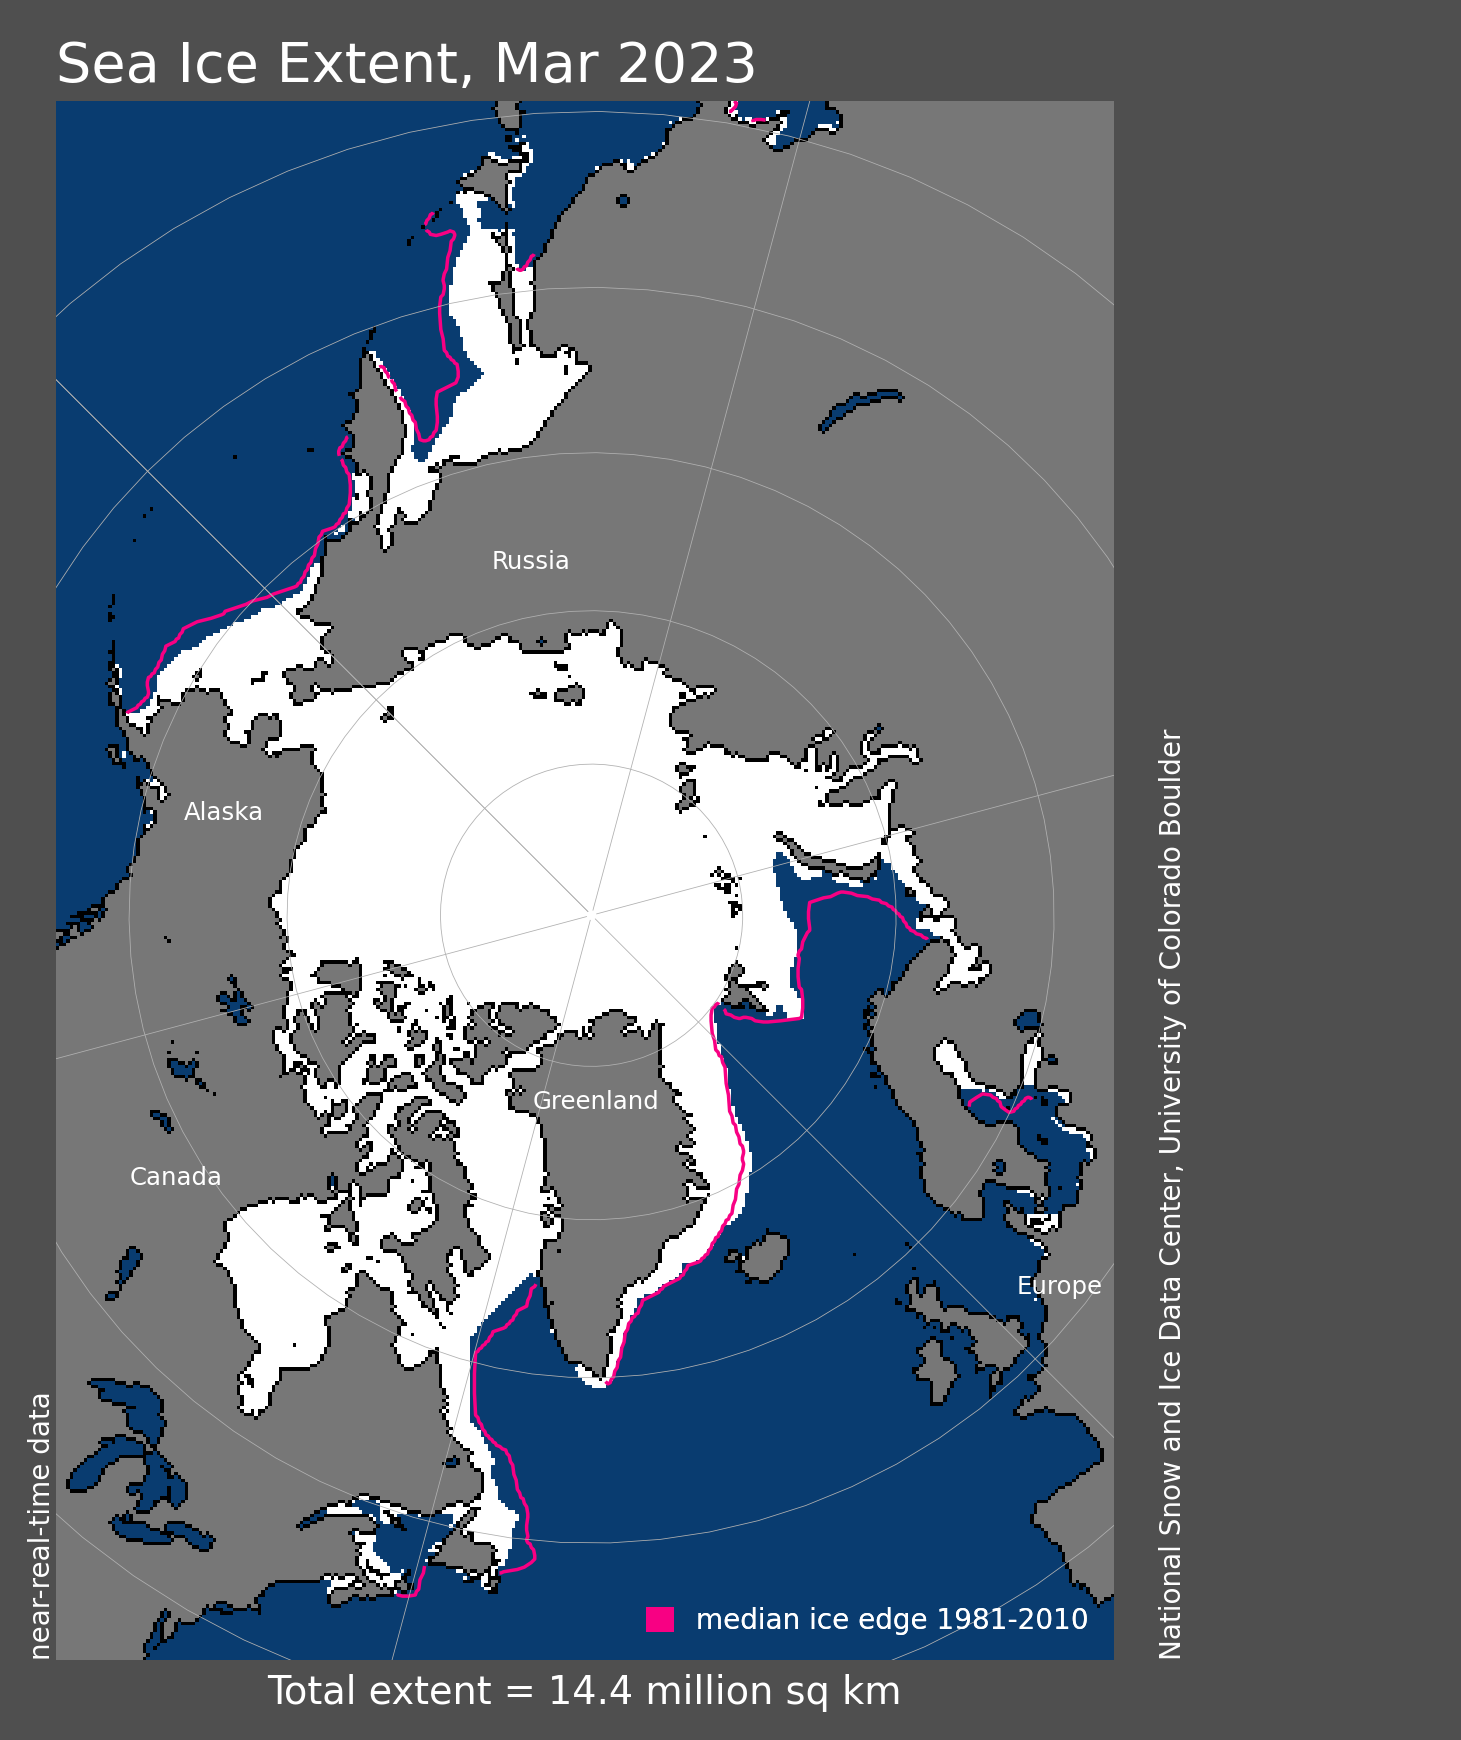
Figure 1. Arctic sea ice extent for March 2023 was 14.44 million square kilometers (5.58 million square miles). The magenta line shows the 1981 to 2010 average extent for that month. Sea Ice Index data. About the data
Credit: National Snow and Ice Data Center
High-resolution image
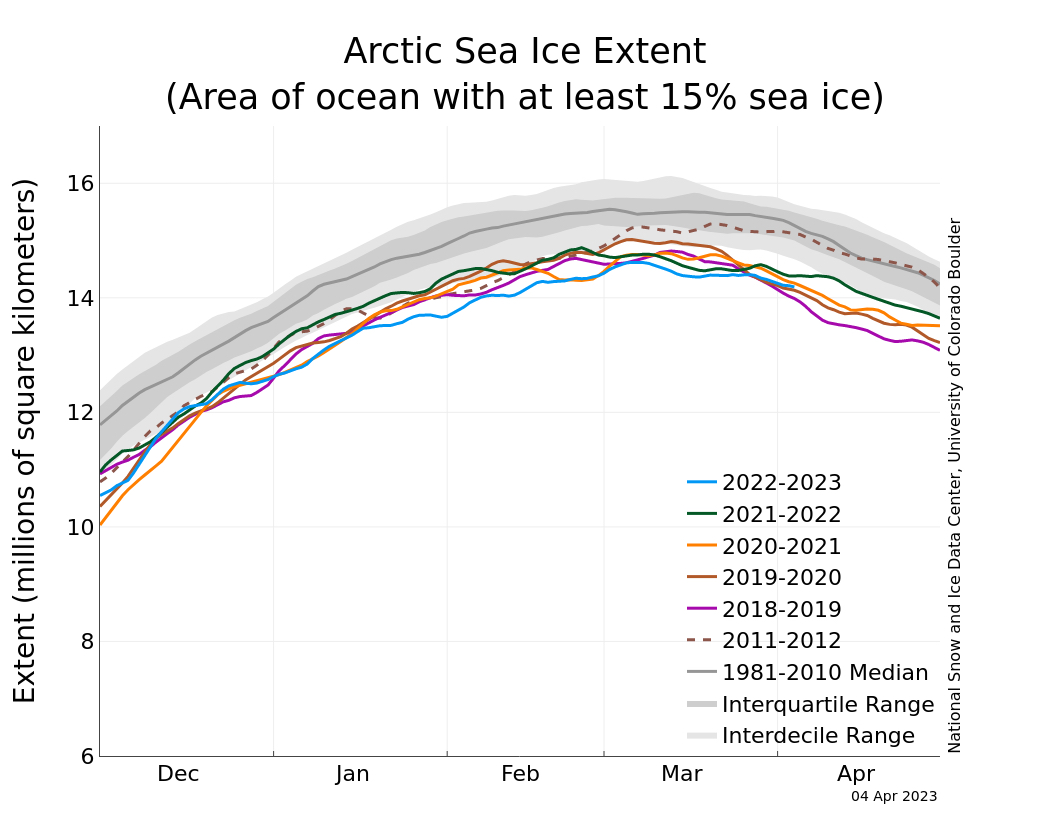
Figure 1b. The graph above shows Arctic sea ice extent as of April 4, 2023, along with daily ice extent data for four previous years and the record low year. 2022 to 2023 is shown in blue, 2021 to 2022 in green, 2020 to 2021 in orange, 2019 to 2020 in brown, 2018 to 2019 in magenta, and 2011 to 2012 in dashed brown. The 1981 to 2010 median is in dark gray. The gray areas around the median line show the interquartile and interdecile ranges of the data. Sea Ice Index data.
Credit: National Snow and Ice Data Center
High-resolution image
The March 2023 average Arctic sea ice extent was 14.44 million square kilometers (5.58 million square miles), the sixth lowest March in the satellite record (Figure 1a). March monthly average extent was 990,000 square kilometers (382,000 square miles) below the 1981 to 2010 average of 15.43 million square kilometers (5.96 million square miles), but 150,000 square kilometers (57,900 square miles) above the record low set in March 2017 (Figure 1b).
After the March 6 seasonal maximum, extent declined for a week, but then remained almost constant during the second half of the month. Ice extent was slightly below average in almost all areas, but particularly in the Sea of Okhotsk and in the Gulf of St. Lawrence, with smaller retreats in the Barents and Bering Seas. Sea ice concentration within the ice pack was generally quite high in all areas, with the exception of the Sea of Okhotsk and the northern Barents Sea where the ice pack was more open.
Overall, extent decreased 170,000 square kilometers (65,600 square miles) during March 2023, compared to the 1981 to 2010 average March decrease of 220,000 square kilometers (84,900 square miles).
Conditions in context
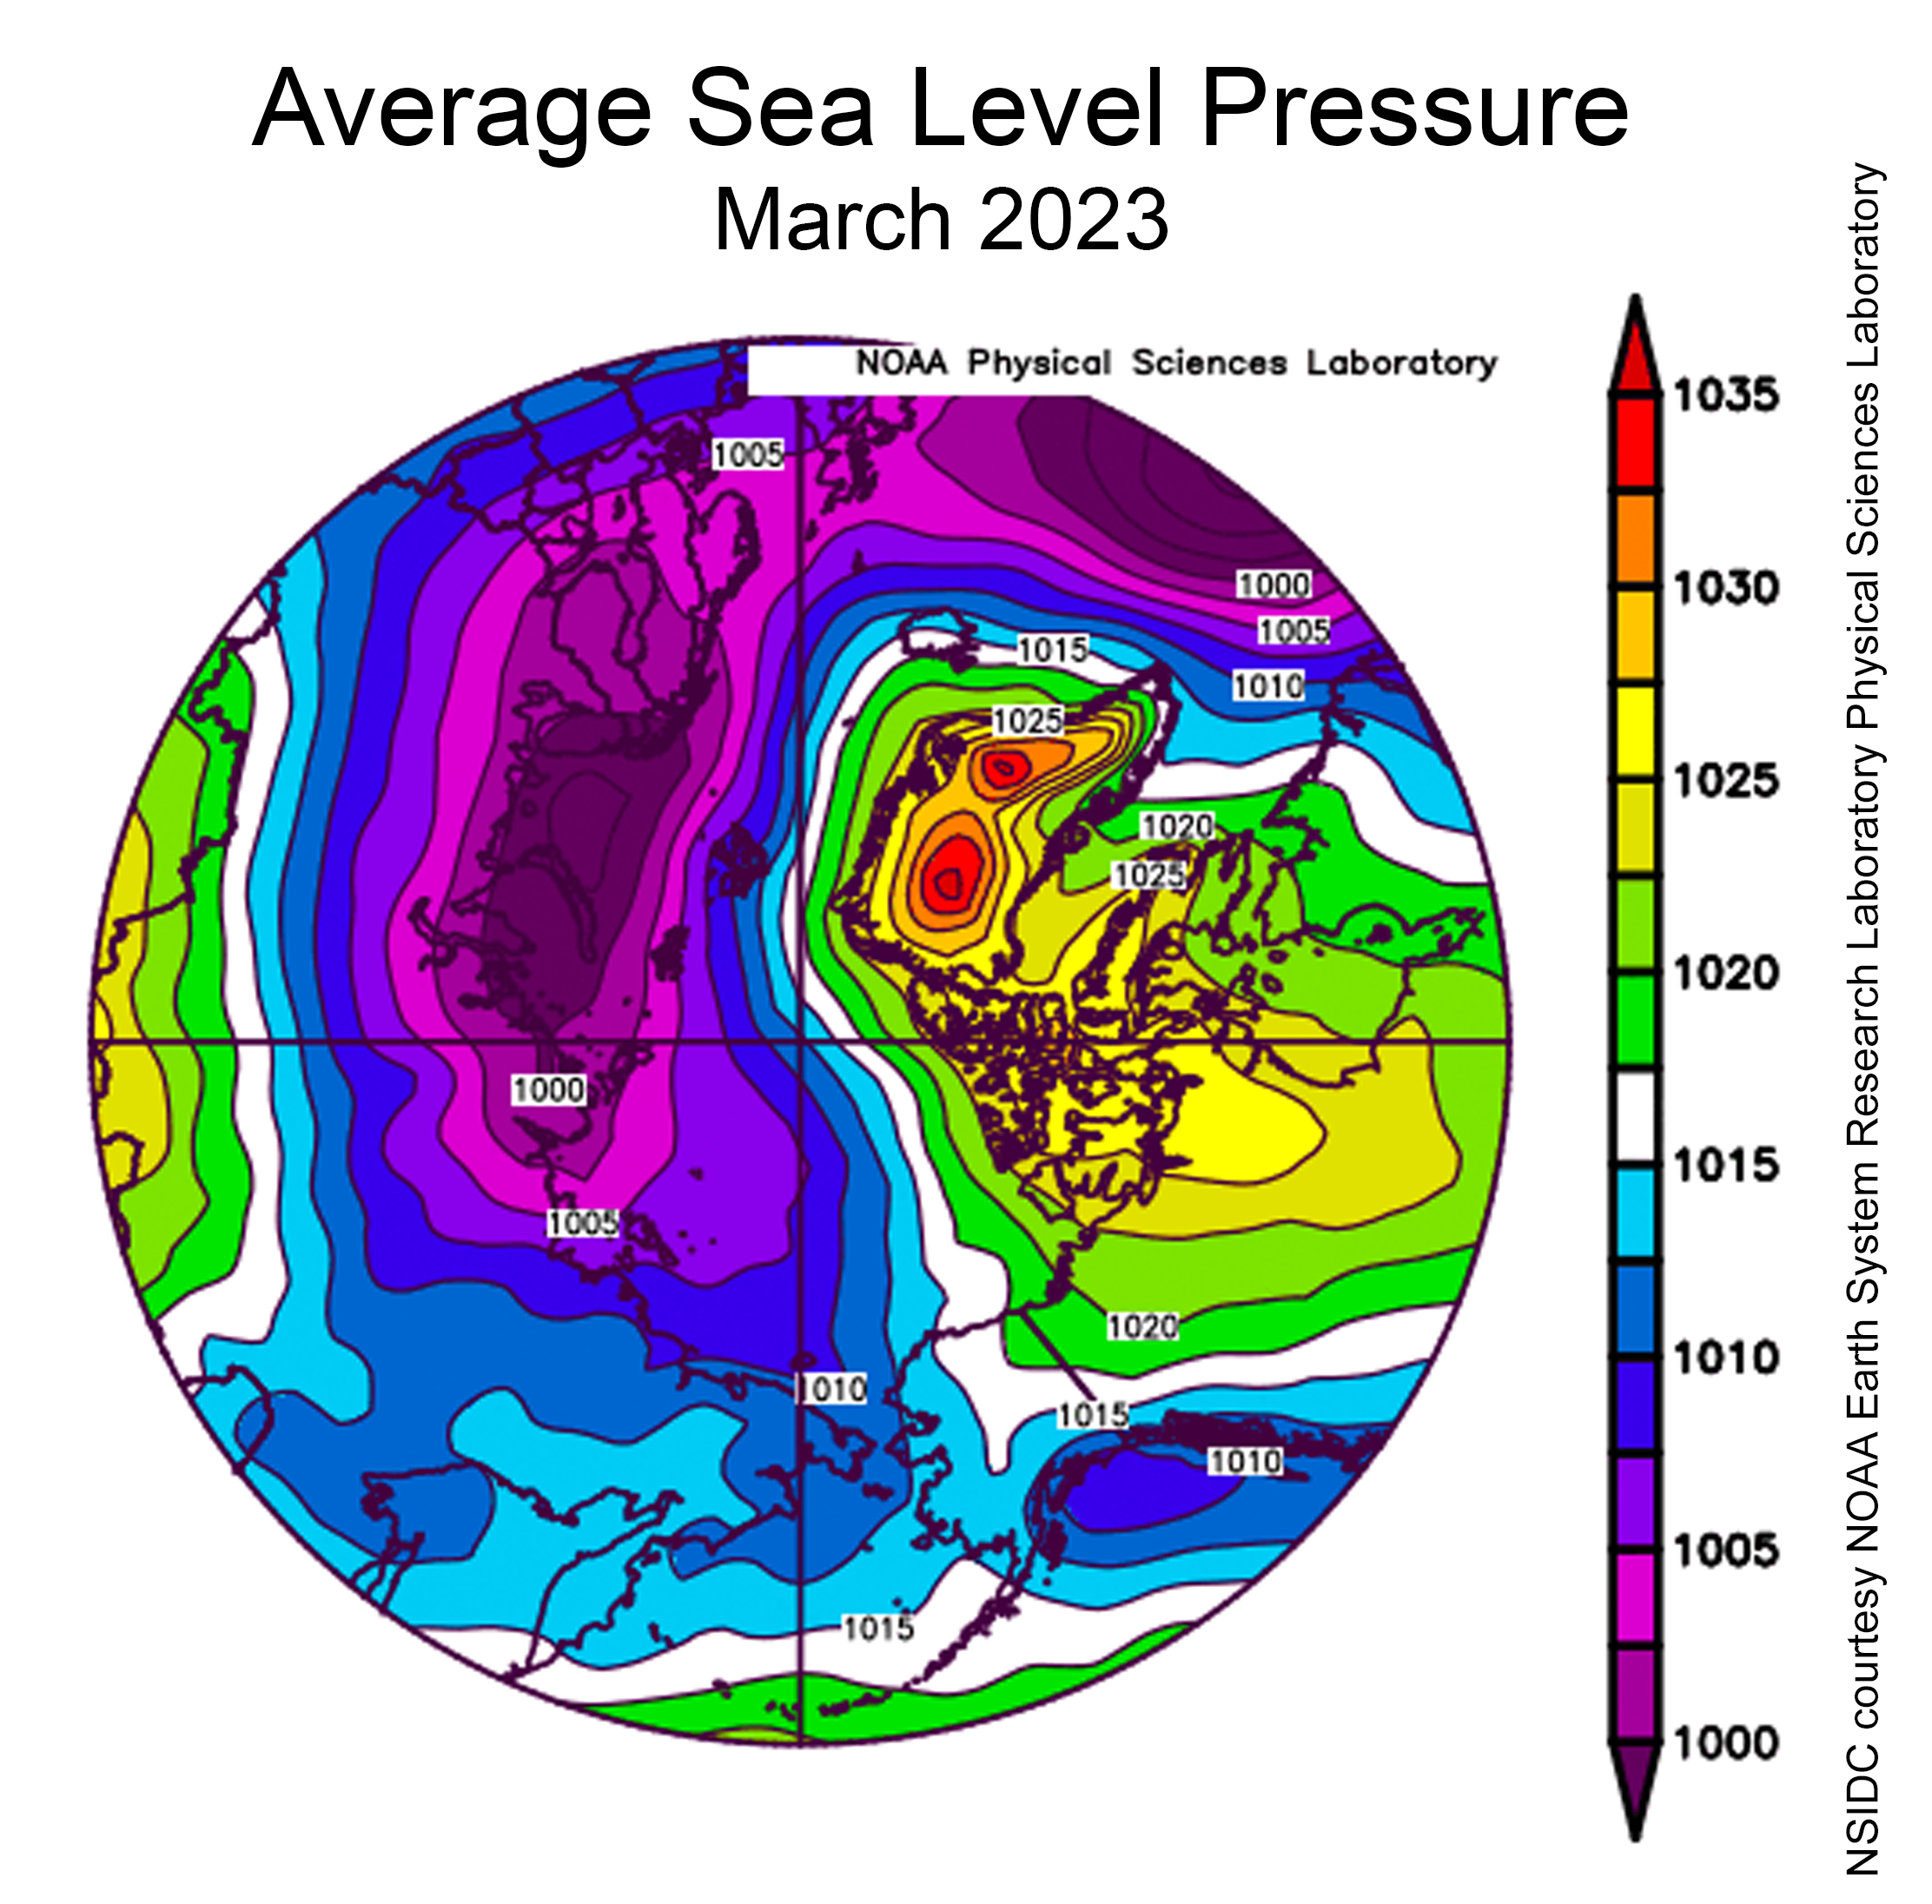
Figure 2a. This plot shows average sea level pressure in the Arctic in millibars for March 2023. Yellows and reds indicate higher than average air pressures; blues and purples indicate lower than average air pressures.
Credit: NSIDC courtesy NOAA Earth System Research Laboratory Physical Sciences Laboratory
High-resolution image
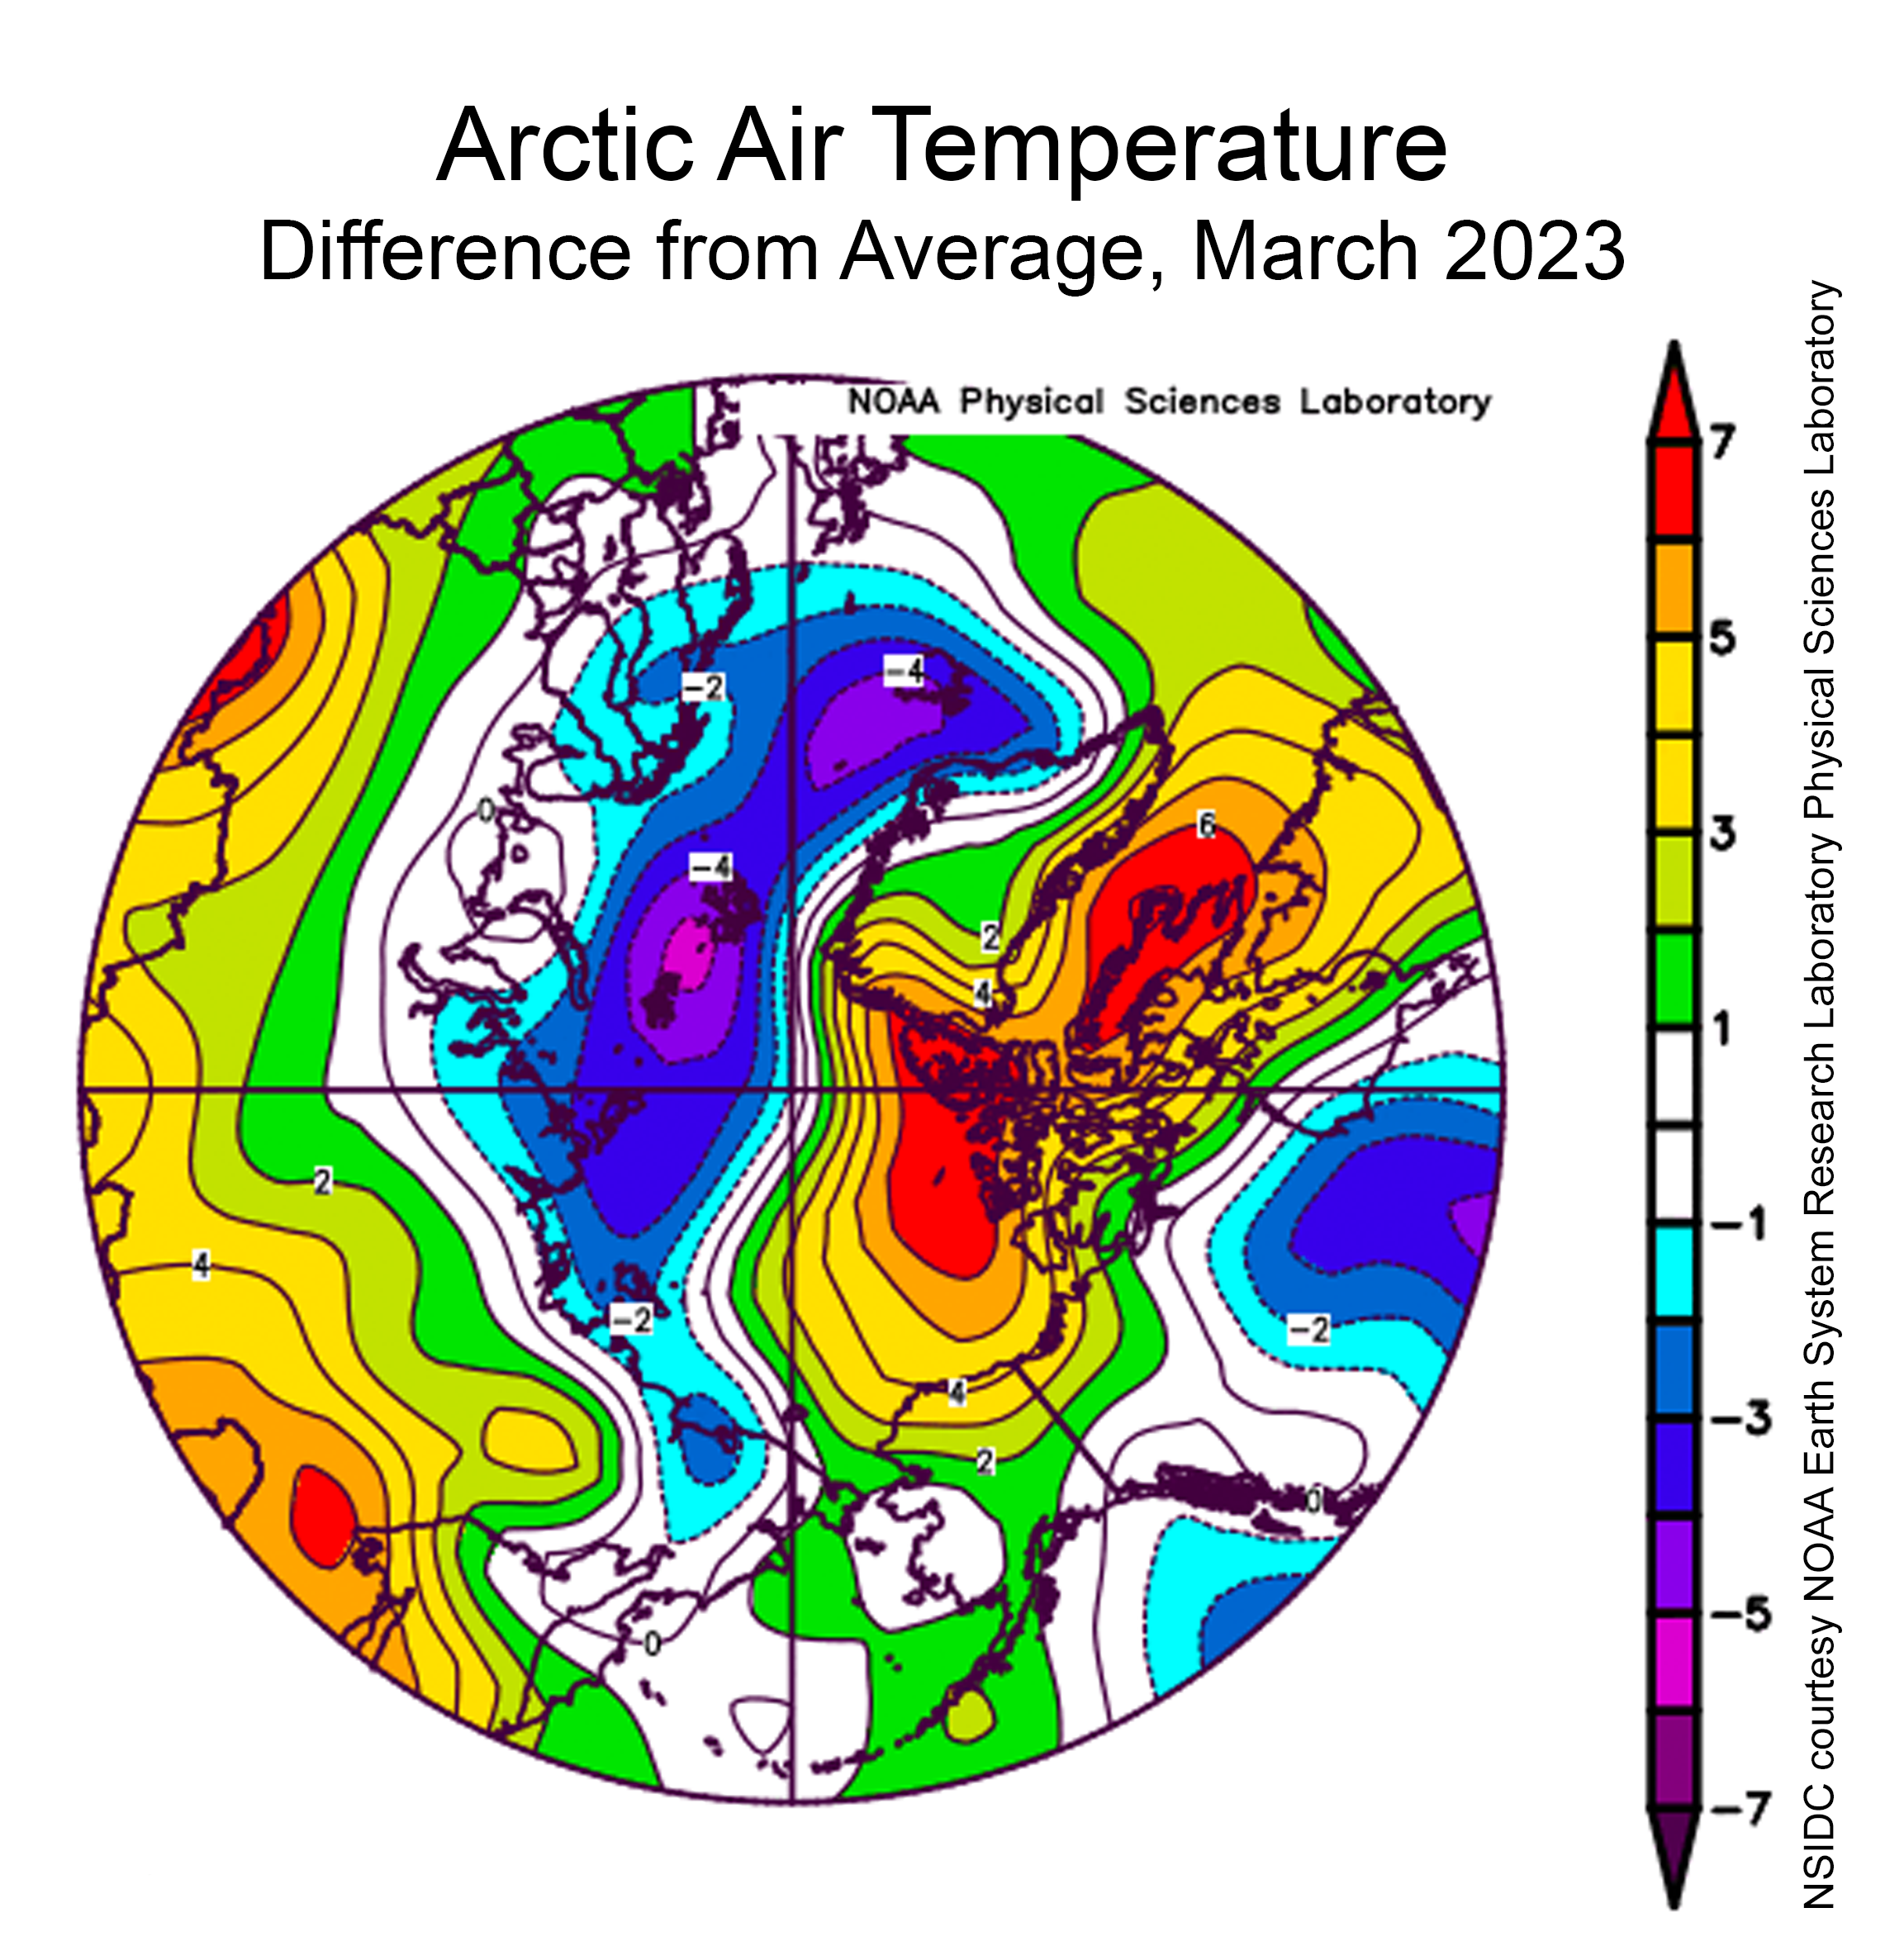
Figure 2b. This plot shows the departure from average air temperature in the Arctic at the 925 hPa level, in degrees Celsius, for March 2023. Yellows and reds indicate higher than average temperatures; blues and purples indicate lower than average temperatures.
Credit: NSIDC courtesy NOAA Earth System Research Laboratory Physical Sciences Laboratory
High-resolution image
March weather conditions were dominated by persistent high sea level pressure over northern Canada and Greenland, and low sea level pressure over northern Europe and European Russia (Figure 2a). This led to winds from the south and warm conditions over Baffin Bay and western Greenland with temperatures up to 6 to 7 degrees Celsius above average (11 to 13 degrees Fahrenheit) (Figure 2b). Cool conditions extended from Iceland to Franz Josef Land, where temperatures were 4 to 6 degrees Celsius below average (7 to 11 degrees Fahrenheit).
March 2023 compared to previous years
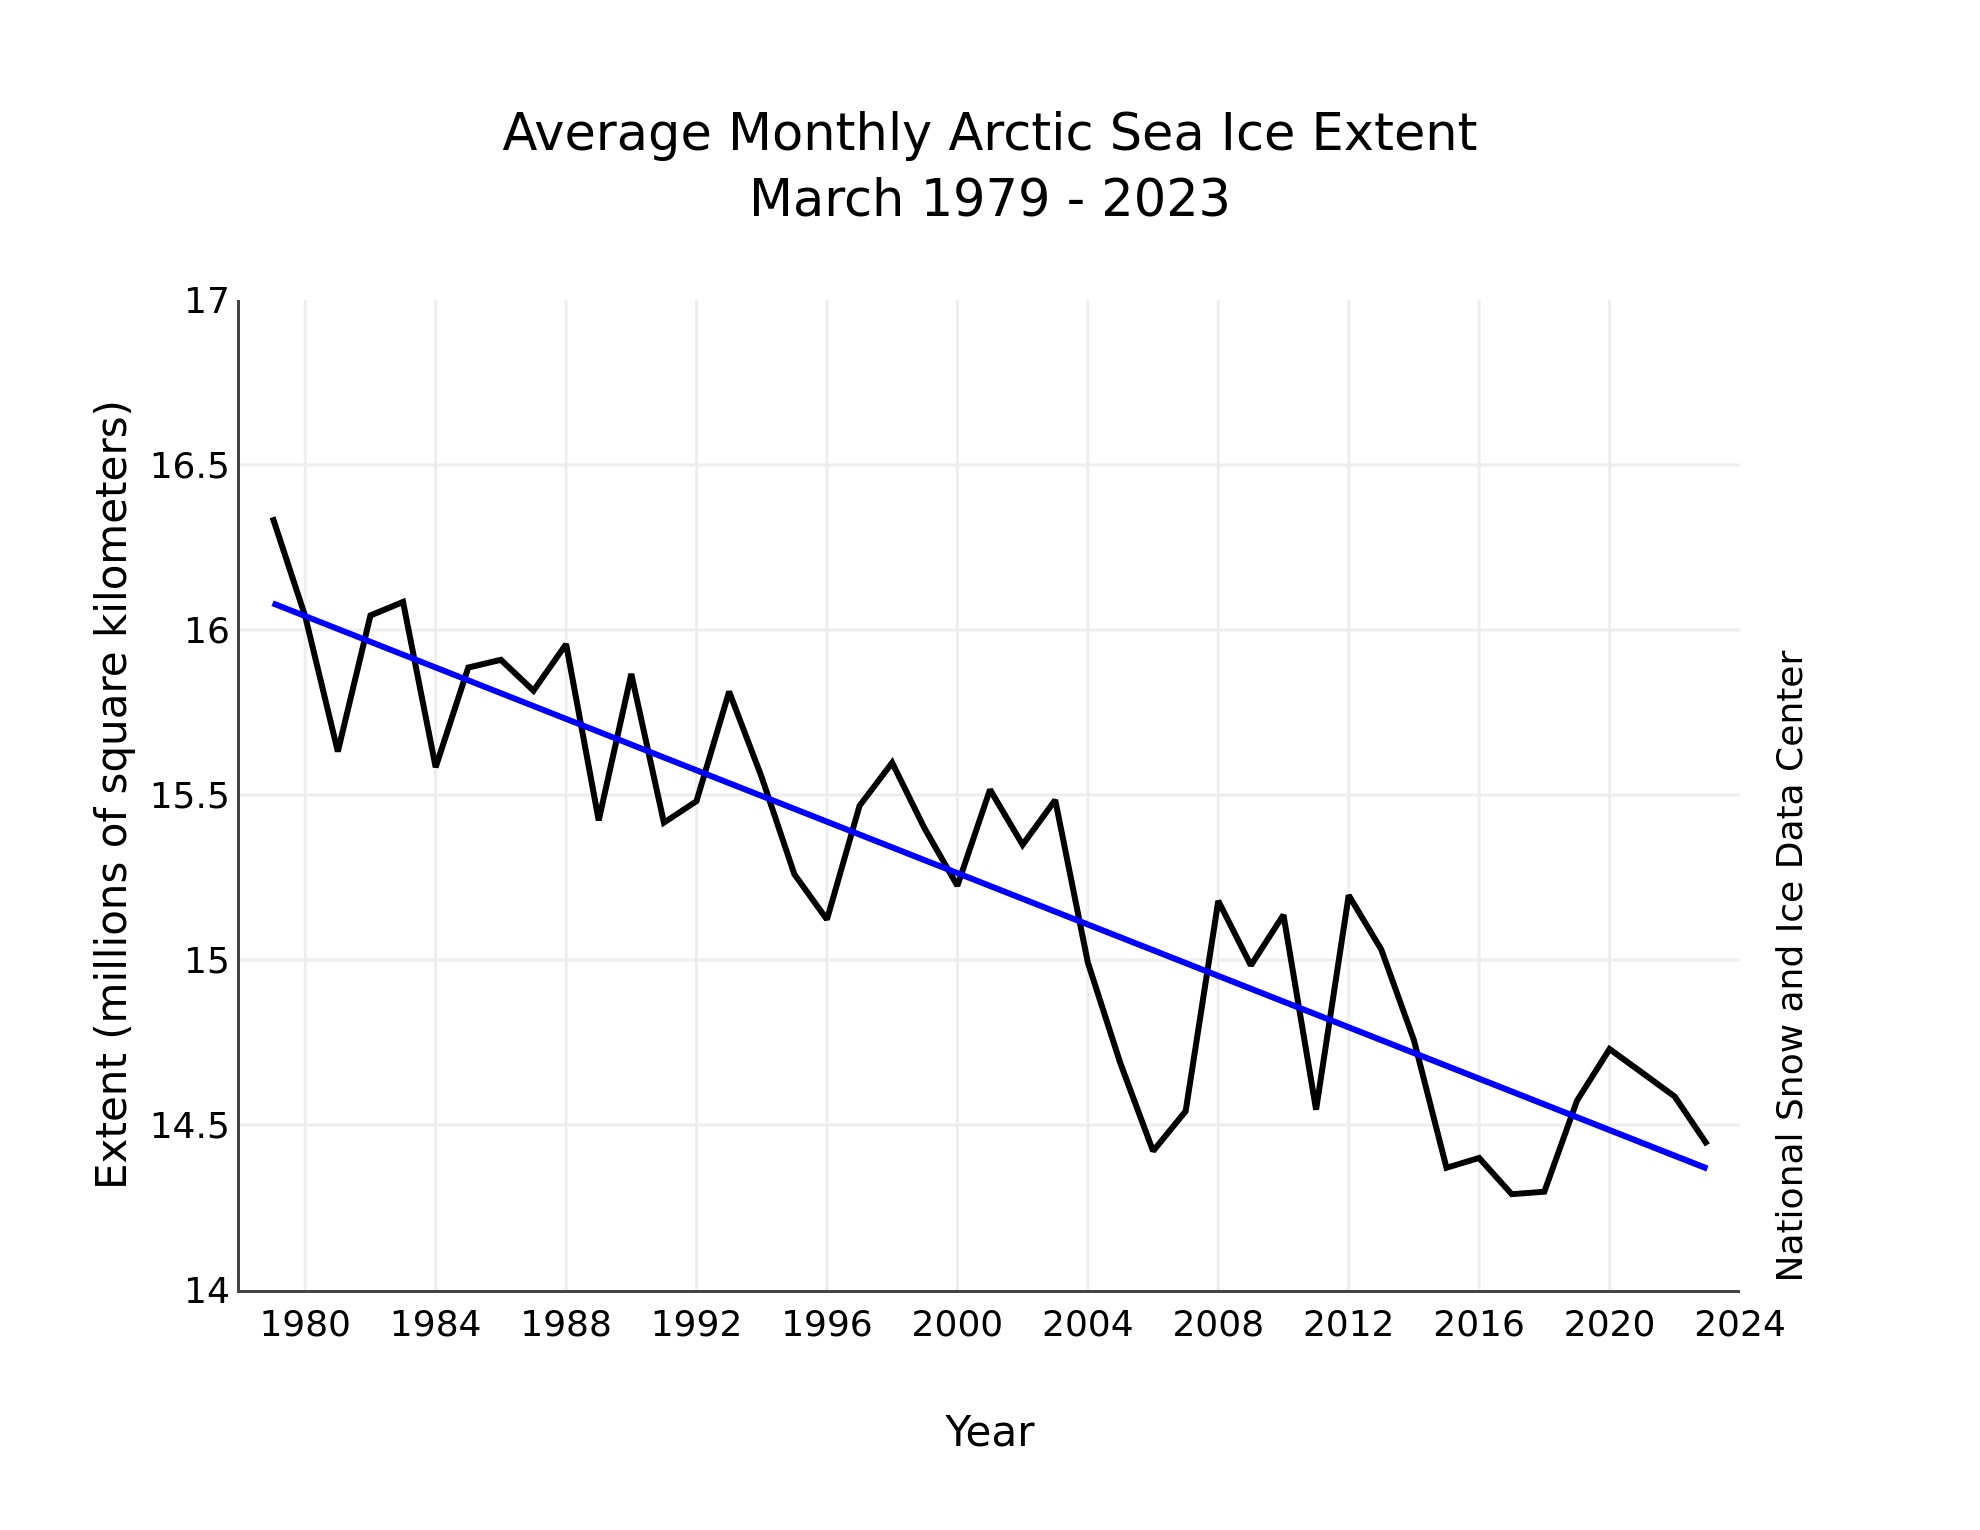
Figure 3. Monthly March ice extent for 1979 to 2023 shows a decline of 2.5 percent per decade.
Credit: National Snow and Ice Data Center
High-resolution image
The downward linear trend for Arctic sea ice extent in March over the 45-year satellite record is 38,900 square kilometers (15,000 square miles) per year, or 2.5 percent per decade relative to the 1981 to 2010 average. Based on the linear trend, since 1979, March has lost 2.28 million square kilometers (880,000 square miles). This is roughly eight and a half times the size of Colorado or six and a half times the size of Germany.
Arctic sea ice age

Figure 4. The top maps show sea ice age for the week of February 26 to March 4 for (a) 1985 and (b) 2023. The bottom graph is a timeseries of the percent of the sea ice extent within the Arctic Ocean domain (inset map) for the week of February 26 to March 4, 1985, through 2023; color categories are the same as in the maps. Data and images from NSIDC EASE-Grid Sea Ice Age, Version 4 (Tschudi et al., 2019a) and Quicklook Arctic Weekly EASE-Grid Sea Ice Age, Version 1
Credit: Tschudi et al., 2019b
High-resolution image
An important indicator of sea ice conditions is the sea ice age. As in recent years, there is far less multiyear ice (ice that has survived at least one summer melt season) and the oldest ice (ice that has survived several or more melt seasons) is nearly gone. Multiyear ice covered 33.9 percent of the Arctic Ocean domain in the week of February 26 through March 4, 2023, slightly less than the 34.3 percent during the same week in 2022. This is much less than in the late 1980s when multiyear ice covered 60 to 65 percent of the Arctic Ocean.
A rapid decline in multiyear ice coverage occurred after the then record 2007 September sea ice extent minimum. The multiyear ice coverage has been variable since then, with no significant trend. Overall, there is almost no ice over four years old remaining—it now comprises just 3 percent of the total ice cover. This is the same percentage as last year and contrasts starkly with the late 1980s when 30 to 35 percent of the Arctic Ocean’s ice was older than 4 years. Since 2011, the older-than-four-year-old ice has comprised less than 5.5 percent of the Arctic Ocean. These results are consistent with a new study that evaluated the thickness of ice from moorings in Fram Strait, finding a shift in the ice thickness after 2007 and a decline of the average residence time of ice in the Arctic Ocean.
Autumn in the Antarctic
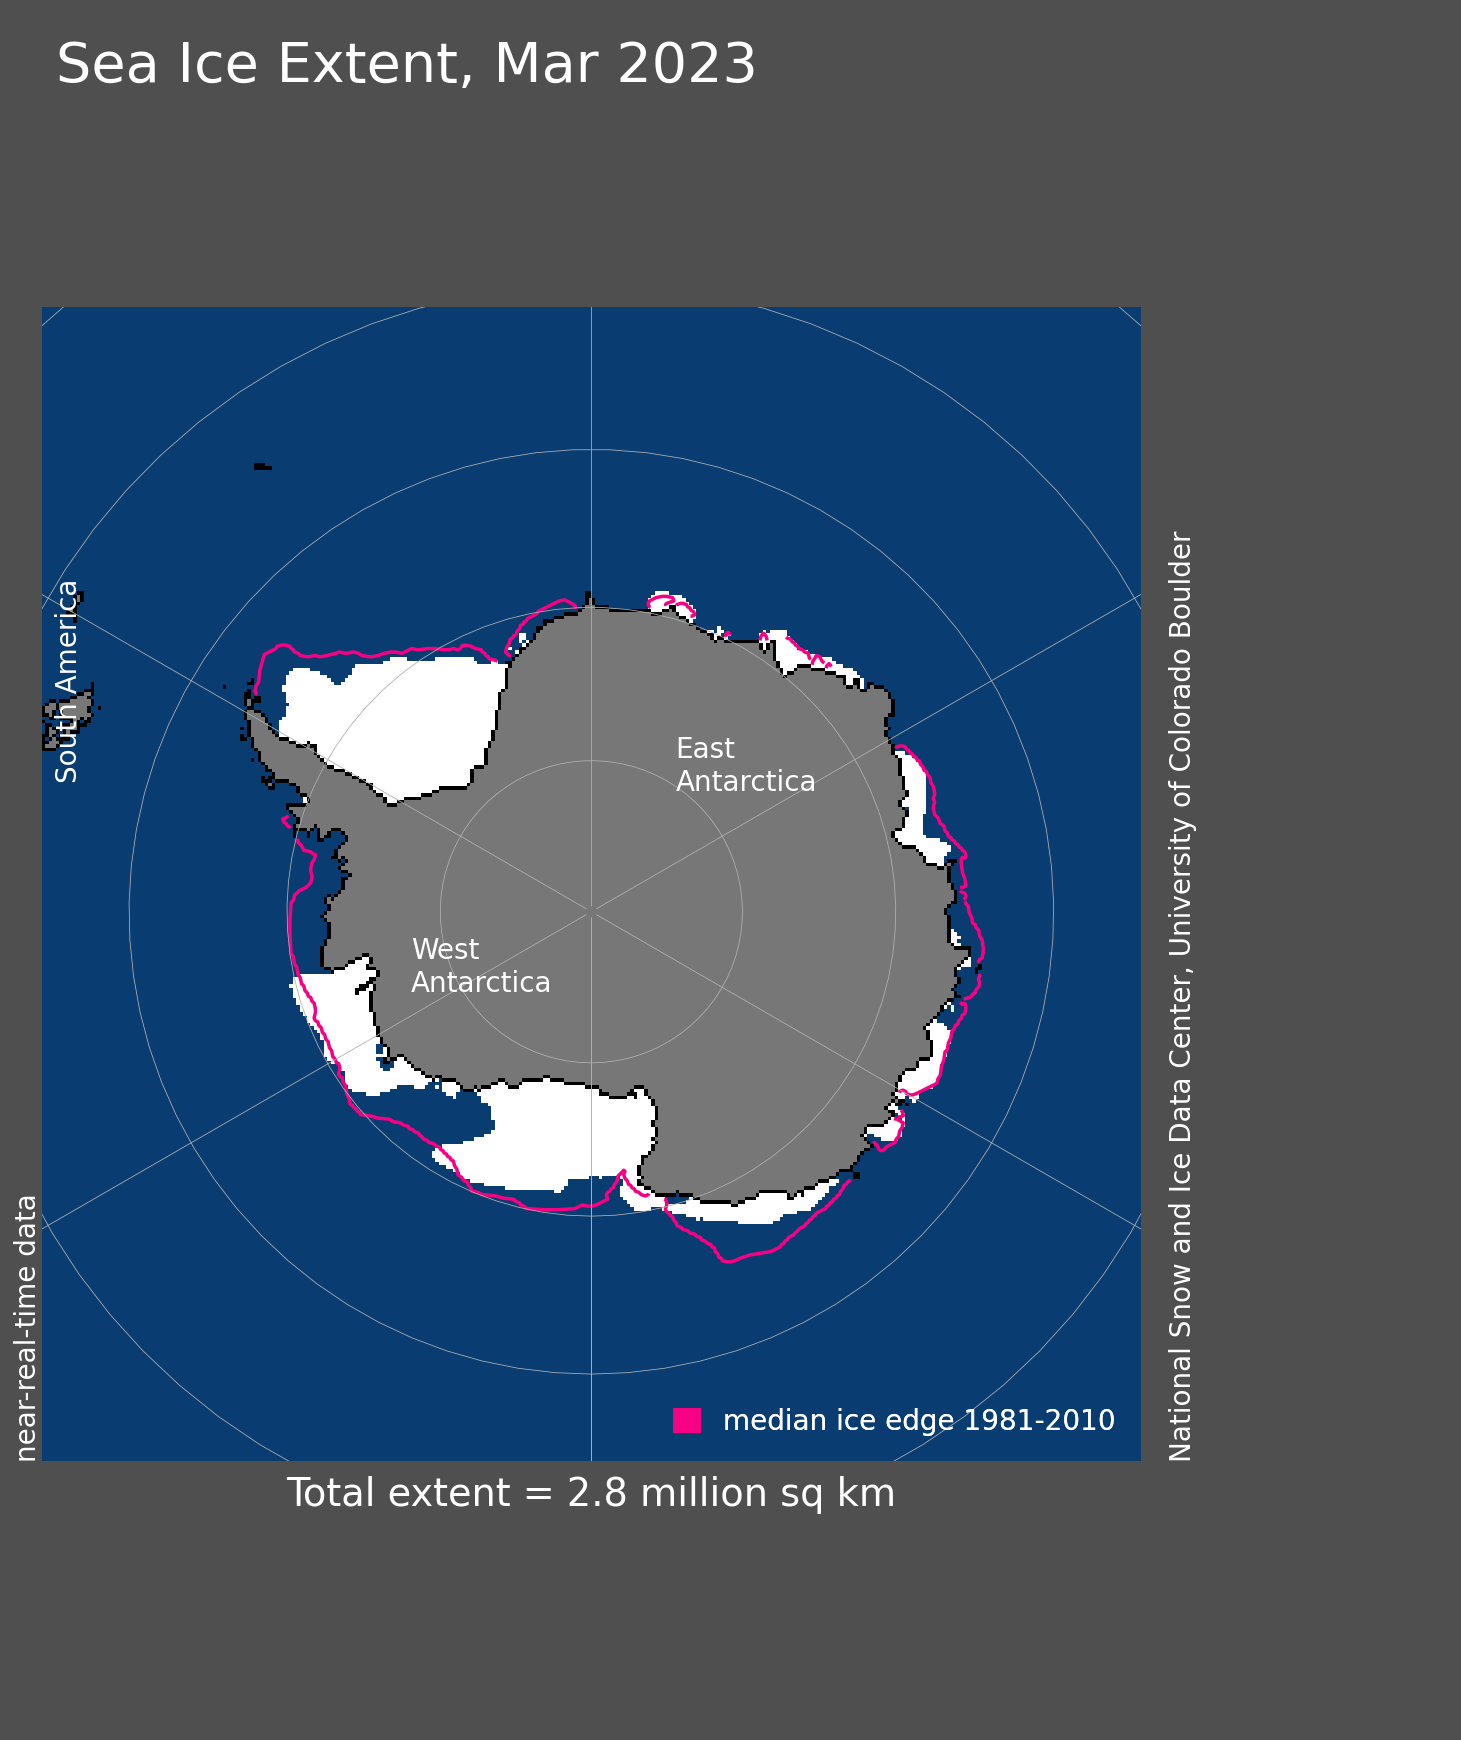
Figure 5. Antarctic sea ice extent for March 2023 was 2.80 million square kilometers (1.08 million square miles). The magenta line shows the 1981 to 2010 average extent for that month. Sea Ice Index data. About the data
Credit: National Snow and Ice Data Center
High-resolution image
Antarctic sea ice extent expanded at a near-average pace in March following its record low extent on February 21. At the end of the month, the Ross Sea and Amundsen Sea were covered again with ice, and significant expansion of ice had begun in the Weddell Sea. However, large areas of the coast, such as the southern Bellingshausen Sea coastline were still ice free; other areas of open water persisted along the boundary between the Amundsen and Ross Seas. Despite regrowth, the Weddell Sea ice cover is well below its typical extent for the end of March.
The March 2023 average sea ice extent around Antarctica was 2.80 million square kilometers (1.08 million square miles), the second lowest March on record. This is 100,000 square kilometers (38,600 square miles) more than the record low extent for March set in 2017.
Ocean circulation changes in the Southern Ocean
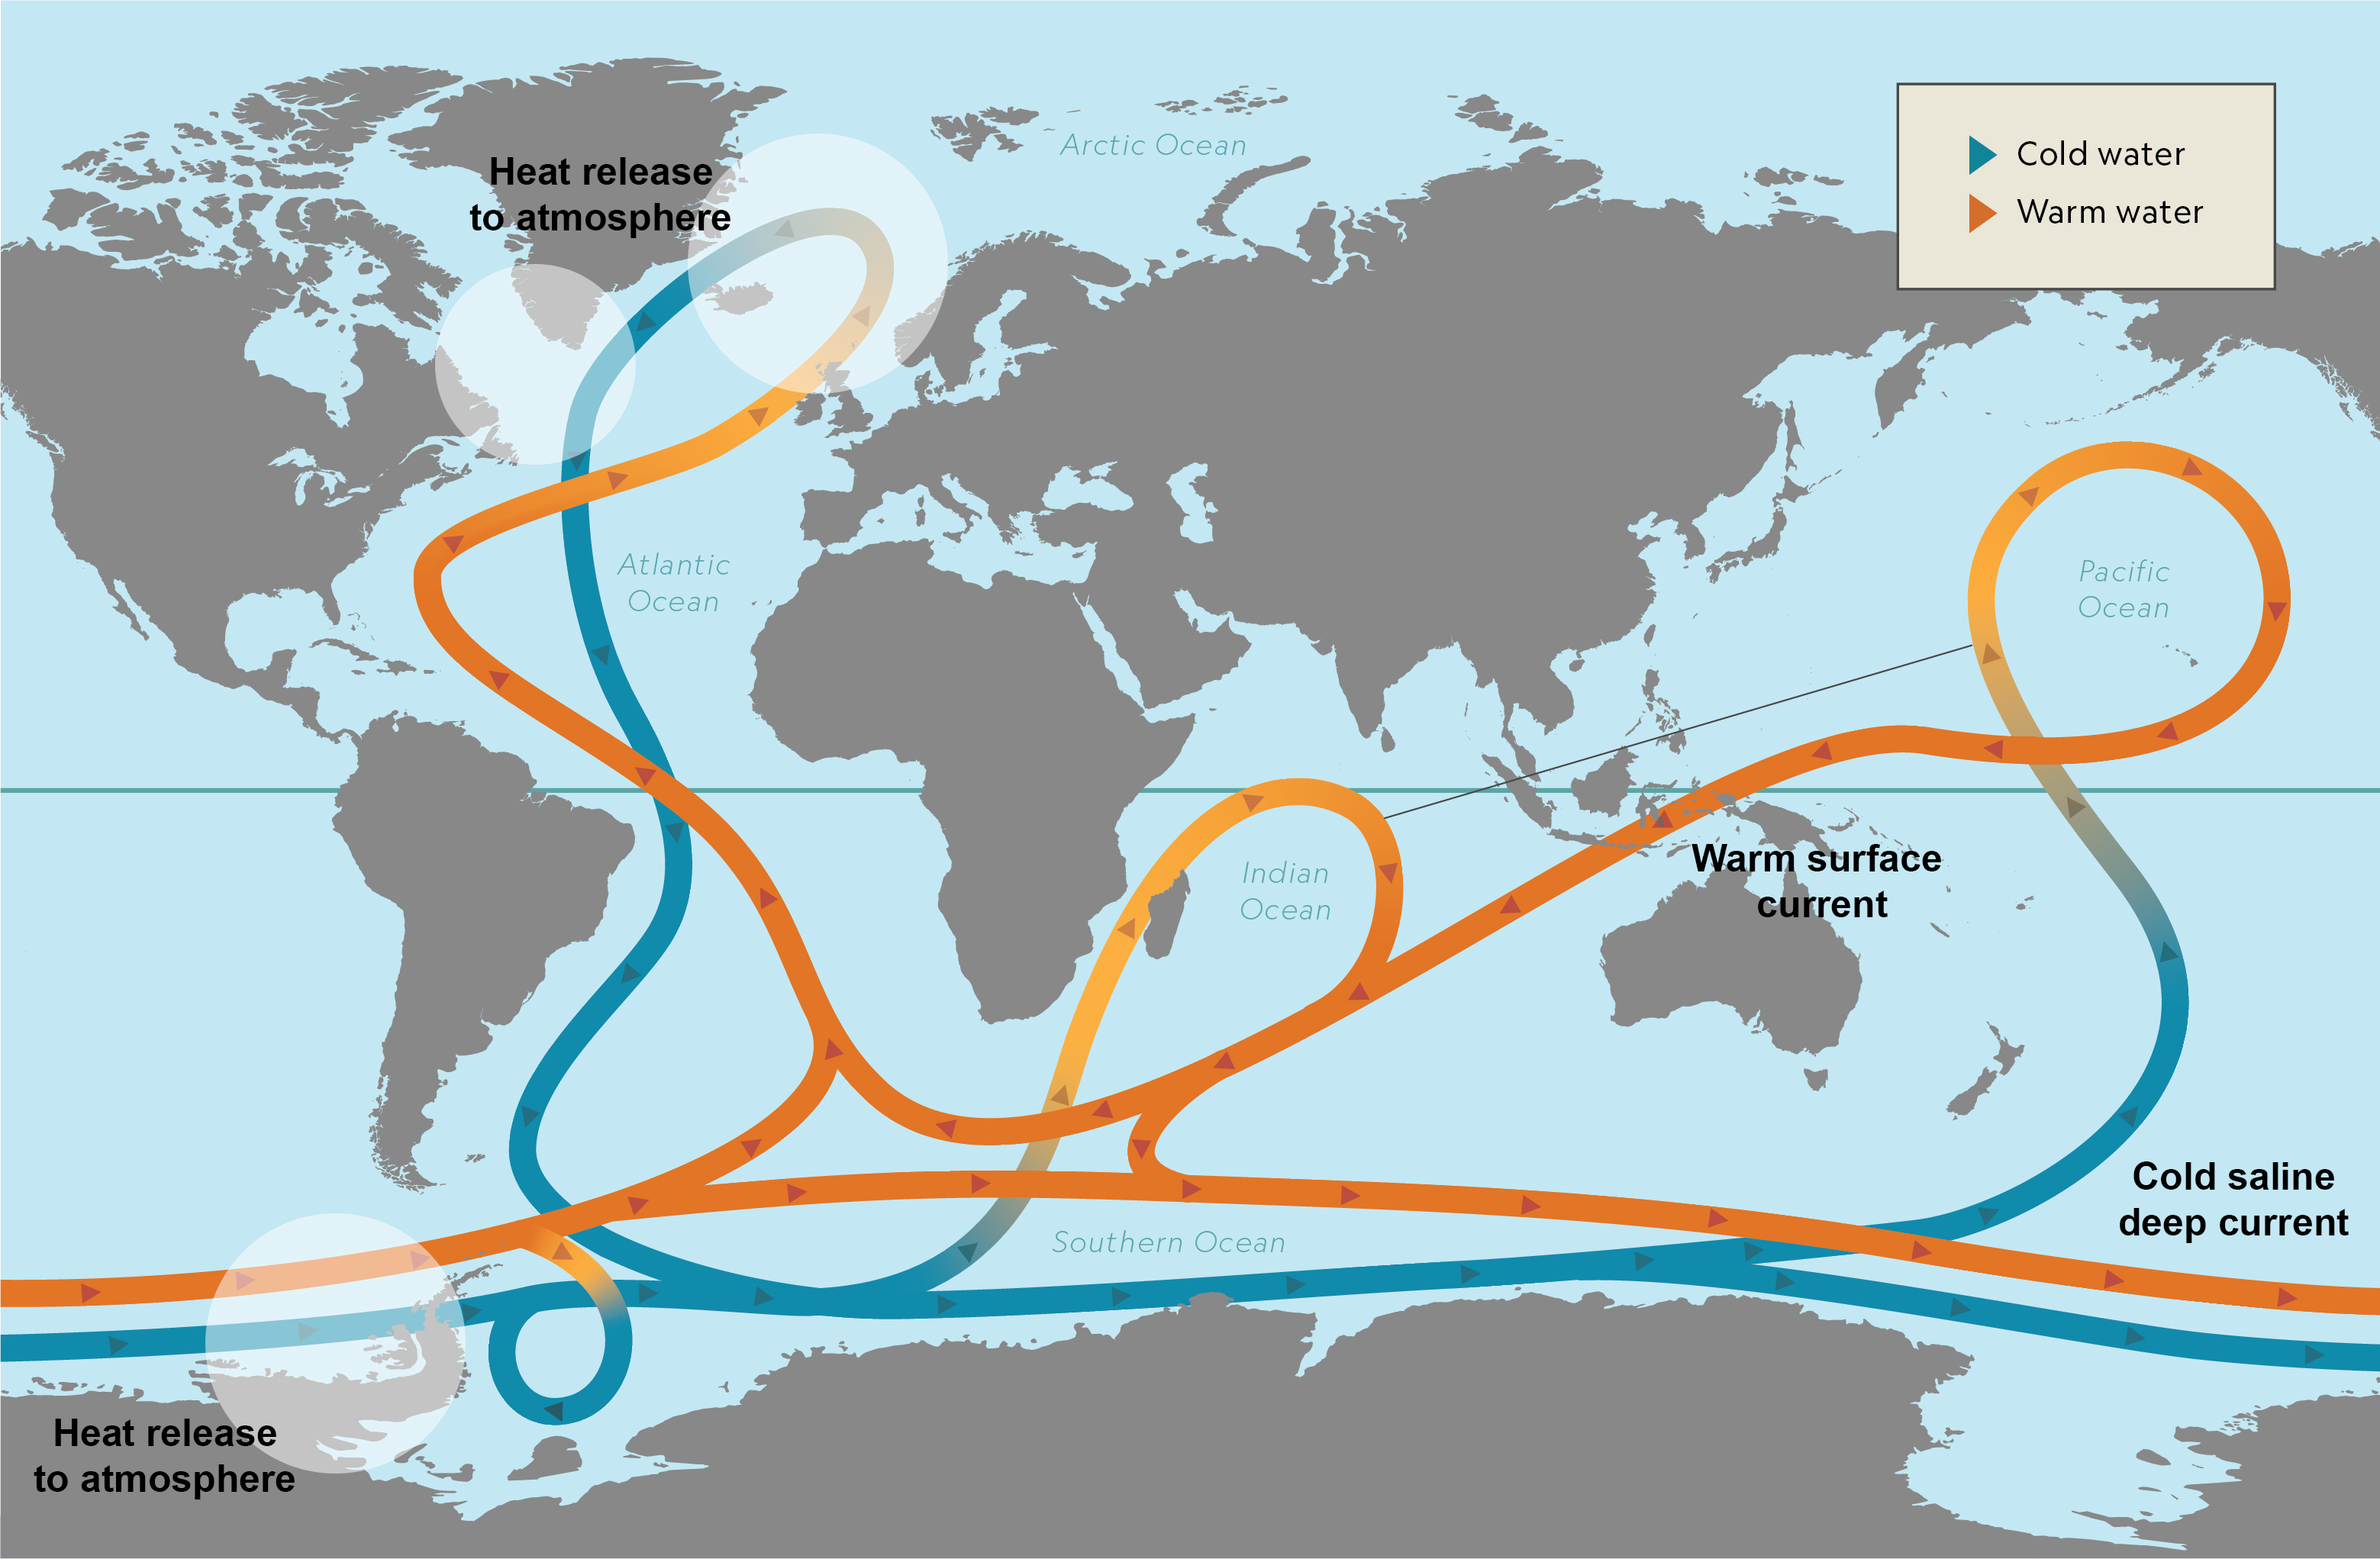
Figure 6a. This map shows global ocean circulation, including the major areas of ocean water sinking and upwelling. This is often called the global ocean conveyor belt.
Credit: Modified from National Geographic
High-resolution image
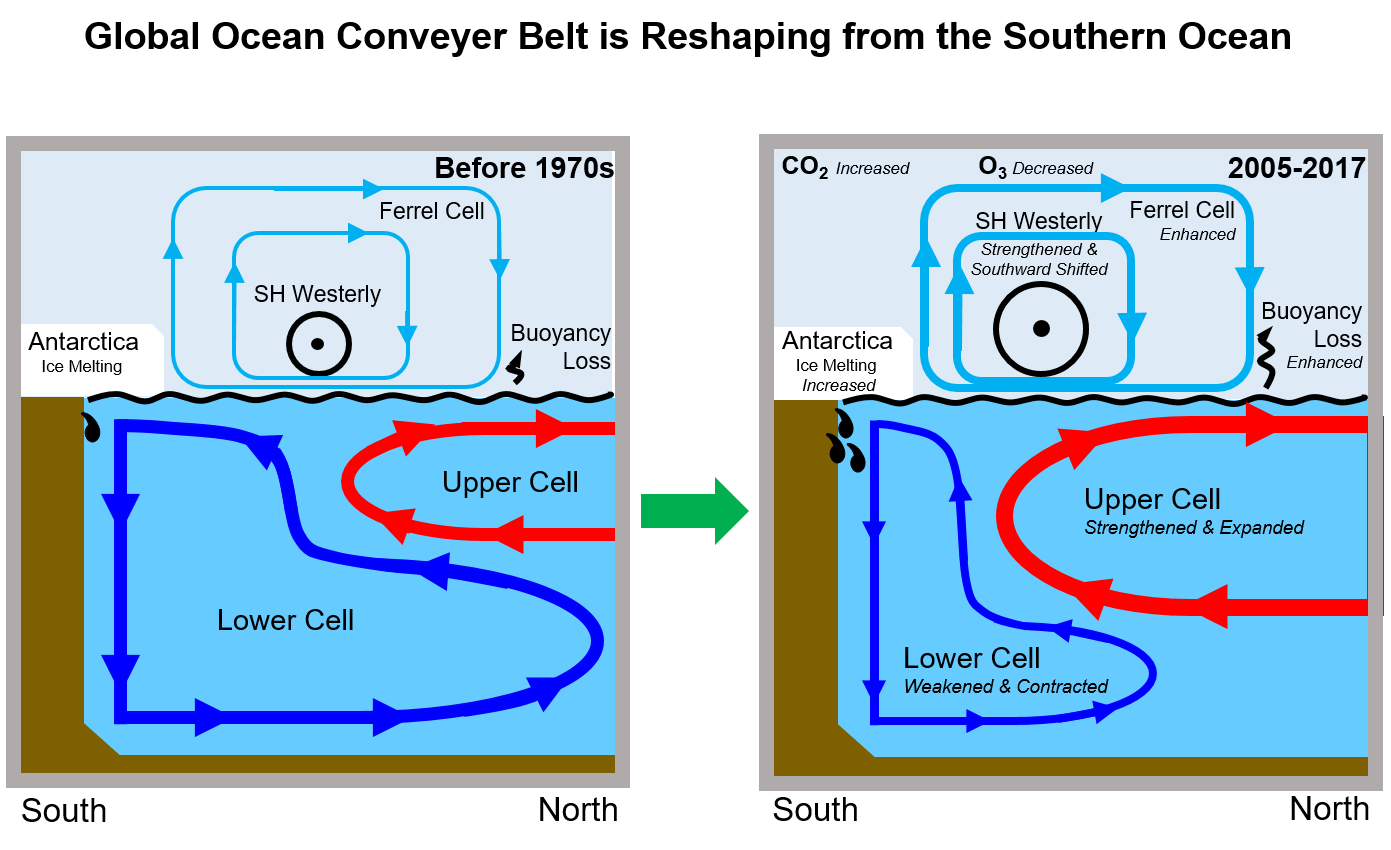
Figure 6b. This schematic diagram of the Southern Ocean portion of the global ocean circulation shows the changes in the recent decades, on the right, relative to the earlier pattern, on the left.
Credit: Lee et al., 2023
High-resolution image
The ocean circulation, which includes well-known surface and subsurface currents and the vertical motion of ocean water, appears to have changed in a major way over the Southern Hemisphere in recent decades. Increased contributions of meltwater from the Antarctic Ice Sheet, mostly from melting at depth due to increased warm deep water reaching the edge of the continent, has added freshwater to the sea currents, making the water less dense. This lighter water flows up to the surface, increasing the stratification in the near-surface layer. Because the stratification is stronger, the vertical ocean circulation has slowed.
These changes reflect changing winds around the continent, resulting from both the ozone hole, which cools the Antarctic stratosphere, increasing the westerly circumpolar winds, and increased carbon dioxide and methane in the air, which warms the tropics, again making the far southern winds stronger.
Great Scott! The Great Lakes in 2023
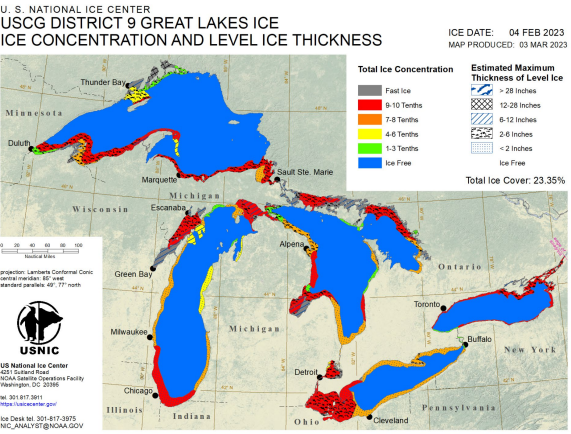
Figure 7a. This map of the Great Lakes shows ice cover on February 4th, 2023, the date of maximum ice cover for 2023.
Credit: US National Ice Center
High-resolution image
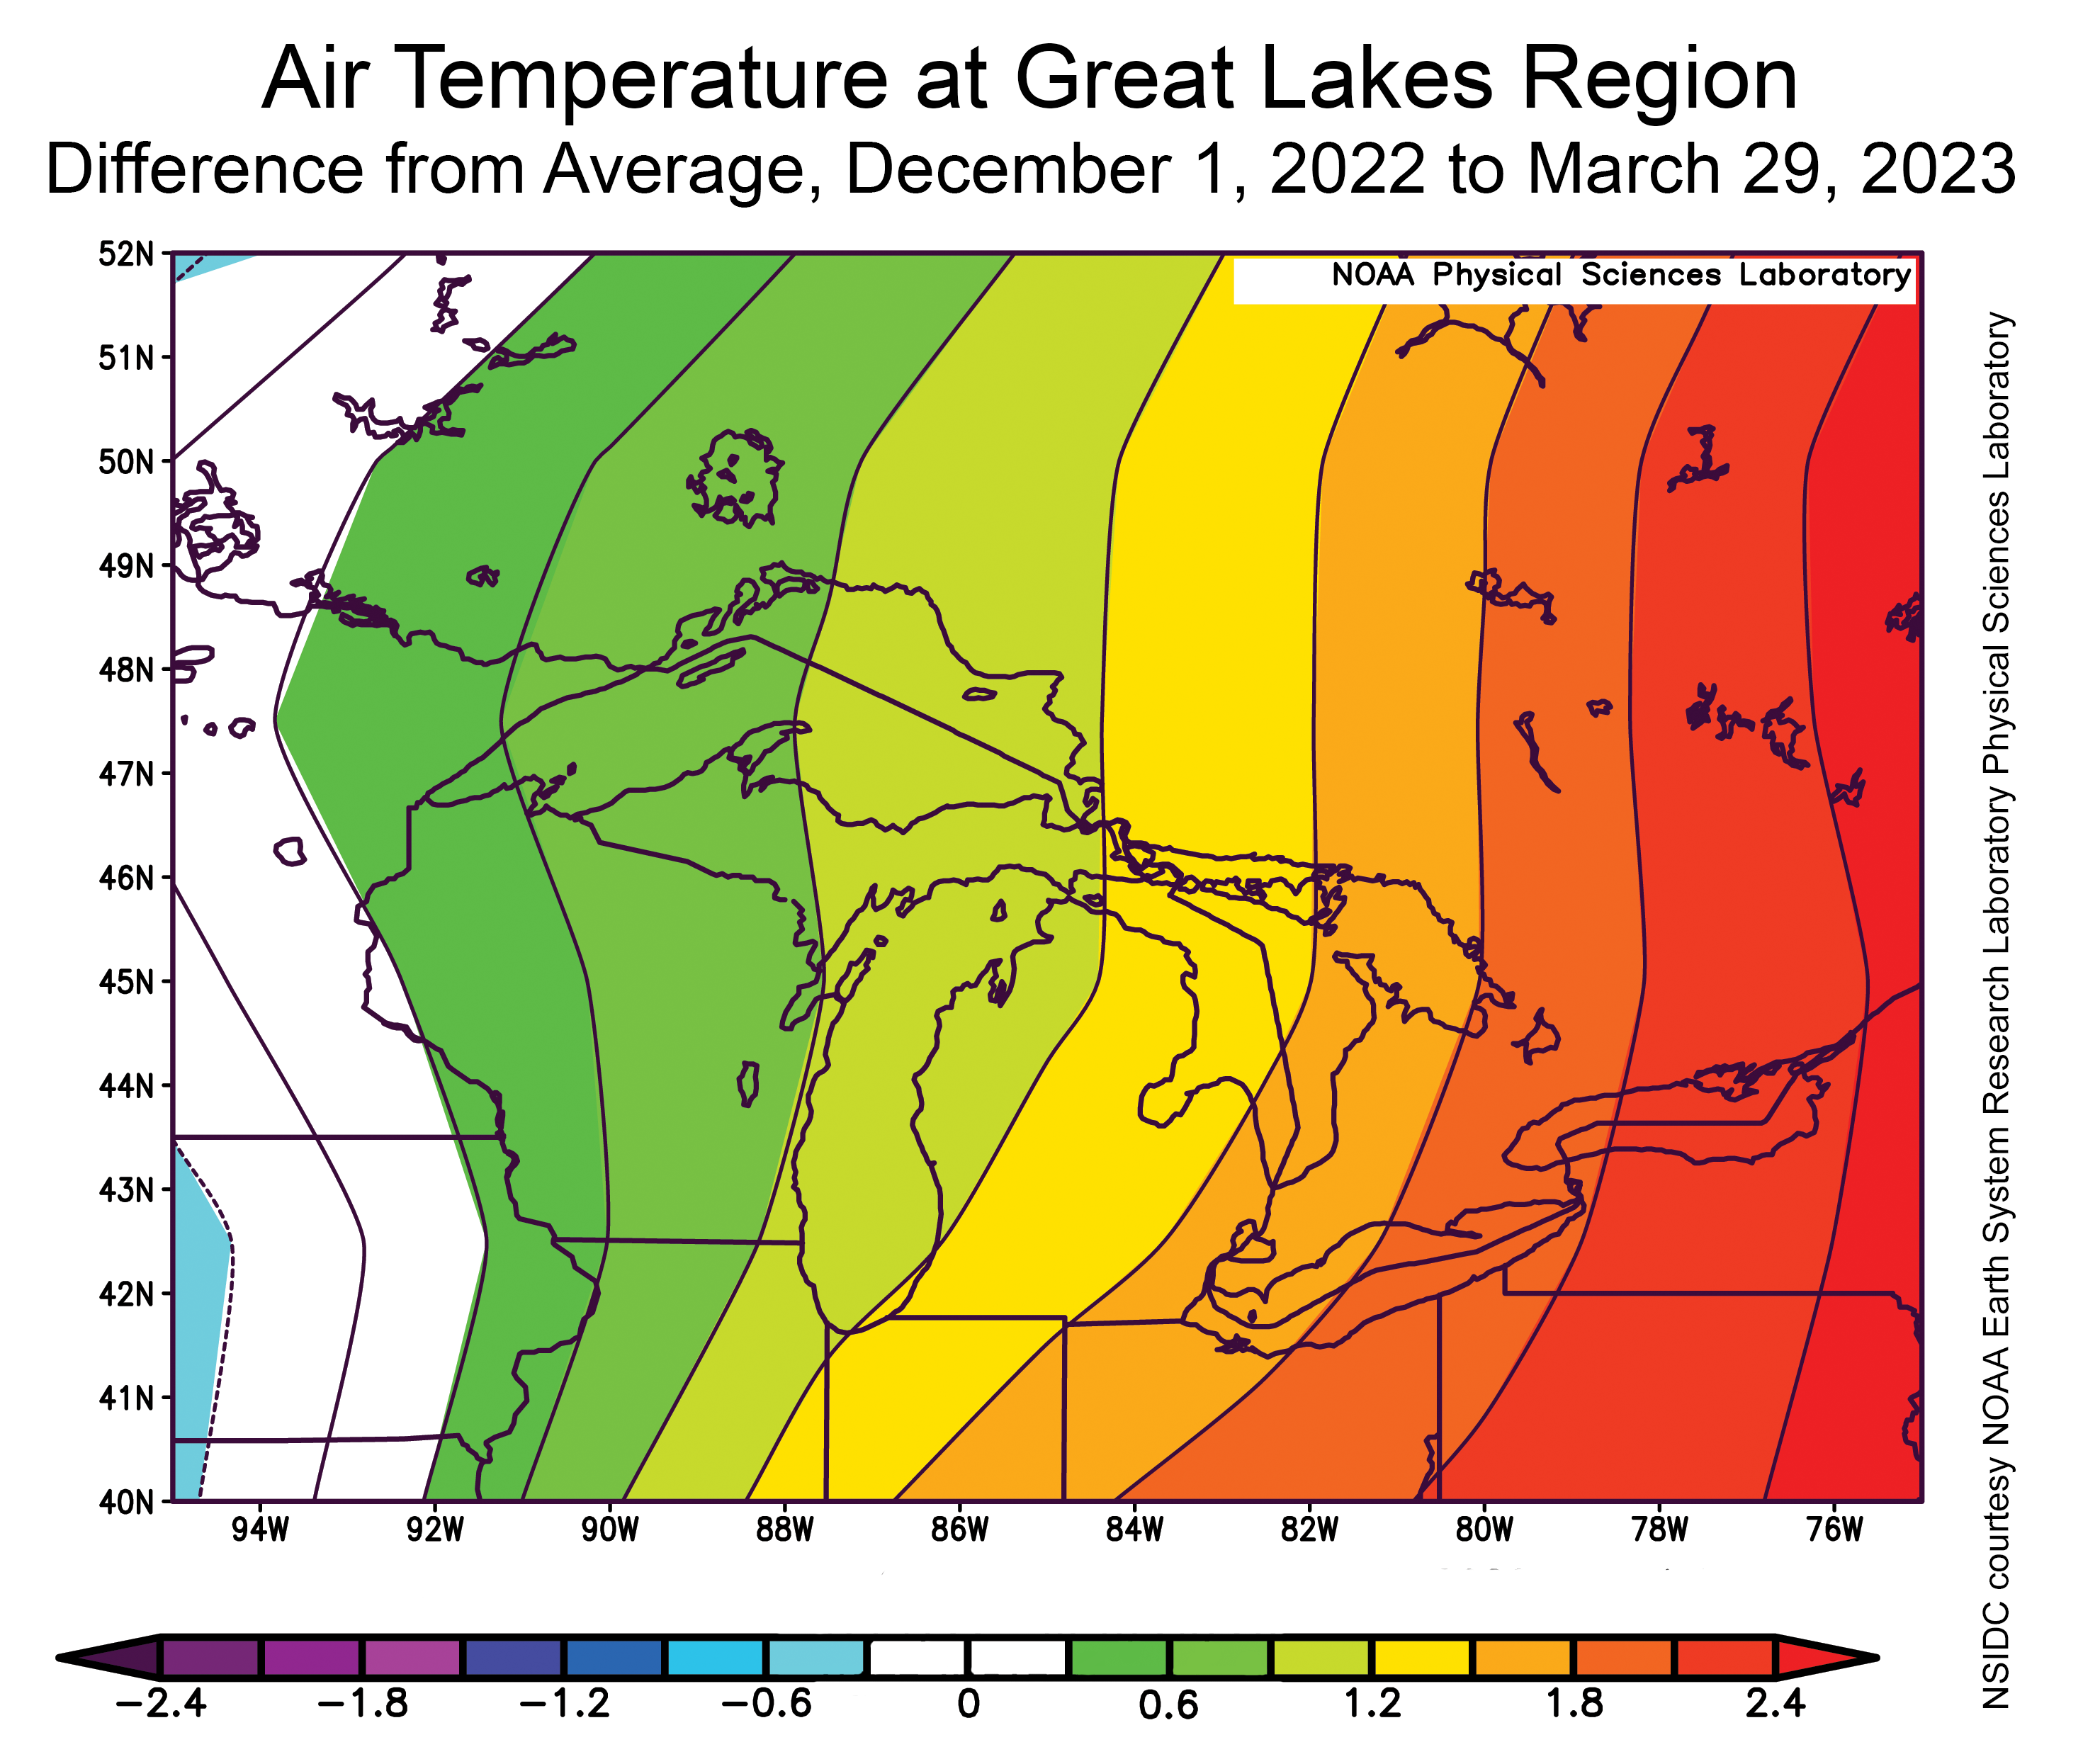
Figure 7b. This plot shows the departure from average air temperature in the Great Lakes Region at the 925 hPa level, in degrees Celsius, from December 1, 2022, to March 29, 2023, relative to the 1991 to 2020 average. Yellows and reds indicate higher than average temperatures; blues and purples indicate lower than average temperatures.
Credit: NSIDC courtesy NOAA Earth System Research Laboratory Physical Sciences Laboratory
High-resolution image
This year, the maximum ice cover area of the Great Lakes, as monitored by the US National Ice Center in Suitland Maryland, was 23.35 percent on February 4, 2023, and for much of the winter ice cover was below 10 percent (Figure 7a). Winter temperatures over the Great Lakes ranged from 0.5 degrees Celsius (1 degree Fahrenheit) above the 1991 to 2020 average over Lake Superior to more than 2 degrees Celsius (4 degrees Fahrenheit) above average over Lake Ontario (Figure 7b).
Although the year-to-year variability in Great Lakes ice cover is high, an analysis led by Jia Wang, an ice climatologist at the National Oceanic and Atmospheric Administration (NOAA) Great Lakes Environmental Research Laboratory (GLERL), found that average winter ice cover on the Great Lakes has declined 69 percent between1973 and 2017, with the greatest losses in Lake Superior and Lake Ontario. However, nearly complete ice cover was seen as recently as 2019. Historically, widespread ice cover over Lake Michigan and Lake Erie (and many other areas) supported ice harvesting for refrigeration.
In memoriam: Josh King
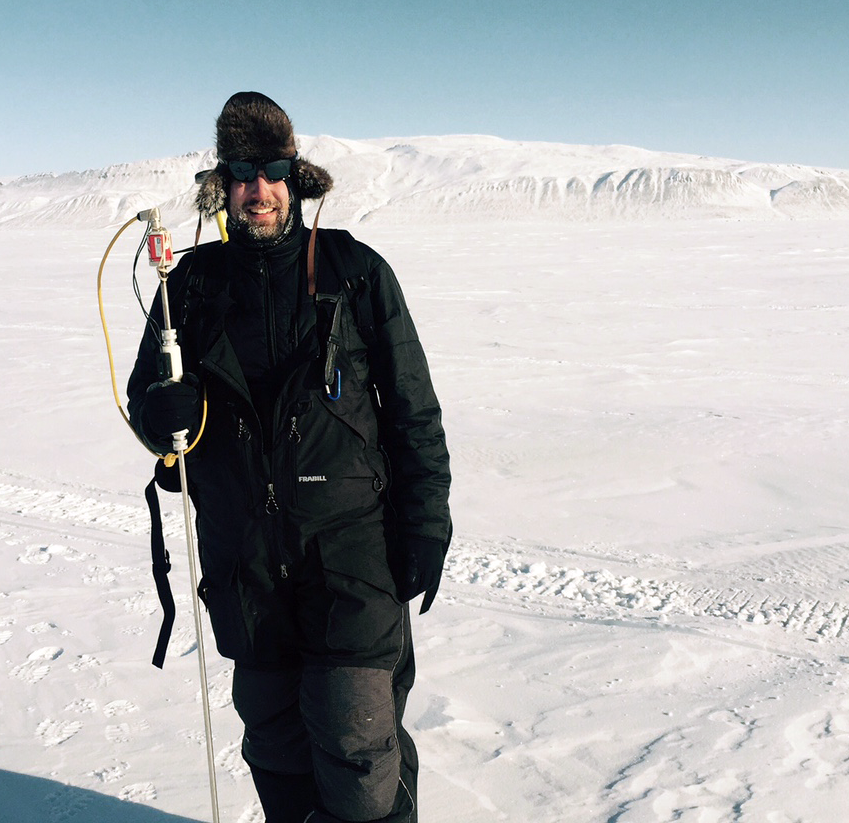
Figure 8. This photograph is a portrait of Josh King.
Credit: Steve Howell, Environment and Climate Change Canada
High-resolution image
It is with great sadness that another colleague of ours recently passed away. Josh King was a dedicated snow field scientist who collected invaluable snow observations throughout the Arctic region during his career. In 2017, NSIDC scientist Julienne Stroeve and others worked with King to collect snow and ice data in the Lincoln Sea, the region of the Arctic known as the Last Ice Area. Stroeve remembers how professional King was in leading the data collection efforts, keeping the team motivated while working tirelessly after returning back to base each night to keep instruments operational and quality control the data collected. It is a great loss for the scientific community to lose a colleague at such a young age.
References
Holling, H. C. 1941. Paddle-to-the-Sea. Boston, Houghton Mifflin
Lee, S. K., R. Lumpkin, F. Gomez, S. Yeager, H. Lopez, F. Takglis, S. Dong, W. Aguiar, D. Kim, and M. Baringer. 2023. Human-induced changes in the global meridional overturning circulation are emerging from the Southern Ocean. Nature Communications Earth and Environment 4, 69, doi:10.1038/s43247-023-00727-3.
National Oceanic and Atmospheric Administration (NOAA) Great Lakes Environmental Research Laboratory (GLERL) Annual Max Ice Cover Animation
Sumata, H., de Steur, L., Divine, D.V. et al. 2023. Regime shift in Arctic Ocean sea ice thickness. Nature 615, 443–449, doi:10.1038/s41586-022-05686-x.
Tschudi, M., W. N. Meier, J. S. Stewart, C. Fowler, and J. Maslanik. 2019a. EASE-Grid Sea Ice Age, Version 4 [Data Set]. Boulder, Colorado USA. NASA National Snow and Ice Data Center Distributed Active Archive Center, doi:10.5067/UTAV7490FEPB. Date Accessed 03-31-2023.
Tschudi, M., W. N. Meier, and J. S. Stewart. 2019. Quicklook Arctic Weekly EASE-Grid Sea Ice Age, Version 1 [Data Set]. Boulder, Colorado USA. NASA National Snow and Ice Data Center Distributed Active Archive Center, doi:10.5067/2XXGZY3DUGNQ. Date Accessed 03-31-2023.
Wang, J., J. Kessler, F. Hang, H. Hu, A. Clites, and P. Chu. 2017. Great Lakes ice climatology update of winters 2012-2017: Seasonal cycle, interannual variability, decadal variability, and trend for the period 1973-2017. NOAA Technical Memorandum GLERL-170.

