The Defense Meteorological Satellite Program (DMSP) F18 satellite will be undergoing testing from June 25 to 29 and from July 9 to 12. During this time, data from the Special Sensor Microwave Imager/Sounder (SSMIS) sensor on F18 may have degraded quality or may not be collected. DMSP F18 is the primary sensor that provides NSIDC with near-real-time data for sea ice monitoring (nsidc-0081, the Sea Ice Index, and the Arctic Sea Ice News and Analysis web page). If the data quality does not meet operational standards, NSIDC will remove the resulting sea ice fields or NSIDC may not distribute data from the F18 SSMIS during the test periods.
Yearly Archives: 2018
Springtime for the Arctic
Arctic sea ice extent for May 2018 was the second lowest in the satellite record. Above average temperatures and high sea level pressure prevailed over most of the Arctic Ocean, while some surrounding continental regions were colder than usual.
Overview of conditions
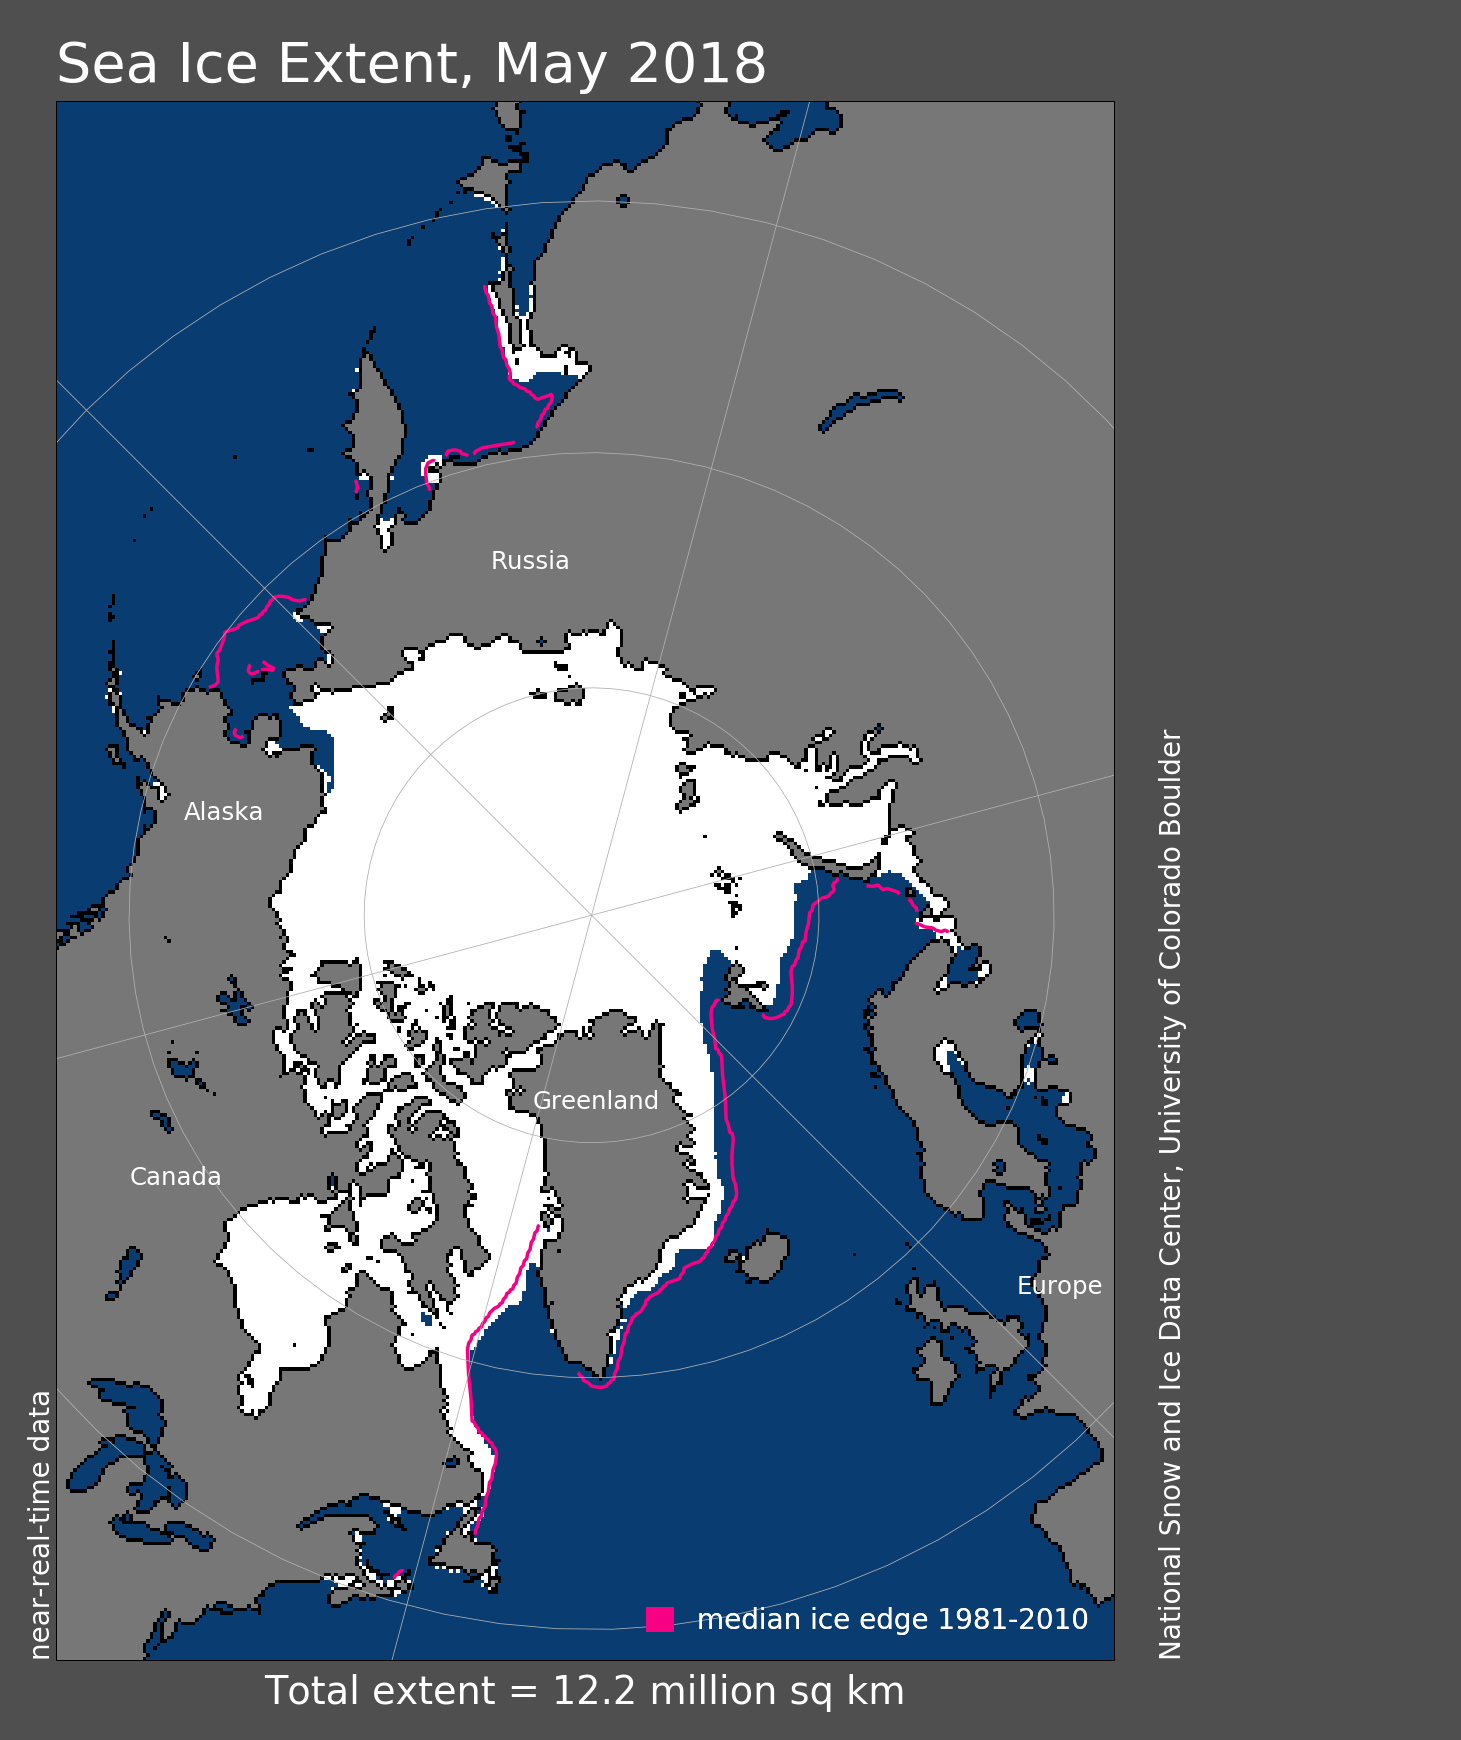
Figure 1. Arctic sea ice extent for May 2018 was 12.2 million square kilometers (4.7 million square miles). The magenta line shows the 1981 to 2010 average extent for that month. Sea Ice Index data. About the data
Credit: National Snow and Ice Data Center
High-resolution image
Arctic sea ice extent for May 2018 was 12.2 million square kilometers (4.7 million square miles). This was the second lowest May extent in the 39-year satellite record, and is 310,000 square kilometers (120,000 square miles) above May 2016, the record low for the month. Compared to May 2016, the ice cover remained slightly more extensive in the Barents and Kara Seas, within Baffin Bay, Davis Strait, and the southern Beaufort Sea, but less extensive in the Chukchi and East Greenland Seas.
In Svalbard, the average temperature for May 2018 was 6 degrees Celsius (11 degrees Fahrenheit) above average. By the end of the month, the north and west coasts of Svalbard were largely ice-free and a tongue of open water east of the islands extended northeast to Franz Joseph Land. According to NSIDC data, open water stretched as far north as ~82 degrees N at the end of May.
In the Chukchi Sea, open water developed to the west of Point Barrow, Alaska throughout the month. This may be in part a result of the inflow of warm waters from the Pacific, where sea surface temperatures were higher than average. It may also be due to the general lack of sea ice in the region that allows the ocean to readily absorb the sun’s energy. Ice retreat was also substantial within the Sea of Okhotsk, and little ice remains in the region. Hudson Bay began to open up, with a significant area of open water in the northwest sector of the bay.
Conditions in context
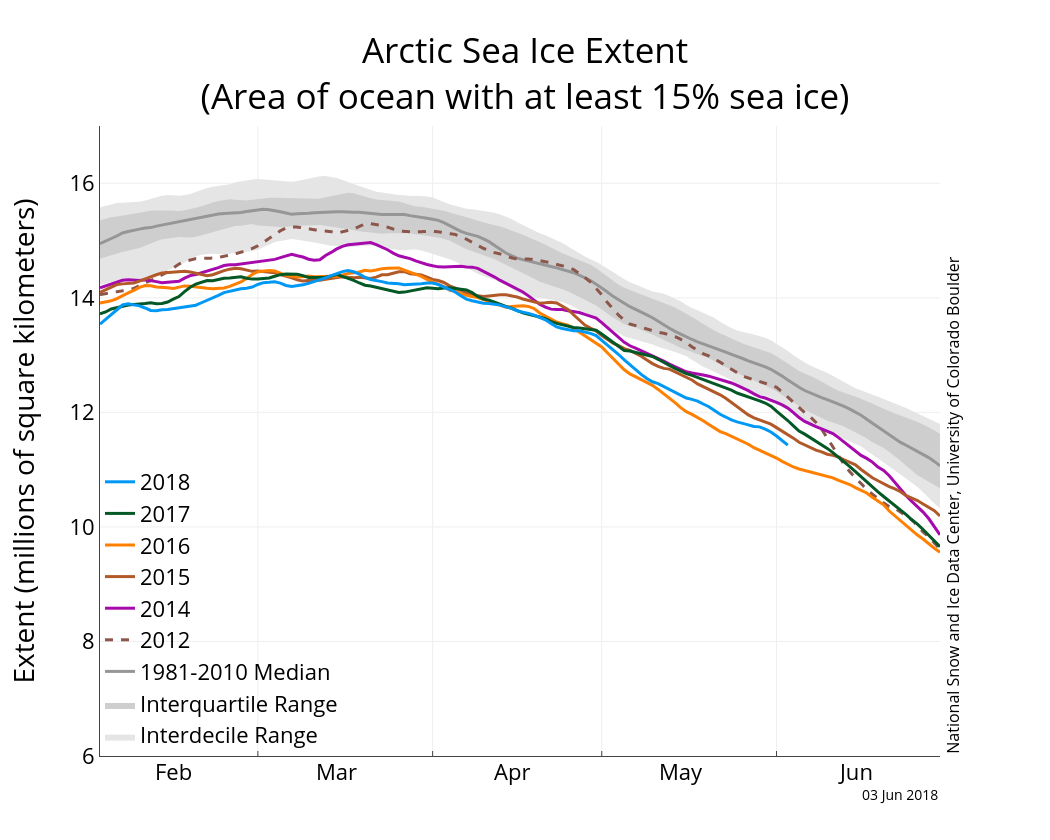
Figure 2a. The graph above shows Arctic sea ice extent as of June 3, 2018, along with daily ice extent data for four previous years and 2012, the year with record low minimum extent. 2018 is shown in blue, 2017 in green, 2016 in orange, 2015 in brown, 2014 in purple, and 2012 in dotted brown. The 1981 to 2010 median is in dark gray. The gray areas around the median line show the interquartile and interdecile ranges of the data. Sea Ice Index data.
Credit: National Snow and Ice Data Center
High-resolution image

Figure 2b. This plot shows departure from average sea level pressure in the Arctic, in millibars, for May 2018. Yellows and reds indicate higher than average sea level pressure; blues and purples indicate lower than average sea level pressure.
Credit: NSIDC courtesy NOAA Earth System Research Laboratory Physical Sciences Division
High-resolution image
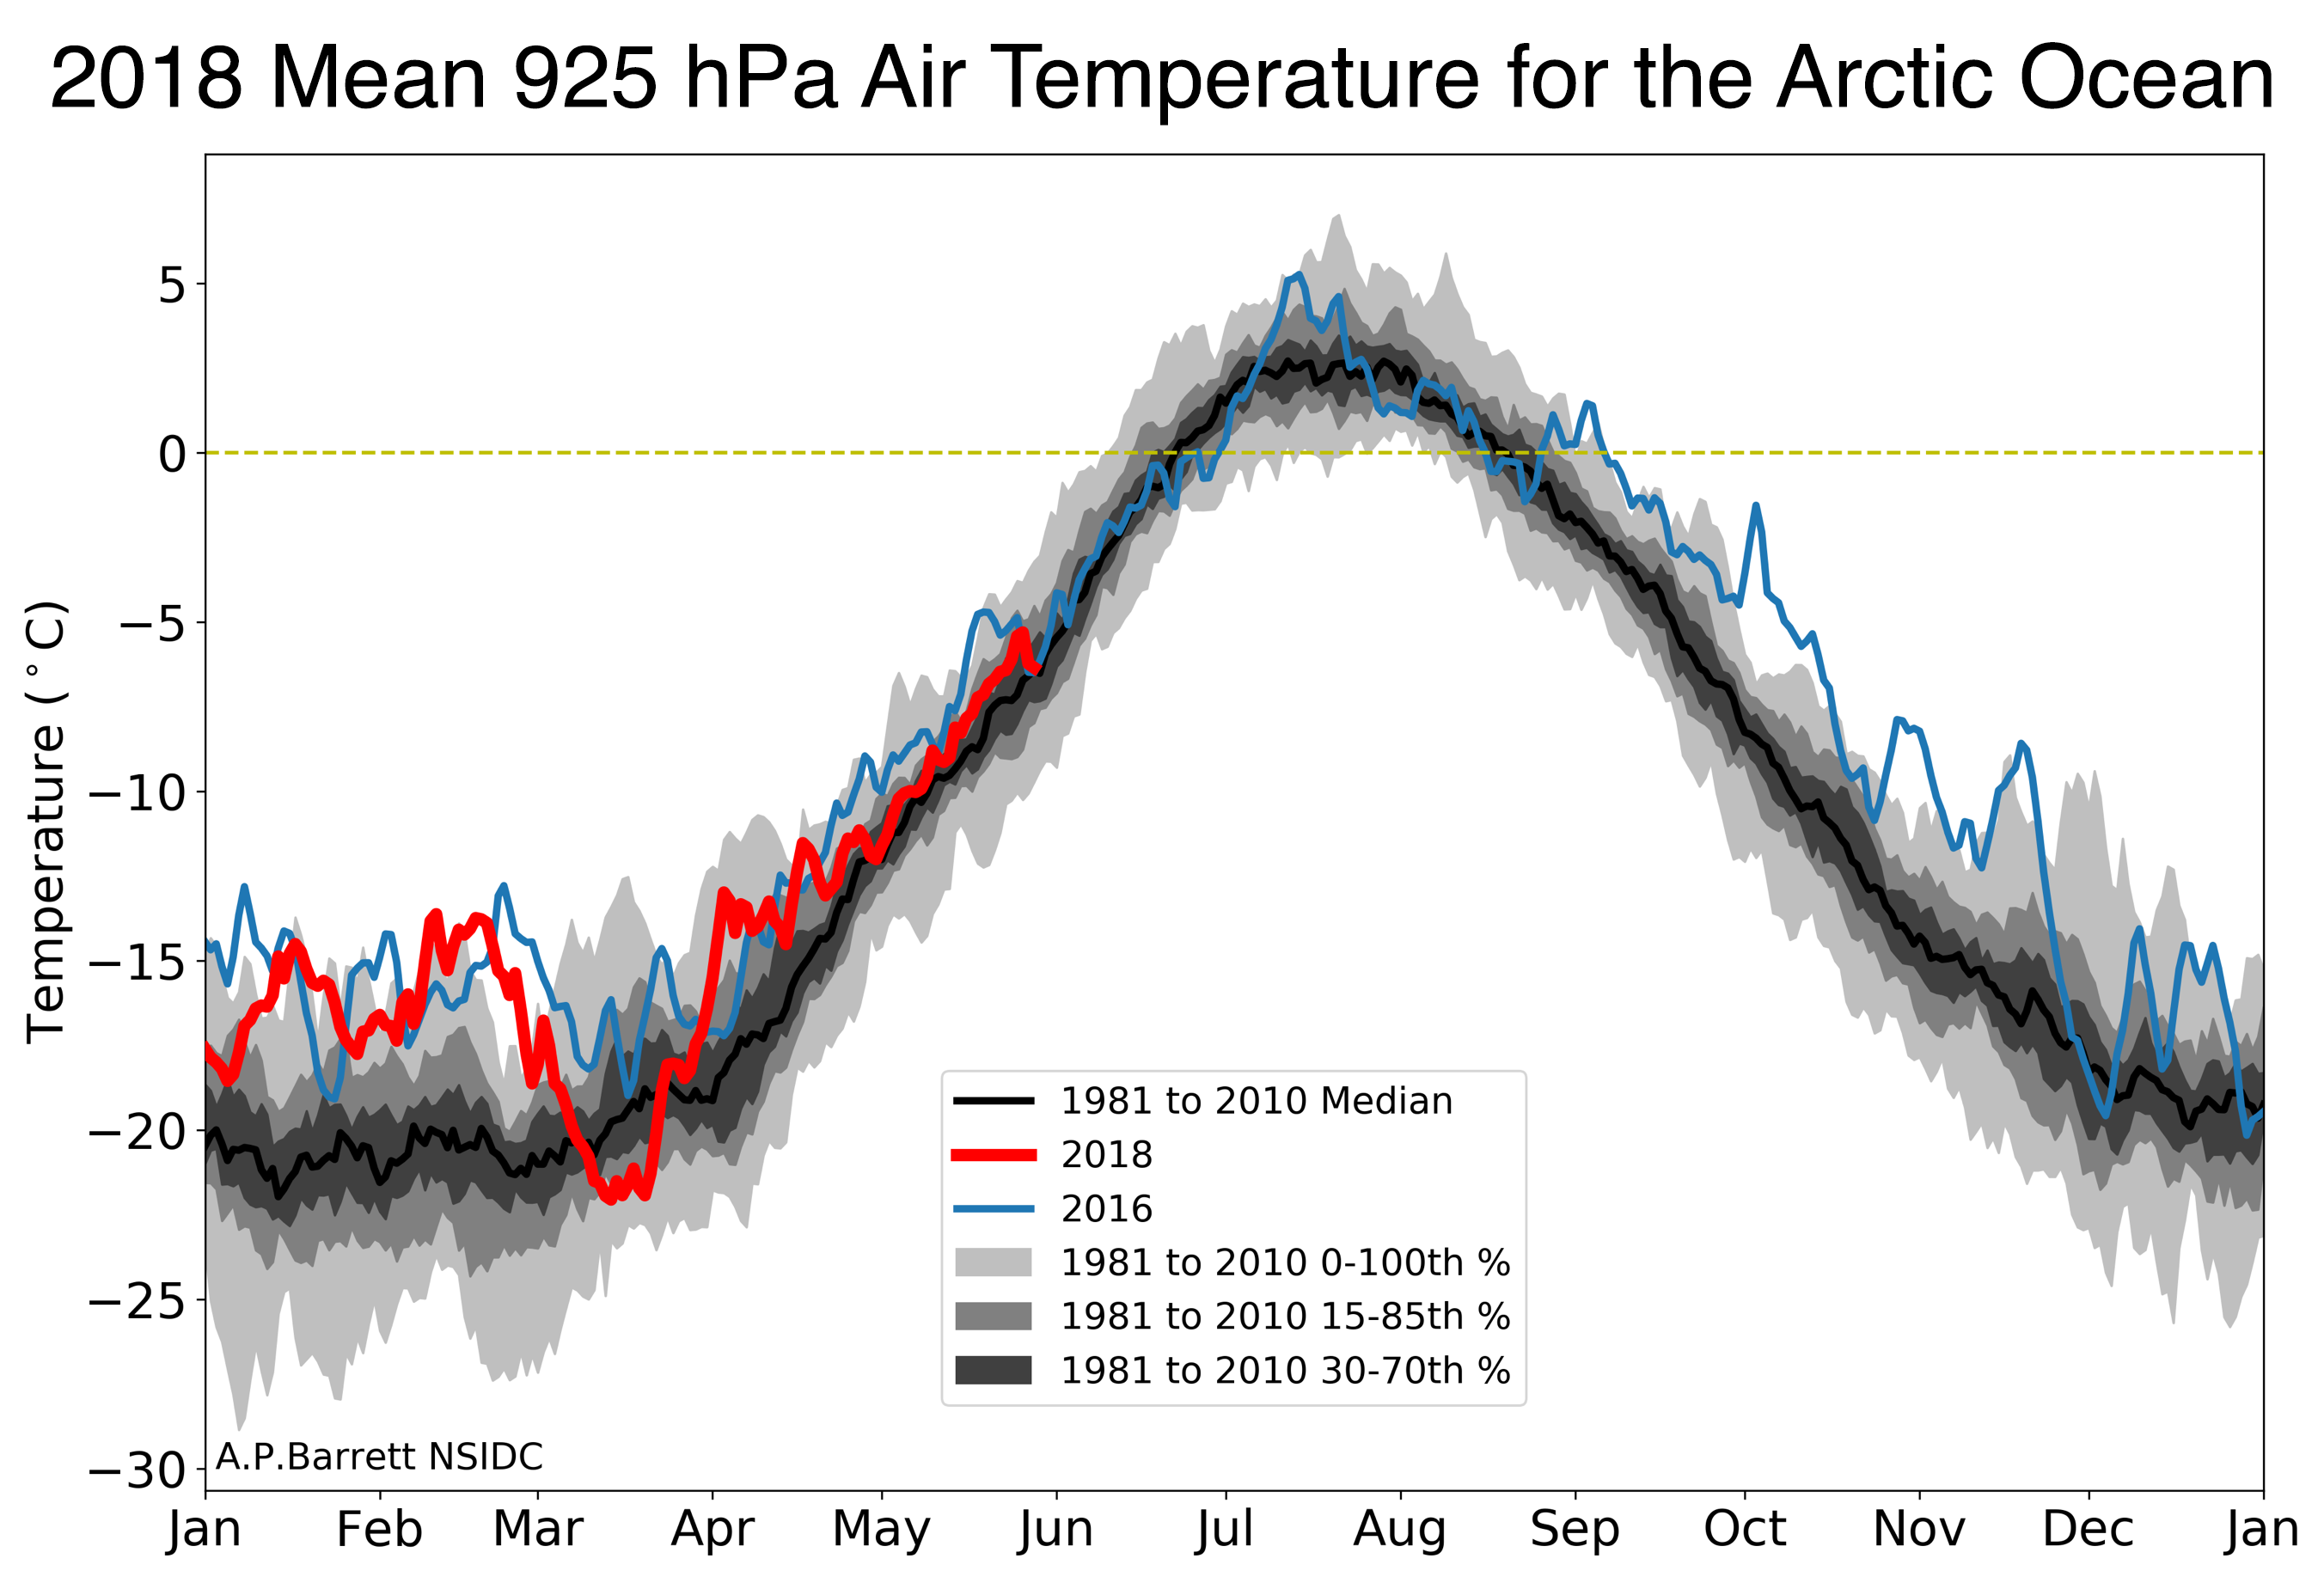
Figure 2c. This plot shows air temperatures at the 925 mb level averaged over the Arctic Ocean region. This region covers only ocean areas in the Arctic, bounded by the Bering Strait on the Pacific side, and Fram Strait and roughly the 20 degree E meridian between Svalbard and Norway.
Credit: A. P. Barrett, NSIDC
High-resolution image
The atmospheric pattern (Figure 2b) for May was characterized by a region of above average sea level pressure centered over the Fenno-Scandinavian Peninsula and below average pressure centered over Greenland. This pattern helped to funnel warm winds from the south into the Barents Sea sector favoring retreat of ice. Air temperatures at the 925 hPa level (about 2,500 feet above sea level) in the Barents Sea were up to 5 degrees Celsius (9 degrees Fahrenheit) above average (not shown). On the Pacific side, departures from average sea level pressure were small and a fairly typical Beaufort Sea High and Aleutian Low pattern reigned for much of the month. Overall it was warm across the Arctic Ocean with temperatures at the 925 hPa level ranging between 2 to 5 degrees Celsius (4 to 9 degrees Fahrenheit) above average for the month. By contrast, conditions over land regions surrounding the Arctic were relatively cool. Parts of Central Siberia and Nunavut in northern Quebec saw temperatures more than 5 degrees Celsius (9 degrees Fahrenheit) below average. However, Europe, eastern Asia and western North America were warmer than usual.
Air temperatures at the 925 mb level (about 2,500 feet above sea level) over the Arctic Ocean have been above average through most this year (Figure 2c). Temperatures were extremely high compared to typical conditions from January through early March. After a brief cold period in March, temperatures returned to near average and increased at typical rates through most of May.
While it is still relatively early in the melt season, images from the Moderate Resolution Imaging Spectroradiometer (MODIS) show considerable fracturing of multiyear ice floes in the Beaufort Sea. The early development of open water around these large ice floes can help accelerate melt through absorption of solar energy. Some of these ice floes appear already partially covered by melt ponds.
May 2018 compared to previous years
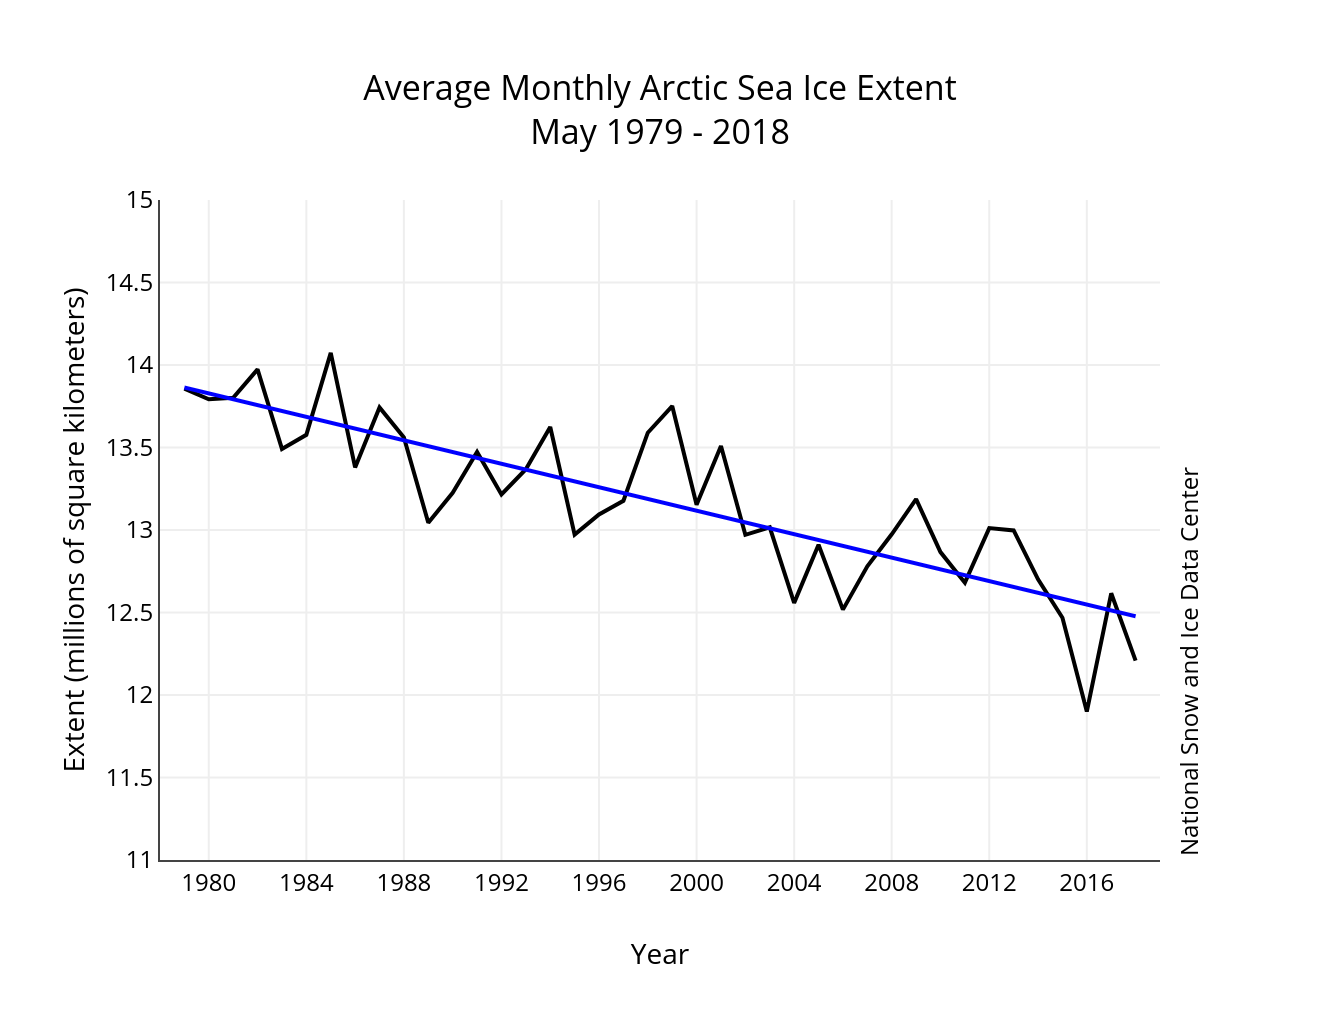
Figure 3. Monthly May ice extent for 1979 to 2018 shows a decline of 2.6 percent per decade.
Credit: National Snow and Ice Data Center
High-resolution image
The linear rate of decline for May sea ice extent is 36,000 square kilometers (14,000 square miles) per year, or 2.6 percent per decade relative to the 1981 to 2010 average. Ice loss during the month was 1.7 million square kilometers (656,000 square miles), which was faster than the 1981 to 2010 average loss of 1.5 million square kilometers (579,000 square miles) for the month.
Another season for the Sea Ice Outlook
The Sea Ice Prediction Network is once again soliciting contributions to the Sea Ice Outlook predicting the September 2018 sea ice extent. This effort is coordinated by the Arctic Research Consortium of the United States (ARCUS). This is the second phase of the Sea Ice Prediction Network, and is currently funded by the National Science Foundation, the Office of Naval Research, and the United Kingdom’s National Environment Research Council. While all prediction methods are welcome, a new focus of the project is to assess the economic value of seasonal ice forecasts. To make the forecasts more useful to stakeholders, there is an increased emphasis on predicting the spatial pattern of the ice cover for September, not just the total extent. The Sea Ice Outlook will summarize contributions and assess the seasonal evolution of conditions each month through summer and in post-season reports at https://www.arcus.org/sipn.
Autumn in Antarctica
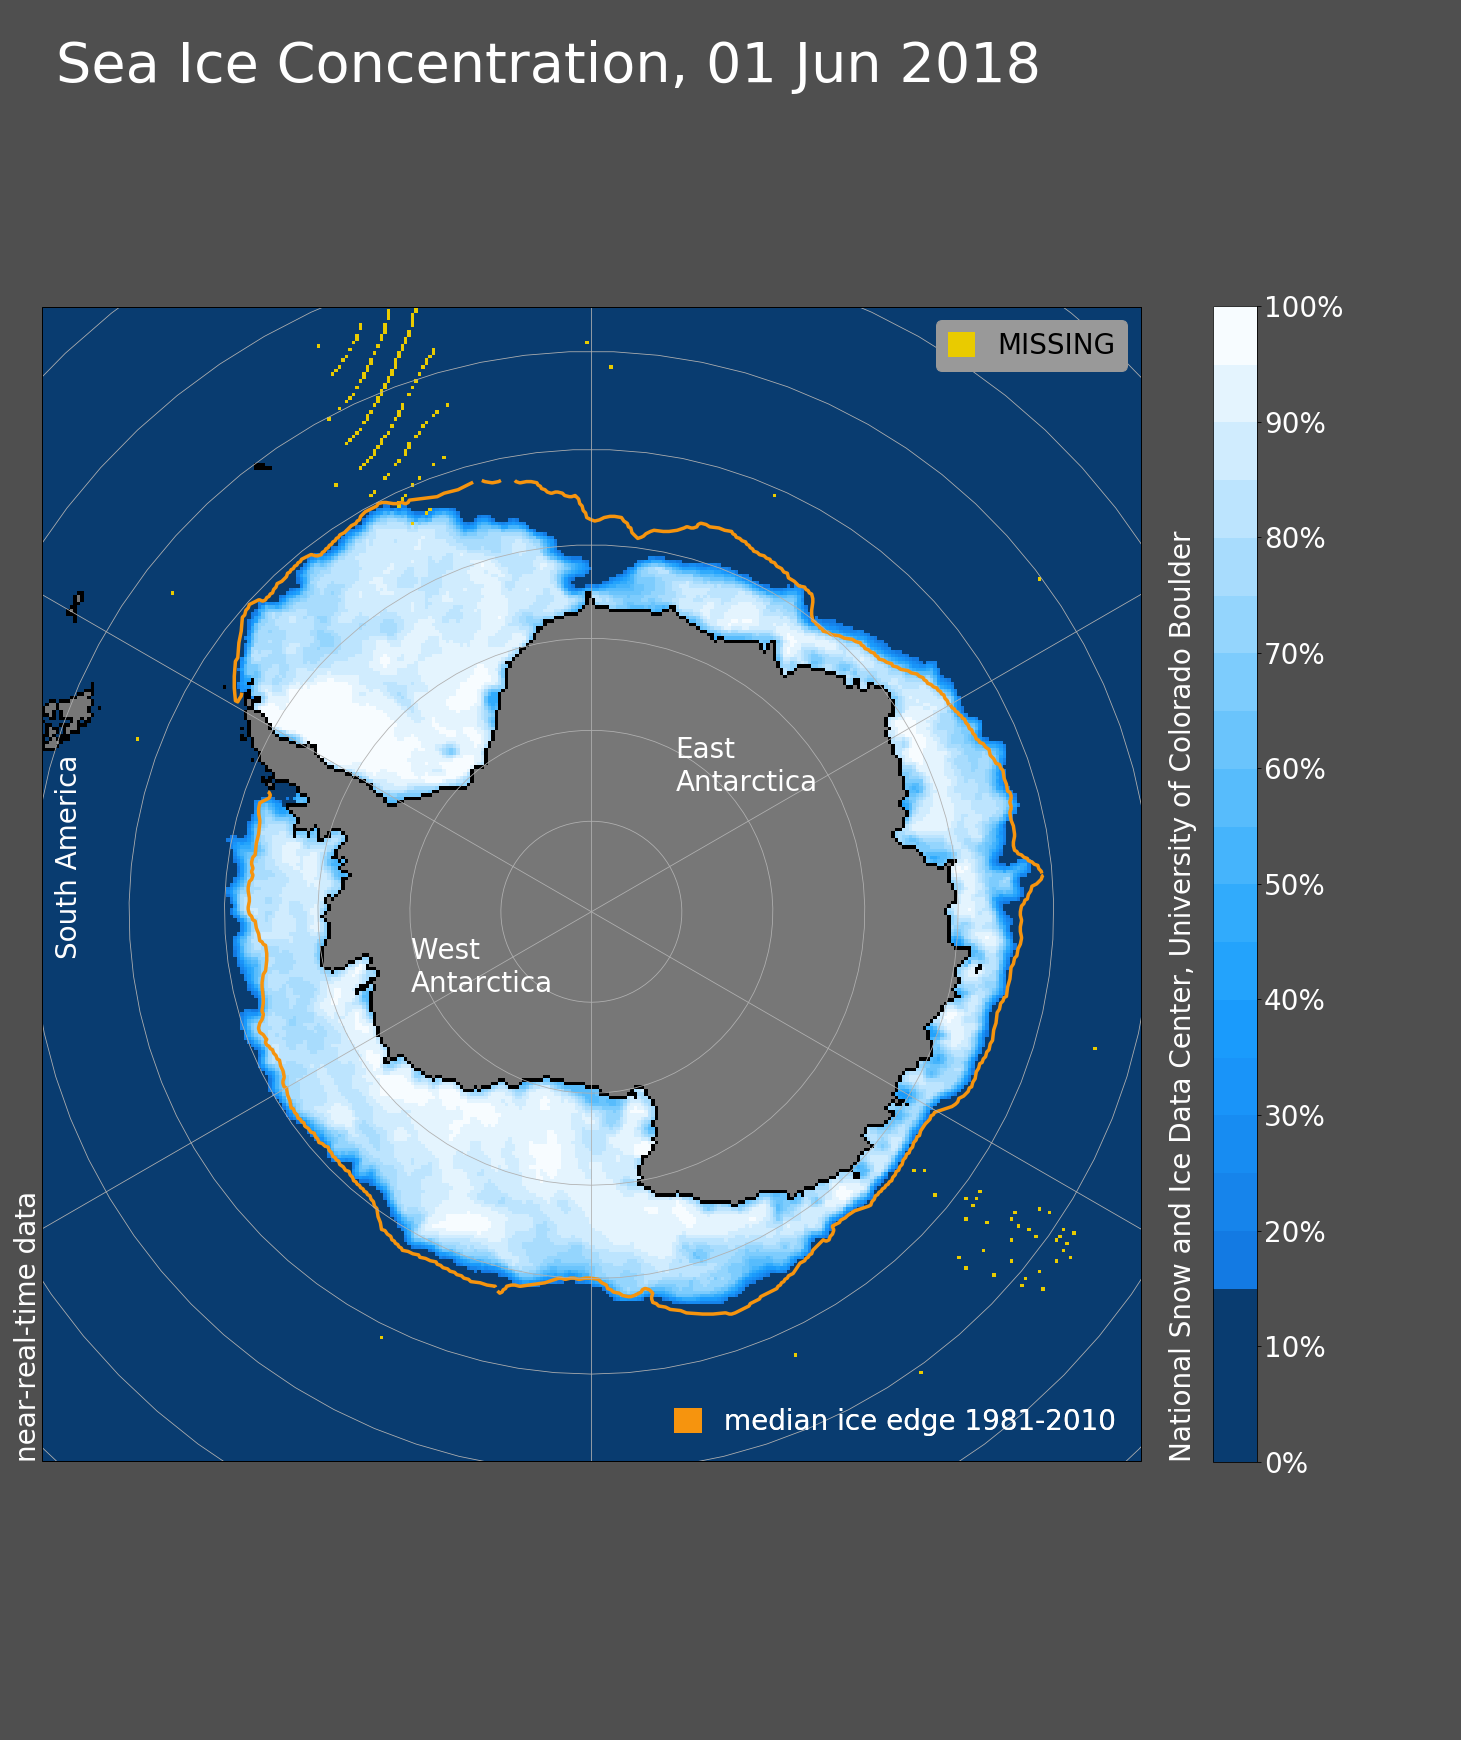
Figure 4a. Arctic sea ice extent for June 1, 2018 was 11.0 million square kilometers (4.2 million square miles). The orange line shows the 1981 to 2010 average extent for that day. Sea Ice Index data. About the data
Credit: National Snow and Ice Data Center
High-resolution image
Sea ice extent in the Southern Ocean grew steadily in May at the rate of 123,000 square kilometers (47,000 square miles) per day, somewhat faster than the 1981 to 2010 average growth rate of 108,000 square kilometers (42,000 square miles) per day. This pushed Antarctic ice extent from third lowest at the start of the month to sixth lowest by June 1. Ice extent was near average for all regions except for a broad section of the far eastern Weddell Sea, where ice extent was less than the 1981 to 2010 average. The eastern Ross, Amundsen, and Bellingshausen Seas began the month with less ice cover than average, but rapid growth in these regions brought ice extent to near average by the end of the month.
Reference
Nilsen, T. “Warmest May ever on Arctic Islands,” The Barents Observer, June 3, 2018, 11:00 a.m., MST, https://thebarentsobserver.com/en/ecology/2018/06/warmest-may-ever-arctic-islands.
Arctic winter warms up to a low summer ice season
Sea ice extent in the Bering Sea remains at record low levels for this time of year. Total ice extent over the Arctic Ocean also remains low.
Overview of conditions

Figure 1. Arctic sea ice extent for April 2018 was 13.71 million square kilometers (5.29 million square miles). The magenta line shows the 1981 to 2010 average extent for the month. Sea Ice Index data. About the data
Credit: National Snow and Ice Data Center
High-resolution image
Arctic sea ice extent for April 2018 averaged 13.71 million square kilometers (5.29 million square miles). This was 980,000 square kilometers (378,400 square miles) below the 1981 to 2010 average and only 20,000 square kilometers (7,700 square miles) above the record low April extent set in 2016. Given the uncertainty in measurements, NSIDC considers 2016 and 2018 as tying for lowest April sea ice extent on record. As seen throughout the 2017 to 2018 winter, extent remained below average in the Bering Sea and Barents Sea. While retreat was especially pronounced in the Sea of Okhotsk during the month of April, the ice edge was only slightly further north than is typical at this time of year. Sea ice extent in the Bering Sea remains the lowest recorded since at least 1979. The lack of sea ice within this region created many coastal hazards this past winter.
Conditions in context
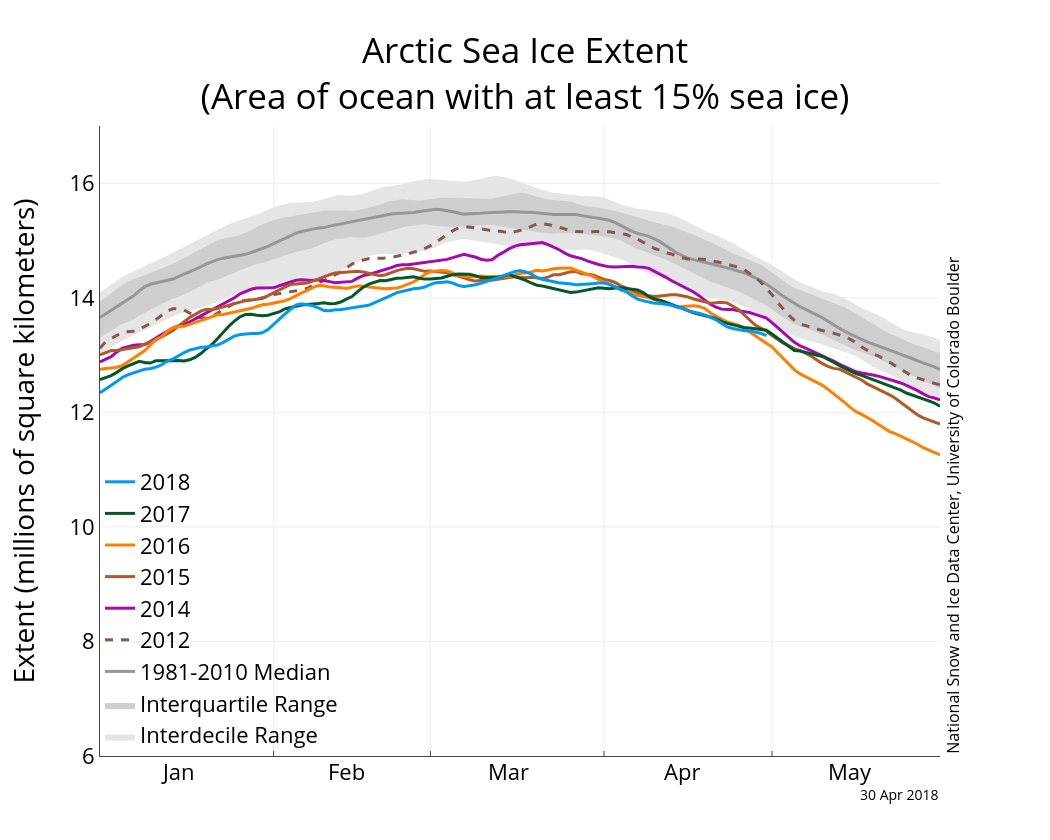
Figure 2. The graph above shows Arctic sea ice extent as of April 30, 2018, along with daily ice extent data for four previous years and 2012, the year with record low minimum extent. 2018 is shown in blue, 2017 in green, 2016 in orange, 2015 in brown, 2014 in purple, and 2012 in dotted brown. The 1981 to 2010 median is in dark gray. The gray areas around the median line show the interquartile and interdecile ranges of the data. Sea Ice Index data.
Credit: National Snow and Ice Data Center
High-resolution image
Overall, sea ice extent for April 2018 declined by 920,000 square kilometers (355,000 square miles). The amount of ice lost for the month was less than the 1981 to 2010 average of 1.1 million square kilometers (424,700 square miles). The ice edge retreated everywhere except in Hudson Bay and Baffin Bay/Davis Strait. The sea ice expanded slightly within Davis Strait during the month. Sea ice in the Hudson Bay usually does not begin to retreat until the end of May.
Air temperatures at 925 hPa (about 2,500 feet above sea level) for April were up to 10 degrees Celsius (18 degrees Fahrenheit) higher than average in the East Siberian Sea and stretching towards the pole. Air temperatures were also up to 5 degrees Celsius (9 degrees Fahrenheit) above average within the East Greenland Sea and 3 degrees Celsius (5 degrees Fahrenheit) above average over Baffin Bay. By contrast, air temperatures were near average within the Barents and Kara seas and lower than average over Canada and the Hudson Bay. The pattern of temperature departures from average resulted from higher than average sea level pressure over the Beaufort Sea as well as the North Atlantic, combined with below average sea level pressure over Eurasia and western Greenland through eastern Canada. On the Pacific side of the Arctic, this pressure pattern drove warm air from the south over the East Siberian and Chukchi Seas, while bringing cold air into northern Canada. The pattern of above average sea level pressure over the North Atlantic was combined with lower than average sea level pressure over western Greenland and the Canadian Archipelago, bringing in warm air in from the south over Greenland and Baffin Bay.
April 2018 compared to previous years

Figure 3. Monthly April ice extent for 1979 to 2018 shows a decline of 2.6 percent per decade.
Credit: National Snow and Ice Data Center
High-resolution image
The linear rate of decline for April sea ice extent is 37,500 square kilometers (14,500 square miles) per year, or 2.6 percent per decade relative to the 1981 to 2010 average.
Continued loss of the oldest sea ice, five-years or older
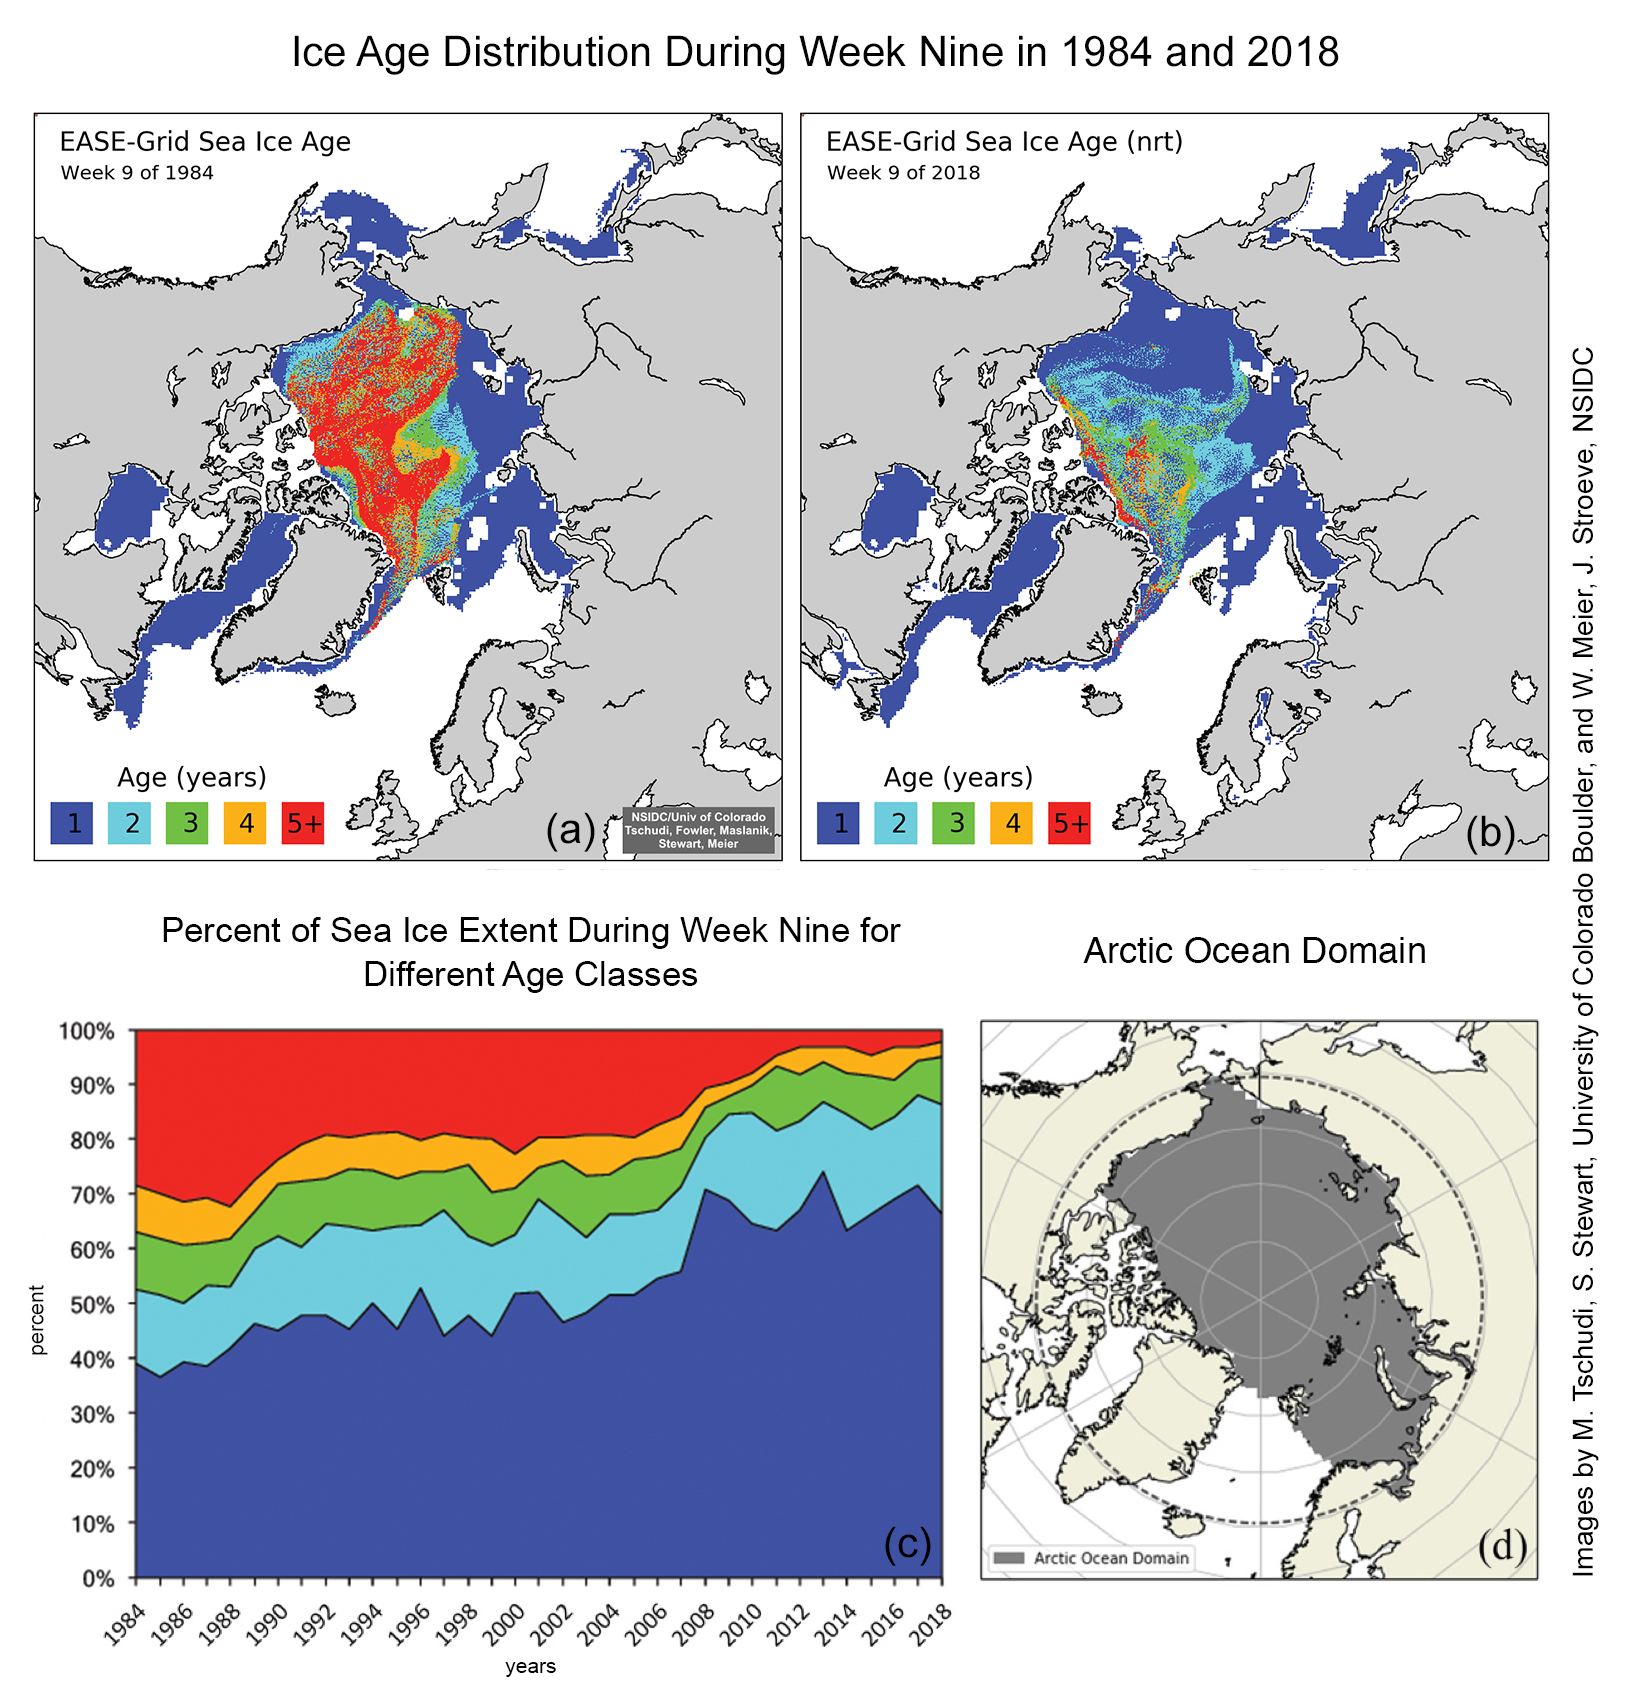
Figure 4a-d. These maps show the ice age distribution during week nine in 1984 (a) and 2018 (b). The time-series (c) shows total sea ice extent for different age classes as is outlined in the Arctic Ocean Domain (d).
Credit: Preliminary analysis courtesy M. Tschudi, University of Colorado Boulder. Images by M. Tschudi, S. Stewart, University of Colorado, Boulder, and W. Meier, J. Stroeve, NSIDC
High-resolution image
An updated assessment of ice age changes in the Arctic through week nine (early March) in 2018 shows a substantial amount of first-year ice within the Beaufort, Chukchi, East Siberian, Laptev, Kara and Barents Seas (Figure 4b). Multiyear ice near the Alaskan and Siberian coast is limited to scattered regions off shore in the Beaufort and Chukchi Seas. A tongue of second- and third-year ice extends from near the pole toward the New Siberian Islands, and a region of second-year ice extends toward Severnaya Zemlya. As averaged over the Arctic Ocean domain (Figure 4d), the multiyear ice cover has declined from 61 percent in 1984 to 34 percent in 2018. In addition, only 2 percent of the ice age cover is categorized as five-plus years, the least amount recorded during the winter period. While the proportion of first-year versus multiyear ice will largely depend on how much ice melted during summer, how much ice is exported out of Fram Strait each winter also plays a role. First-year ice grows to about 1.5 to 2 meters (5 to 6.5 feet) thick over a winter season, while older ice is often 3 to 4 meters (9.8 to 13.1 feet) thick.
Note: The ice age fields originally posted on Thursday, May 3, were incorrect. The ice age field has its “birthday” each September after the minimum, when all of the age values are incremented by one after the end of the summer melt season. For example, first-year ice becomes second-year ice after the minimum, second-year ice becomes third-year ice, and so on. However, in the original post, the near-real-time age fields were not incremented after the 2017 minimum. The ice age fields are now corrected (as of Monday, May 7). However, as these are near-real-time data, minor adjustments may occur during final processing. Final numbers will be available in the next few months.
Is winter warming resulting in less winter ice growth?

Figure 5a. These maps show the cumulative number of freezing degree day anomalies from the Climate Forecast System version 2 (CFSv2).
Credit: A. Barrett, National Snow and Ice Data Center
High-resolution image
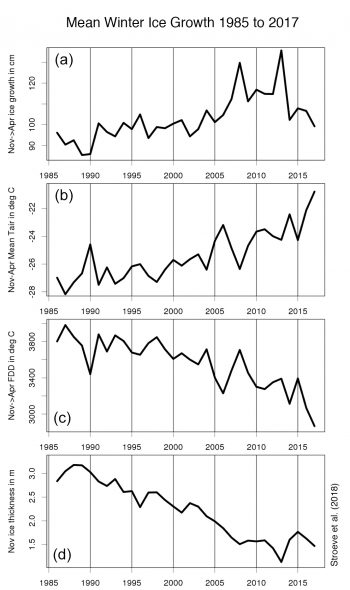
Figure 5b. This time-series (a) from 1985 to 2017 shows the mean winter ice growth (mid-November to mid-April) simulated by the Los Alamos sea ice model (CICE) forced by the National Center for Environmental Prediction (NCEP-2) atmospheric reanalysis. Also shown are the mean 2 meters NCEP-2 air temperature averaged over the Arctic Ocean (b), cumulative freezing degree days (FDDs) (c), and CICE-simulated November ice thickness (d).
See Stroeve et al. (2018) for more details.
High-resolution image
The last three winters have seen air temperatures at the North Pole surge above 0 degrees Celsius (32 degrees Fahrenheit). While heat transport associated with individual storms can result in high air temperatures persisting over several days, a more important metric in regard to how winter warming impacts the sea ice cover is the cumulative number of freezing degree days. This is defined as the number of days below freezing multiplied by the magnitude of the temperatures below the freezing point. Widespread reductions in the total number of freezing degree days (as compared to average) are apparent for the last three winters, being most pronounced this past winter (Figure 5a).
Previous studies evaluated how the low number of cumulative freezing degree days in the 2015 to 2016 winter over the Barents and Kara Seas impacted the ice thickness and sea ice extent in that region. A newer study looks at the effects of warm winters for a larger area. NSIDC scientist Julienne Stroeve found that in response to the warm winter of 2016 to 2017, ice growth over the Arctic Ocean was likely reduced by 13 centimeters (5 inches). Generally, one does not expect variations in winter air temperature to have a significant impact on winter ice growth—temperatures still generally remain well below freezing and the rate at which ice grows (thickens) is greater for thin ice than thick ice. Thus, despite an overall increase in winter air temperatures, thermodynamic ice growth over winter has generally increased in tandem with thinning at the end of summer (Figure 5b). However, since 2012, this relationship appears to be changing. Overall winter ice growth in the 2016 to 2017 winter was similar to that in 2003, despite having a mean November ice thickness well below that seen in 2003. A similar analysis is not yet available for the 2017 to 2018 winter, but given the very warm conditions, it is likely that thermodynamic ice growth was reduced compared to average.
Unusual polynya opening north of Greenland
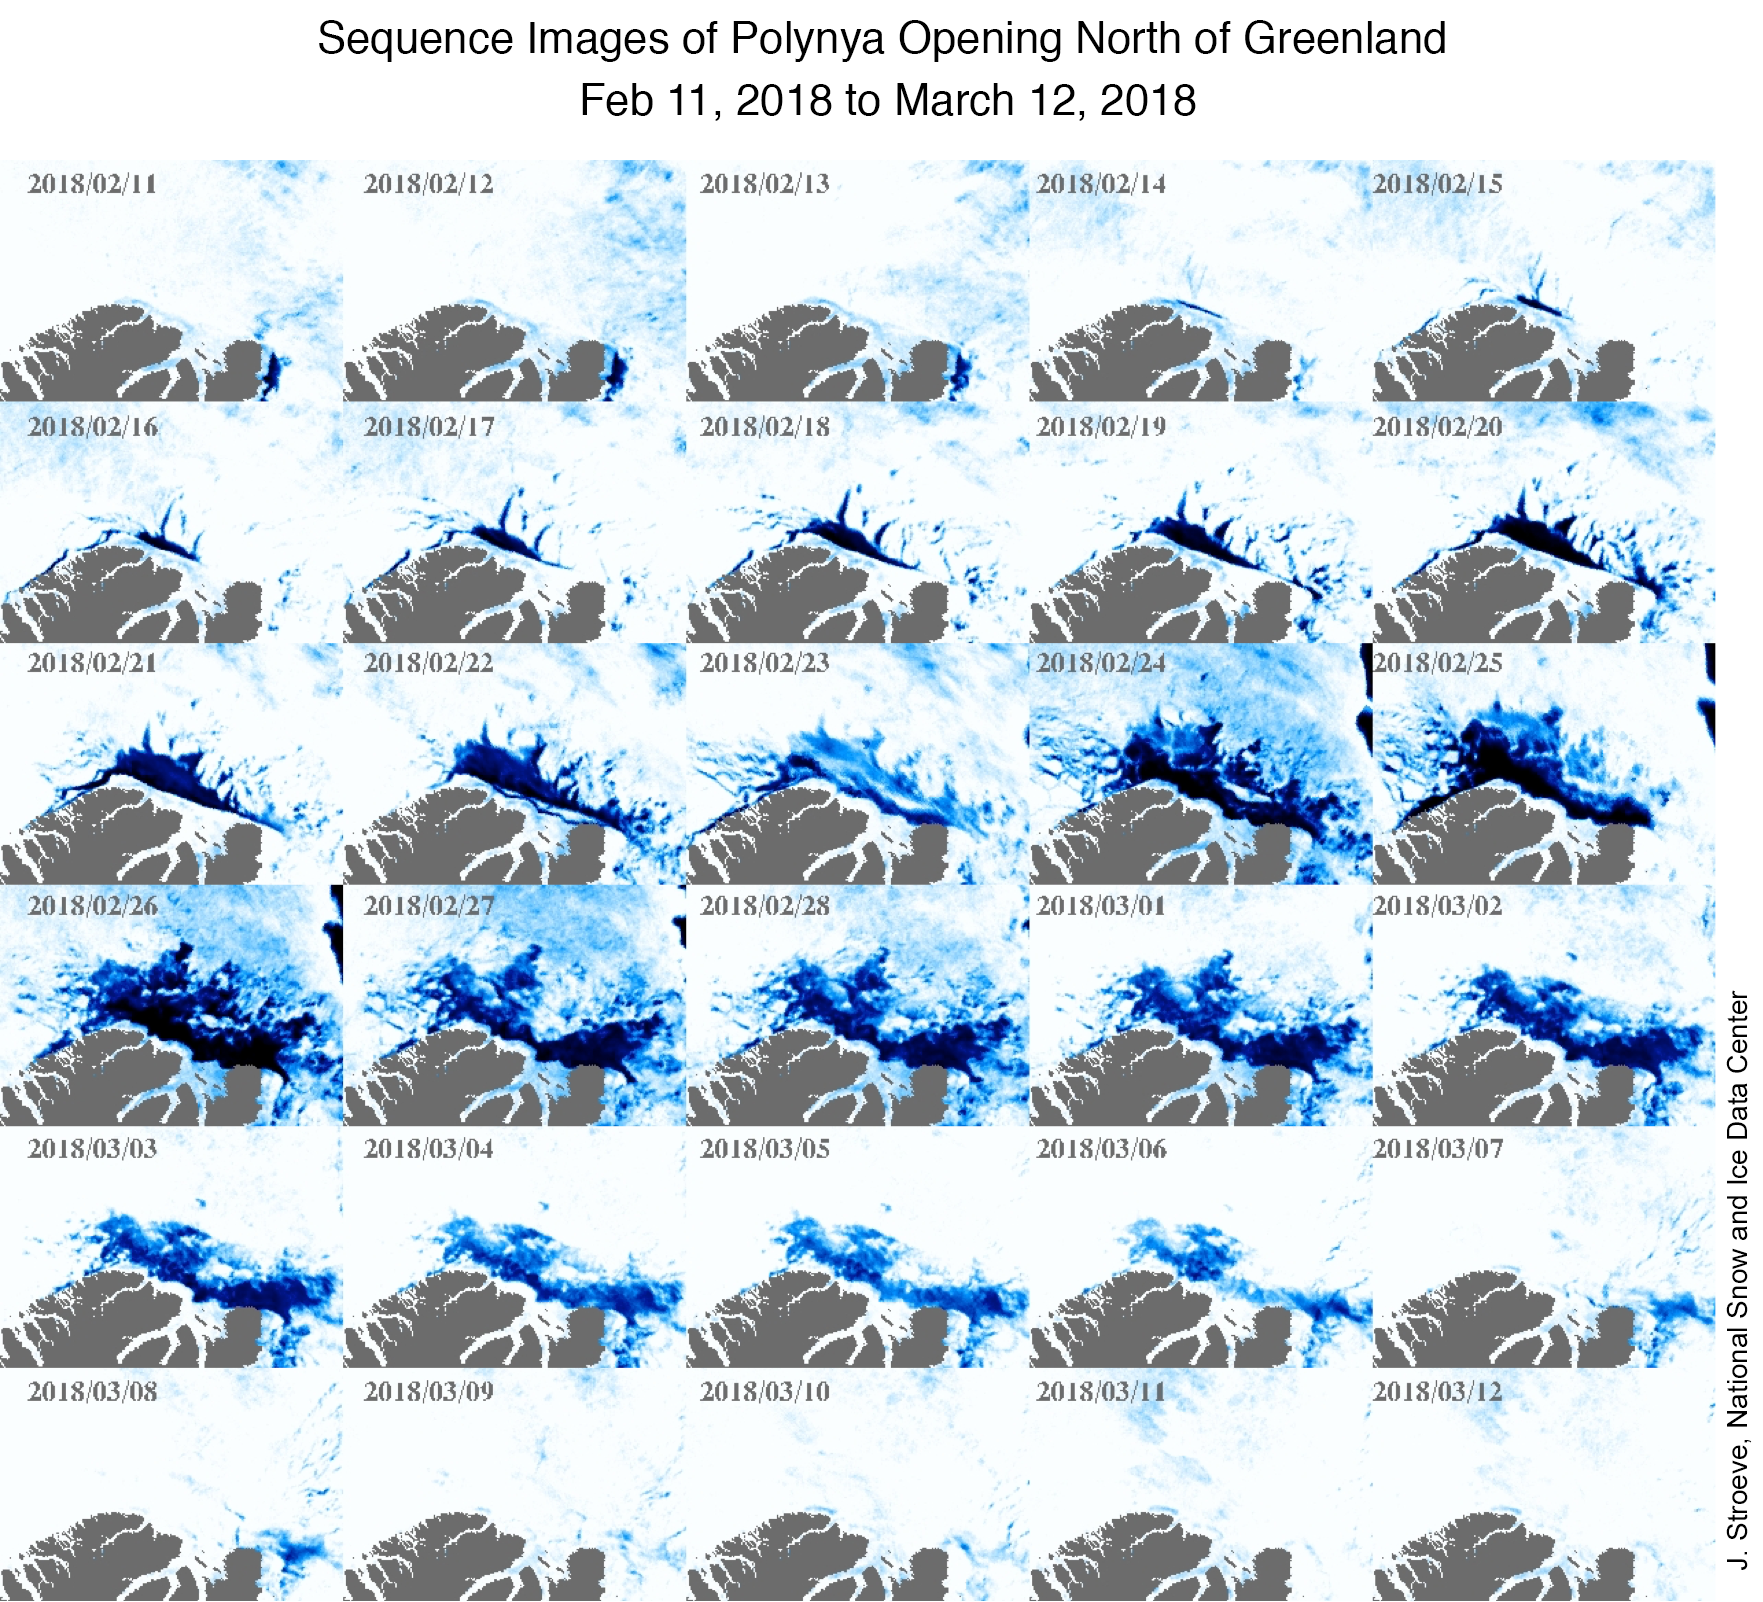
Figure 6a. This sequence of high-resolution images from the NASA Advanced Microwave Scanning Radiometer 2 (AMSR2) show the formation of a large polynya north of Greenland.
Credit: J. Stroeve, National Snow and Ice Data Center
High-resolution image
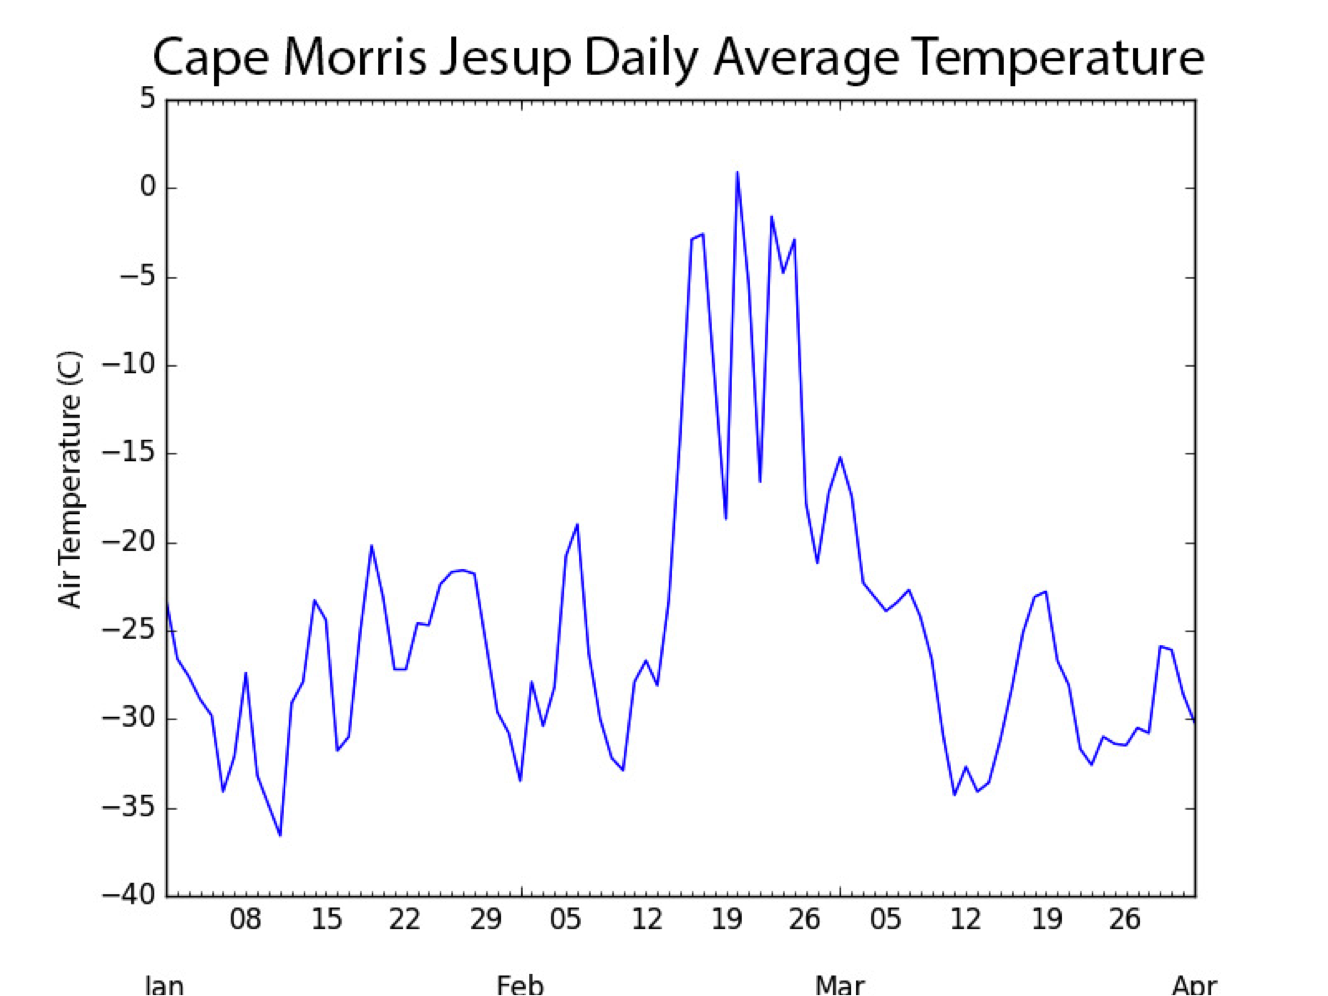
Figure 6b. This graph shows average daily temperatures at Cape Morris Jesup, Greenland’s northernmost station.
Credit: J. Stroeve, National Snow and Ice Data Center
High-resolution image
During the middle of February, a large polynya opened north of Greenland and persisted through the first week of March (Figure 6a). Development of the polynya was driven in part by strong winds from the south and unusually high air temperatures. On February 24, during the peak of the polynya opening, air temperatures at Cape Morris Jesup, Greenland’s northernmost station, surged well above freezing, reaching 6.1 degrees Celsius (43 degrees Fahrenheit), while the daily average temperature hovered just above freezing (Figure 6b). Such periods of extremely warm winter temperatures have been unusual since the beginning of the Cape Morris Jesup record in 1981. During the month of February, only a few years exhibited hourly air temperatures rising above 0 degrees Celsius (32 degrees Fahrenheit): once in 1997, five times in 2011, seven in 2017 and 59 times in 2018.
References
Beitsch, A., L. Kaleschke, and S. Kern. 2014. Investigating high-resolution AMSR2 sea ice concentrations during the February 2013 fracture event in the Beaufort Sea. Remote Sensing 6, 3841-3856, doi.org/10.3390/rs6053841.
Boisvert, L.N., A.A. Petty, and J. Stroeve. 2016. The impact of the extreme winter 2015/16 Arctic cyclone on the Barents–Kara Seas, Bulletin of the American Meteorological Society, doi:10.1175/MWR-D-16-0234.1.
Ricker, R., S. Hendricks, F. Girard-Ardhuin, L. Kaleschke, C. Lique, X. Tian-Kunze, M. Nicolaus, and T. Krumpen. 2017a. Satellite observed drop of Arctic sea ice growth in winter 2015-2015, Geophysical Research Letters, doi:10.1002/2016GL072244.
Stroeve, J., D. Schroeder, M. Tsamados, and D. Feltham. 2018. Warm winter, thin ice? The Cryosphere, doi:10.5194/tc-2017-287, accepted.
Further reading
2018 winter Arctic sea ice: Bering down
The 2018 winter sea ice maximum has passed, and the melt season has begun. The most notable aspect of the 2017 to 2018 winter ice extent was the persistently low ice extent in the Bering Sea. While December, January, and February were characterized by very warm conditions over the Arctic, March temperatures were mixed, with cool conditions over the Eurasian side and moderately warm conditions over the North American side.
Overview of conditions

Figure 1. Arctic sea ice extent for March 2018 was 14.30 million square kilometers (5.52 million square miles). The magenta line shows the 1981 to 2010 average extent for the month. Sea Ice Index data. About the data
Credit: National Snow and Ice Data Center
High-resolution image
Arctic sea ice extent for March 2018 averaged 14.30 million square kilometers (5.52 million square miles), the second lowest in the 1979 to 2018 satellite record. This was 1.13 million square kilometers (436,300 square miles) below the 1981 to 2010 average and 30,000 square kilometers (11,600 square miles) above the record low March extent in 2017. Extent at the end of the month was far below average in the Bering Sea, as it has been for the past several months, and slightly below average in the far northern Atlantic Ocean and Barents Sea. Ice extent was slightly above average in the Sea of Okhotsk.
Conditions in context
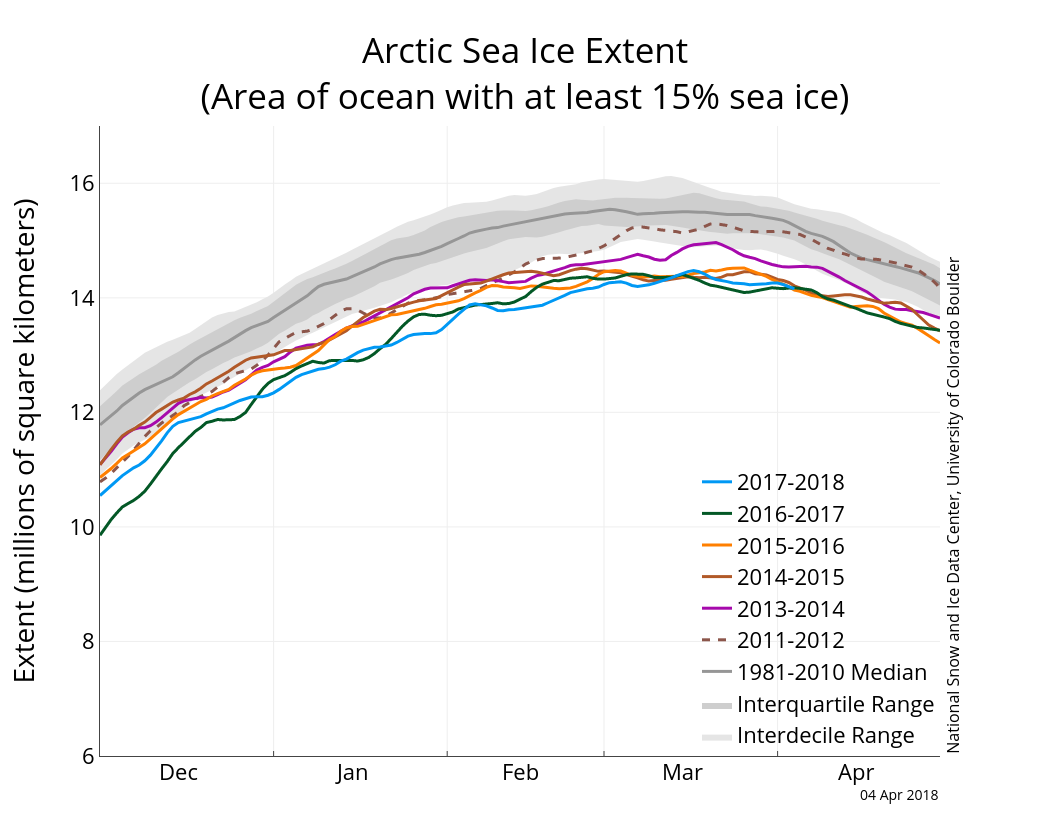
Figure 2a. The graph above shows Arctic sea ice extent as of April 4, 2018, along with daily ice extent data for four previous years, and the record low year. 2017 to 2018 is shown in blue, 2016 to 2017 in green, 2015 to 2016 in orange, 2014 to 2015 in brown, 2013 to 2014 in purple, and 2011 to 2012 in dotted brown. The 1981 to 2010 median is in dark gray. The gray areas around the median line show the interquartile and interdecile ranges of the data. Sea Ice Index data.
Credit: National Snow and Ice Data Center
High-resolution image
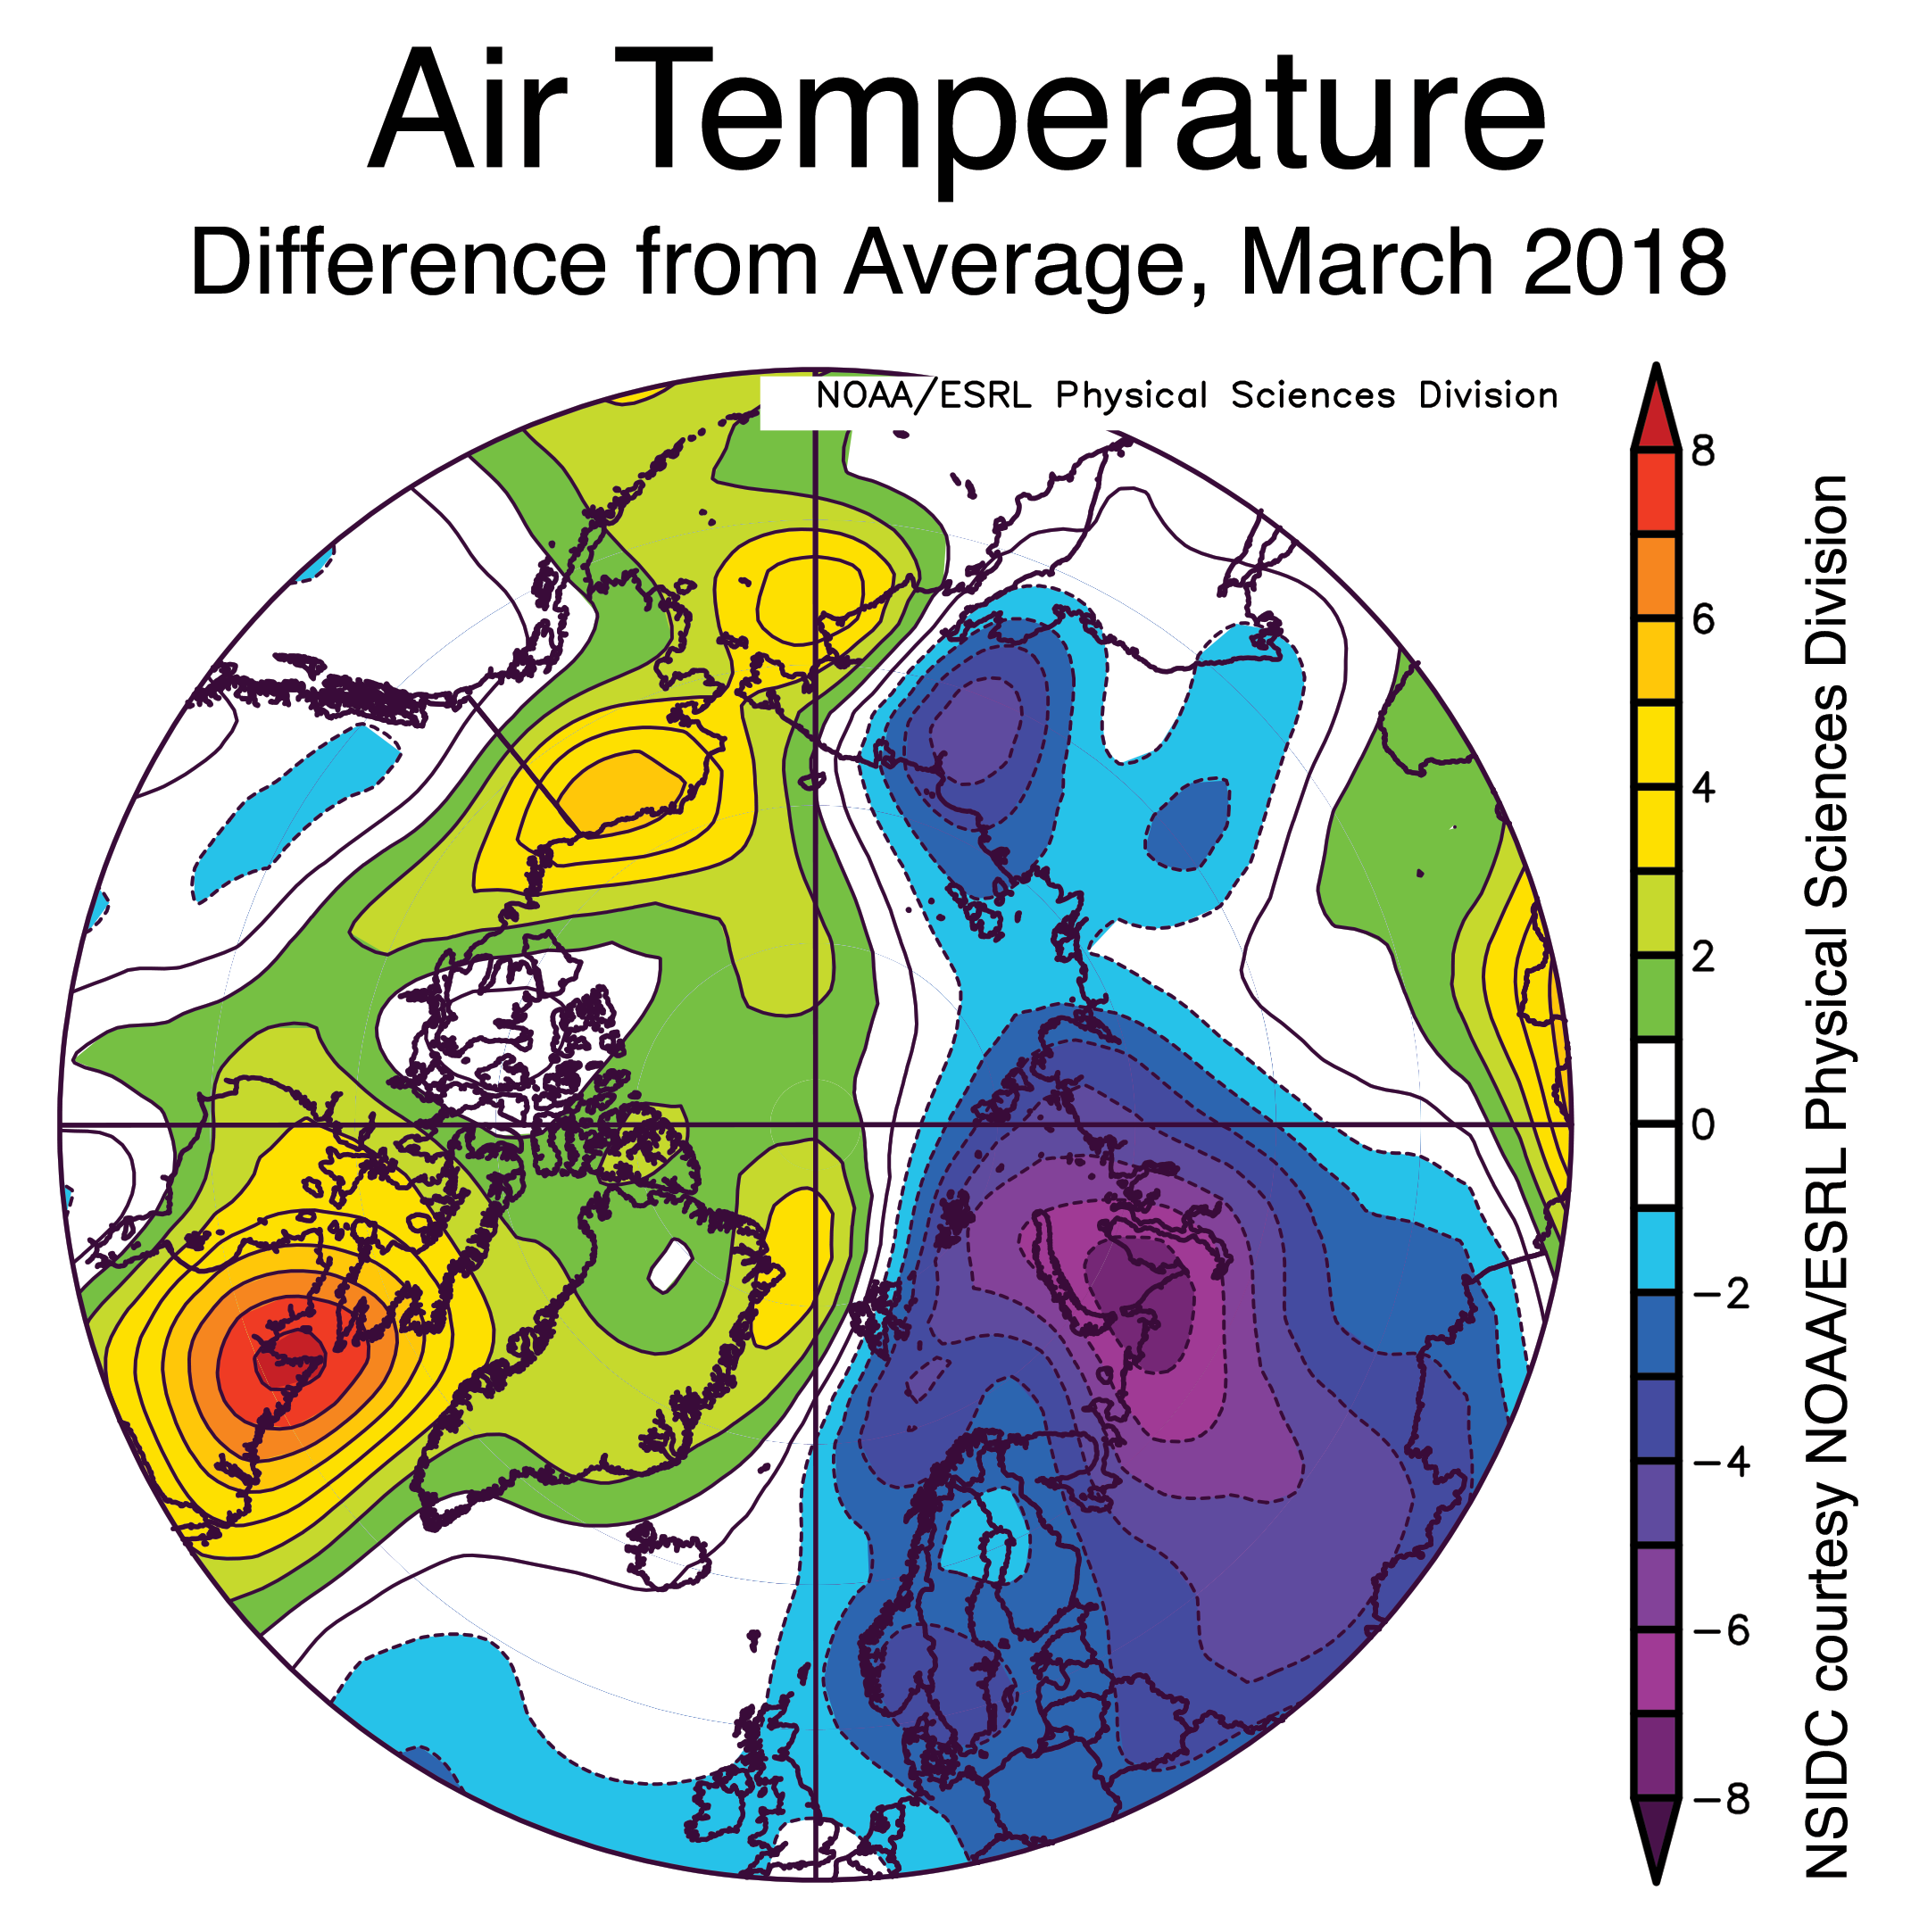
Figure 2b. This plot shows departure from average air temperature in the Arctic at the 925 hPa level, in degrees Celsius, for March 2018. Yellows and reds indicate higher than average temperature; blues and purples indicate lower than average temperature.
Credit: NSIDC courtesy NOAA Earth System Research Laboratory Physical Sciences Division
High-resolution image
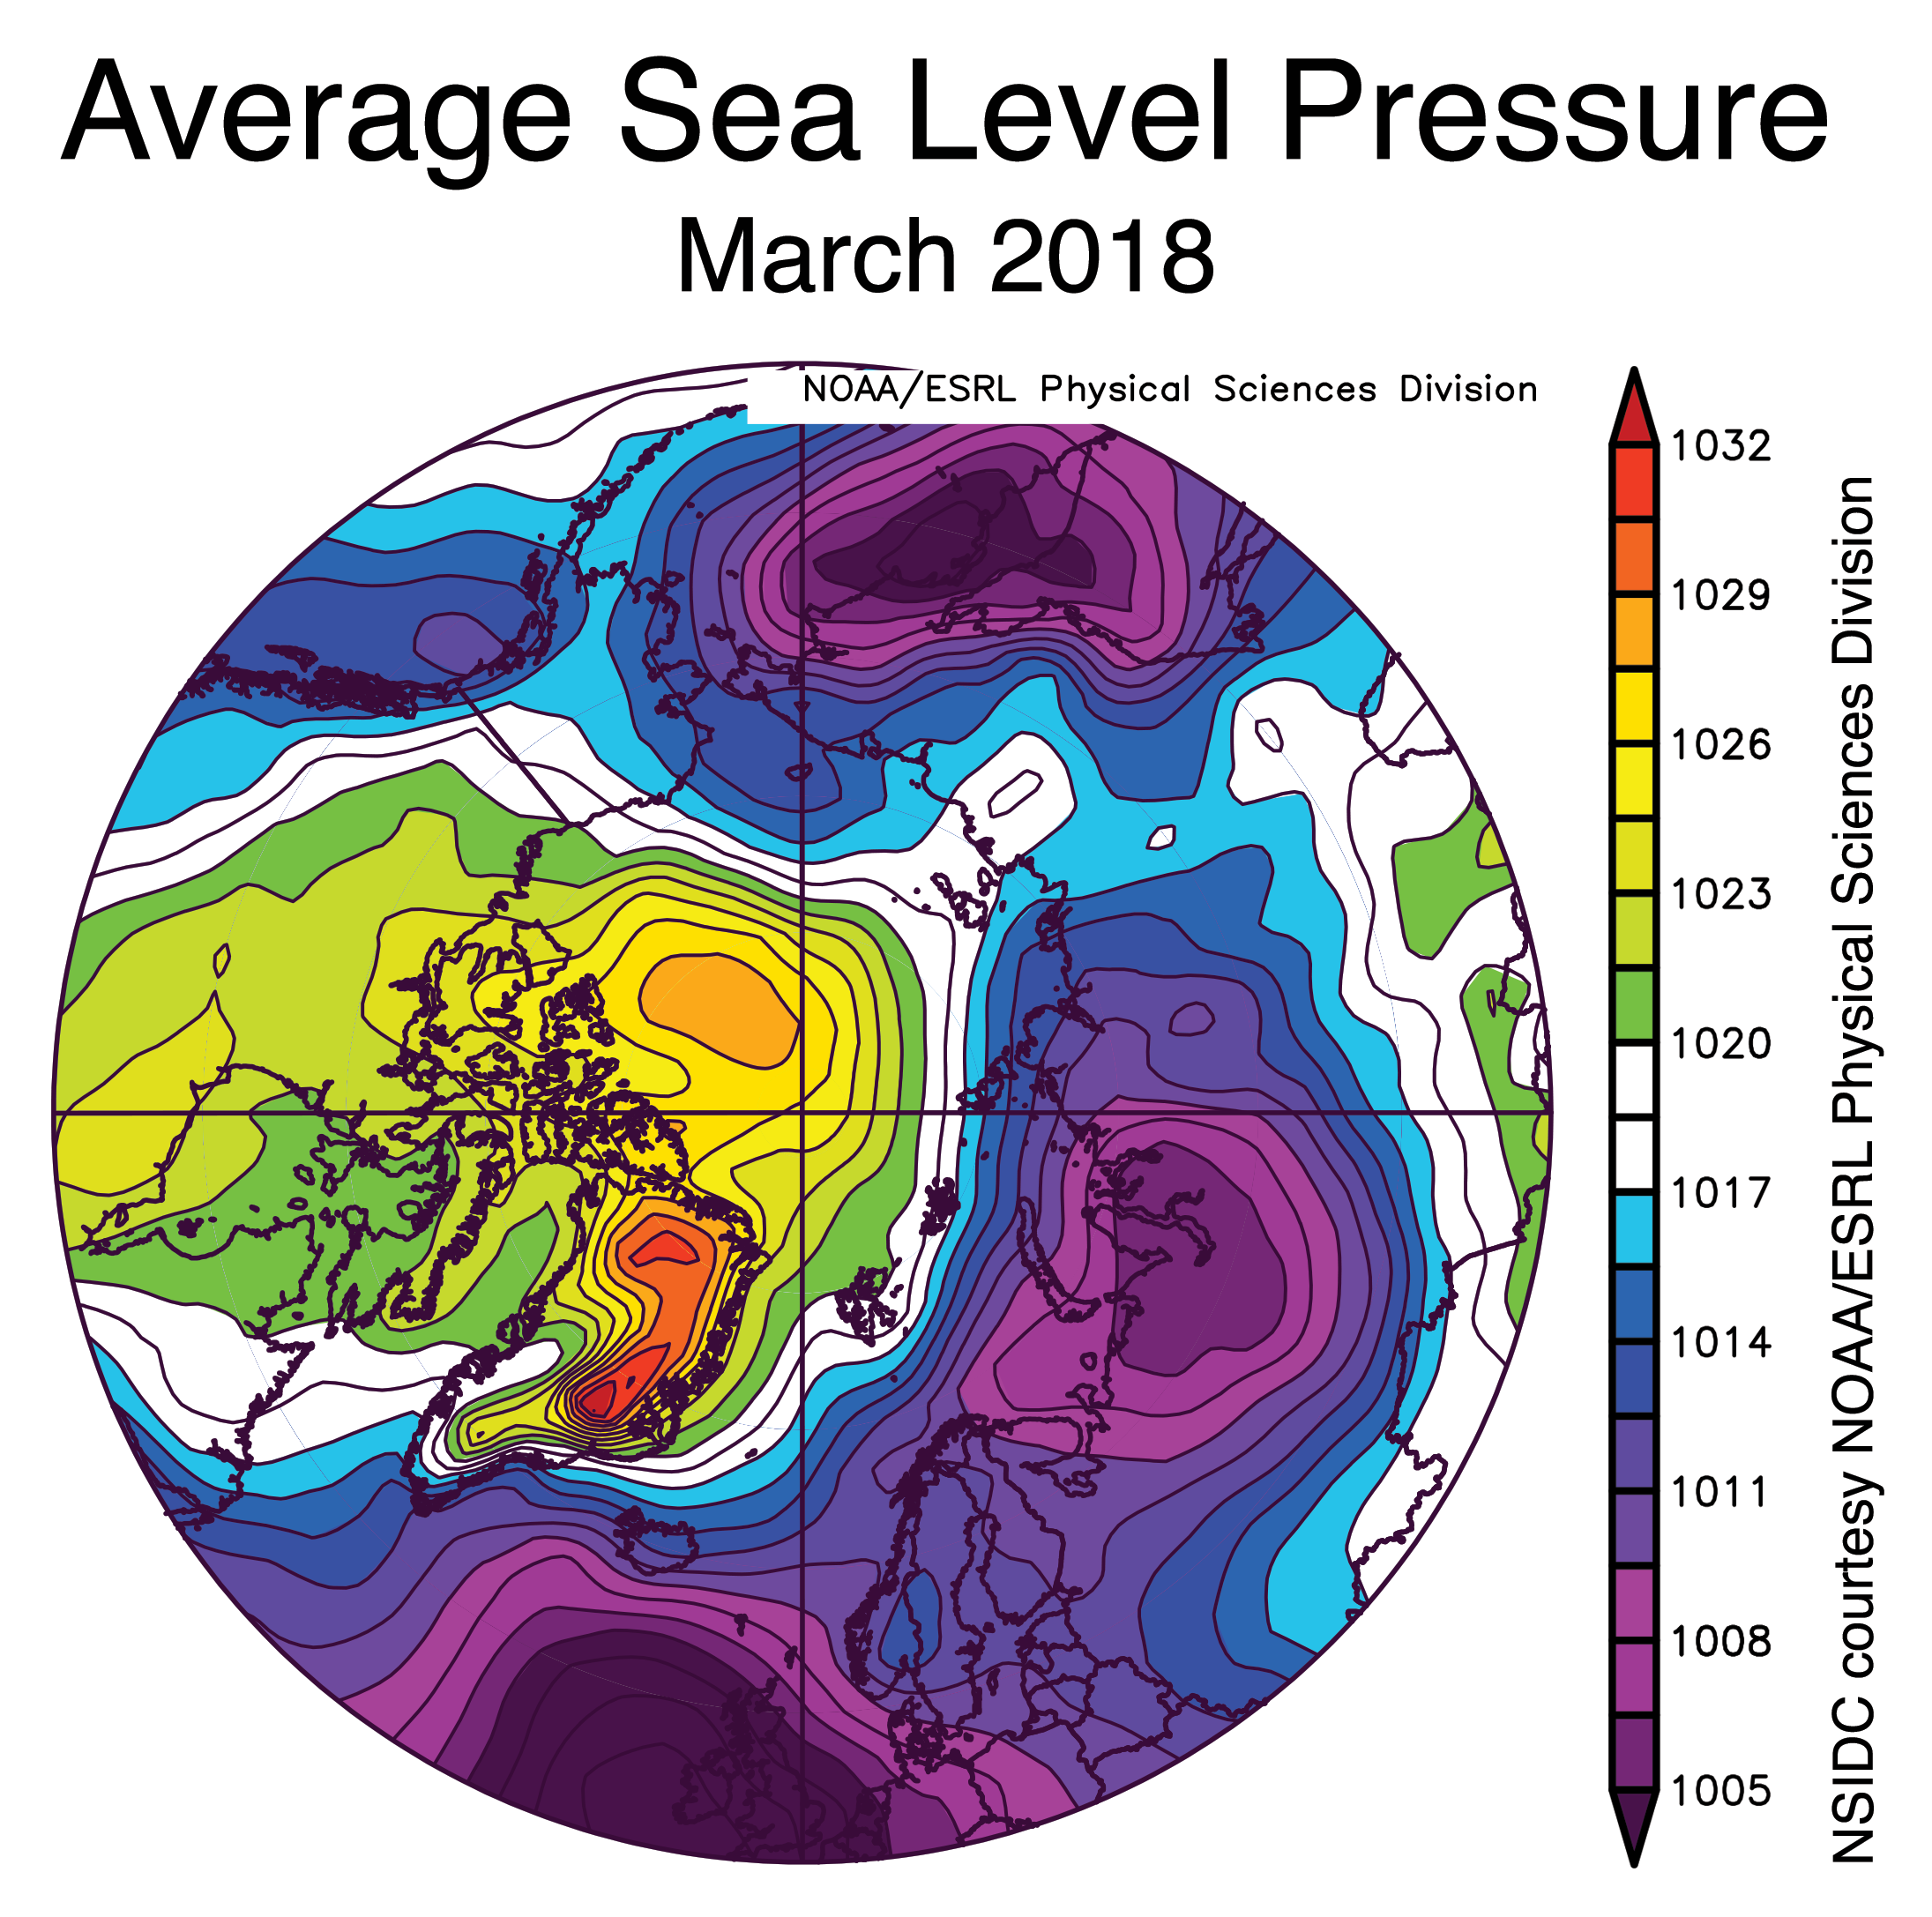
Figure 2c. This plot shows the average sea level pressure in the Arctic at the 925 hPa level, in millibars, for March 2018. Yellows and reds indicate higher than average air pressure; blues and purples indicate lower than average air pressure.
Credit: NSIDC courtesy NOAA Earth System Research Laboratory Physical Sciences Division
High-resolution image
Overall, ice extent for March 2018 changed little. Extent reached the annual maximum on March 17 and declined by March 31 to nearly the same level as at the beginning of the month. Ice loss following the seasonal maximum has been almost entirely restricted to the Bering Sea and the Sea of Okhotsk, with slight increases in extent in the Barents Sea and near Svalbard.
Air temperatures at the 925 hPa level (about 2,500 feet above sea level) were 2 to 4 degrees Celsius (4 to 7 degrees Fahrenheit) higher than average in regions near Greenland and Alaska. Cooler conditions prevailed over Scandinavia, the Kara Sea, and far eastern Siberia, where temperatures were generally 4 to 7 degrees Celsius (7 to 13 degrees Fahrenheit) below average.
Higher than average sea level pressure was present over the western Arctic, including Canada, the Beaufort Sea, and Greenland, while lower than average sea level pressure prevailed over most of Europe and Siberia. This pattern was associated with winds from the south in the Bering Sea and Alaska, helping to push ice toward the pole. Conversely, over Scandinavia and the Barents Sea this pressure pattern resulted in winds from the northeast that pushed Arctic air onto the northern Eurasian landmass leading to colder air temperatures.
The Arctic Oscillation (AO), an indicator for general wind, precipitation, and temperature patterns in the Arctic, was strongly negative in early March, reflecting the higher than average sea level pressure in the western Arctic. This negative phase is characterized by a weakening of the circumpolar wind pattern, a pattern that favors cold air outbreaks over much of the United States as well as parts of Europe and Asia.
March 2018 compared to previous years
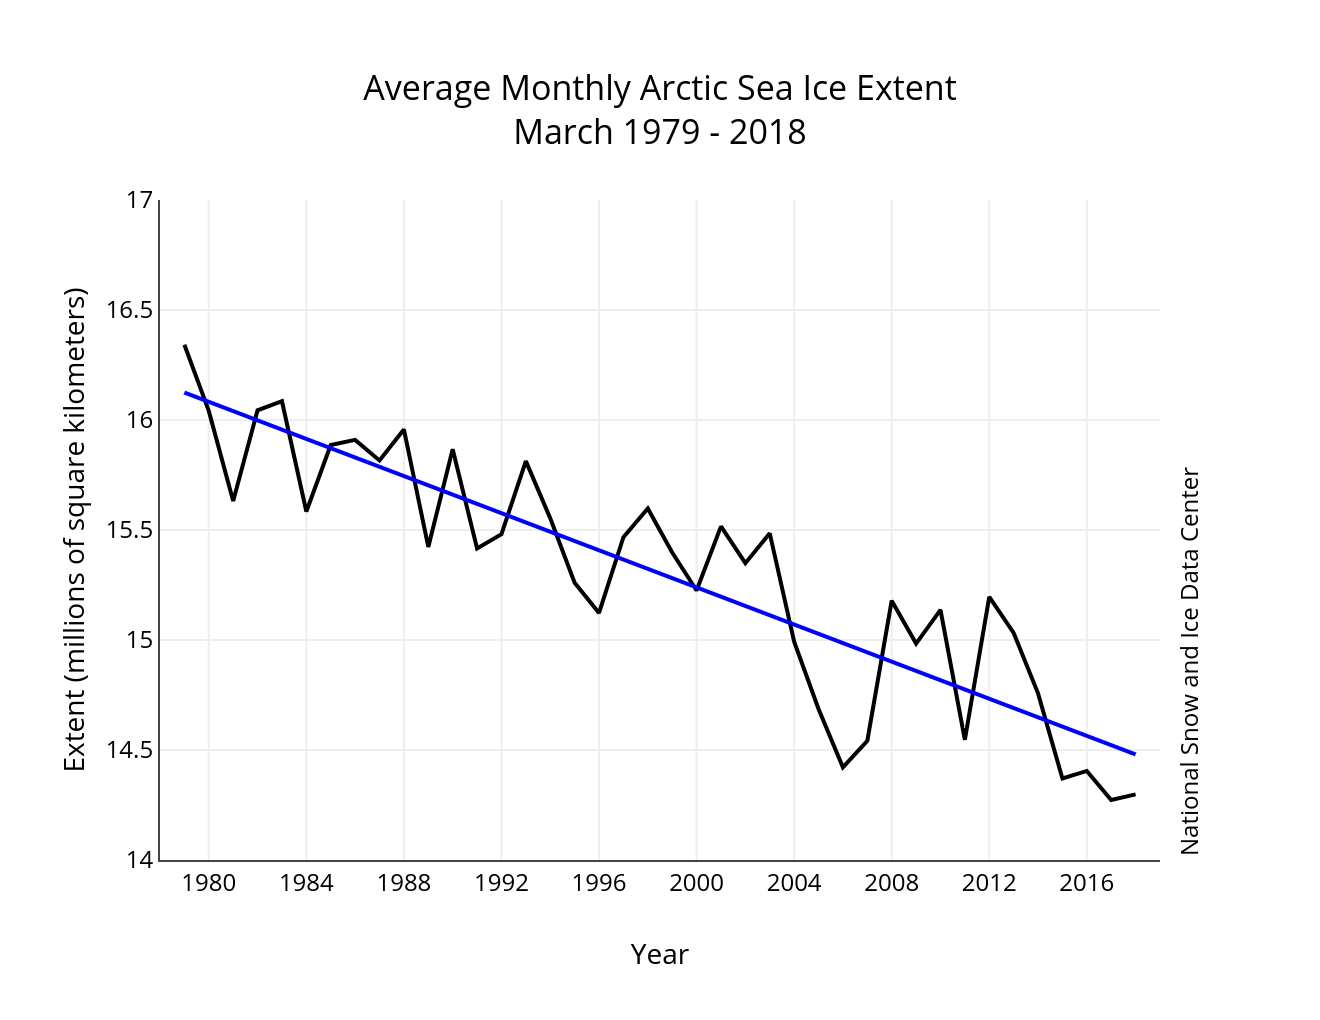
Figure 3. Monthly March ice extent for 1979 to 2018 shows a decline of 2.7 percent per decade.
Credit: National Snow and Ice Data Center
High-resolution image
The linear rate of decline for March ice extent is 42,200 square kilometers (16,400 square miles) per year, or 2.7 percent per decade relative to the 1981 to 2010 average.
Review of winter season 2017 to 2018
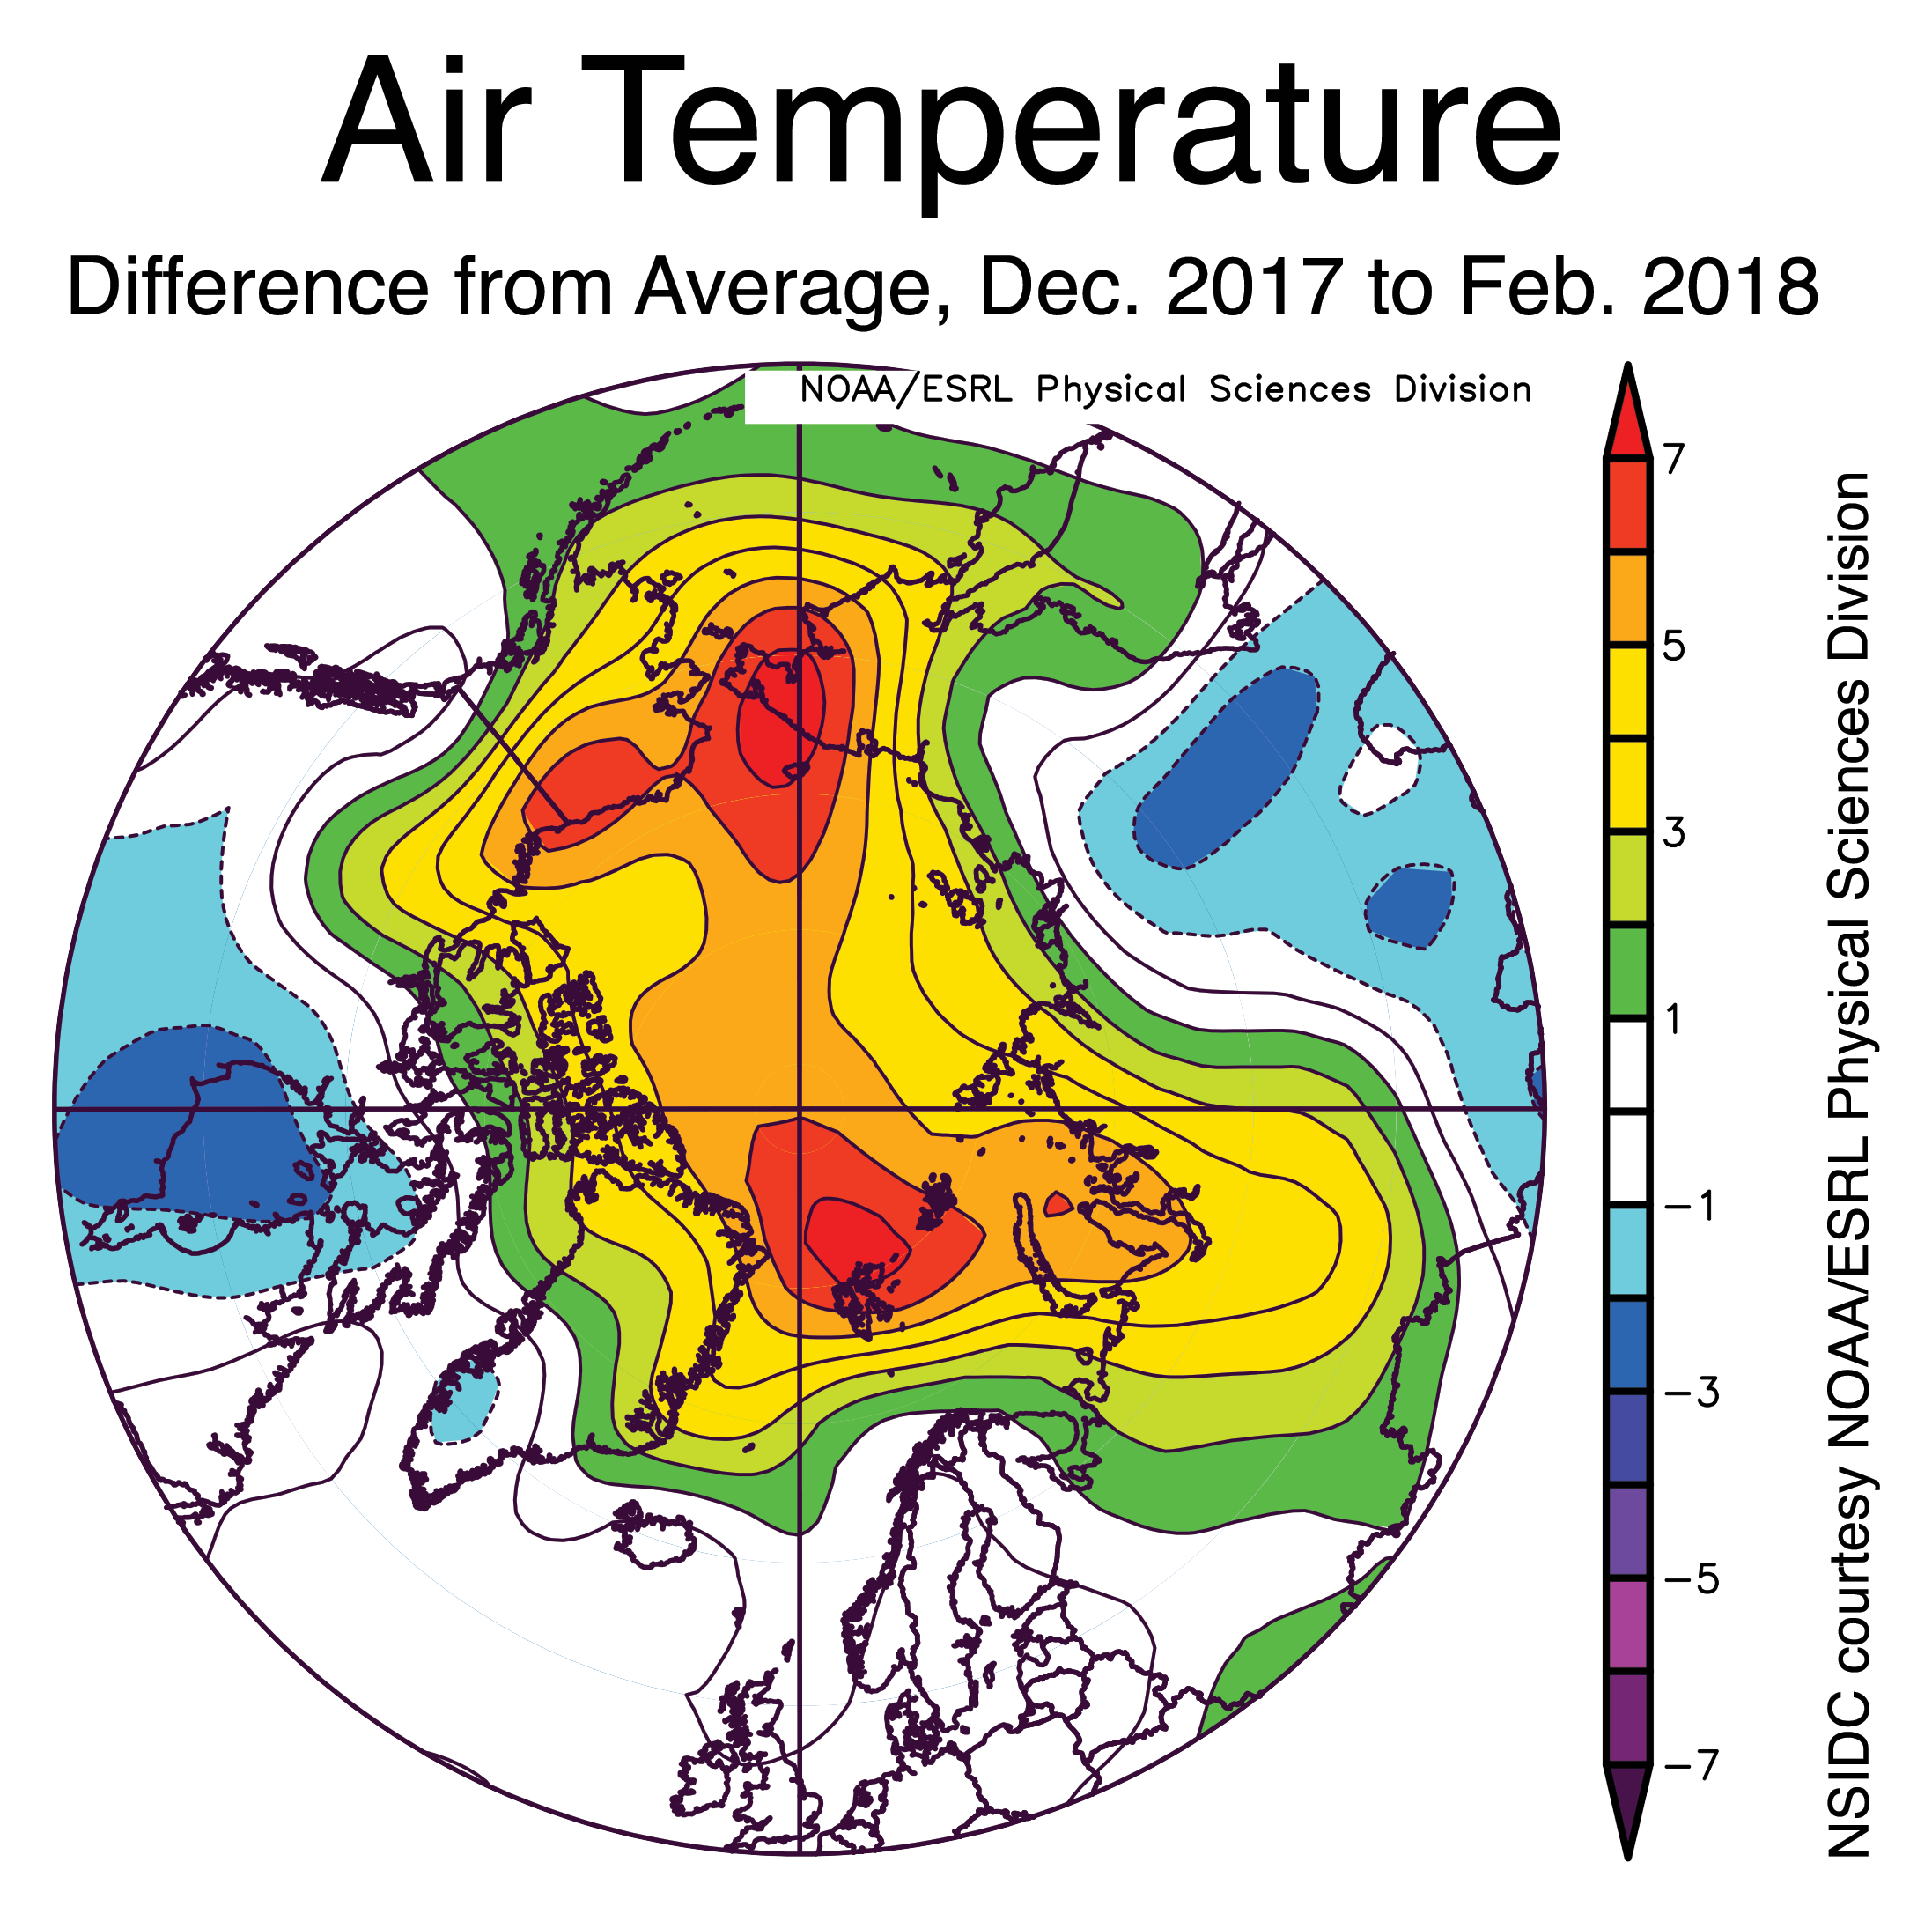
Figure 4. This plot shows the departure from average air temperature in the Arctic at the 925 hPa level, in degrees Celsius, for December 2017 and January and February in 2018. Yellows and reds indicate higher than average temperature; blues and purples indicate lower than average temperature.
Credit: NSIDC courtesy NOAA Earth System Research Laboratory Physical Sciences Division
High-resolution image
Unusually warm conditions and some prominent warm air intrusions characterized the 2017 to 2018 winter over the Arctic Ocean. Mean air temperature for the months of December, January, and February combined (the climatological winter season) was as much as 7 degrees Celsius (13 degrees Fahrenheit) higher than average, and nearly the entire Arctic Ocean was 4 degrees Celsius (7 degrees Fahrenheit) higher than average. This is the fourth year in a row that unusual jet stream patterns have led to warm air intrusions over the Arctic Ocean. However, some Arctic and subarctic land areas experienced unusually cold periods during the winter. Recent studies show that the frequency and intensity of warm air intrusions has increased in the last few years, particularly in the Atlantic sector, helping to reduce ice growth in the Barents Sea. The winter of 2017 to 2018 marks the second year in a row of pronounced warming events in the Pacific sector.
Deep snow in Russia and Europe

Figure 5. These images show Northern Hemisphere water equivalent of snow cover in millimeters (top) and Northern Hemisphere total snow mass in gigatons (bottom) from October 2017 to March 31, 2018.
Credit: GlobSnow Project and the Finnish Meteorological Institute
High-resolution image
Snow cover extent on the land masses surrounding the Arctic Ocean was average this past winter. However, an analysis of the snow cover thickness and density showed that the total snow mass this past winter was high. Estimates of total snow mass as of March 31 showed that the Northern Hemisphere had nearly 700 billion tons more snow this winter than the 1982 to 2012 average. Many areas of Russia and northern Europe had more than 150 millimeters (6 inches) of water-equivalent on the ground, present as deep snow cover. Snow extent had been above average the entire autumn-winter season but grew to exceptional levels beginning in February. Although the total snow mass has begun to decrease, it is still far above average. The analysis is based on many sources of snow and snow depth data, including passive microwave data produced by NSIDC (EASE-Grid Snow Water Equivalent and Daily Snow Cover), and data derived from several other groups from the European Space Agency and the National Oceanographic and Atmospheric Administration.
Sea ice drift in the Arctic Ocean
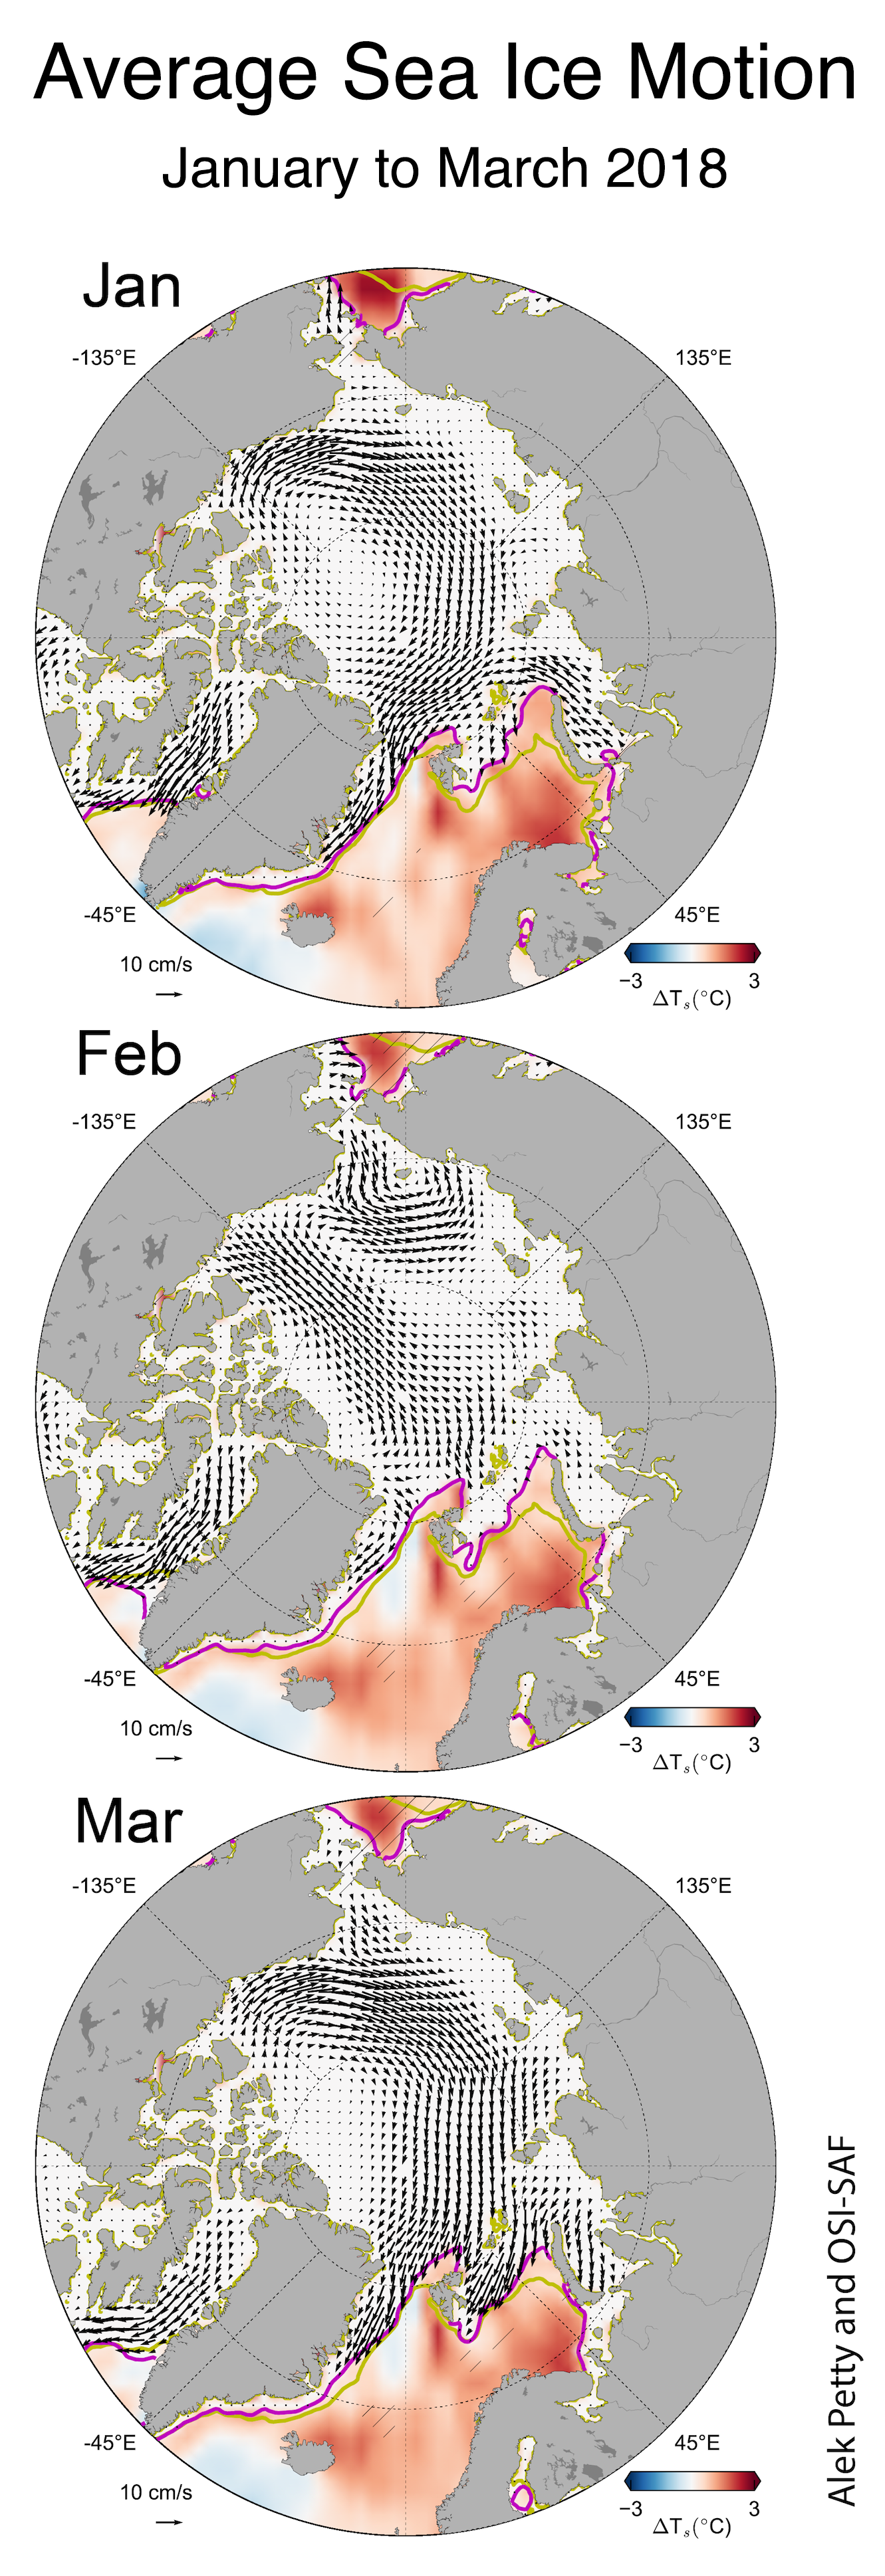
Figure 6. This plot shows monthly average sea ice motion in the Arctic, in centimeters per second, for the months of January, February, and March in 2018.
Credit: Alek Petty/NASA Goddard Space Flight Center (GSFC) and the Ocean and Sea Ice Satellite Application Facility (OSI-SAF)
High-resolution image
Plots of monthly average sea ice motion for January, February, and March 2018 reveal pronounced changes in drift direction, since sea ice movement is largely controlled by winds, and therefore storms and pressure patterns. The maps include averages of sea surface temperature outside of the ice-covered area, and indicate that the surface of both the northern Pacific and northern Atlantic were substantially warmer relative to a 1982 to 2015 reference period. Strong Beaufort Gyre and Transpolar Drift patterns were present for January and March of 2018. Ice motion and sea surface temperature data are based on a multi-sensor estimate created by the Ocean and Sea Ice Satellite Application Facility (OSI-SAF), a European meteorological consortium.
Seasonal increase in Antarctic sea ice
After reaching a minimum extent for the year on February 20 and 21, Antarctic sea ice grew rapidly in March 2018. Sea ice extent averaged 3.53 million square kilometers (1.36 million square miles) for the month, not far below the 1981 to 2010 average of 4.03 million square kilometers (1.56 million square miles). Growth was especially rapid in the Amundsen and Ross Seas, nearly erasing the area of below-average sea ice extent that had been in the eastern Ross Sea and western Amundsen in early March.
Rapid sea ice growth in the Amundsen and eastern Ross Seas was reflected in temperatures at the 925 hPa level that were 1 to 3 degrees Celsius (2 to 5 degrees Fahrenheit) below average across the Pine Island Bay region. This is likely related to cool winds from the south coming up against the west side of a low-pressure area over the Bellingshausen Sea. By comparison, temperatures 2.5 to 4.5 degrees Celsius (4 to 8 degrees Fahrenheit) higher than average were the rule over much of the continental interior from Dronning Maud Land to northern Victoria Land along the Transantarctic Mountains. The index of the strength of the circumpolar vortex (or Southern Annular Mode) was near-neutral for March.
References
Boisvert, L. N., A. A. Petty, and J. Stroeve. 2016. The Impact of the Extreme Winter 2015/16 Arctic Cyclone on the Barents–Kara Seas, Bulletin of the American Meteorological Society, doi:10.1175/MWR-D-16-0234.1.
Graham, R. M., L. Cohen, A. A. Petty, L. N. Boisvert, A. Rinke, S. R. Hudson, M. Nicolaus, and M. A. Granskog. 2017. Increasing frequency and duration of Arctic winter warming events, Geophysical Research Letters, 44, 6974–6983, doi:10.1002/2017GL073395.
Ricker, R., S. Hendricks, F. Girard-Ardhuin, L. Kaleschke, C. Lique, X. Tian-Kunze, M. Nicolaus, and T. Krumpen. 2017. Satellite observed drop of Arctic sea ice growth in winter 2015-2015, Geophysical Research Letters, doi:10.1002/2016GL072244.
Rinke, A., M. Maturilli, R. M. Graham, H. Matthes, D. Handorf, L. Cohen, S. R. Hudson, and J. C. Moore. 2017. Extreme cyclone events in the Arctic: Wintertime variability and trends , Environmental Research Letters, 12 (9), 094006, doi:10.1088/1748-9326/aa7def.
Correction
On April 20, we revised a sentence under the section Seasonal increase in Antarctic sea ice. The sentence originally read “Growth was especially rapid in the Amundsen and eastern Ross Sea, where sea ice was nearly absent at the time of the minimum extent, and along the East Antarctic coast, where many areas now exceed the daily median extent for the end of March.” We revised it to “Growth was especially rapid in the Amundsen and Ross Seas, nearly erasing the area of below-average sea ice extent that had been in the eastern Ross Sea and western Amundsen in early March.”
Arctic sea ice maximum at second lowest in the satellite record
Arctic sea ice appears to have reached its annual maximum extent on March 17. This is the second lowest Arctic maximum in the 39-year satellite record. The four lowest maximum extents in the satellite record have all occurred in the past four years. NSIDC will post a detailed analysis of the 2017 to 2018 winter sea ice conditions in our regular monthly post in early April.
Overview of conditions
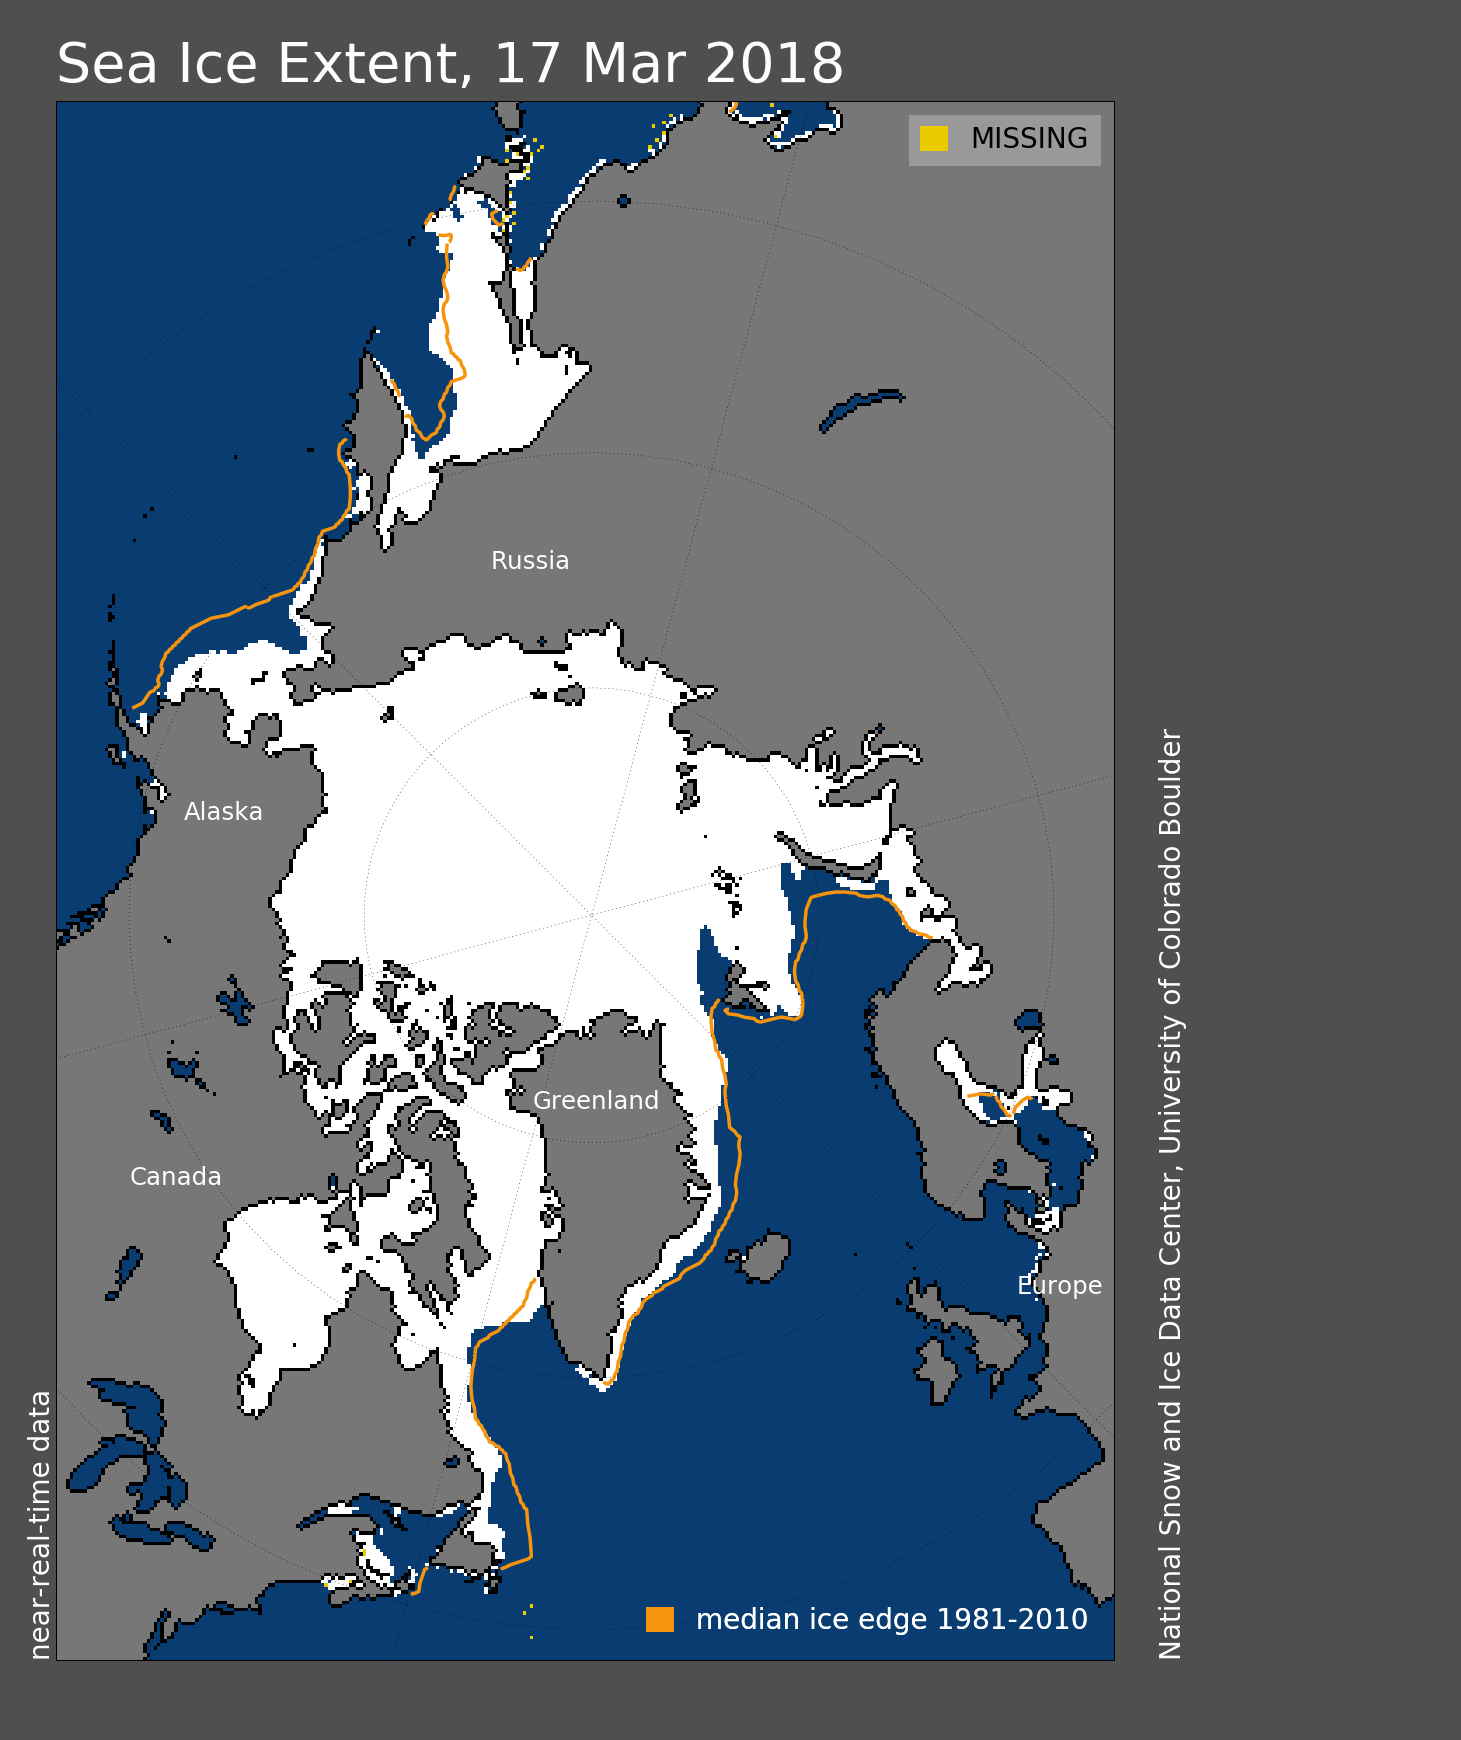
Figure 1. Arctic sea ice extent for March 17, 2018 was 14.48 million square kilometers (5.59 million square miles). The orange line shows the 1981 to 2010 average extent for that day. Sea Ice Index data. About the data
Credit: National Snow and Ice Data Center
High-resolution image
On March 17, 2018, Arctic sea ice likely reached its maximum extent for the year, at 14.48 million square kilometers (5.59 million square miles), the second lowest in the 39-year satellite record, falling just behind 2017. This year’s maximum extent is 1.16 million square kilometers (448,000 square miles) below the 1981 to 2010 average maximum of 15.64 million square kilometers (6.04 million square miles).
The four lowest seasonal maxima have all occurred during the last four years. The 2018 maximum is 60,000 square kilometers (23,200 square miles) above the record low maximum that occurred on March 7, 2017; 40,000 square kilometers (15,400 square miles) below the 2015 and 2016 maxima (now tied for third lowest); and is 190,000 square kilometers (73,400 square miles) below the 2011 maximum, which is now fifth lowest.
In March 2017, we reported a new record maximum being set, with 2016 sliding to the second lowest, and 2015 the third lowest. In November 2017, we updated our calculation of the monthly average sea ice extent in the NSIDC Sea Ice Index, resulting in 2016 tying with 2015.
The date of the maximum this year, March 17, was five days later than normal compared to the 1981 to 2010 median date of March 12.
Conditions in context
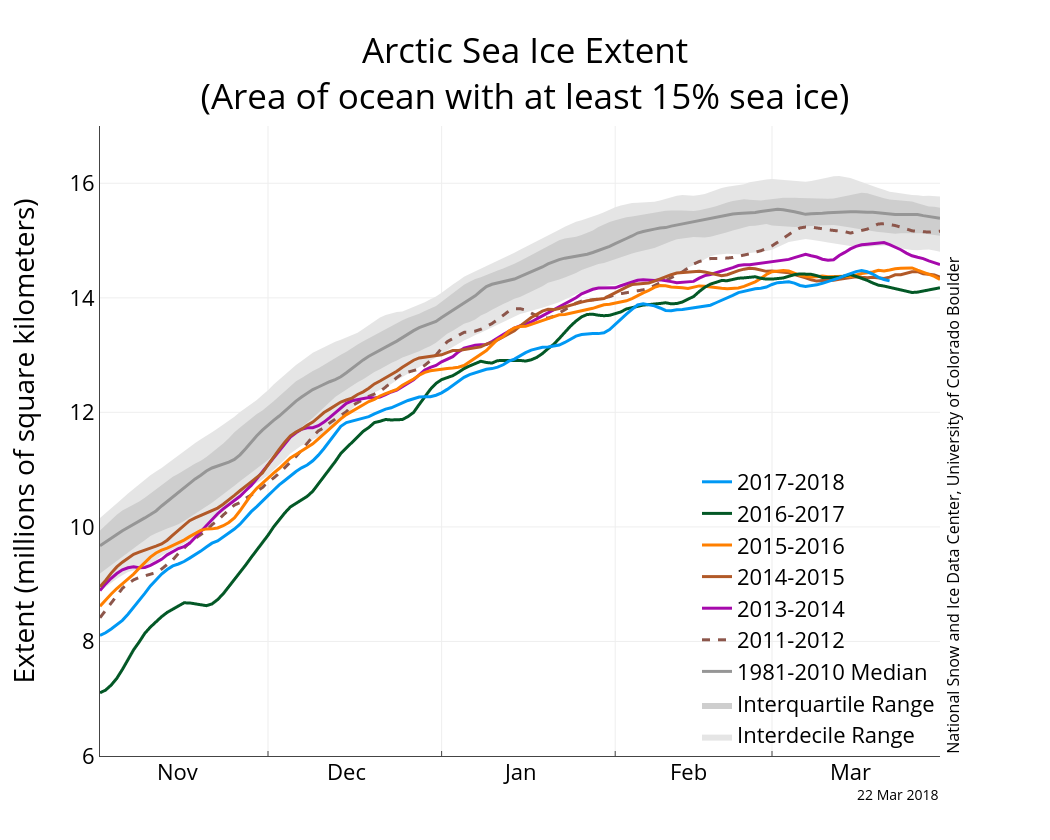
Figure 2. The graph above shows Arctic sea ice extent as of March 22, 2018, along with daily ice extent data for four previous years and the record low year. 2017 to 2018 is shown in blue, 2016 to 2017 in green, 2015 to 2016 in orange, 2014 to 2015 in brown, 2013 to 2014 in magenta, and the record low year 2011 to 2012 in dashed brown. The 1981 to 2010 median is in dark gray. The gray areas around the median line show the interquartile and interdecile ranges of the data. Sea Ice Index data.
Credit: National Snow and Ice Data Center
High-resolution image
The ice growth season ended with very low sea ice extents in the Bering Sea in the Pacific side of the Arctic, and in the Barents Sea in the Atlantic side of the Arctic. The regions of reduced ice cover reflect the combined influences of late autumn freeze-up as well as persistent high air temperatures throughout the winter. Freeze-up was especially late in the Chukchi Sea, due in part to the effects of strong ocean heat transport into the area through the Bering Strait. February then saw an early retreat of sea ice in the Bering Sea. Sea ice extent on the Atlantic side remained below average throughout the winter, which also appears linked to warm ocean waters. While air temperatures at the 925 hPa level (about 2,500 feet above sea level) remained well above average through most of winter, February saw an extreme heat wave over the Arctic Ocean. This is the fourth winter in a row that such heat waves have been recorded over the Arctic Ocean.
A late spurt in sea ice growth just prior to the maximum occurred in the Barents Sea near Novaya Zemlya; sea ice retreat just after the maximum was led by ice loss in the Bering Sea.
Table 1. Ten lowest maximum Arctic sea ice extents (satellite record, 1979 to present)
| Rank | Year | In millions of square kilometers | In millions of square miles | Date |
| 1 | 2017 | 14.42 | 5.57 | March 7 |
| 2 | 2018 | 14.48 | 5.59 | March 17 |
| 3 | 2015 | 14.52 | 5.61 | February 25 |
| 3 | 2016 | 14.52 | 5.61 | March 24 |
| 5 | 2011 | 14.67 | 5.66 | March 9 |
| 5 | 2006 | 14.68 | 5.67 | March 12 |
| 7 | 2007 | 14.77 | 5.7 | March 12 |
| 8 | 2005 | 14.95 | 5.77 | March 12 |
| 8 | 2014 | 14.96 | 5.78 | March 21 |
| 10 | 2009 | 15.17 | 5.84 | March 5 |
The Antarctic minimum
As noted in our previous post, in the Southern Hemisphere, sea ice reached its minimum extent for the year on February 20 and 21, at 2.18 million square kilometers (842,000 square miles). This year’s minimum extent was the second lowest in the satellite record, 70,000 square kilometers (27,00 square miles) above the record low set on March 3, 2017. The Antarctic minimum extent is 670,000 square kilometers (259,000 square miles) below the 1981 to 2010 average minimum of 2.85 million square kilometers (1.10 million square miles).
The February 20 and 21 timing of the minimum (the same extent was recorded on both dates) was just slightly earlier than the 1981 to 2010 median date of February 24 for the minimum. Over the satellite record, the Antarctic minimum has occurred as early as February 15 and as late as March 6.
Compared to the Arctic, air temperatures over the sea ice regions of Antarctica over the past season (austral summer) have been closer to their climatological average, hovering within 2 degrees Celsius (4 degrees Fahrenheit) of the 1981 to 2010 average. Relatively rapid and early growth of ice along the eastern Weddell Sea ice edge led the beginning of the autumn sea ice expansion.
Final analysis pending
Please note this is a preliminary announcement. At the beginning of April, NSIDC scientists will release a full analysis of winter conditions in the Arctic, along with monthly data for March.
A warm approach to the equinox
As temperatures at the North Pole approached the melting point at the end of February, Arctic sea ice extent tracked at record low levels for this time of year. Extent was low on both the Atlantic and Pacific sides of the Arctic, with open water areas expanding rapidly in the Bering Sea during the latter half of the month. On the other side of the globe, Antarctic sea ice has reached its minimum extent for the year, the second lowest in the satellite record.
Overview of conditions
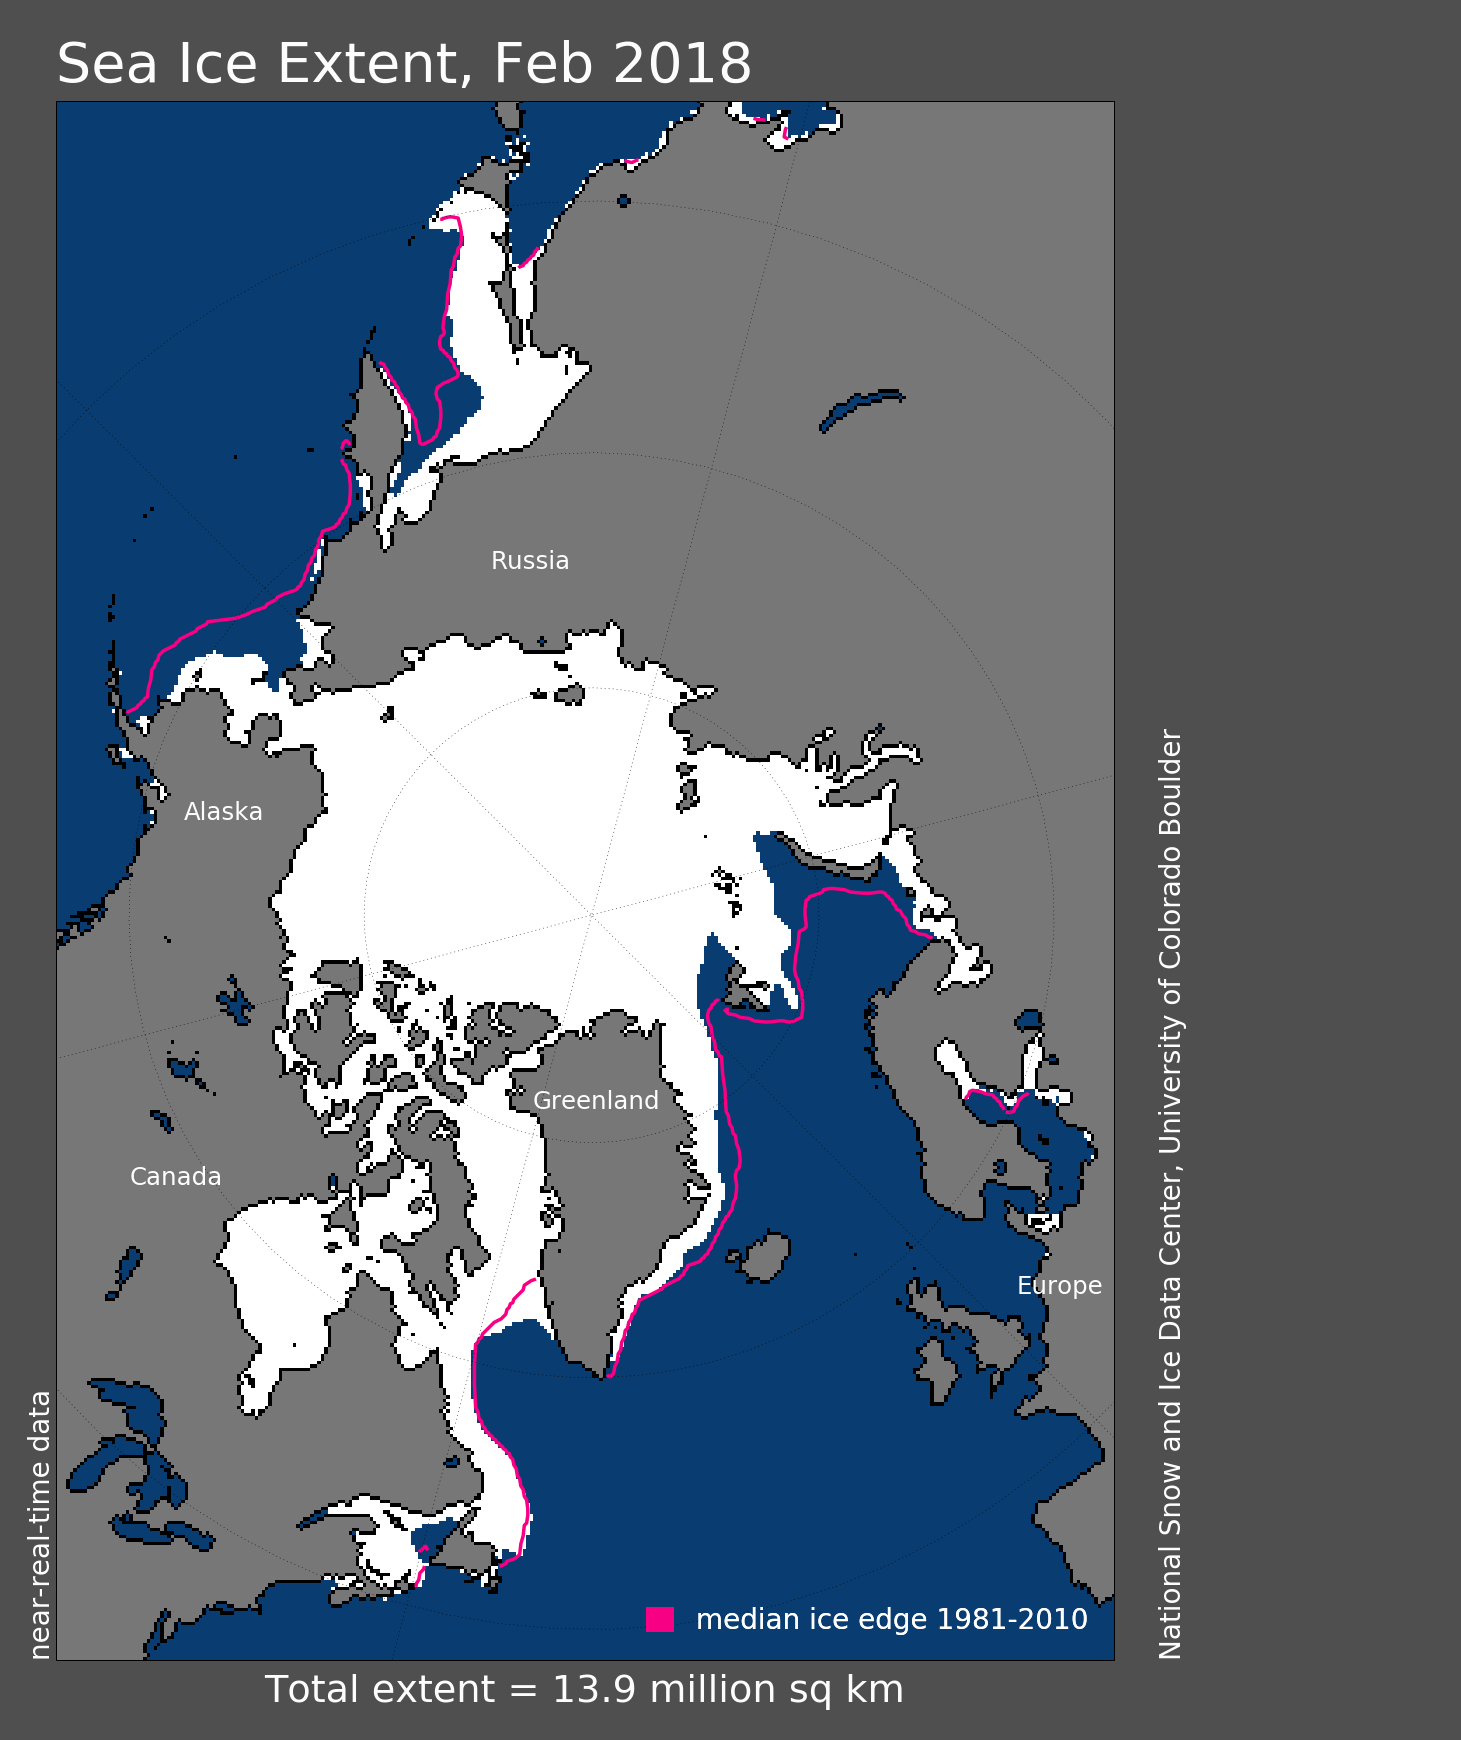
Figure 1. Arctic sea ice extent for February 2018 was 13.95 million square kilometers (5.39 million square miles). The magenta line shows the 1981 to 2010 average extent for that month. Sea Ice Index data. About the data
Credit: National Snow and Ice Data Center
High-resolution image
Winter continues to be mild over the Arctic Ocean. Sea ice extent remained at record low daily levels for the month. Arctic sea ice extent for February 2018 averaged 13.95 million square kilometers (5.39 million square miles). This is the lowest monthly average recorded for February, 1.35 million square kilometers (521,000 square miles) below the 1981 to 2010 average and 160,000 square kilometers (62,000) below the previous record low monthly average in 2017.
Extent was especially low in the Bering Sea where sea ice declined during the first three weeks of the month. The eastern part of the Bering Sea was largely ice-free for most of the month; extent was low on the western side, with the ice edge further north than normal. In the Chukchi Sea, extent also retreated during part of February, with open water developing north of the Bering Strait on both the Siberian and Alaskan coasts. As seen all winter, ice extent continued to be below average in the Barents Sea, and at the end of February, a wedge of open water formed north of Svalbard that extended well into the Arctic Ocean.
Conditions in context
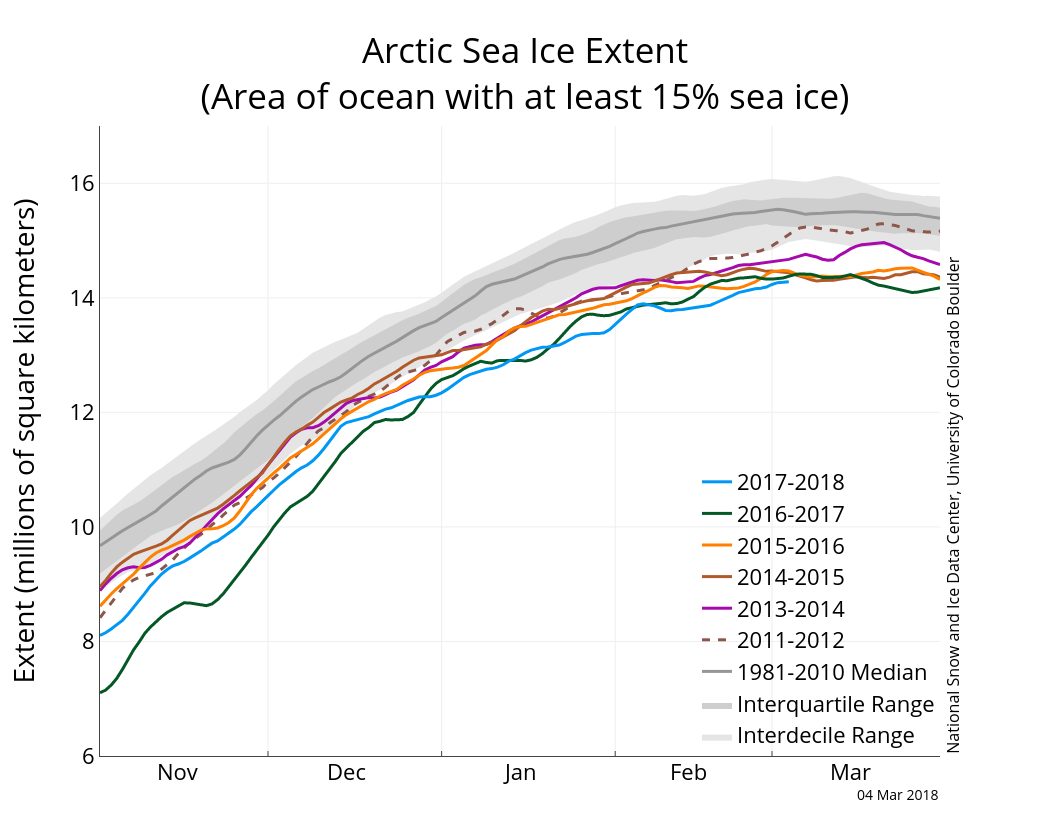
Figure 2a. The graph above shows Arctic sea ice extent as of March 4, 2018, along with daily ice extent data for four previous years. 2017 to 2018 is shown in blue, 2016 to 2017 in green, 2015 to 2016 in orange, 2014 to 2015 in brown, 2013 to 2014 in purple, and 2011 to 2012 in dotted brown. The 1981 to 2010 median is in dark gray. The gray areas around the median line show the interquartile and interdecile ranges of the data. Sea Ice Index data.
Credit: National Snow and Ice Data Center
High-resolution image
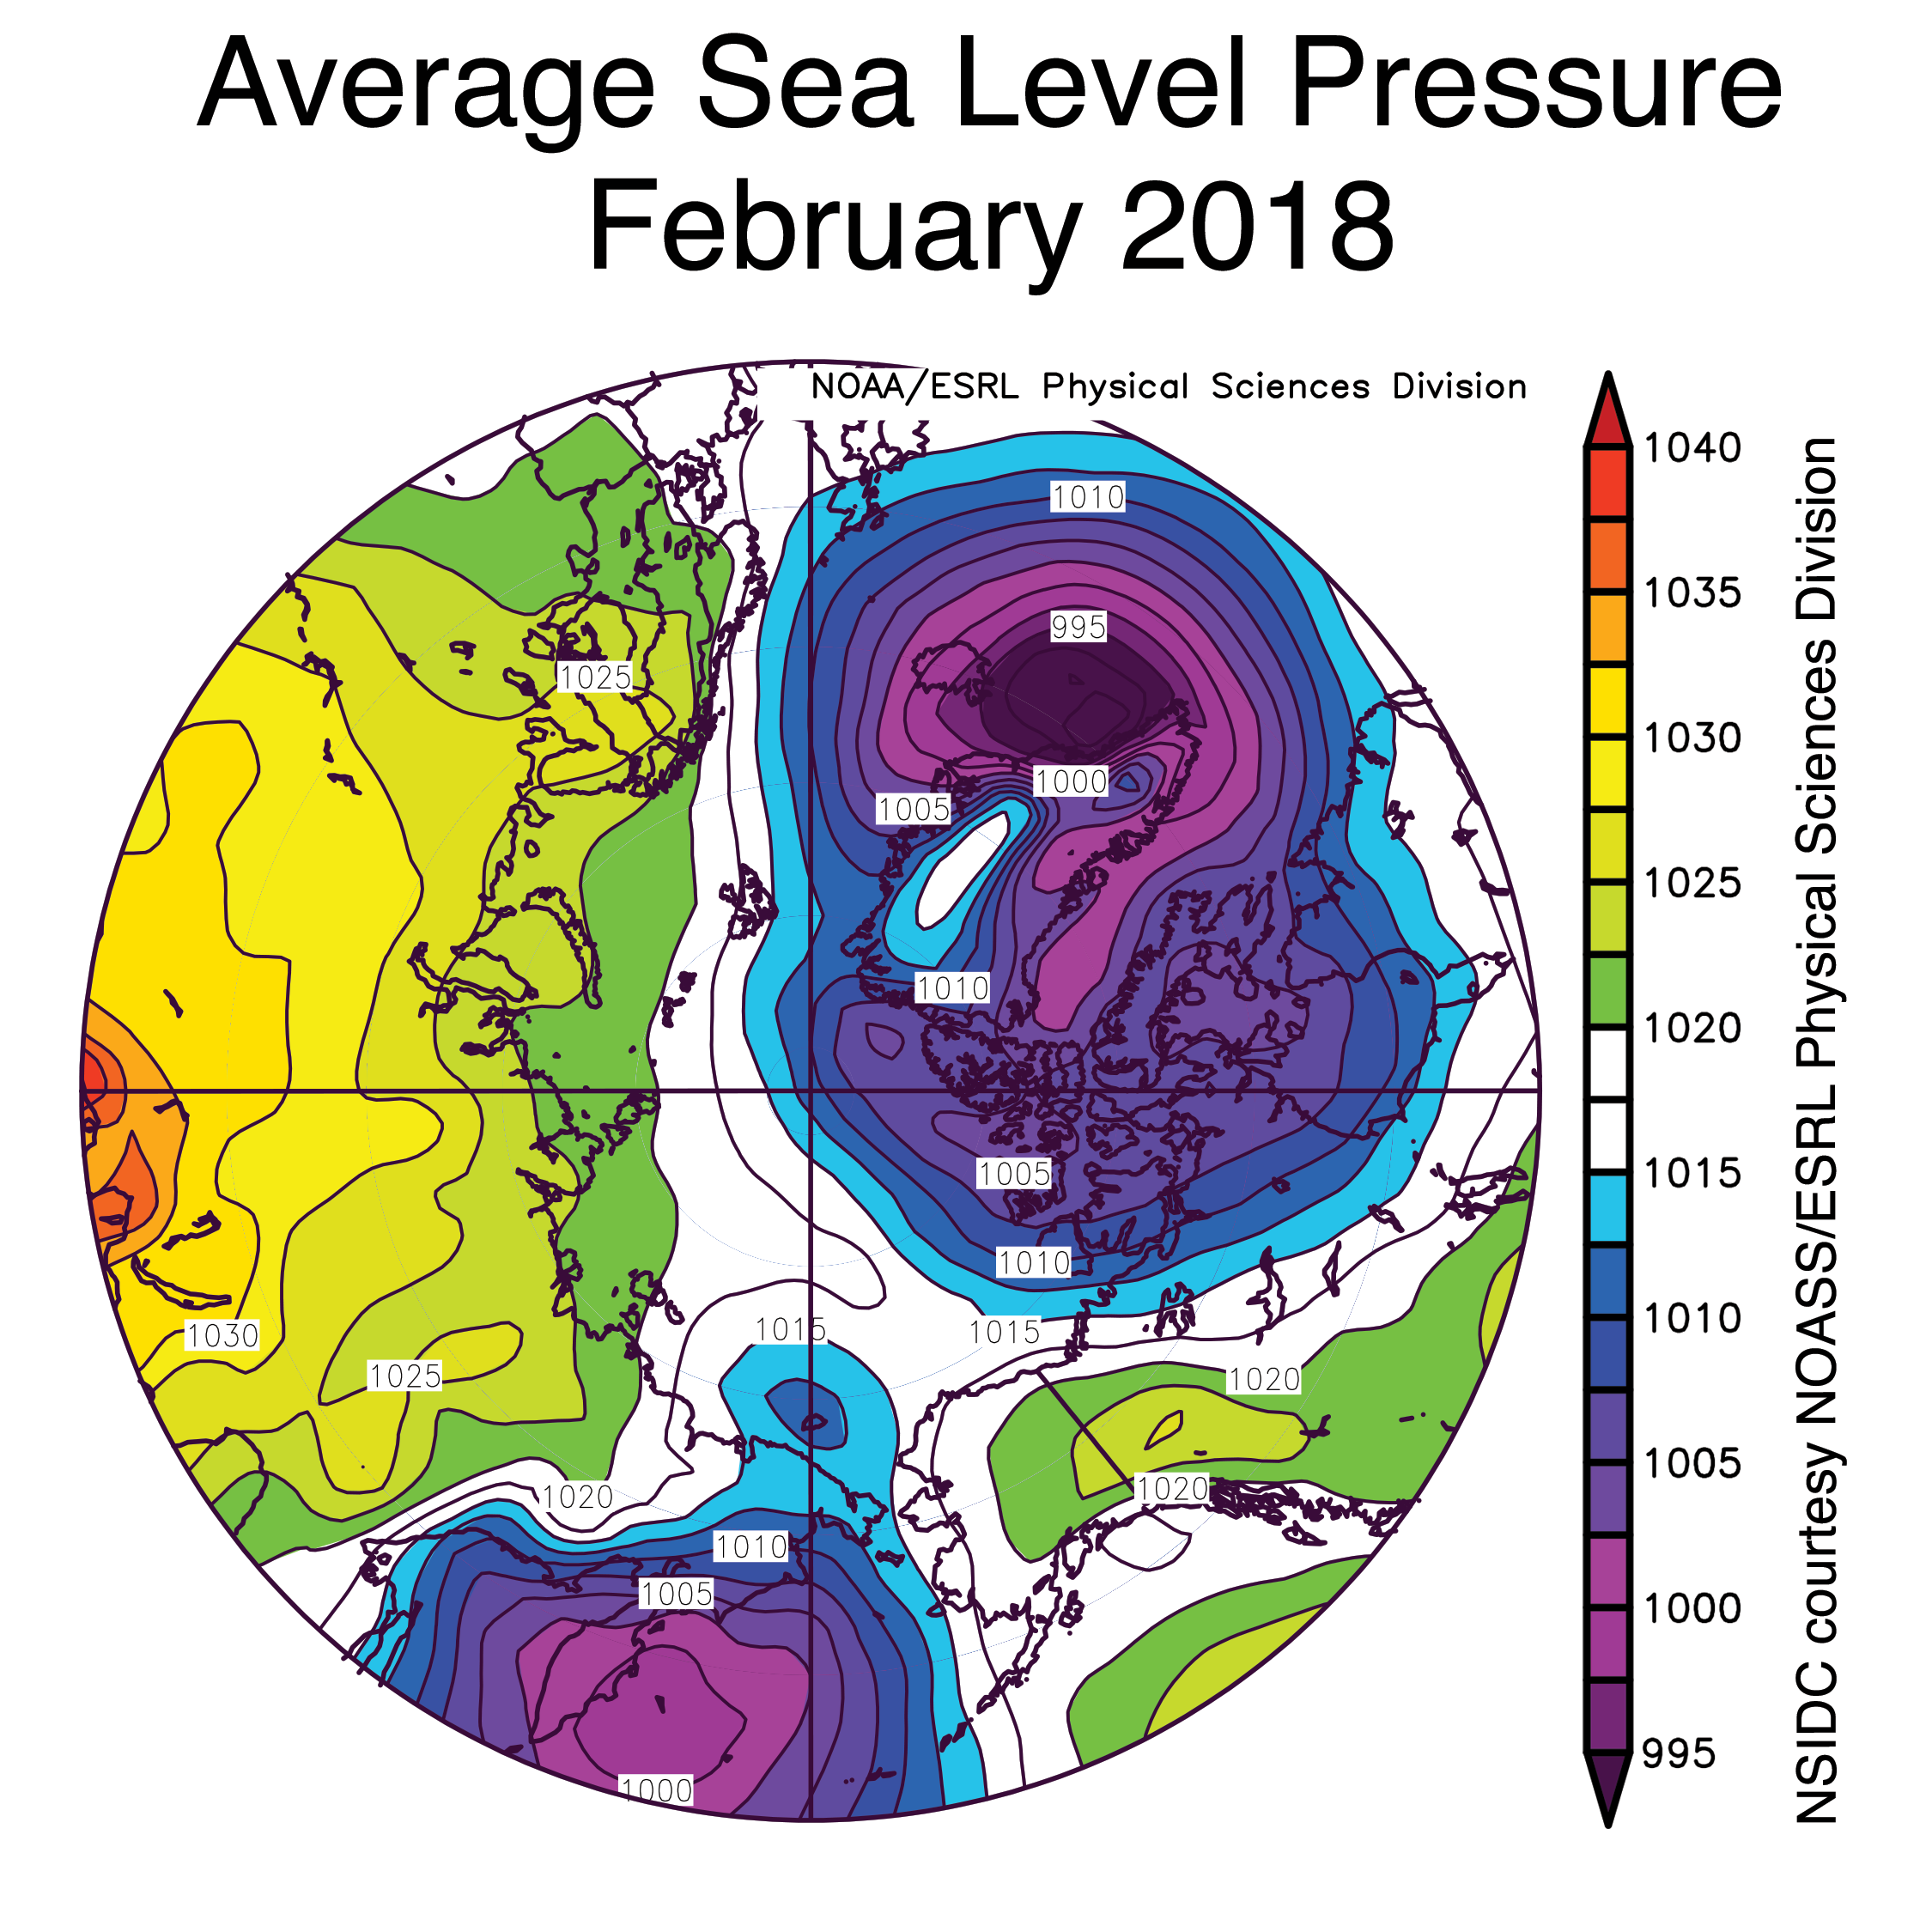
Figure 2b. This plot shows the average sea level pressures at the 925 hPa level for February 2018. Yellows and reds indicate higher than average air pressures; blues and purples indicate lower than average air pressures.
Credit: NSIDC courtesy NOAA Earth System Research Laboratory Physical Sciences Division
High-resolution image
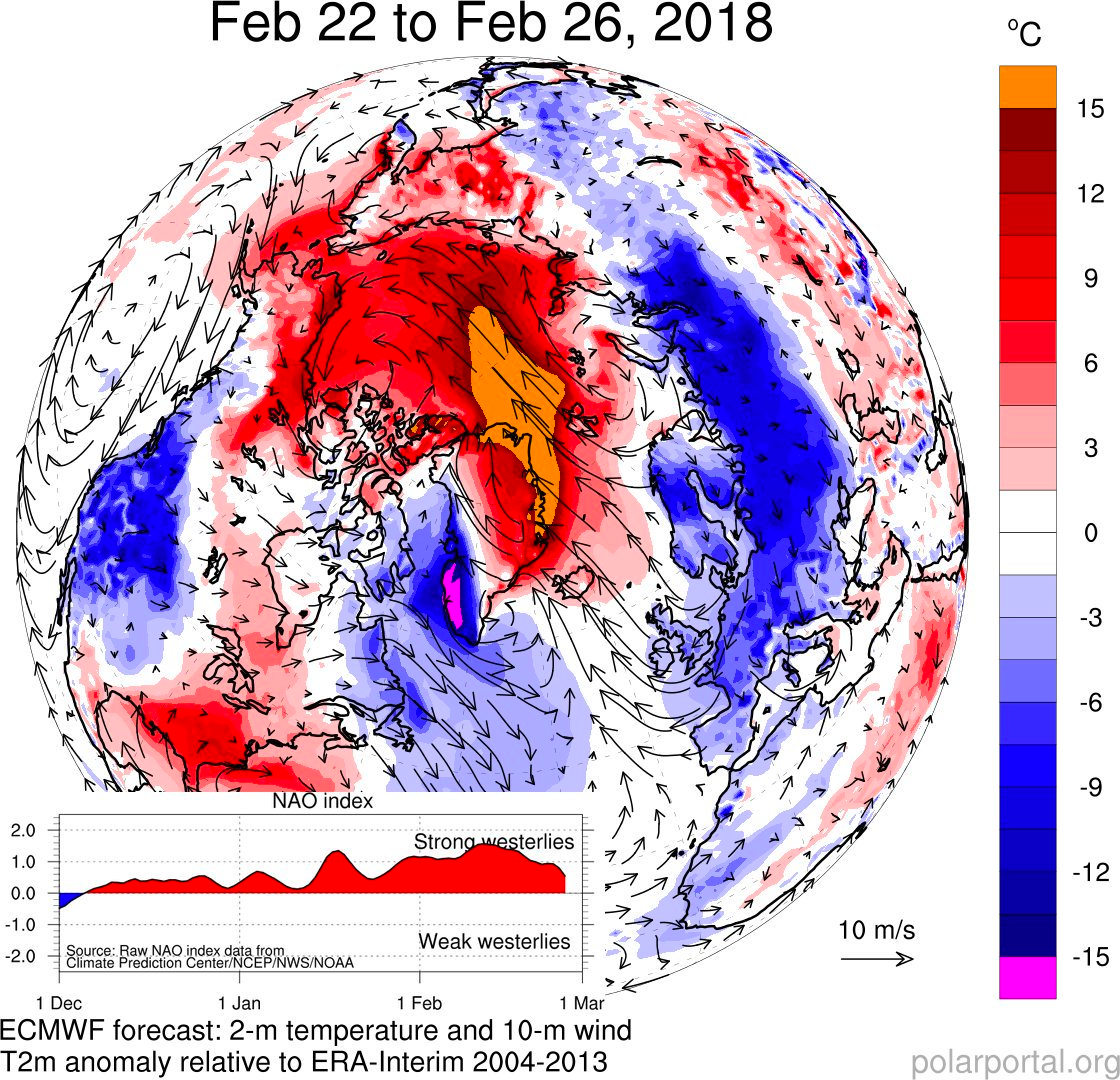
Figure 2c. This figure shows differences from average temperature in degrees Celsius, and wind conditions for the period February 22 to 26, 2018. In addition, the North Atlantic Oscillation (NAO) index is shown in the lower left. This is a measure of the strength of the westerly winds in the North Atlantic. When the index is negative, the flow is wavier, which increases the probability of transport of warm air to Greenland from the south.
Credit: European Centre for Medium-Range Weather Forecasts (ECMWF) IFS forecast model
High-resolution image
Low pressure centered just east of the Kamchatka Peninsula and high pressure centered over Alaska and the Yukon during February set up southerly winds that brought warm air and warm ocean waters into the Pacific side of the Arctic Ocean, impeding southward ice growth. This helps to explain the rapid loss of ice extent in the Bering Sea and the ice-free regions within the Chukchi Sea during the month. The warm air intrusion is evident in the 925 mb air temperatures, with monthly temperatures 10 to 12 degrees Celsius (18 to 22 degrees Fahrenheit) above average in the Chukchi and Bering Sea.
On the Atlantic side, low pressure off the southeast coast of Greenland and high pressure over northern Eurasia helped to funnel warm winds into the region and may have also enhanced the northward transport of oceanic heat. At the end of the month, this atmospheric circulation pattern was particularly strong, associated with a remarkable inflow of warm air from the south, raising the temperatures near the North Pole to above freezing, around 20 to 30 degrees Celsius (36 to 54 degrees Fahrenheit) above average. Air temperatures at Cape Morris Jesup in northern Greenland (83°37’N, 33°22’W) exceeded 0 degrees Celsius for several hours and open water formed to the north of Greenland at the end of the month. This is the third winter in a row in which extreme heat waves have been recorded over the Arctic Ocean. A study published last year by Robert Graham from the Norwegian Polar Institute showed that recent warm winters represent a trend towards increased duration and intensity of winter warming events within the central Arctic. While the Arctic has been relatively warm for this time of year, northern Europe was hit by extreme cold conditions at the end of February.
February 2018 compared to previous years
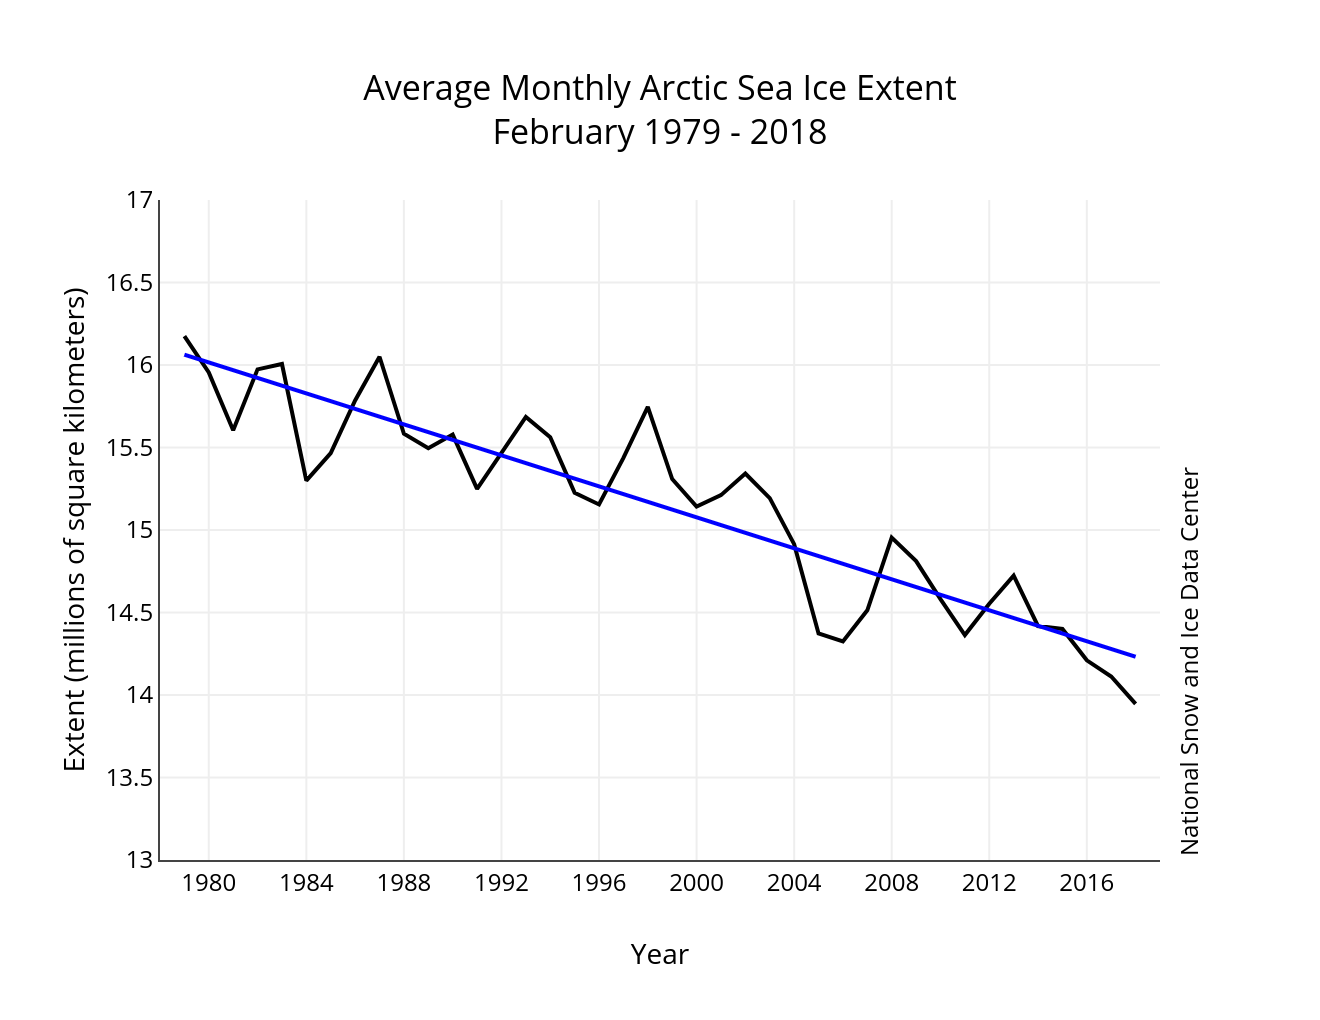
Figure 3. Monthly 2018 ice extent for 1979 to 2018 shows a decline of 3.1 percent per decade.
Credit: National Snow and Ice Data Center
High-resolution image
The linear rate of decline for February is 47,000 square kilometers per year (18,000 square miles per year), or 3.1 percent per decade.
Late freeze-up
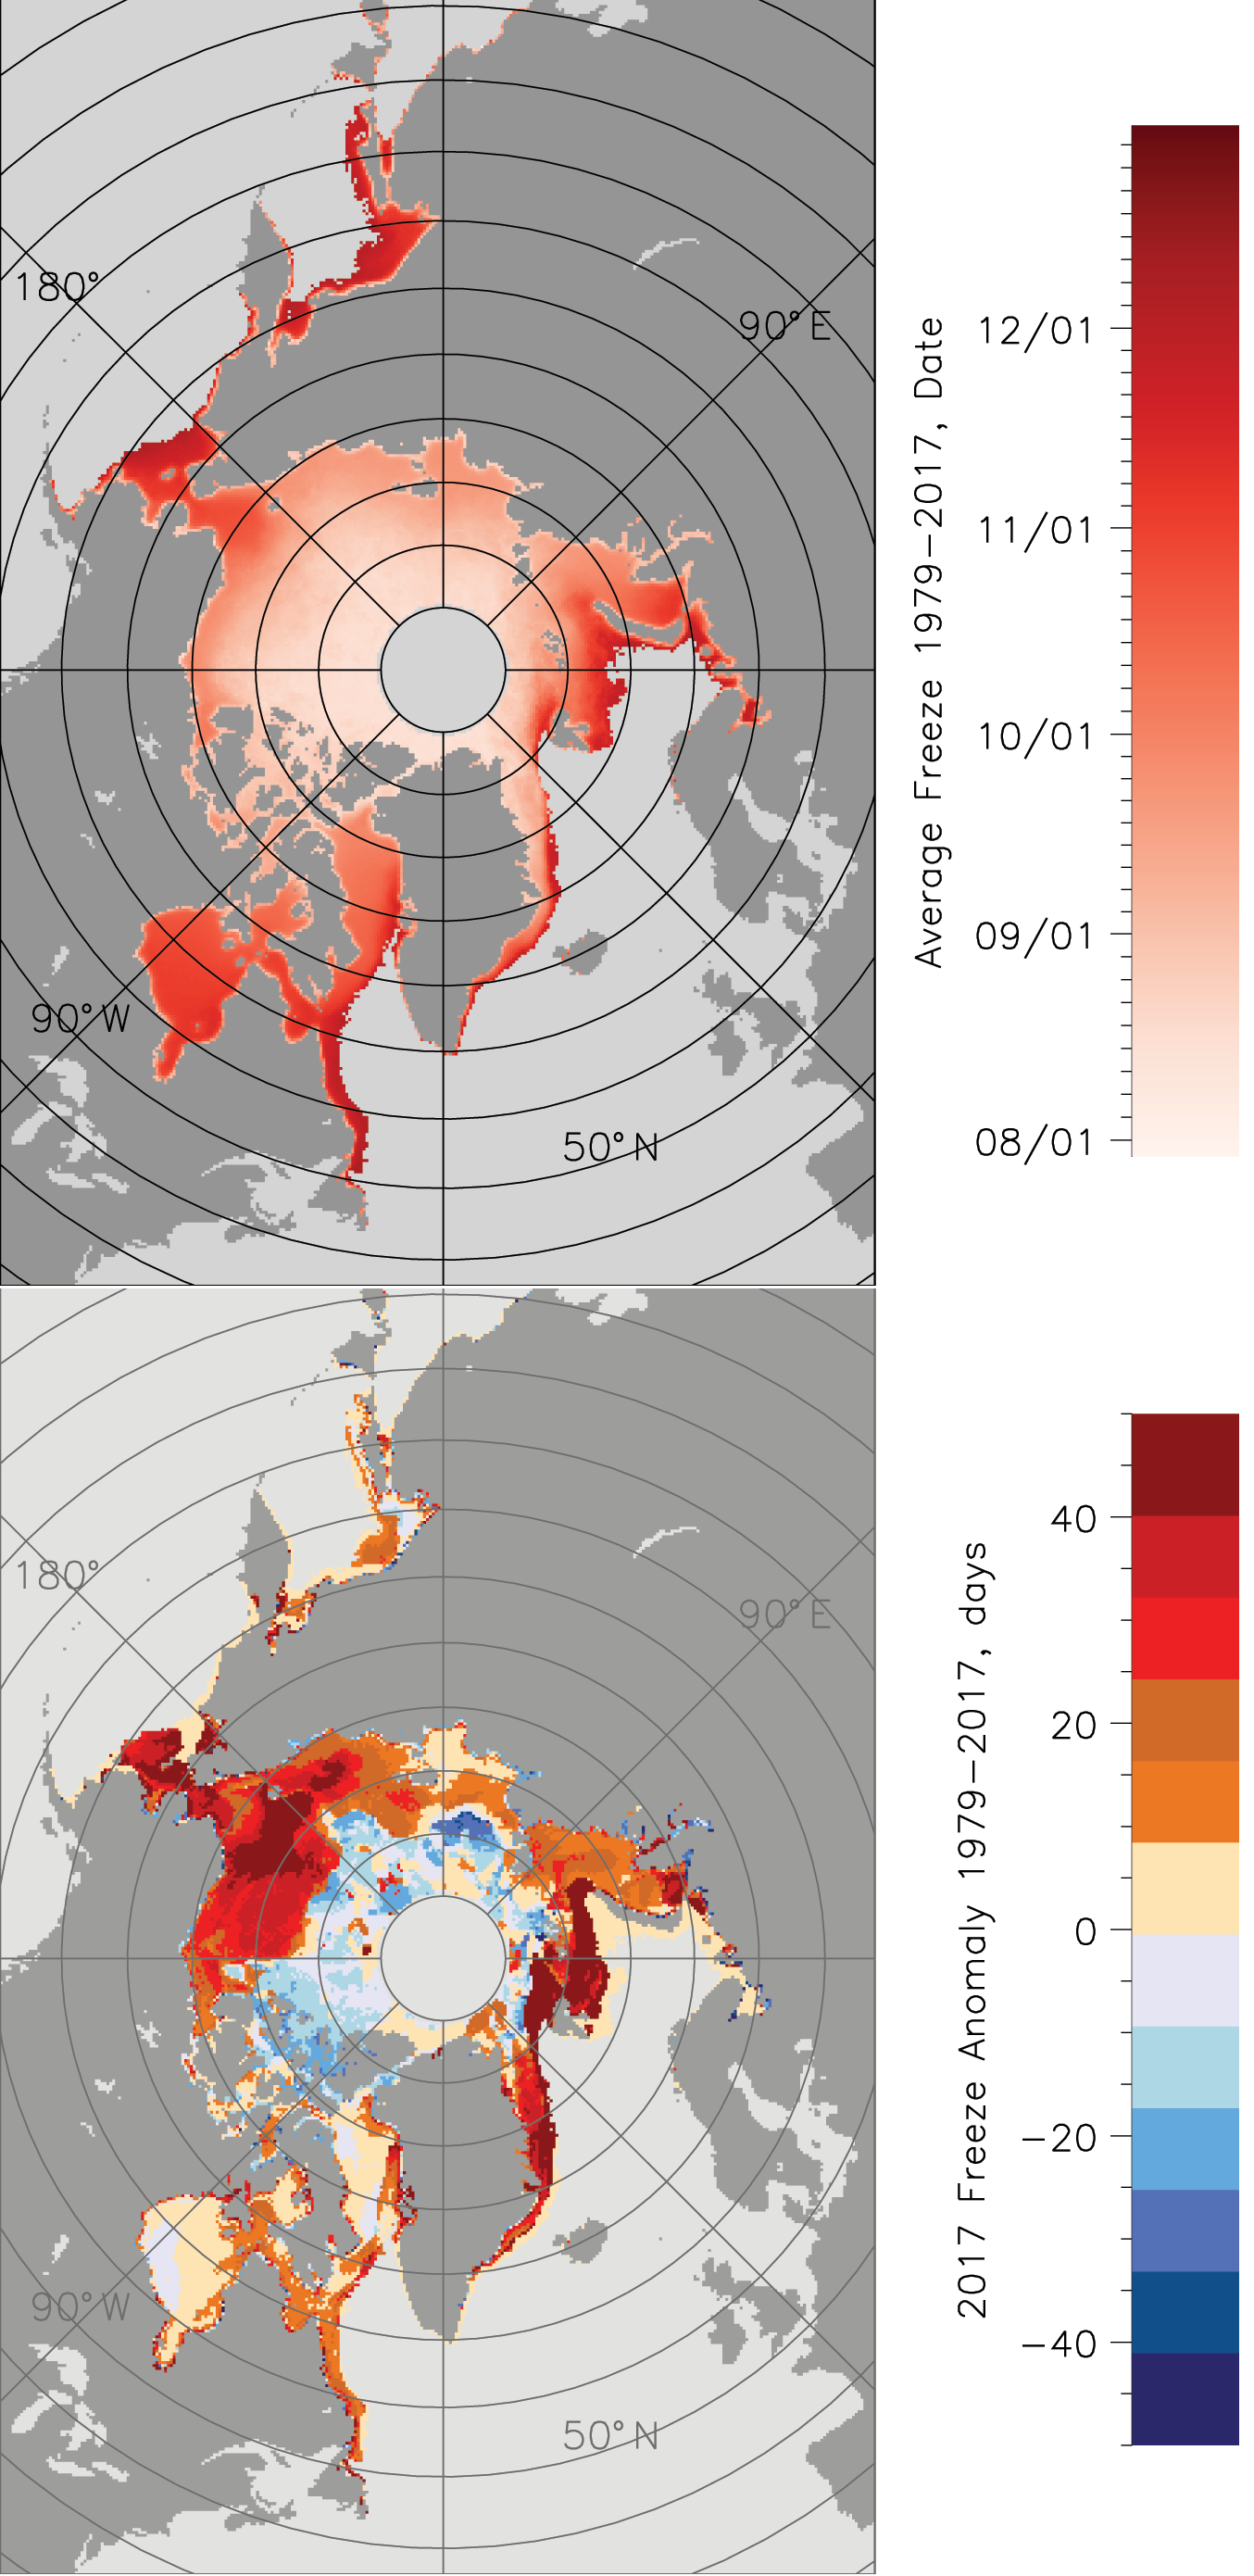
Figure 4. These graphs show the average Arctic Ocean ice freeze-up dates for 1979 to 2017 (top) and the number of days that freeze-up occurred earlier (cool colors) or later (warm colors) than average (bottom).
Credit: J. Miller, NASA Goddard Space Flight Center
High-resolution image
This year, the freeze-up started earlier than average over much of the central Arctic Ocean, near average within Hudson and Baffin Bays, but significantly later than average elsewhere. Freeze-up was delayed by more than a month later than average within the Chukchi and Bering Seas on the Pacific side, and within the Barents and East Greenland Seas on the Atlantic side. In these regions freeze-up happened after December. Later freeze-up impacts sea ice thickness, reducing the number of days over which sea ice can grow during winter.
Winter navigation in the Arctic without an icebreaker

Figure 5. This figure shows the distribution of Arctic sea ice according to stage of development, , as of February 22, 2018. Pink shows new ice; purple shows young ice; blue shows first year thin ice; orange shows first year medium ice, red shows first year thick ice, brown shows old ice, and while shows glacial ice.
Credit: U.S. National Ice Center
High-resolution image
The Arctic Ocean is becoming more accessible for shipping. Most of the increase in commercial shipping traffic has been during summer, primarily through the Northern Sea Route along the coast of Siberia. However, this February a commercial tanker, the Eduard Toll, made the first crossing of the Northern Sea Route in winter. Improvements in ship-building and the development of ice-strengthened hull technology is a major factor in enabling winter access. Previous ice-strengthened ships could only navigate safely through 0.5 meter thick ice, compared to the 1.8 meter thick ice that the Eduard Toll cruised through. A fleet of six ships with similar technology is being constructed by a South Korean shipbuilder.
While the Northern Sea Route has tended to be dominated by first-year ice, which typically reaches a maximum of around 2 meters, thicker (3- to 4-meter) multi-year ice would be a hazard even to the newer, stronger ships. According to analysis by the U.S. National Ice Center, this year’s old ice (multi-year ice) has pulled completely away from the coast and the Northern Sea Route is dominated by first-year medium (0.7- to 1.2-meter) or first-year thick (1.2- to 2-meter) ice.
Opposite pole, same near-record low extent
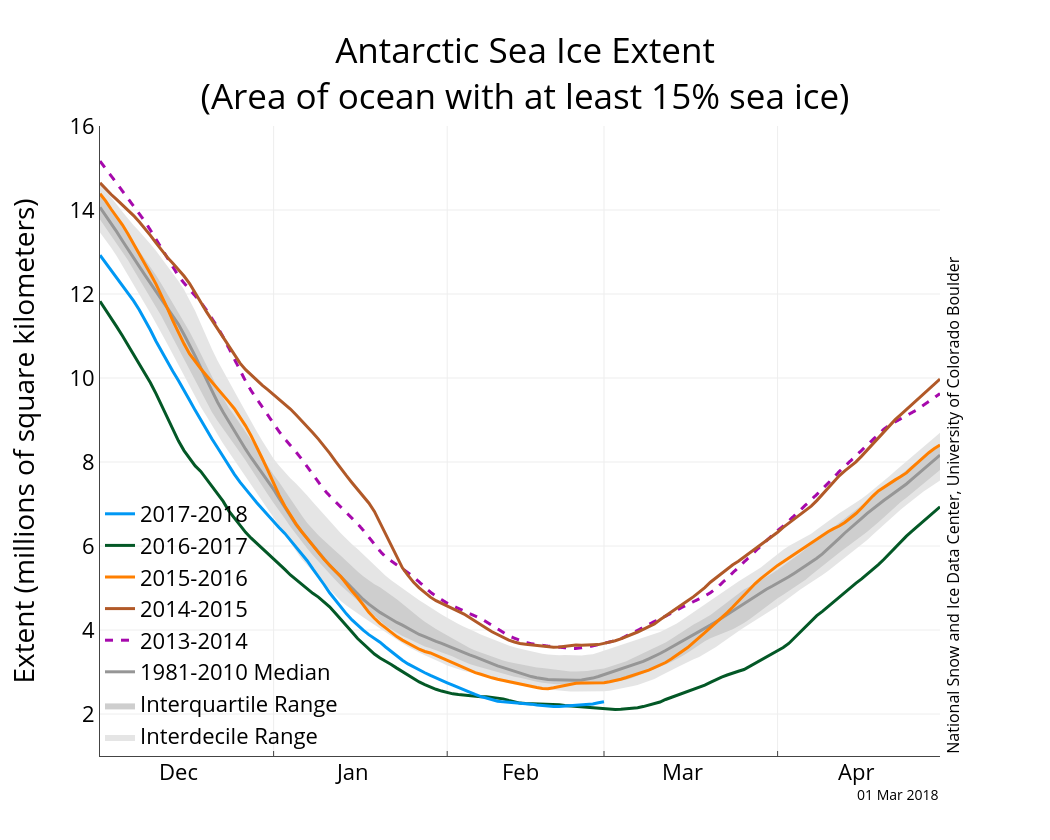
Figure 6a. The graph above shows Antarctic sea ice extent as of March 1, 2018, along with daily ice extent data for four previous years. 2017 to 2018 is shown in blue, 2016 to 2017 in green, 2015 to 2016 in orange, 2014 to 2015 in brown, 2013 to 2014 in purple, and 2011 to 2012 in dotted magenta. The 1981 to 2010 median is in dark gray. The gray areas around the median line show the interquartile and interdecile ranges of the data. Sea Ice Index data.
Credit: National Snow and Ice Data Center
High-resolution image

Figure 6b. This figure shows Antarctic sea ice extent for February 28, 2018. Sea Ice Index data. About the data
Credit: National Snow and Ice Data Center
High-resolution image
In the Antarctic, sea ice extent reached its daily seasonal minimum, 2.18 million square kilometers (842,000 square miles), on February 20 and 21. This is the second lowest minimum extent in the satellite record, 70,000 square kilometers (27,000 square miles) above the record low, which was set on March 3, 2017. The February average was 2.29 million square kilometers (884,000 square miles), second lowest in the satellite record, and 20,000 square kilometers (7,700 square miles) above the record low February in 2017.
Sea ice in the Antarctic is highly variable from year to year—much more so than in the Arctic. This is clearly seen in the February extent values, where low 2011 values were followed by record or near-record highs in 2013, 2014, and 2015. This was then followed by record or near-record lows in 2017 and this year.
Sea ice extent is particularly low in the Ross and western Amundsen Sea region, and along the southern reaches of the Bellingshausen Sea. Patchy sea ice areas along the East Antarctic coast are near-average in extent.
Further reading
Graham, R. M., L. Cohen, A. A. Petty, L. N. Boisvert, A. Rinke, S.R. Hudson, M. Nicolaus, and M. A. Granskog. 2017. Increasing frequency and duration of Arctic winter warming events, Geophys. Res. Lett., 16, 6974-6983, doi:10.1002/2017GL073395.
Kretschmer, M., D. Coumou, L. Agel, M. Barlow, E. Tziperman, and J. Cohen. 2017. More persistent weak stratospheric polar vortex states linked to cold extremes, Bull. Amer. Meteor. Soc., doi:10.1175/BAMS-D-16-0259.1.
Sea ice tracking low in both hemispheres
January of 2018 began and ended with satellite-era record lows in Arctic sea ice extent, resulting in a new record low for the month. Combined with low ice extent in the Antarctic, global sea ice extent is also at a record low.
Overview of conditions
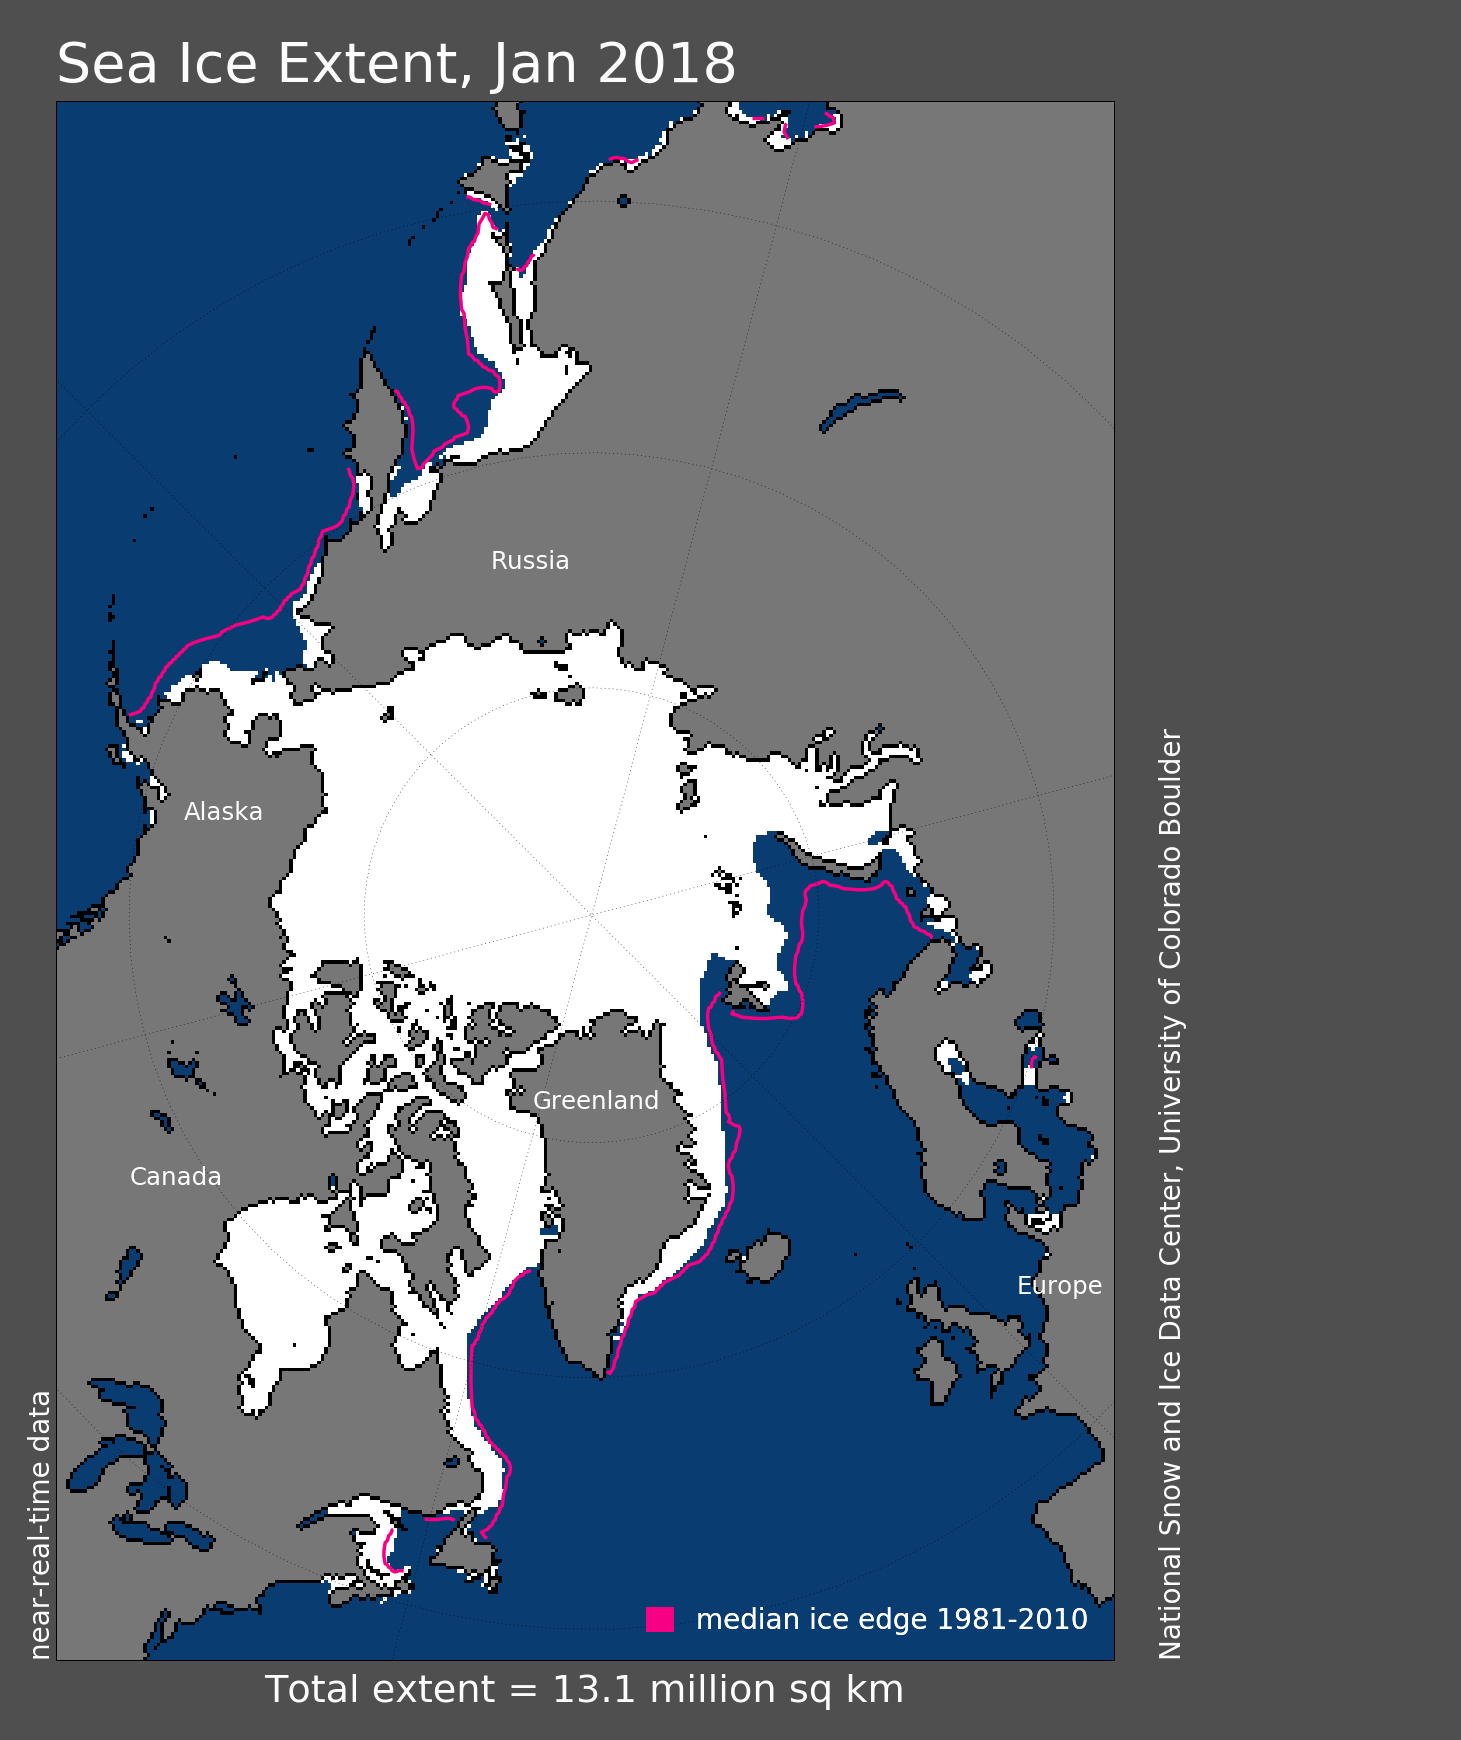
Figure 1. Arctic sea ice extent for January 2018 was 13.06 million square kilometers (5.04 million square miles). The magenta line shows the 1981 to 2010 average extent for that month. Sea Ice Index data. About the data
Credit: National Snow and Ice Data Center
High-resolution image
The new year was heralded by a week of record low daily ice extents, with the January average beating out 2017 for a new record low. Ice grew through the month at near-average rates, and in the middle of the month daily extents were higher than for 2017. However, by the end of January, extent was again tracking below 2017. The monthly average extent of 13.06 million square kilometers (5.04 million square miles) was 1.36 million square kilometers (525,000 square miles) below the 1981 to 2010 average, and 110,000 square kilometers (42,500 square miles) below the previous record low monthly average in 2017.
The pattern seen in previous months continued, with below average extent in the Barents and Kara Seas, as well as within the Bering Sea. The ice edge remained nearly constant throughout the month within the Barents Sea, and slightly retreated in the East Greenland Sea. By contrast, extent increased in the Gulf of St. Lawrence, off the coast of Newfoundland, in the eastern Bering Sea and the Sea of Okhotsk. Compared to 2017, at the end of the month, ice was less extensive in the western Bering Sea, the Sea of Okhotsk and north of Svalbard, more extensive in the eastern Bering Sea and in the Gulf of St. Lawrence. Overall, the Arctic gained 1.42 million square kilometers (548,000 square miles) of ice during January 2018.
Conditions in context
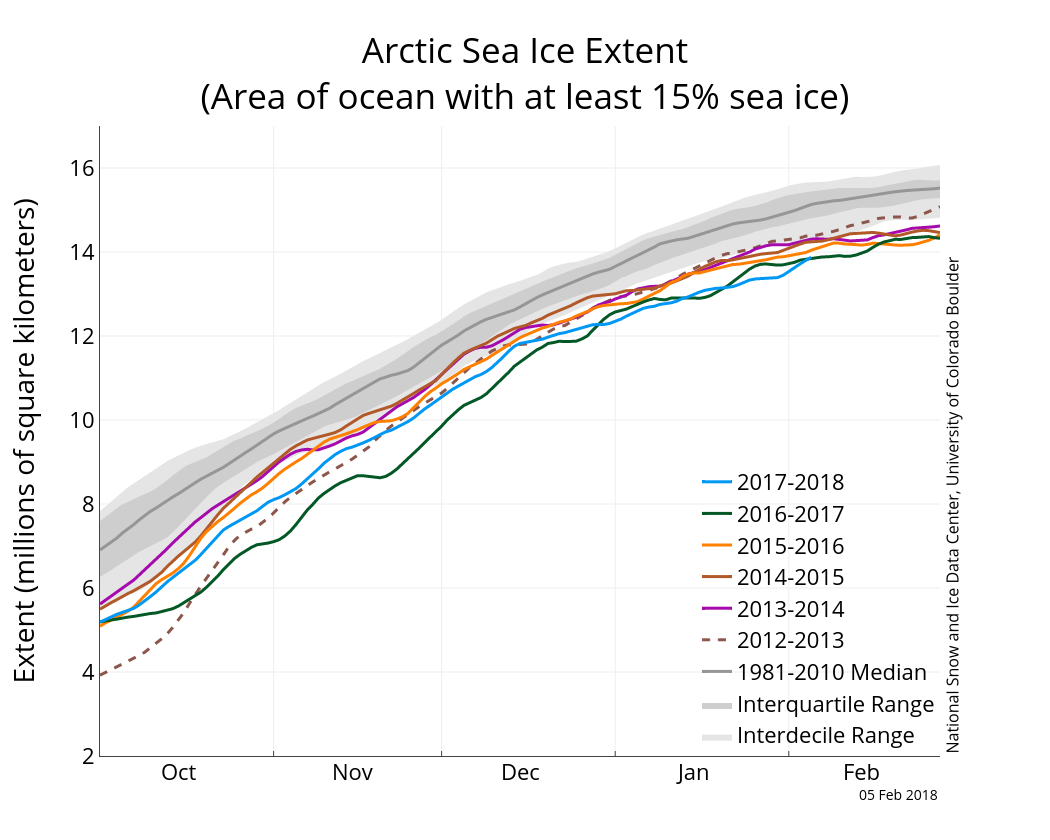
Figure 2a. The graph above shows Arctic sea ice extent as of February 5, 2018, along with daily ice extent data for five previous years. 2017 to 2018 is shown in blue, 2016 to 2017 in green, 2015 to 2016 in orange, 2014 to 2015 in brown, 2013 to 2014 in purple, and 2012 to 2013 in dotted brown. The 1981 to 2010 median is in dark gray. The gray areas around the median line show the interquartile and interdecile ranges of the data. Sea Ice Index data.
Credit: National Snow and Ice Data Center
High-resolution image
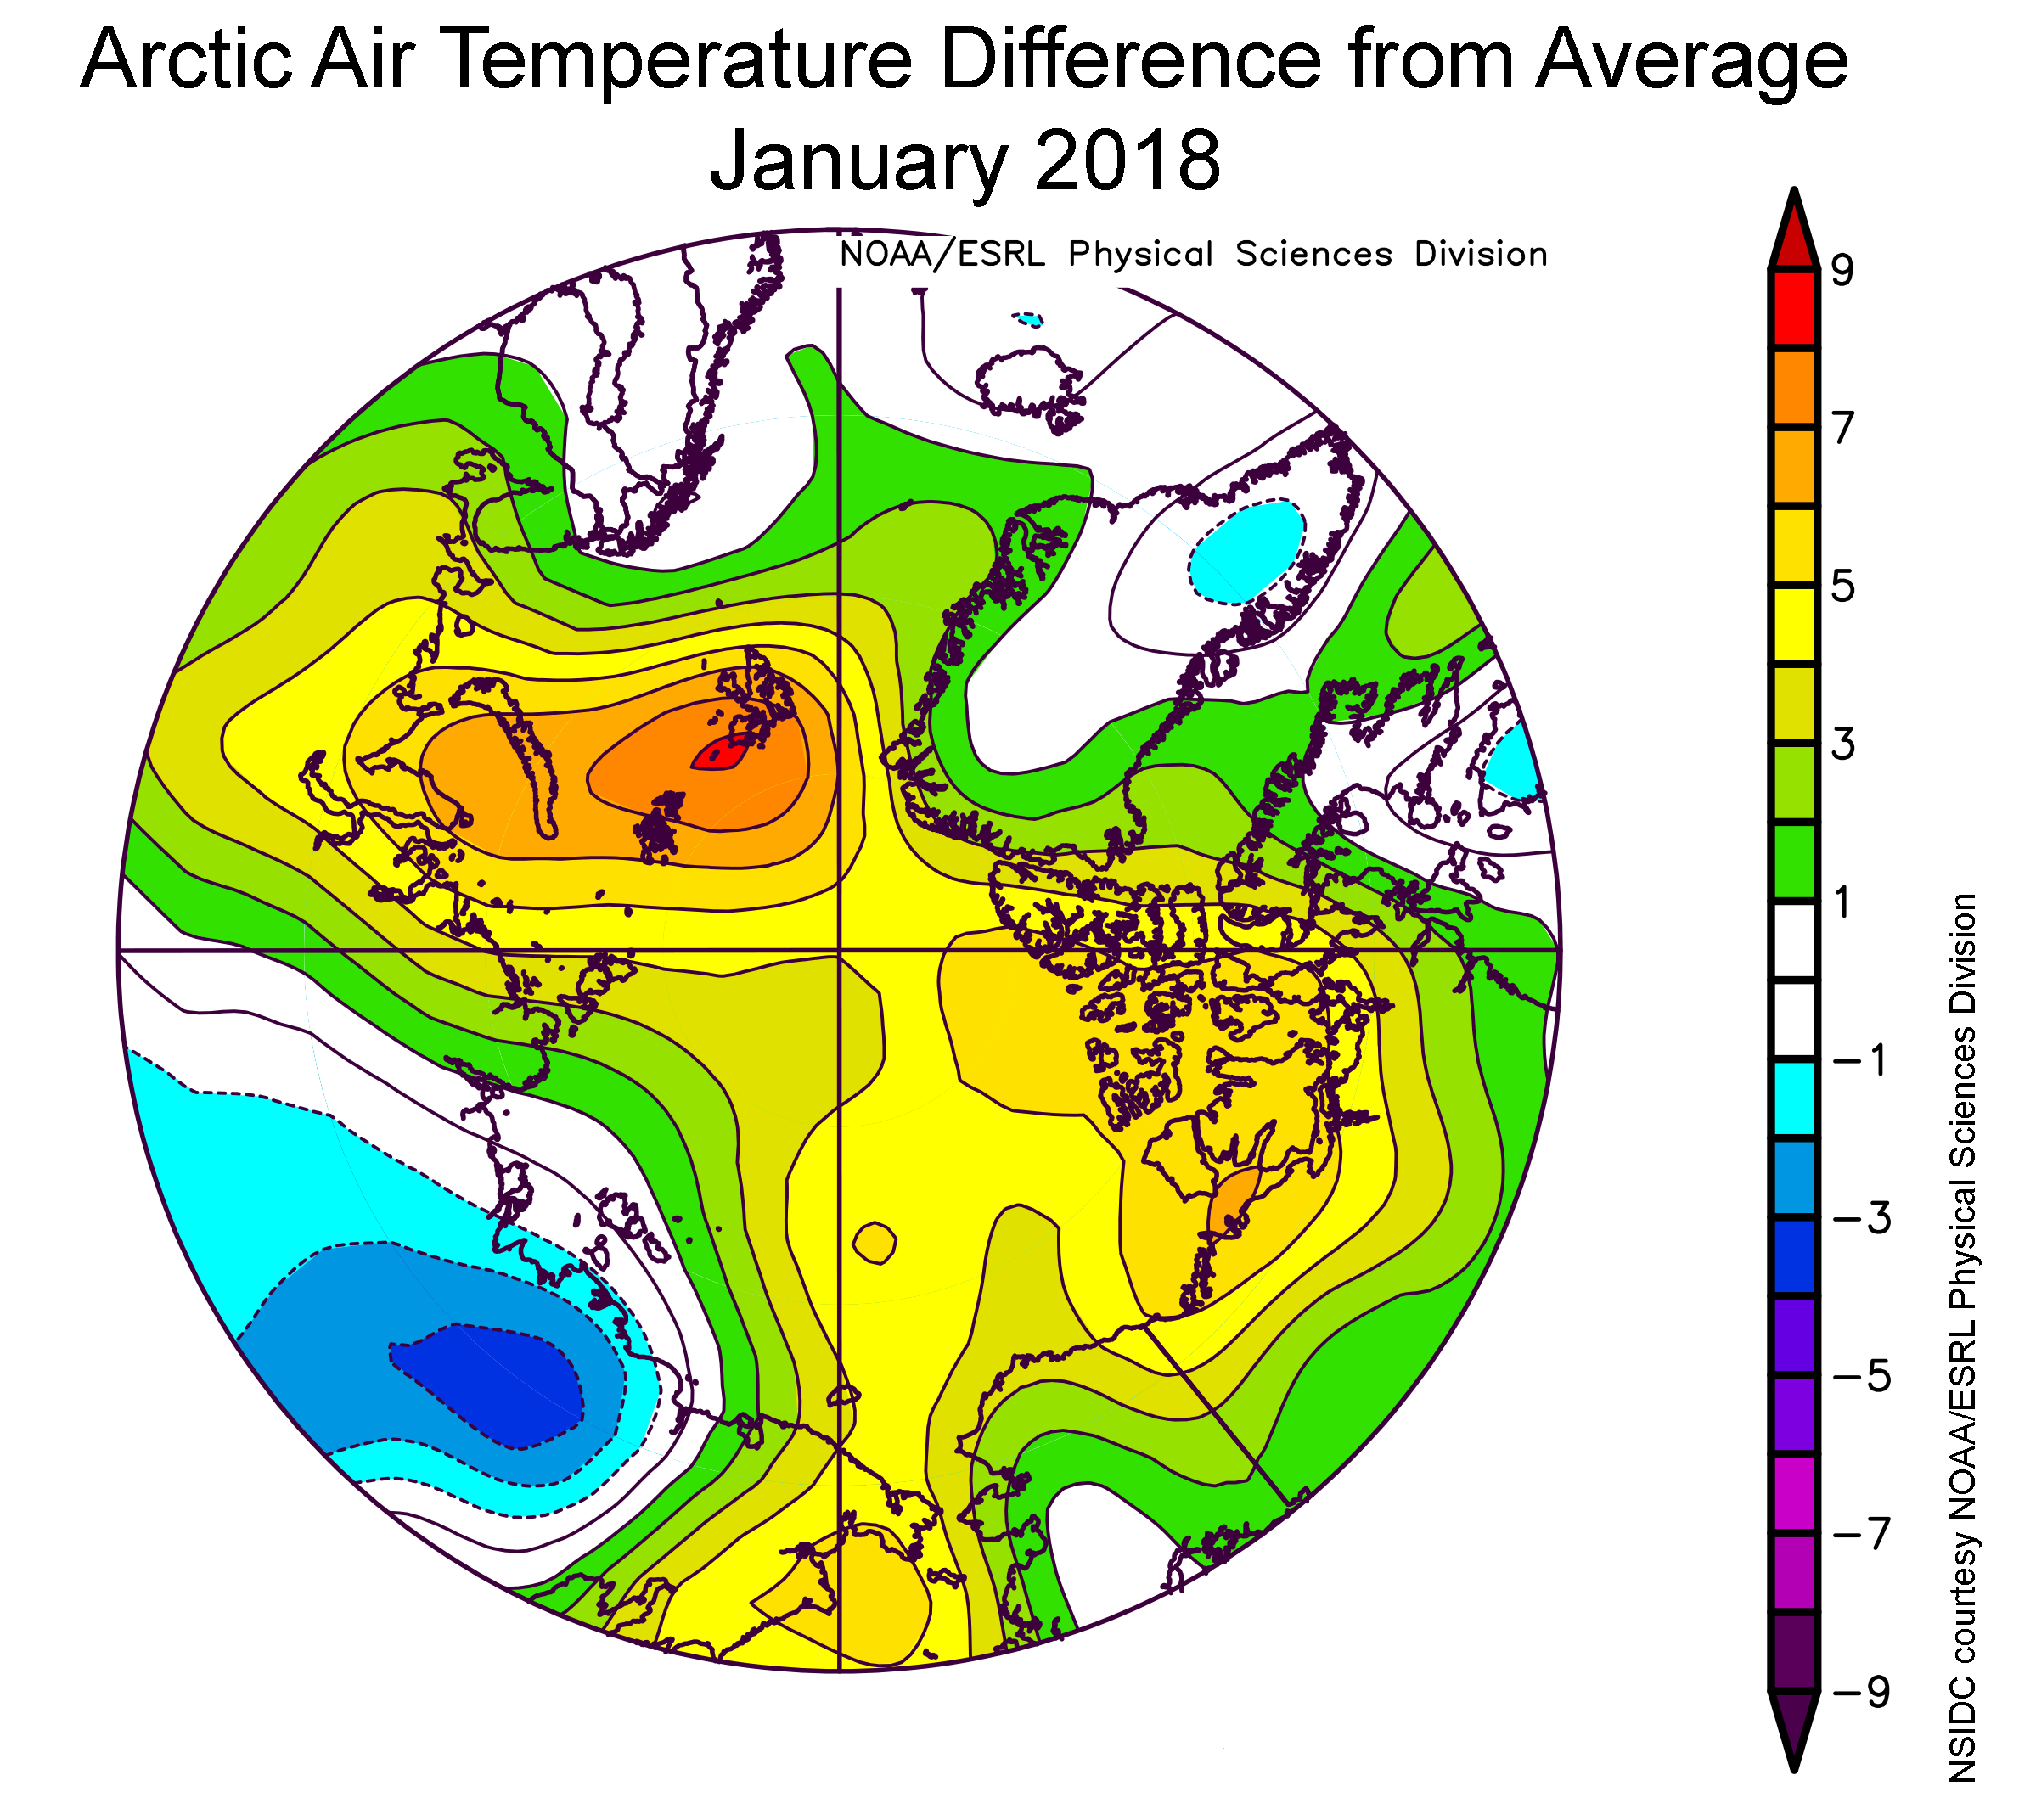
Figure 2b. The plot shows air temperatures in degrees Celsius in the Arctic as difference from average for January 2018. Yellows, oranges, and reds indicate higher than average temperatures; blues and purples indicate lower than average temperatures.
Credit: NSIDC courtesy NOAA/ESRL Physical Sciences Division
High-resolution image
Air temperatures at the 925 hPa level (about 2,500 feet above sea level) remained unusually high over the Arctic Ocean (Figure 2b). Nearly all of the region was at least 3 degrees Celsius (5 degrees Fahrenheit) or more above average. The largest departures from average of more than 9 degrees Celsius (16 degrees Fahrenheit) were over the Kara and Barents Seas, centered near Svalbard. On the Pacific side, air temperatures were about 5 degrees Celsius (9 degrees Fahrenheit) above average. By contrast, 925 hPa temperatures over Siberia were up to 4 degrees Celsius (7 degrees Fahrenheit) below average. The warmth over the Arctic Ocean appears to result partly from a pattern of atmospheric circulation bringing in southerly air, and partly from the release of heat into the atmosphere from open water areas. Sea level pressure was higher than average over the central Arctic Ocean, stretching towards Siberia. This pattern, coupled with below average sea level pressure over the Chukchi and Bering seas, helped to move warm air from Eurasia over the central Arctic Ocean.
Ice growth for January averaged 37,000 square kilometers (14,000 square miles) per day, close to the average rate for the month of 42,700 square kilometers per day (16,486 square miles per day). In the Barents Sea, the ice extent was the second lowest during the satellite data record. Ice conditions in this region of the Arctic are increasingly viewed as important in having downstream effects on atmospheric circulation. These proposed links include northward expansion of the Siberian High and cooling over northern Eurasia.
January 2018 compared to previous years
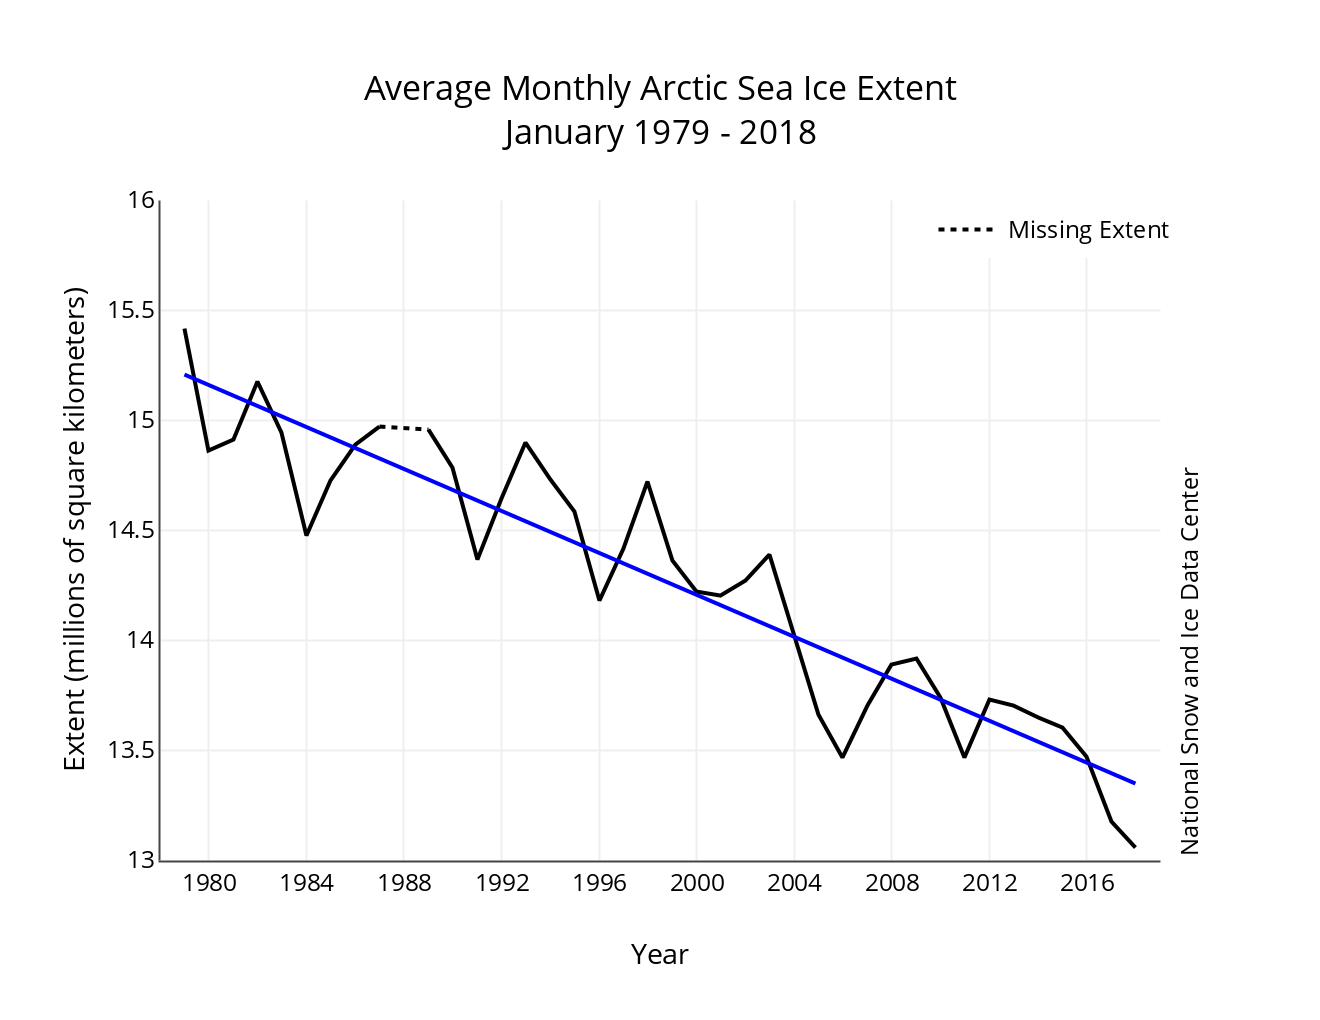
Figure 3. Monthly January ice extent for 1979 to 2018 shows a decline of 3.3 percent per decade.
Credit: National Snow and Ice Data Center
High-resolution image
The linear rate of decline for January is 47,700 square kilometers (18,400 square miles) per year, or 3.3 percent per decade.
Engaging stakeholders in sea ice forecasting

Figure 4. These graphs show changes in polar tourism based on membership in the Association of Arctic Expedition Cruise Operators (AECO, top), and by the number and type of Arctic vessels operated or managed (bottom).
Credit: Kelvin Murray, Director, Expedition Operations EYOS Expeditions
High-resolution image
Uncertainty about future sea ice conditions presents challenges to industry, policymakers, and planners responsible for economic, safety, and risk mitigation decisions. The ability to accurately forecast the extent and duration of sea ice on different timescales is relevant to a wide range of Arctic maritime activities. While there have been considerable advances in sea ice forecasting over the past decade, it remains unclear how well end users are able to utilize these products and services in their planning. In response, the Sea Ice Prediction Network, in collaboration with several sponsors, held a workshop at the Arctic Frontiers Conference in Tromsø, Norway to foster dialogue between stakeholders and sea ice forecasters.
Conference attendees recognized that the sea ice forecasting community and users of these forecasts need a common language. Often forecast users do not understand the data presented by forecasters, nor do they have the skills to interpret the complex data products. Most marine operators in the Arctic require accurate daily to short-term (< 72 hours) information on the sea ice edge and near-ice-edge concentration. Forecast users often want additional information such as ice strength, ice thickness and ice drift. These data need to be accessed in a user-friendly format that can be easily downloaded (e.g., to a ship at sea). Typically, ice charts from national ice centers or high-resolution Synthetic Aperture Radar image maps are used for describing and analyzing sea ice for real-time navigation.
Longer-term seasonal ice forecasts are potentially useful to the polar marine industry but are not yet being relied upon. While improving, the uncertainty in these forecasts has not been clearly communicated. Nevertheless, logistics planners are interested in using longer-term forecasts, mostly to augment or extend more timely data or in-house diagnostics. Tour operators in particular desire seasonal and even two- to three-year forecasts so that they can plan what to offer their customers. Along with the increase in polar tourism (Figure 4), there is also significant industry traffic in the European Arctic, the Northwest Passage and some areas in the Northern Sea Route. Due to the decreasing ice cover, we can expect an extension of the seasonal activity, with ships embarking earlier and ending their journeys later than in previous years. This underscores the need for accurate forecasting, extending to the more variable shoulder seasons of Arctic sea ice.
Importance of ice drift
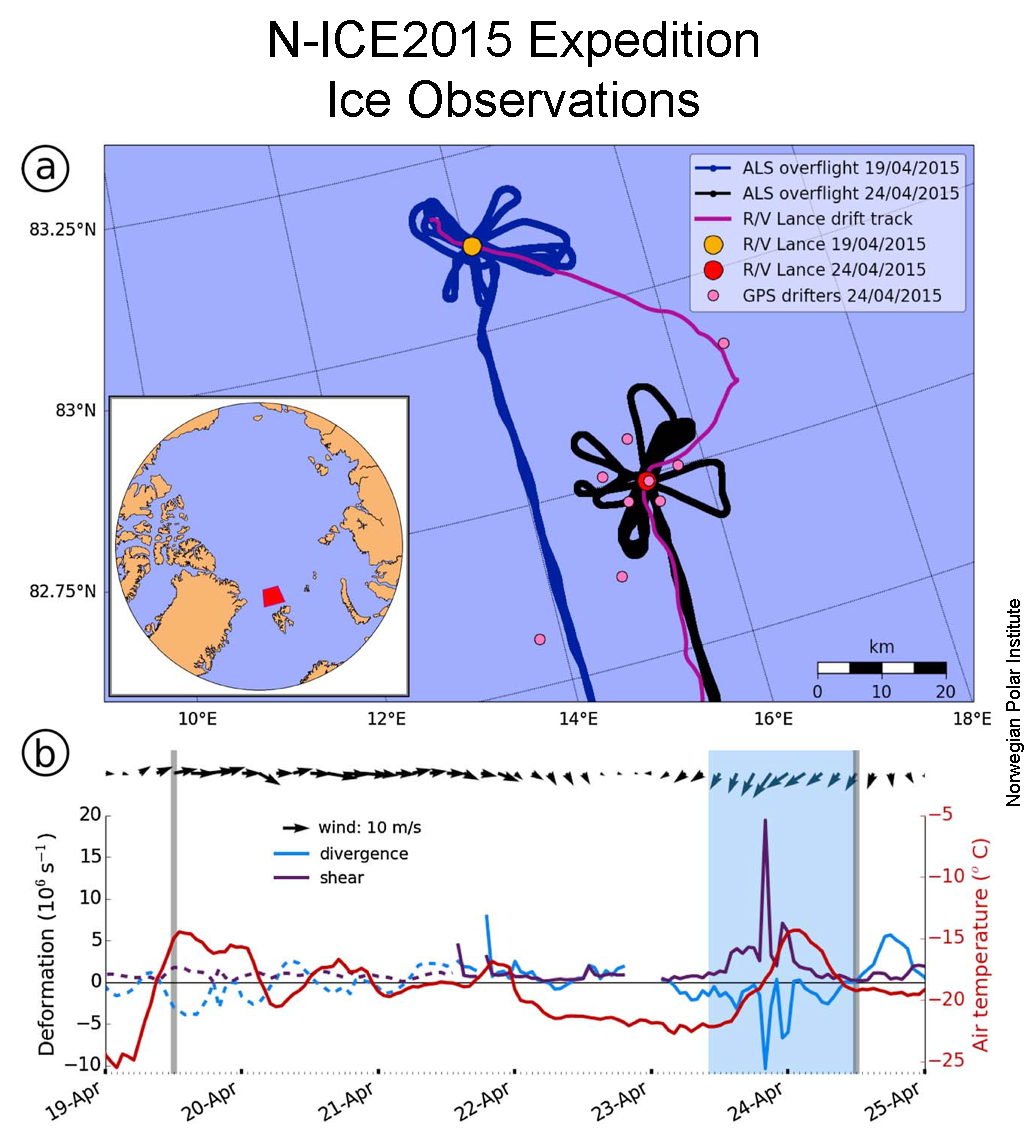
Figure 5. The top figure shows the location of the R/V Lance during the N-ICE2015 expedition (pink lines) with aircraft flight lines shown in black and blue. The bottom figure shows a time series of wind speed and direction, together with rates of ice divergence (blue line) and shear (purple line). Figure from Itkin et al. 2017.
Credit: Norwegian Polar Institute
High-resolution image
As the Arctic sea ice cover continues to thin, convergent sea ice motion can more readily pile up ice into large ridges. Such ridges can be hazardous to marine activities in the Arctic. Divergent ice motion produces openings in the ice called leads, where new ice can readily grow. Winds are the main driver for both ridging and lead formation. A single storm event can lead to significant redistribution of sea ice mass through ridging and new leads. As part of the Norwegian Young Sea ICE (N-ICE2015) expedition, colleagues at the Norwegian Polar Institute made detailed sea ice thickness and ice drift observations before and after a storm in an area north of Svalbard (Figure 5). Results showed that about 1.3 percent of the level sea ice volume was pressed together into ridges. Combined with new ice formation in leads, the overall ice volume increased by 0.5 percent. While this is a small number, sea ice in the North Atlantic is typically impacted by 10 to 20 storms each winter, which could account for 5 to 10 percent of ice volume each year.
Antarctic sea ice also low, leading to low global sea ice extent
In the Southern Hemisphere, after January 11 sea ice began tracking low, leading to a January average extent that was the second lowest on record. The lowest extent for this time of year was in 2017. Extent is below average in the Ross Sea and the West Amundsen Seas, while elsewhere extent remains close to average. The low ice extent is puzzling, given that air temperatures at the 925 hPa level are near average or below average (relative to the 1981 to 2010 period) over much of the Southern Ocean. The Weddell and Amundsen Seas were 1 to 2 degrees Celsius (2 to 4 degrees Fahrenheit) below average. Slightly above-average temperatures were the rule in the northwestern Ross Sea.
Further reading
Itkin, P., Spreen, G., Hvidegaard, S. M., Skourup, H., Wilkinson, J., Gerland, S., & Granskog, M. A. 2018. Contribution of deformation to sea ice mass balance: A case study from an N-ICE2015 storm. Geophysical Research Letters, 45. https://doi.org/10.1002/2017GL076056.
Baked Alaska and 2017 in review
Arctic sea ice extent in December 2017 was below average in both the far northern Atlantic and the Bering Sea, and notably high temperatures prevailed over most of the Arctic, especially over Central Alaska. We look back at the year’s events, and examine Arctic sea ice trends since 1850 based on a new compilation of data from maps, ship reports, and other records.
Overview of conditions
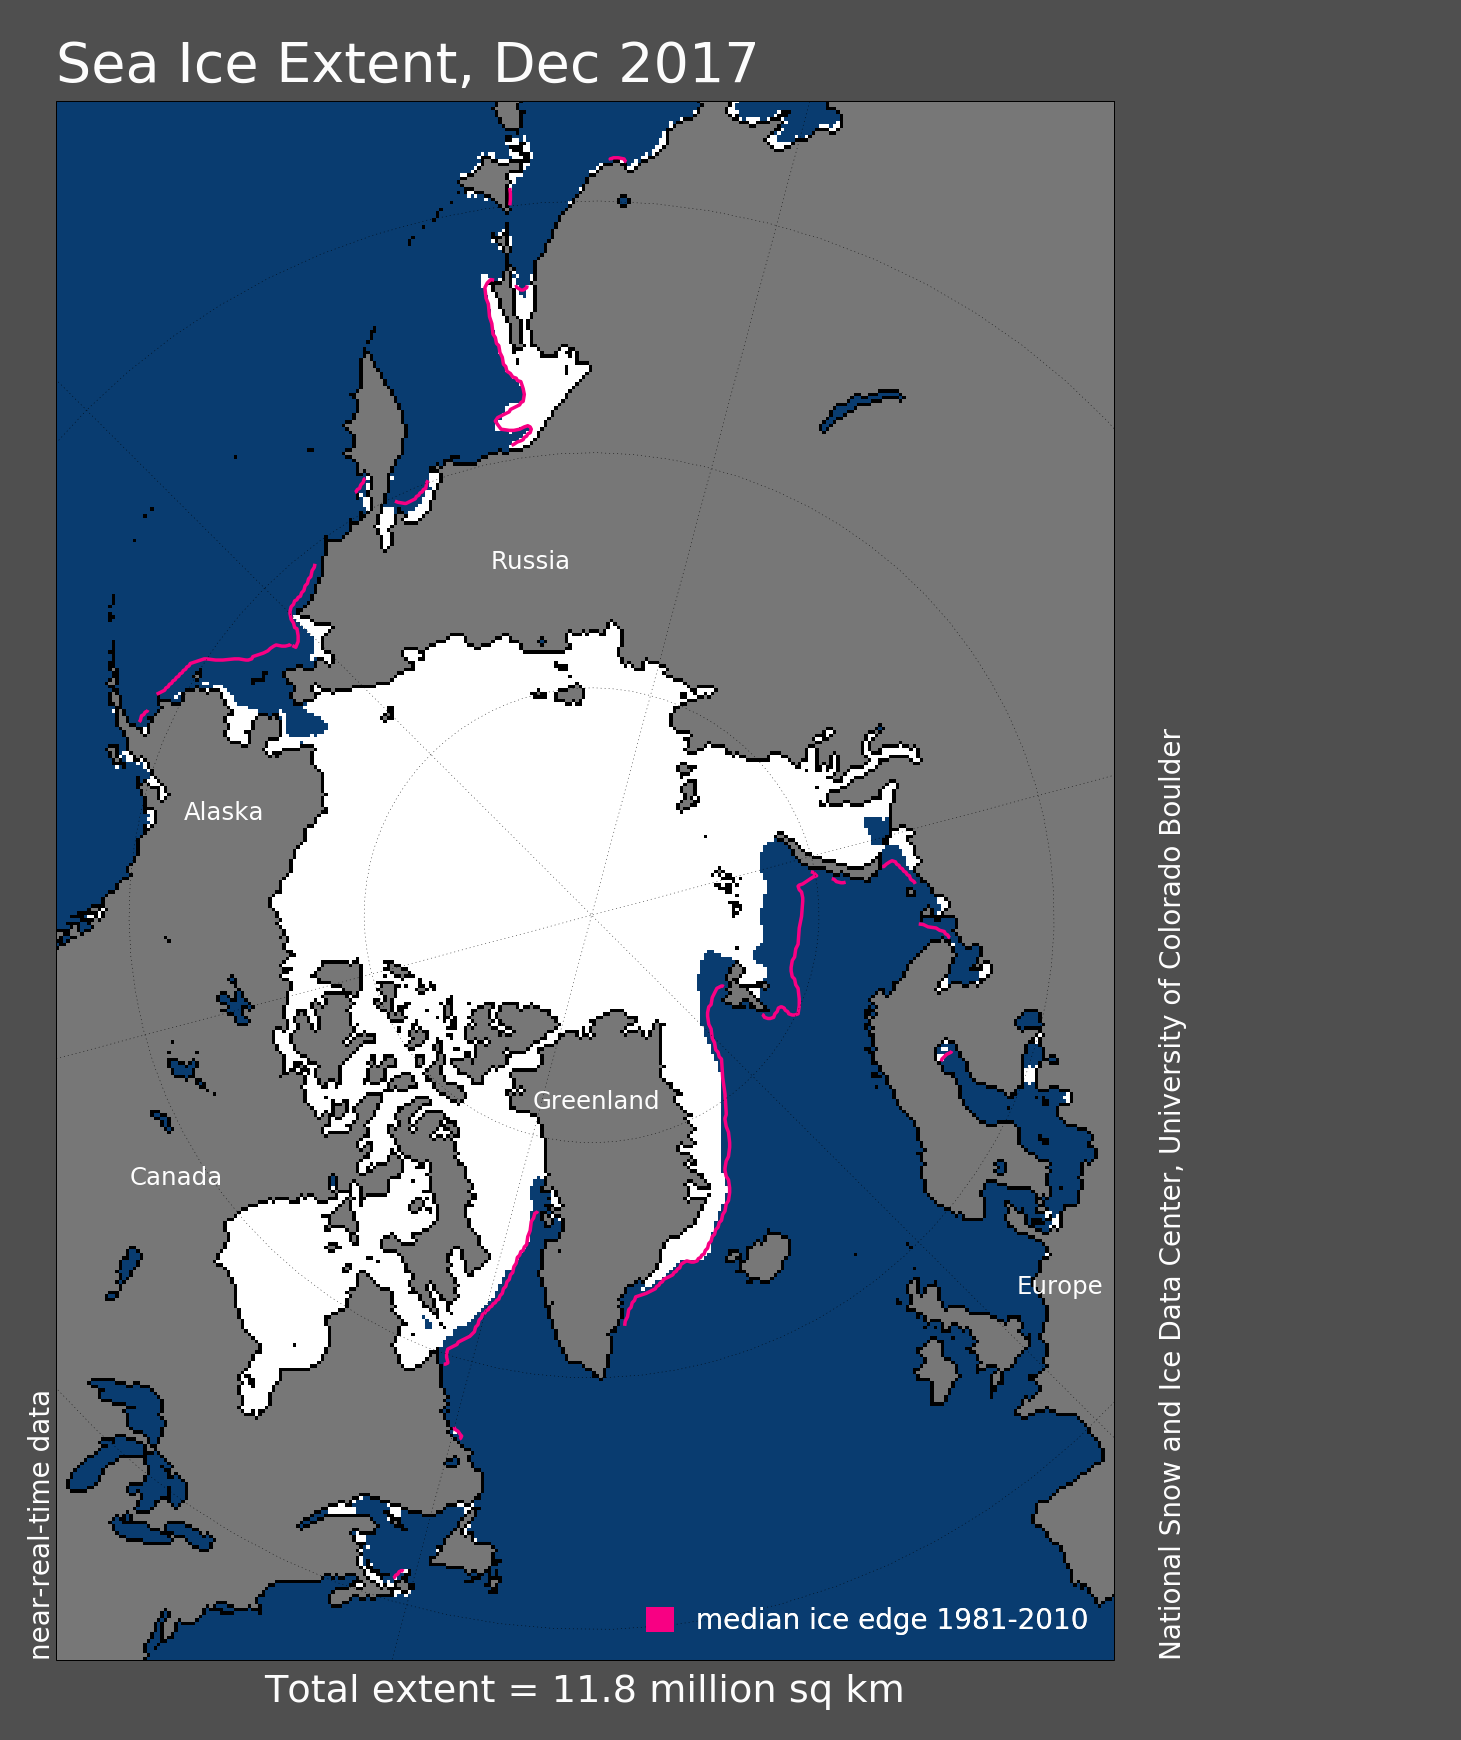
Figure 1. Arctic sea ice extent for December 2017 was 11.75 million square kilometers (4.54 million square miles). The magenta line shows the 1981 to 2010 average extent for that month. Sea Ice Index data. About the data
Credit: National Snow and Ice Data Center
High-resolution image
Arctic sea ice extent for December 2017 averaged 11.75 million square kilometers (4.54 million square miles), the second lowest in the 1979 to 2017 satellite record. This was 1.09 million square kilometers (420,900 square miles) below the 1981 to 2010 average and 280,000 square kilometers (108,100 square miles) above the record low December extent recorded in 2016. Extent at the end of the month was below average in the far northern Atlantic Ocean and Barents Sea, slightly above average in western Hudson Bay, and continued to be below average in the Bering and Chukchi Seas. Near-average conditions prevailed along the eastern coast of Greenland and in the Sea of Okhotsk.
Conditions in context
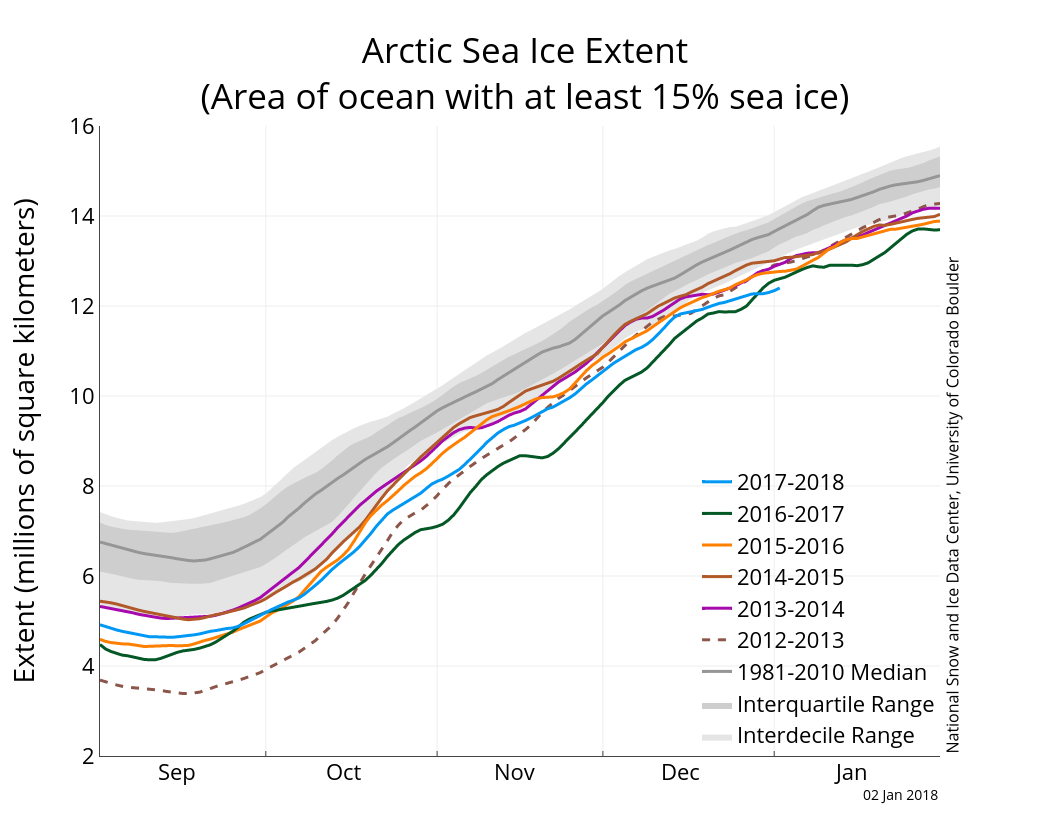
Figure 2a. The graph above shows Arctic sea ice extent as of January 2, 2018, along with daily ice extent data for five previous years. 2017 to 2018 is shown in blue, 2016 to 2017 in green, 2015 to 2014 in orange, 2014 to 2015 in brown, 2013 to 2014 in purple, and 2012 to 2012 in dotted brown. The 1981 to 2010 median is in dark gray. The gray areas around the median line show the interquartile and interdecile ranges of the data. Sea Ice Index data.
Credit: National Snow and Ice Data Center
High-resolution image
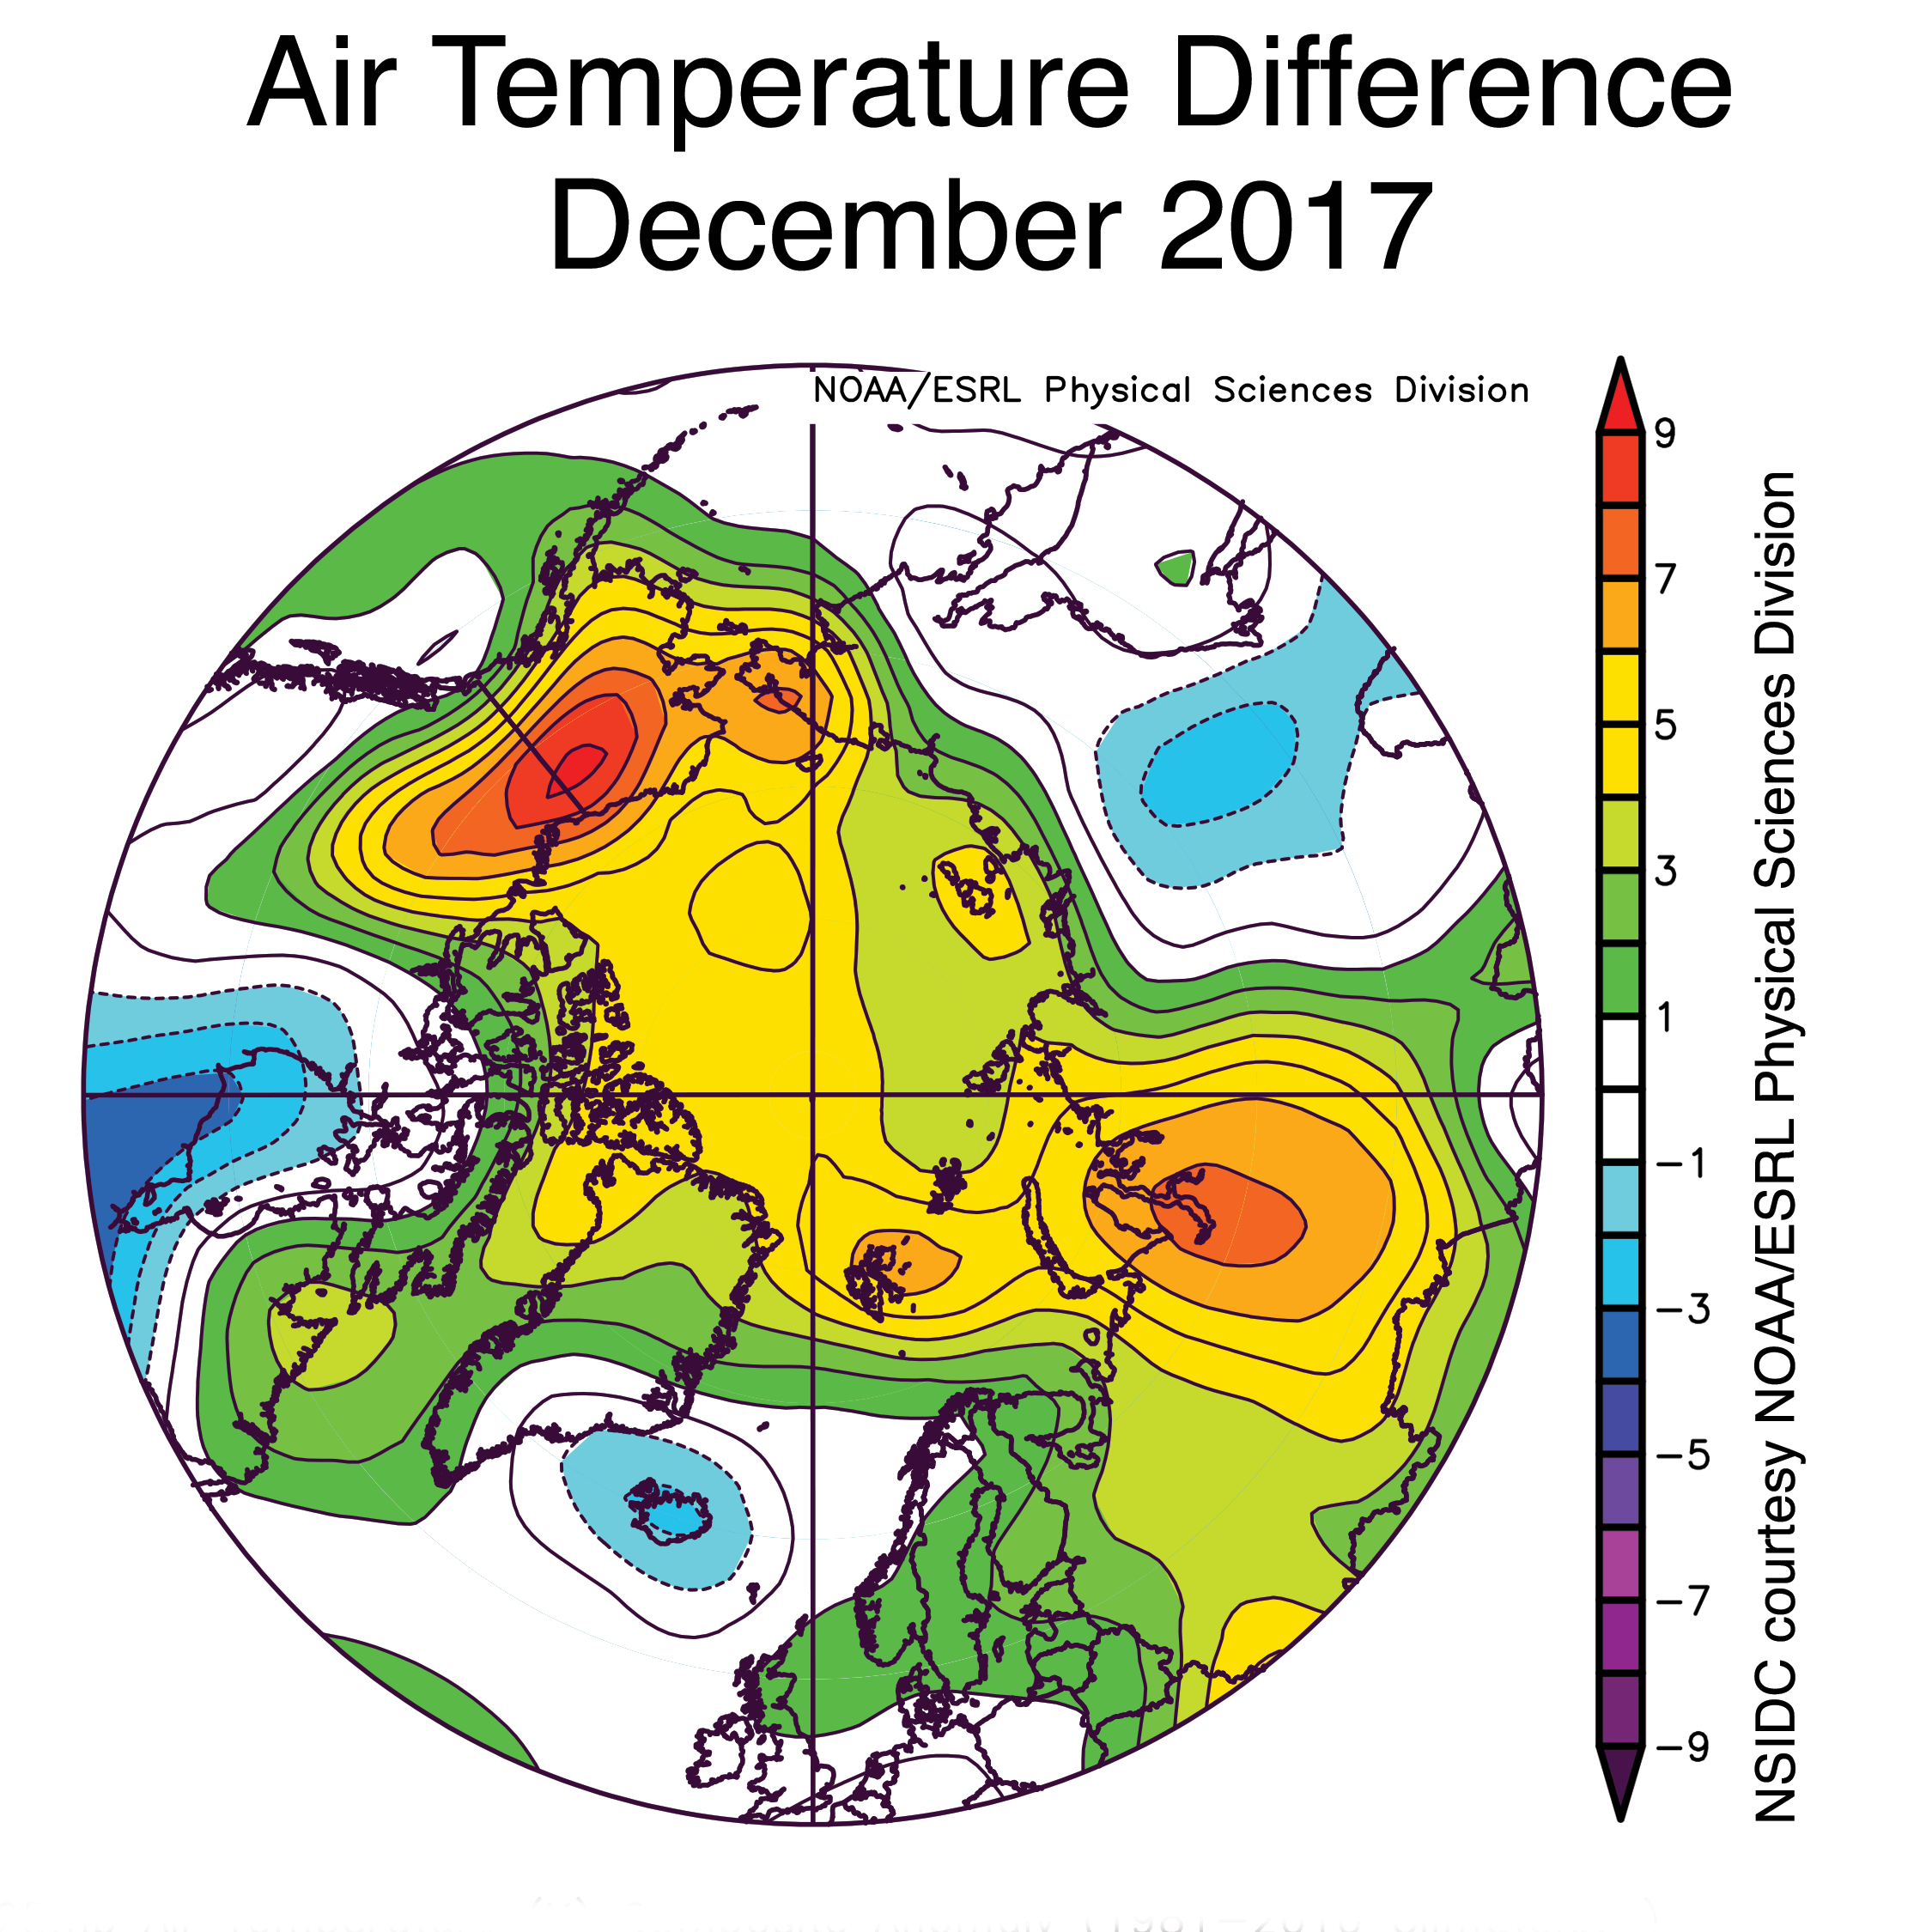
Figure 2b. This plot shows the departure from average air temperatures at the 925 hPa level in degrees Celsius for December 2017. Yellows and reds indicate higher than average temperatures; blues and purples indicate lower than average temperatures.
Credit: NSIDC courtesy NOAA Earth System Research Laboratory Physical Sciences Division
High-resolution image
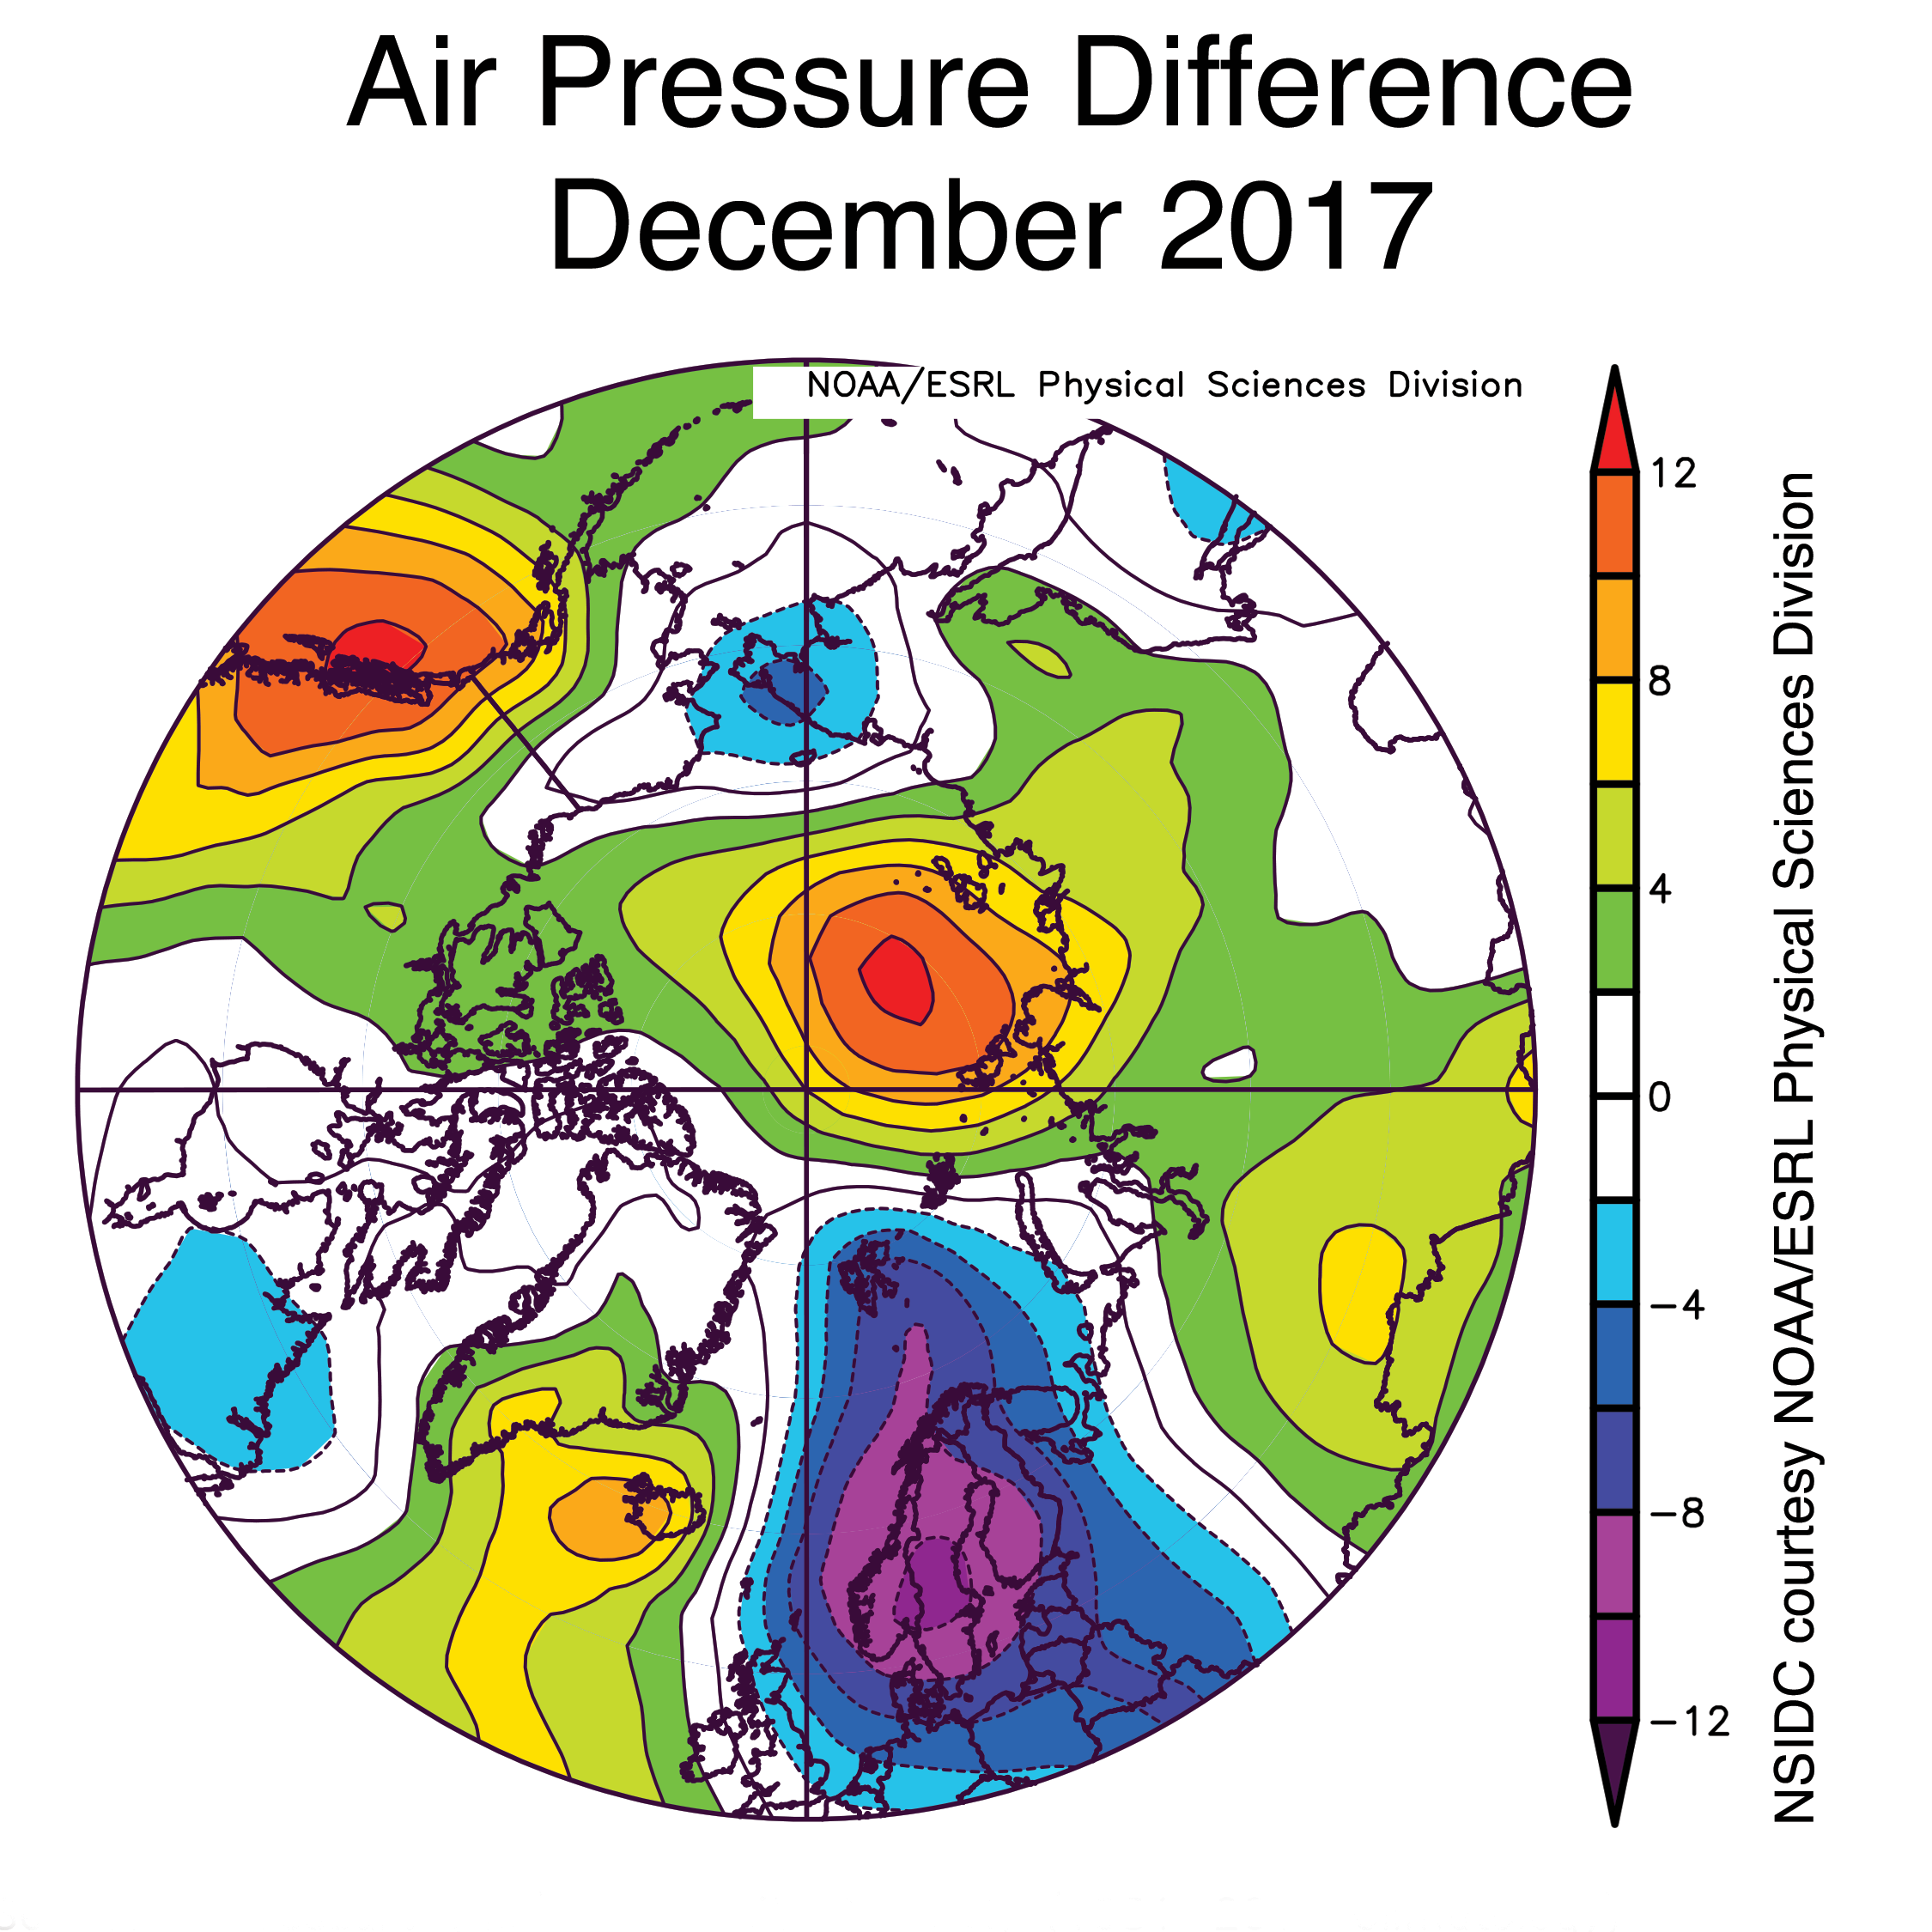
Figure 2c. This plot shows the departure from average sea level pressures at the 925 hPa level in degrees Celsius for December 2018. Yellows and reds indicate higher than average air pressures; blues and purples indicate lower than average air pressures.
Credit: NSIDC courtesy NOAA Earth System Research Laboratory Physical Sciences Division
High-resolution image
Ice growth during December 2017 averaged 59,800 square kilometers (23,100 square miles) per day. This was fairly close to the average rate for the month of 64,100 square kilometers (24,800 square miles) per day. Ice growth in the Chukchi Sea (very late compared to previous years), the Kara Sea, and the eastern Hudson Bay areas were the main regions of change in December. In contrast, the ice edge slightly retreated in the Barents Sea near Franz Josef Land.
December air temperatures at the 925 hPa level (about 2,500 feet above sea level) throughout the Arctic Ocean were 2 to 6 degrees Celsius (4 to 11 degrees Fahrenheit) above average. Prominent warm spots were found over north Central Asia and Central Alaska (more than 10 degrees Celsius, or 18 degrees Fahrenheit above average), as well as over Svalbard and Central Siberia (nearly 6 degrees Celsius or 11 degrees Fahrenheit above average). Temperatures were 2 to 3 degrees Celsius (4 to 5 degrees Fahrenheit) below average in Eastern Siberia.
The air temperature pattern in December was similar to that seen in November, driven in part by the arrangement of high and low air pressure regions surrounding the Arctic. Below-average pressure over easternmost Siberia and above-average pressure over the Gulf of Alaska drove southwesterly winds into Central Alaska and the Yukon region. Warmth in the Central Arctic and in Svalbard was consistent with southerly winds arising from low pressure over Scandinavia and higher pressure in the Laptev Sea and Central Siberia.
The Arctic Oscillation (AO) is a key climate indicator for general wind, precipitation, and temperature patterns in the Arctic. The AO index was moderately positive through most of 2017, indicating a tendency toward strong circumpolar winds at high latitude and warm conditions in the mid-latitudes. December 2017 had a mix of conditions, resulting in a near-neutral AO state (as measured by the index).
December 2017 compared to previous years
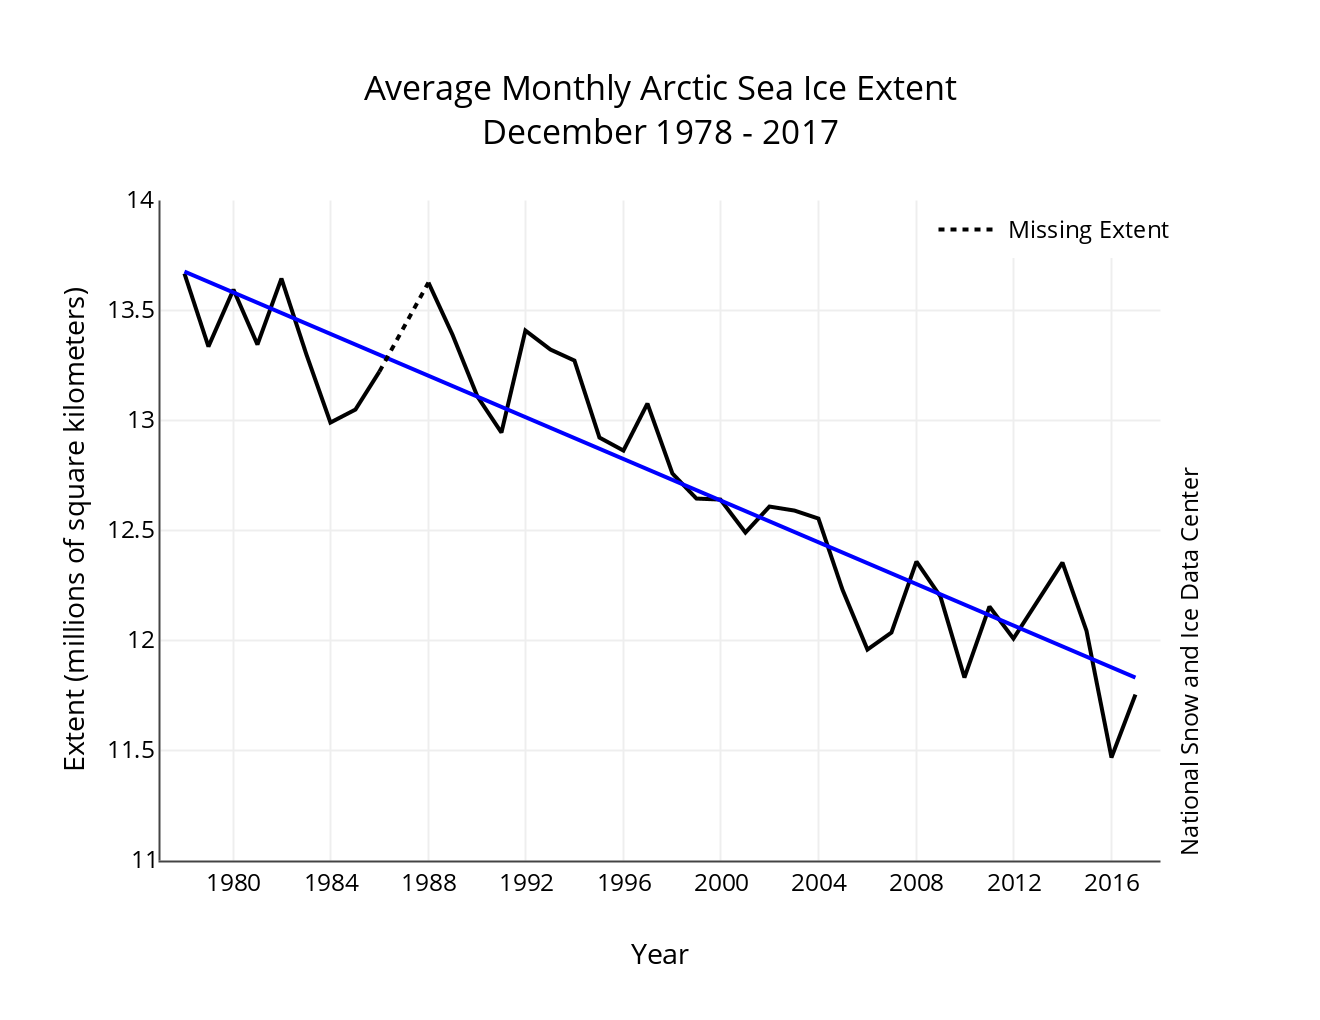
Figure 3. Monthly December ice extent for 1979 to 2017 shows a decline of 3.7 percent per decade.
Credit: National Snow and Ice Data Center
High-resolution image
The linear rate of sea ice decline for December is 47,400 square kilometers (18,300 square miles) per year or 3.7 percent per decade. Recall from our previous post that NSIDC has revised the way in which monthly average extents are computed, which has some impacts on computed trends.
2017 year in review
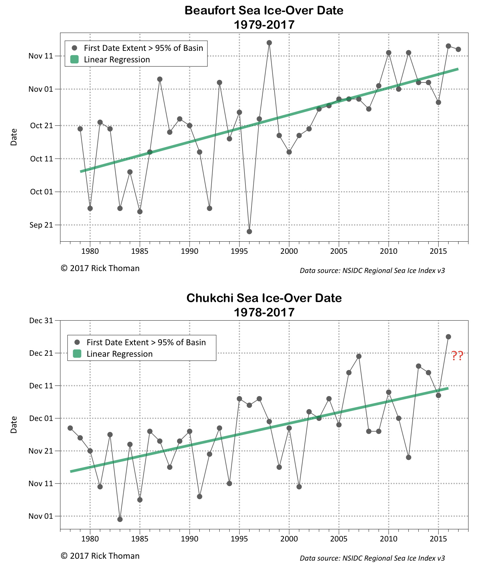
Figure 4. These figures show trends for ice-over dates in the Beaufort (top) and Chukchi (bottom) Seas. Sea Ice Index data.
Credit: R. Thoman, NOAA
High-resolution image
The winter of 2016 to 2017 saw record low winter sea ice extent and higher than average temperatures. Indeed, the first four months of 2017 set or tied record low extents for the month. However, the melt season progressed somewhat slowly from May through July, as storminess and relatively cool conditions began to prevail. As such, sea ice extent at the seasonal minimum, on September 13, ended up as eighth lowest.
Assessments of sea ice thickness modeled by the Pan-Arctic Ice Ocean Modeling and Assimilation System (PIOMAS), as well as sea ice age near the seasonal minimum extent indicate that Arctic sea ice remains very low in overall volume. As the year ended, ice extent remained especially low in the Chukchi and Bering Seas. As discussed in an earlier post, the unusually early seasonal ice retreat in the Chukchi Sea this past summer likely relates to a strong inflow of oceanic heat into the region via the Bering Strait. With more heat in the upper ocean at summer’s end, it takes longer for sea ice to form in autumn and winter. Colleague Rick Thoman of the National Oceanic and Atmospheric Administration (NOAA) National Weather Service has assembled a time series of the ice-over dates in both the Chukchi and Beaufort Seas based on the satellite passive microwave record (Figure 4). The ice-over date is defined as the first day that the ice concentration exceeds 95 percent in the region. The trends towards later freeze up in both seas is striking. This has an impact on sea ice thickness as the growth season is shortened, which may lead to thinner ice by the end of winter. On the other hand, later freeze up also means less time for snow accumulation on the sea ice. Since sea ice grows faster for a thinner snowpack, this may partially offset the impacts of late ice formation.
A longer record of Arctic sea ice extent
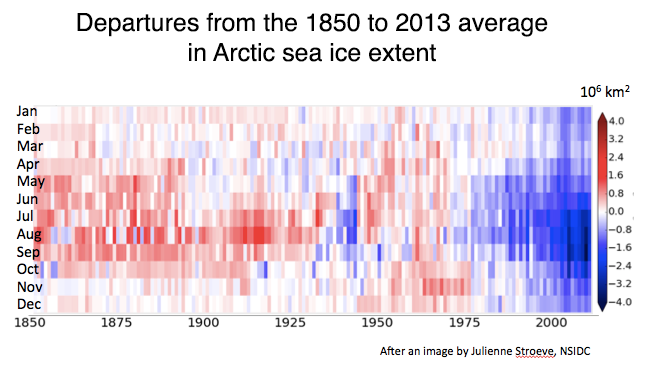
Figure 5a. This figure shows departures from 1850 to 2013 calendar-month averages of Arctic sea ice extent as a function of year (x-axis) and calendar month (y-axis). The color bar at the right shows magnitudes of departures from the average.
Credit: J. E. Walsh, F. Fetterer, J. S. Stewart, W. L. Chapman. 2016. Geographical Review; after a figure by J. Stroeve, National Snow and Ice Data Center
High-resolution image

Figure 5b. These sea ice concentration maps compare the lowest September minimum Arctic sea ice extents for the periods 1850 to 1900, 1901 to 1950, 1951 to 2000, and 2000 to 2013.
Credit: F. Fetterer/National Snow and Ice Data Center, NOAA
High-resolution image
Using a compilation of maps, ship reports, and other records, NOAA has published monthly estimates of Arctic sea ice extent spanning 1850 to 2013. While data in the earlier part of the record is limited, the carefully constructed time series helps to put the more recent satellite record in a longer-term context. Figure 5a shows the decline in extent over the period of satellite observations standing out prominently in comparison with the rest of the record, especially in late summer and early autumn. An earlier period of unusually low summer sea ice extent around 1937 to 1943 (as compared to the 1850 to 2013 average) did not extend to the winter season, and was followed by a few years of significantly higher-than-average summer ice extents. Early in the record (1850 to 1900), winter ice extent was not particularly elevated relative to the 1850 to 2013 average, but summer sea ice extent was quite a bit higher higher than the average. As another way to place recent conditions into a longer context using this data set, we show the years of the lowest September extent recorded within the 50-year periods 1850 to 1900, 1901 to 1950, 1951 to 2000, along with the lowest over the period 2000 to 2013 (Figure 5b). The decline in extent is apparent.
Low sea ice extent in the Antarctic
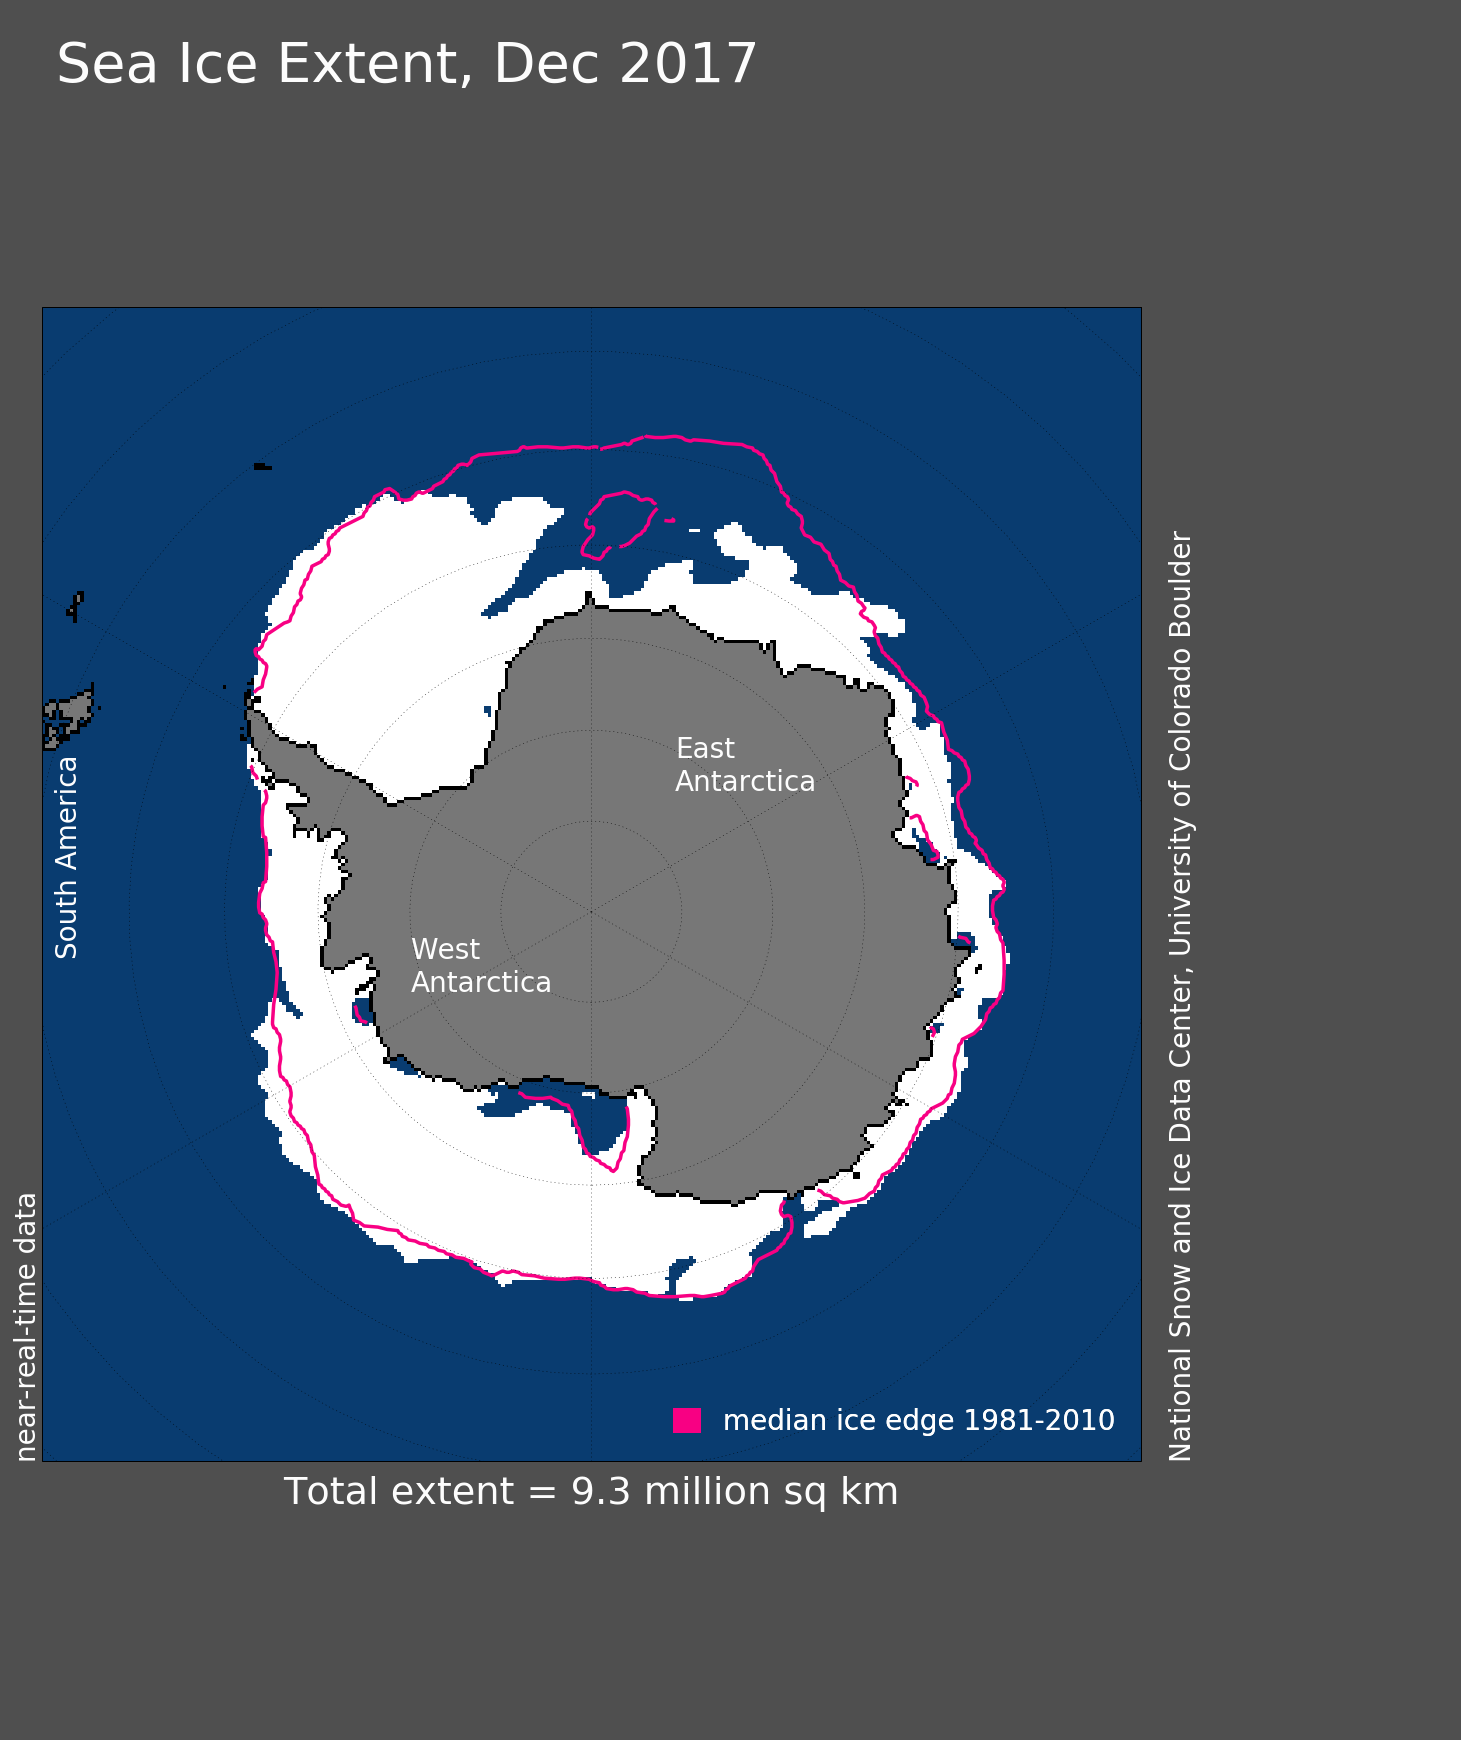
Figure 6. Antarctic sea ice extent for December 2017 was 9.34 million square kilometers (3.61 million square miles). The magenta line shows the 1981 to 2010 average extent for that month. Sea Ice Index data. About the data
Credit: National Snow and Ice Data Center
High-resolution image
In the Southern Hemisphere, sea ice for December 2017 averaged 9.34 million square kilometers (3.61 million square miles) and was the fourth lowest in the satellite record. Sea ice extent was far below average in the eastern Weddell Sea, but above average in the northwestern Weddell Sea. The East Antarctic coastline had near-average ice extent. As the Southern Hemisphere entered into the summer months, sea ice declined steeply. Temperatures at the 925 hPa level were 1 to 3 degrees Celsius (2 to 5 degrees Fahrenheit) higher than average in Dronning Maud Land and the northern Ross Sea, and generally lower than average over the ice sheet. Near-average temperatures have prevailed over the fringing Southern Ocean. Pressures were slightly above average over the continent and below average in the surrounding ocean. Consistent with this pattern, the Southern Annular Mode index, a measure of the strength of westerly winds, was moderately positive for December.
Further reading
Walsh, J. E., F. Fetterer, J. S. Stewart, and W. L. Chapman. 2016. A database for depicting Arctic sea ice variations back to 1850. Geographical Review. doi: 10.1111/j.1931-0846.2016.12195.x.

