Arctic sea ice extent in December 2017 was below average in both the far northern Atlantic and the Bering Sea, and notably high temperatures prevailed over most of the Arctic, especially over Central Alaska. We look back at the year’s events, and examine Arctic sea ice trends since 1850 based on a new compilation of data from maps, ship reports, and other records.
Overview of conditions
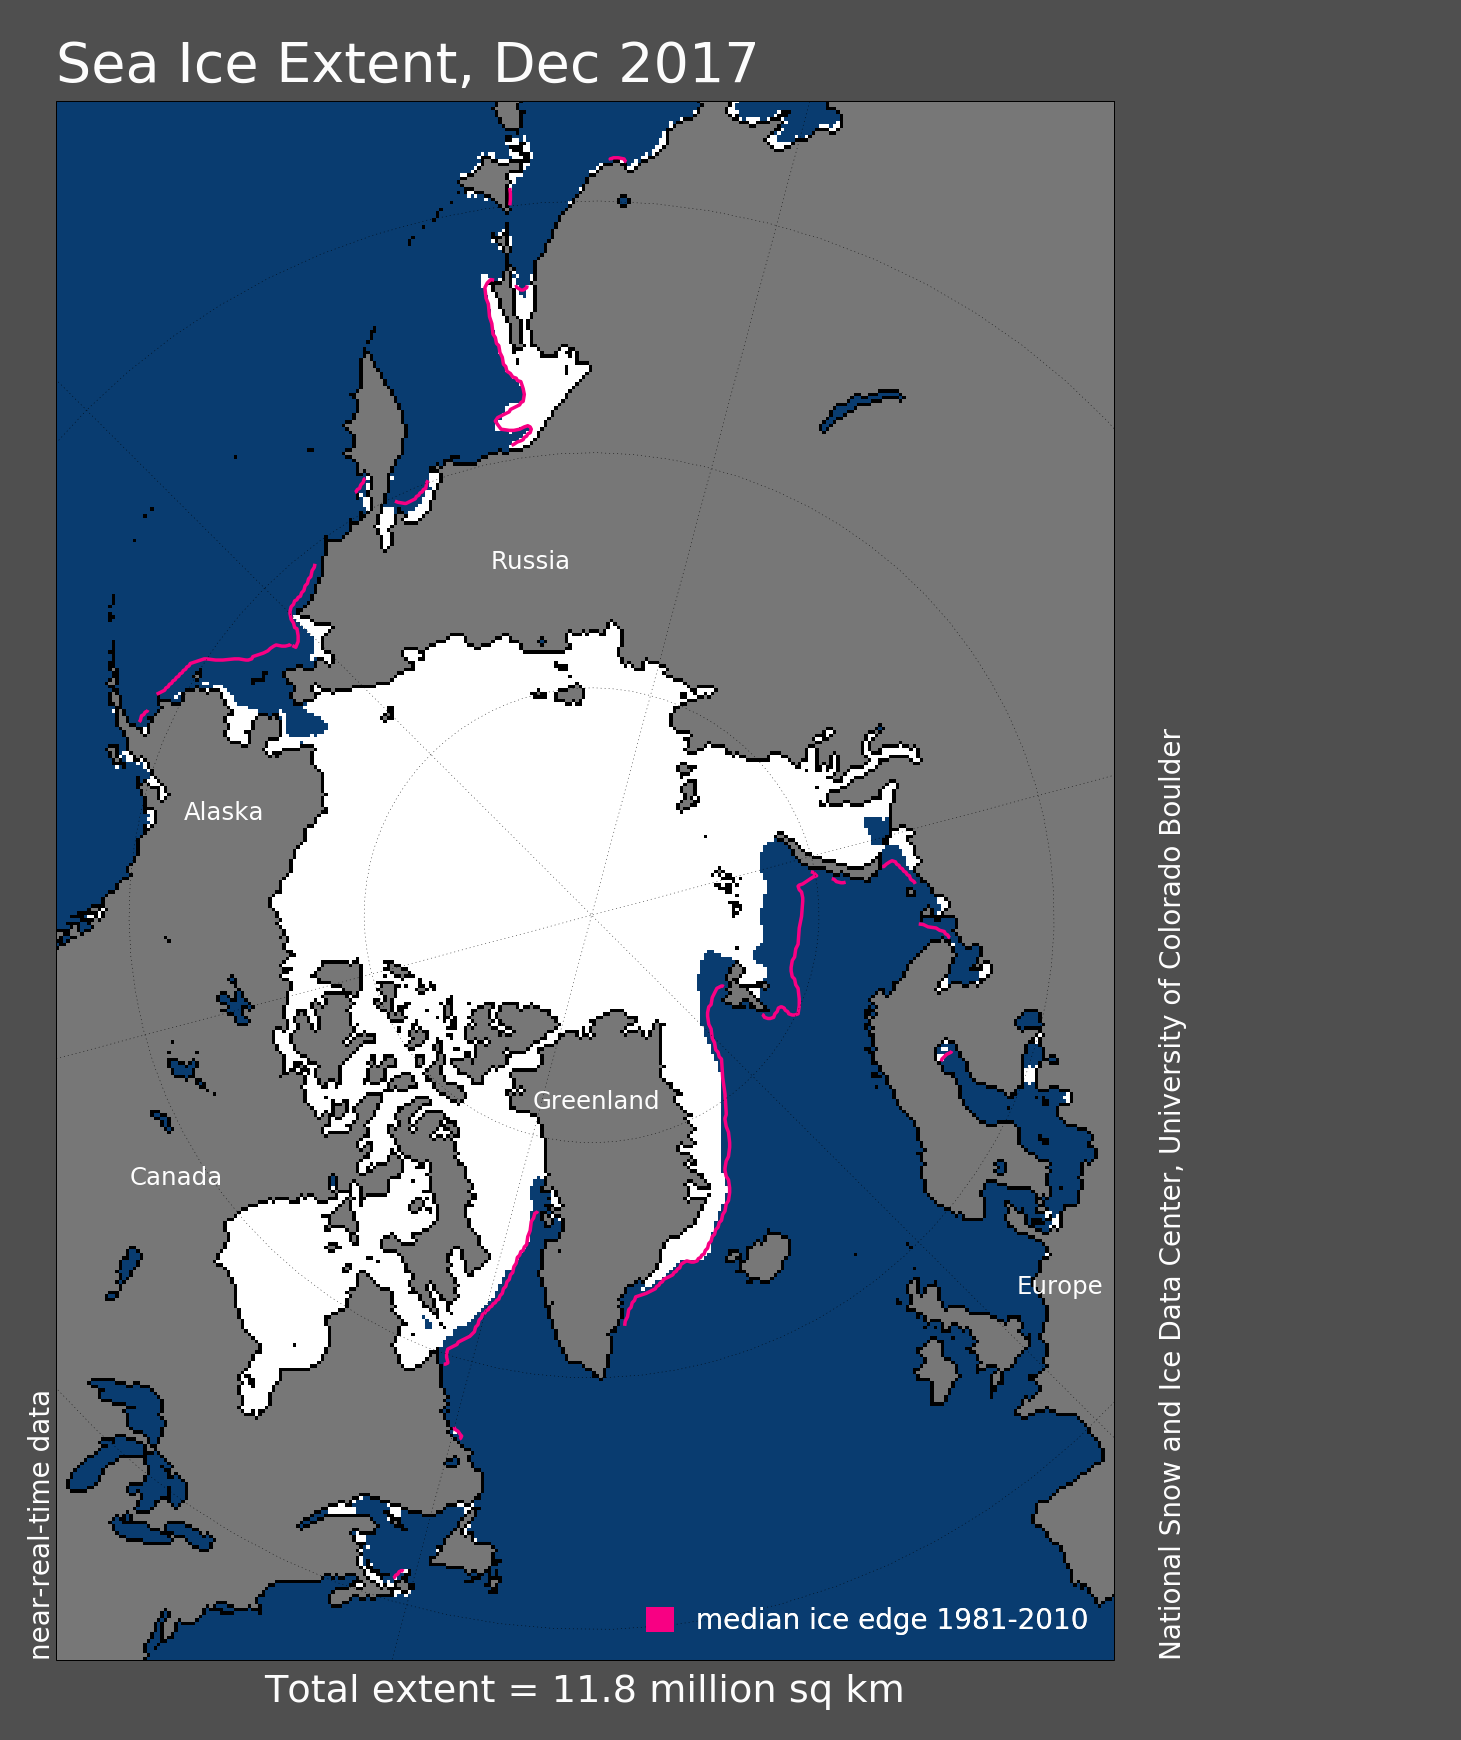
Figure 1. Arctic sea ice extent for December 2017 was 11.75 million square kilometers (4.54 million square miles). The magenta line shows the 1981 to 2010 average extent for that month. Sea Ice Index data. About the data
Credit: National Snow and Ice Data Center
High-resolution image
Arctic sea ice extent for December 2017 averaged 11.75 million square kilometers (4.54 million square miles), the second lowest in the 1979 to 2017 satellite record. This was 1.09 million square kilometers (420,900 square miles) below the 1981 to 2010 average and 280,000 square kilometers (108,100 square miles) above the record low December extent recorded in 2016. Extent at the end of the month was below average in the far northern Atlantic Ocean and Barents Sea, slightly above average in western Hudson Bay, and continued to be below average in the Bering and Chukchi Seas. Near-average conditions prevailed along the eastern coast of Greenland and in the Sea of Okhotsk.
Conditions in context
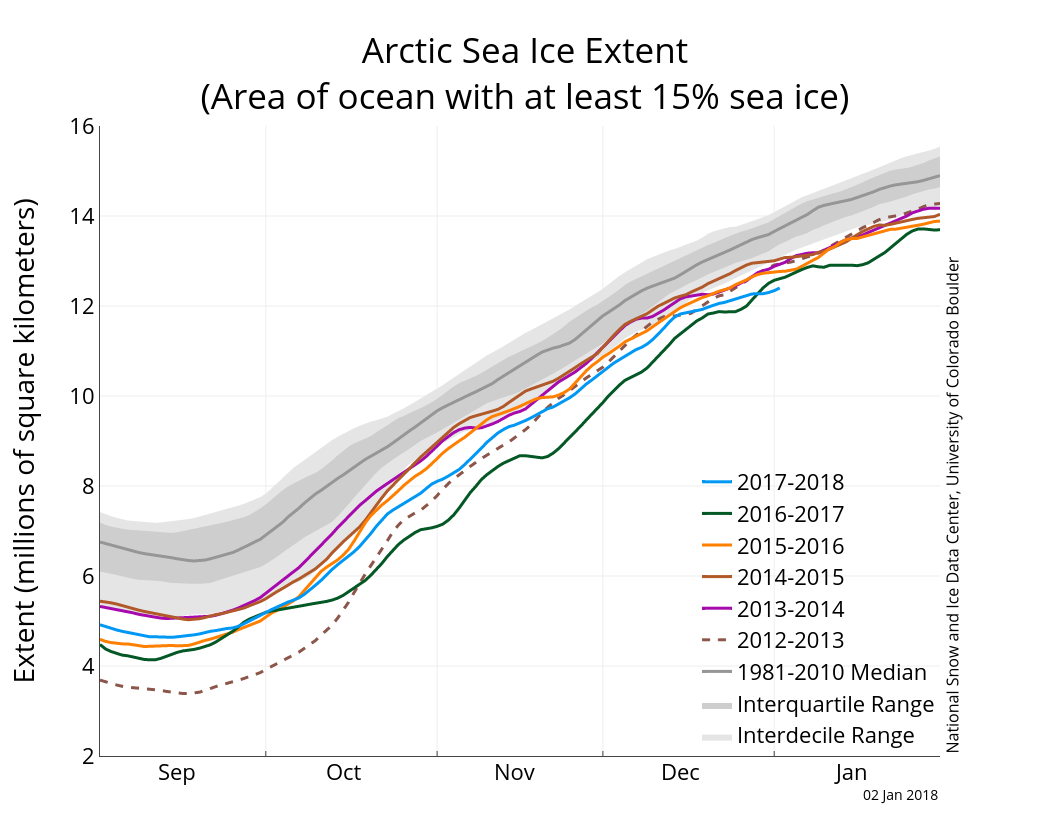
Figure 2a. The graph above shows Arctic sea ice extent as of January 2, 2018, along with daily ice extent data for five previous years. 2017 to 2018 is shown in blue, 2016 to 2017 in green, 2015 to 2014 in orange, 2014 to 2015 in brown, 2013 to 2014 in purple, and 2012 to 2012 in dotted brown. The 1981 to 2010 median is in dark gray. The gray areas around the median line show the interquartile and interdecile ranges of the data. Sea Ice Index data.
Credit: National Snow and Ice Data Center
High-resolution image
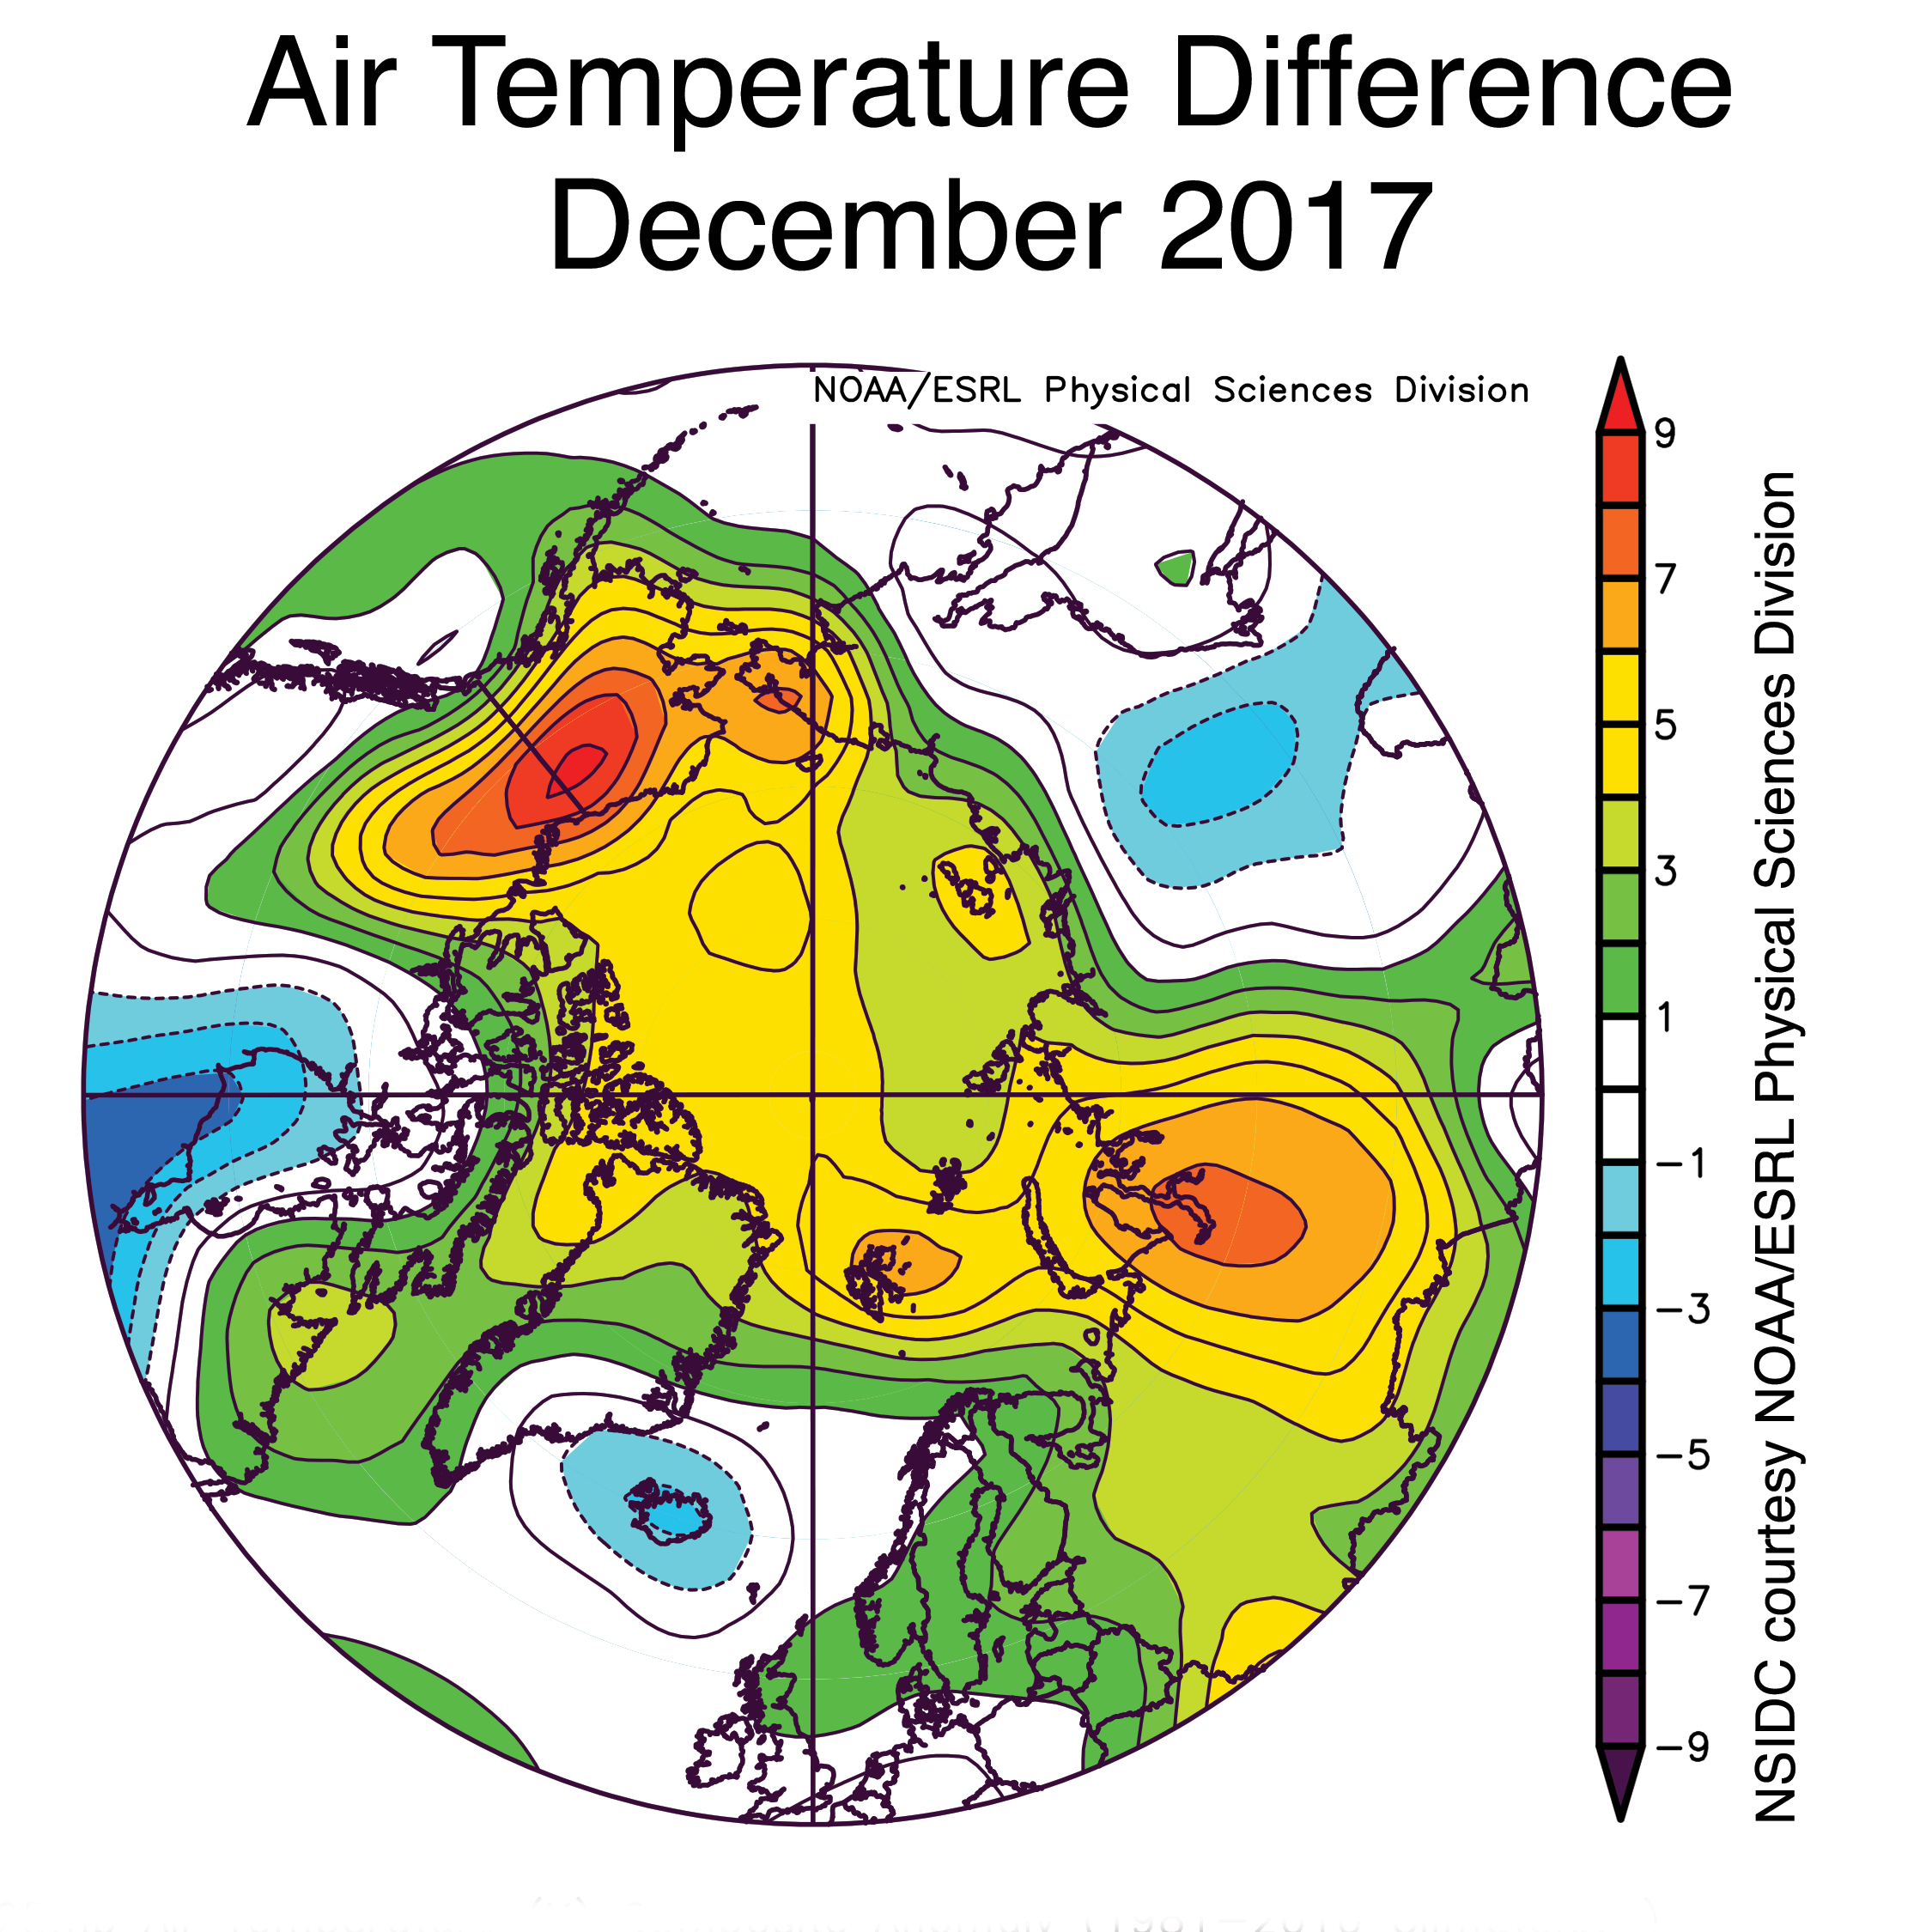
Figure 2b. This plot shows the departure from average air temperatures at the 925 hPa level in degrees Celsius for December 2017. Yellows and reds indicate higher than average temperatures; blues and purples indicate lower than average temperatures.
Credit: NSIDC courtesy NOAA Earth System Research Laboratory Physical Sciences Division
High-resolution image
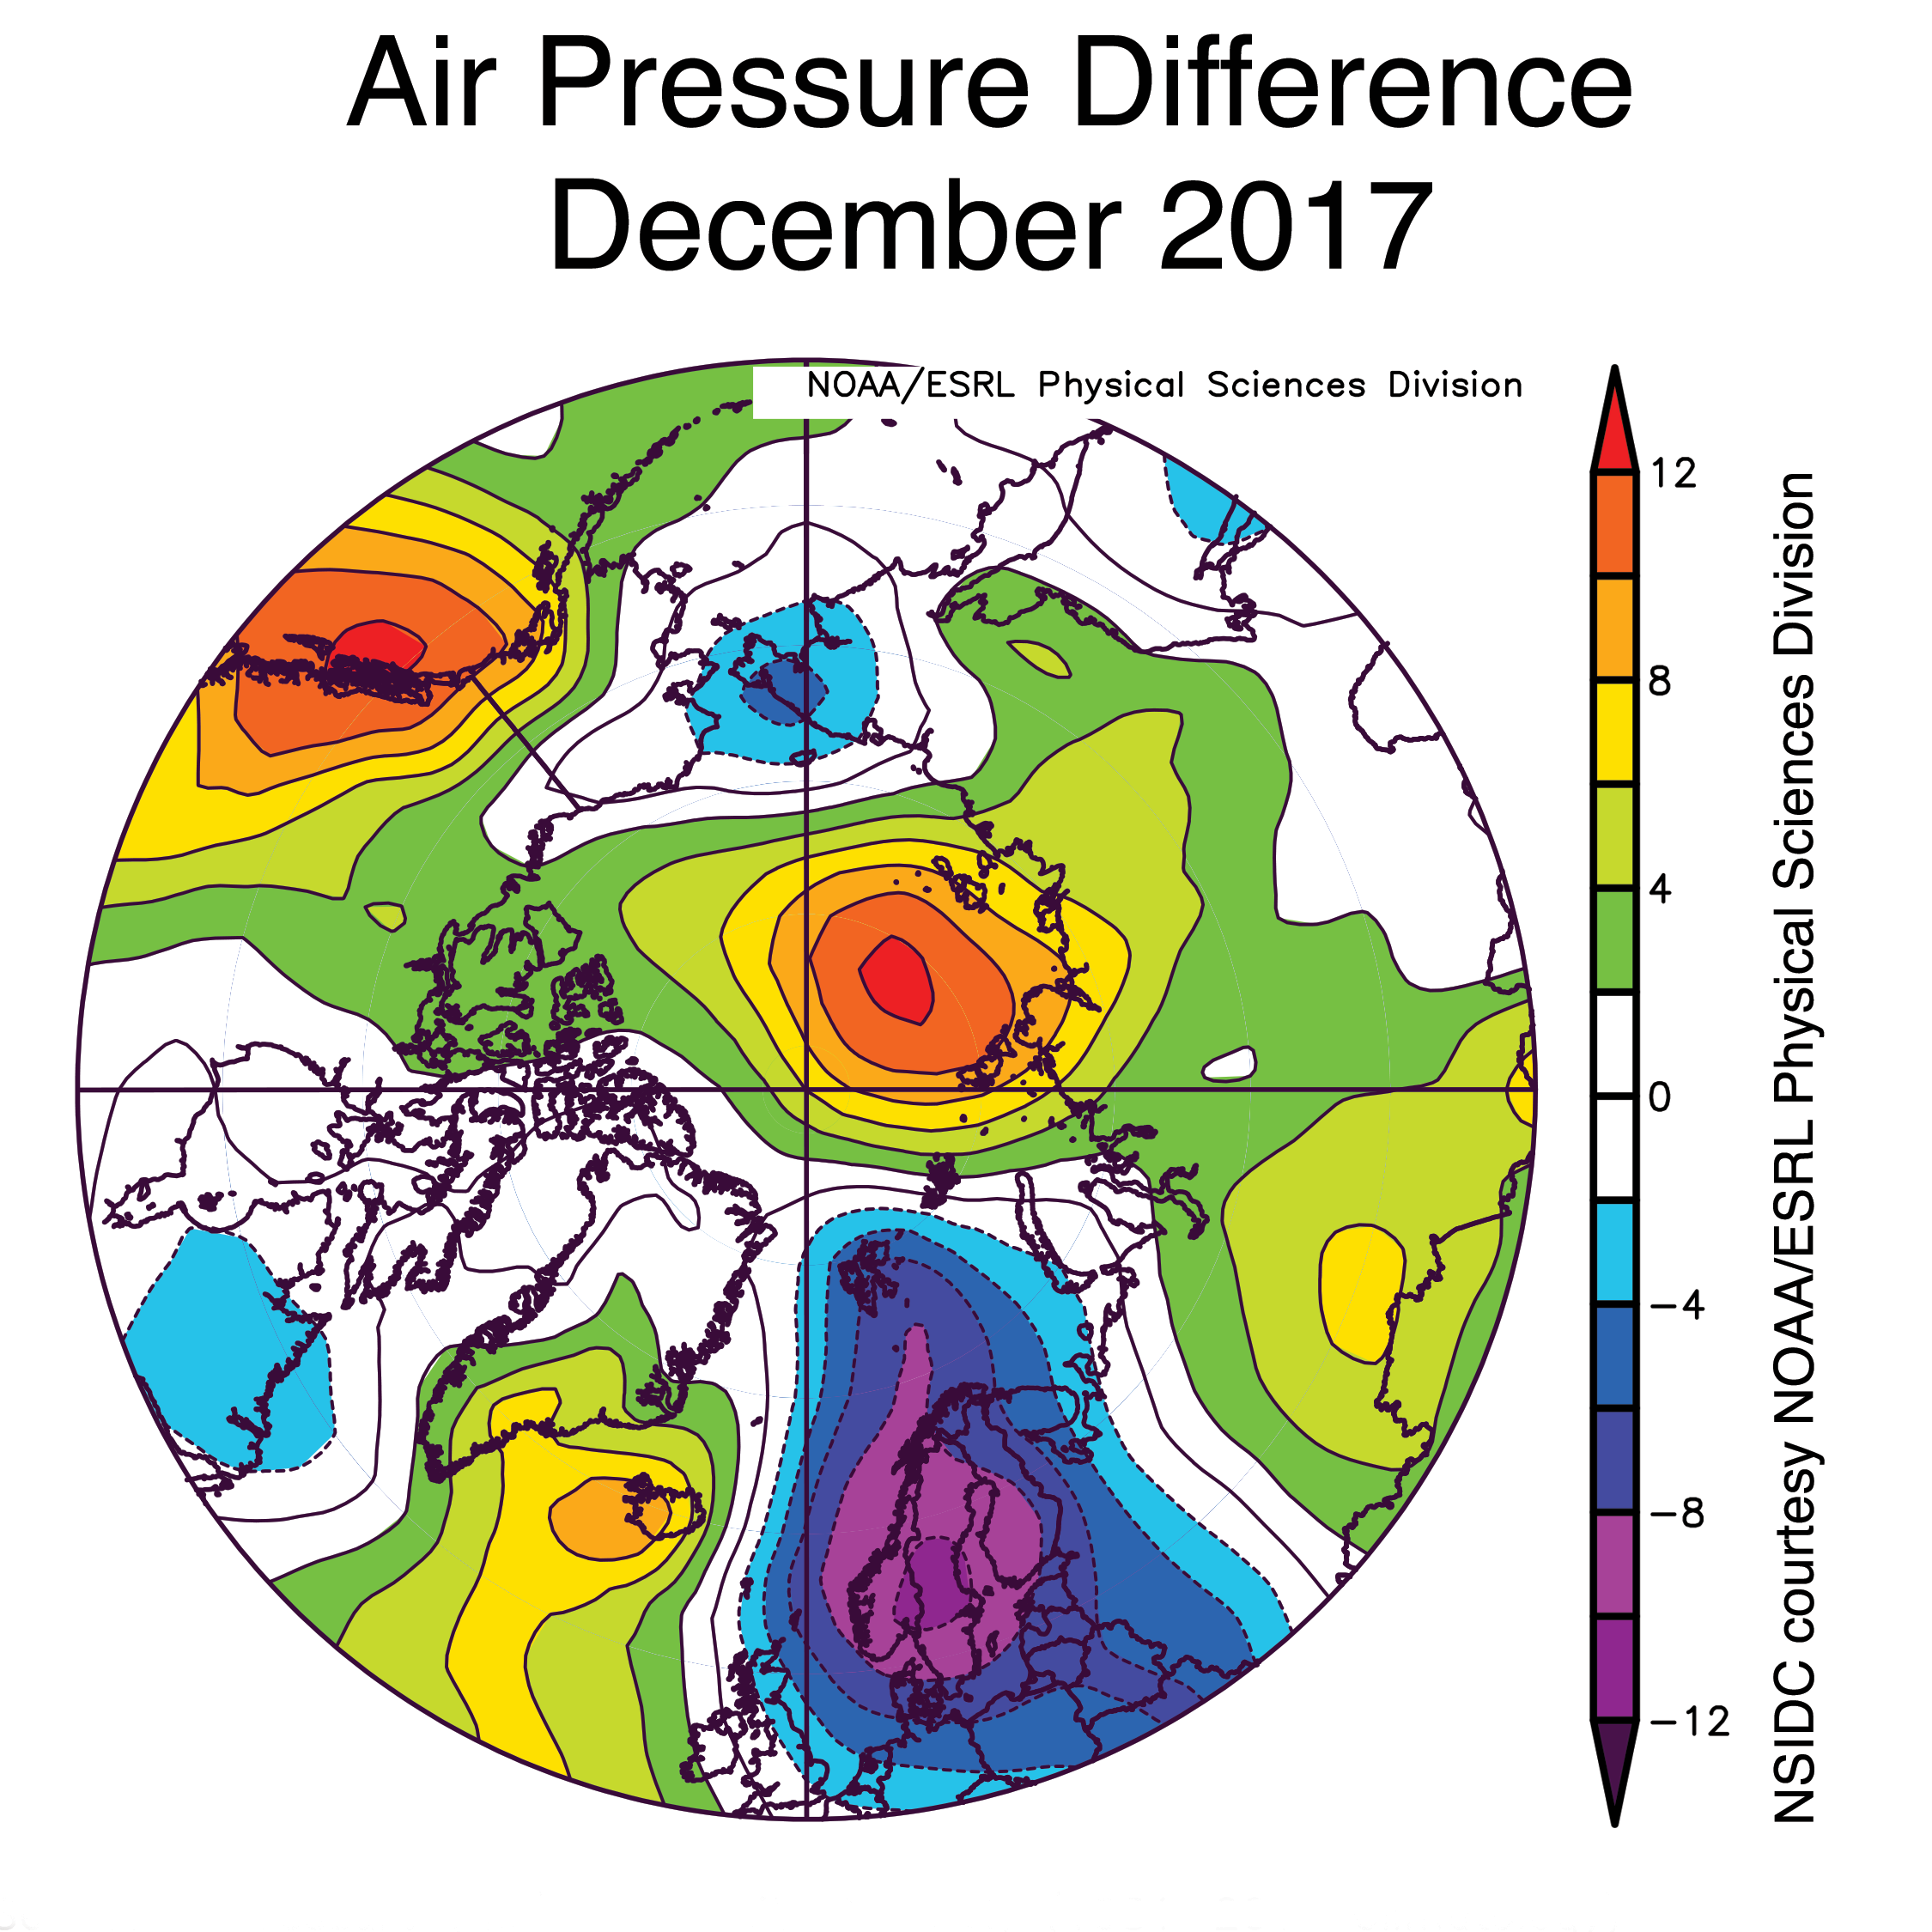
Figure 2c. This plot shows the departure from average sea level pressures at the 925 hPa level in degrees Celsius for December 2018. Yellows and reds indicate higher than average air pressures; blues and purples indicate lower than average air pressures.
Credit: NSIDC courtesy NOAA Earth System Research Laboratory Physical Sciences Division
High-resolution image
Ice growth during December 2017 averaged 59,800 square kilometers (23,100 square miles) per day. This was fairly close to the average rate for the month of 64,100 square kilometers (24,800 square miles) per day. Ice growth in the Chukchi Sea (very late compared to previous years), the Kara Sea, and the eastern Hudson Bay areas were the main regions of change in December. In contrast, the ice edge slightly retreated in the Barents Sea near Franz Josef Land.
December air temperatures at the 925 hPa level (about 2,500 feet above sea level) throughout the Arctic Ocean were 2 to 6 degrees Celsius (4 to 11 degrees Fahrenheit) above average. Prominent warm spots were found over north Central Asia and Central Alaska (more than 10 degrees Celsius, or 18 degrees Fahrenheit above average), as well as over Svalbard and Central Siberia (nearly 6 degrees Celsius or 11 degrees Fahrenheit above average). Temperatures were 2 to 3 degrees Celsius (4 to 5 degrees Fahrenheit) below average in Eastern Siberia.
The air temperature pattern in December was similar to that seen in November, driven in part by the arrangement of high and low air pressure regions surrounding the Arctic. Below-average pressure over easternmost Siberia and above-average pressure over the Gulf of Alaska drove southwesterly winds into Central Alaska and the Yukon region. Warmth in the Central Arctic and in Svalbard was consistent with southerly winds arising from low pressure over Scandinavia and higher pressure in the Laptev Sea and Central Siberia.
The Arctic Oscillation (AO) is a key climate indicator for general wind, precipitation, and temperature patterns in the Arctic. The AO index was moderately positive through most of 2017, indicating a tendency toward strong circumpolar winds at high latitude and warm conditions in the mid-latitudes. December 2017 had a mix of conditions, resulting in a near-neutral AO state (as measured by the index).
December 2017 compared to previous years
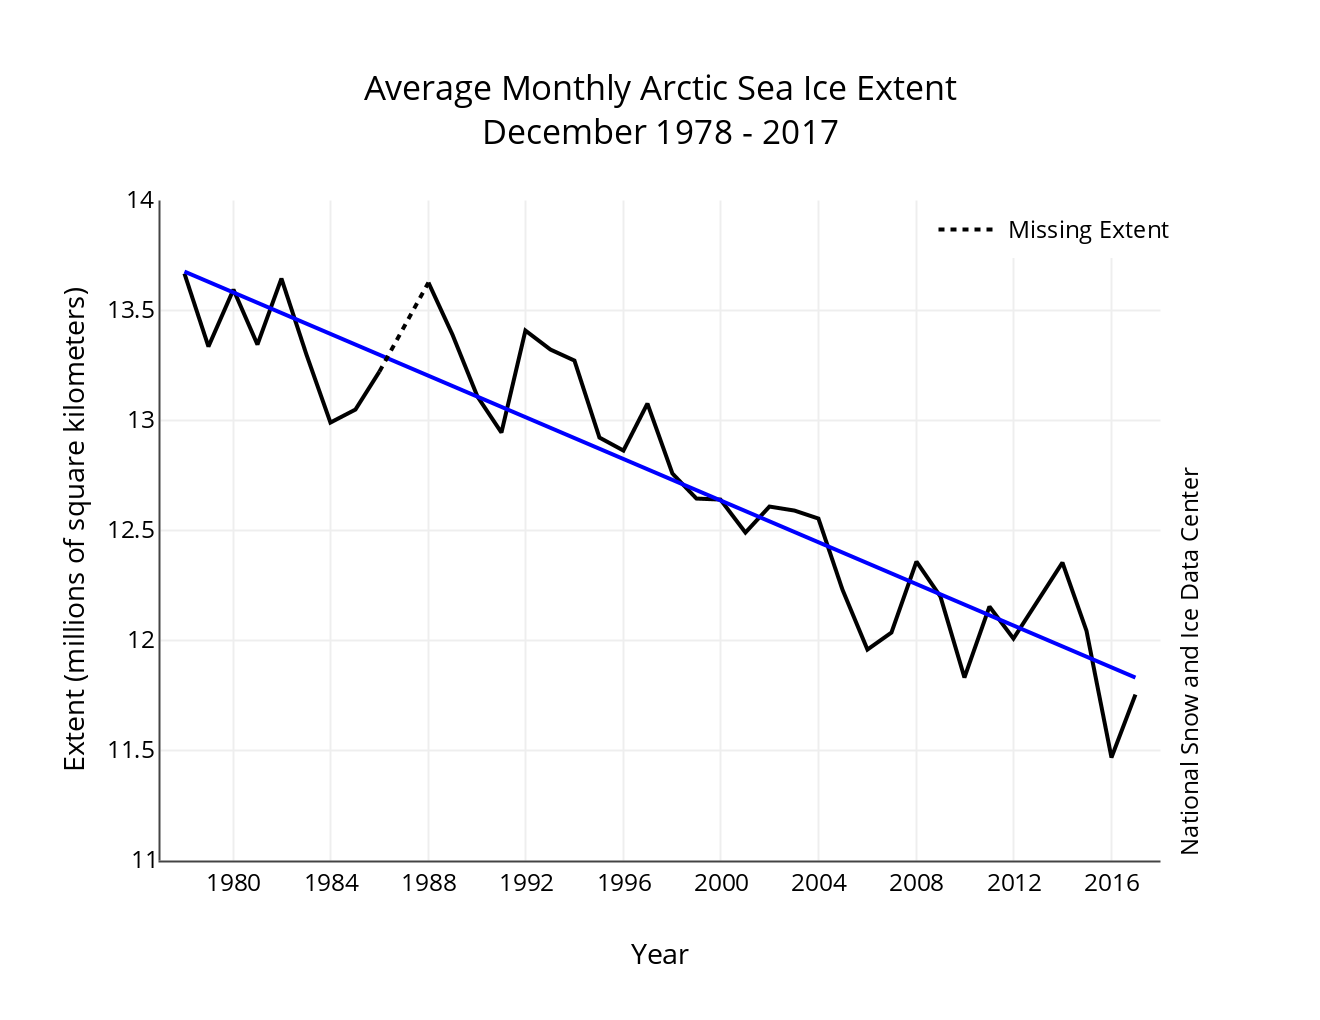
Figure 3. Monthly December ice extent for 1979 to 2017 shows a decline of 3.7 percent per decade.
Credit: National Snow and Ice Data Center
High-resolution image
The linear rate of sea ice decline for December is 47,400 square kilometers (18,300 square miles) per year or 3.7 percent per decade. Recall from our previous post that NSIDC has revised the way in which monthly average extents are computed, which has some impacts on computed trends.
2017 year in review
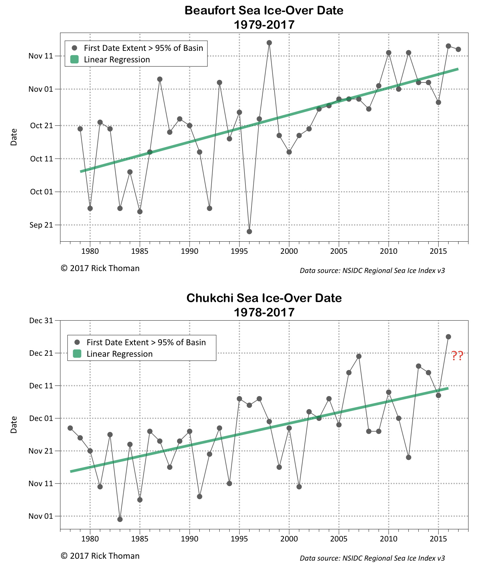
Figure 4. These figures show trends for ice-over dates in the Beaufort (top) and Chukchi (bottom) Seas. Sea Ice Index data.
Credit: R. Thoman, NOAA
High-resolution image
The winter of 2016 to 2017 saw record low winter sea ice extent and higher than average temperatures. Indeed, the first four months of 2017 set or tied record low extents for the month. However, the melt season progressed somewhat slowly from May through July, as storminess and relatively cool conditions began to prevail. As such, sea ice extent at the seasonal minimum, on September 13, ended up as eighth lowest.
Assessments of sea ice thickness modeled by the Pan-Arctic Ice Ocean Modeling and Assimilation System (PIOMAS), as well as sea ice age near the seasonal minimum extent indicate that Arctic sea ice remains very low in overall volume. As the year ended, ice extent remained especially low in the Chukchi and Bering Seas. As discussed in an earlier post, the unusually early seasonal ice retreat in the Chukchi Sea this past summer likely relates to a strong inflow of oceanic heat into the region via the Bering Strait. With more heat in the upper ocean at summer’s end, it takes longer for sea ice to form in autumn and winter. Colleague Rick Thoman of the National Oceanic and Atmospheric Administration (NOAA) National Weather Service has assembled a time series of the ice-over dates in both the Chukchi and Beaufort Seas based on the satellite passive microwave record (Figure 4). The ice-over date is defined as the first day that the ice concentration exceeds 95 percent in the region. The trends towards later freeze up in both seas is striking. This has an impact on sea ice thickness as the growth season is shortened, which may lead to thinner ice by the end of winter. On the other hand, later freeze up also means less time for snow accumulation on the sea ice. Since sea ice grows faster for a thinner snowpack, this may partially offset the impacts of late ice formation.
A longer record of Arctic sea ice extent
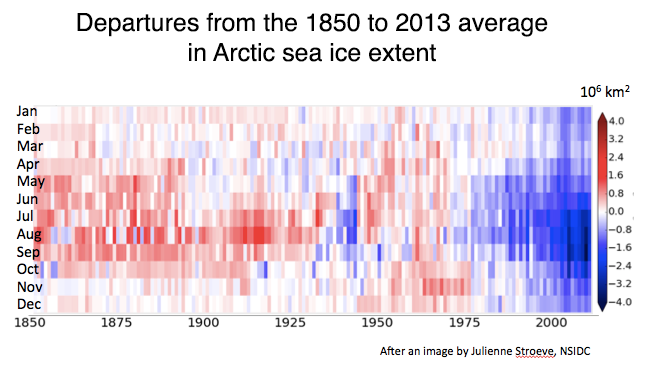
Figure 5a. This figure shows departures from 1850 to 2013 calendar-month averages of Arctic sea ice extent as a function of year (x-axis) and calendar month (y-axis). The color bar at the right shows magnitudes of departures from the average.
Credit: J. E. Walsh, F. Fetterer, J. S. Stewart, W. L. Chapman. 2016. Geographical Review; after a figure by J. Stroeve, National Snow and Ice Data Center
High-resolution image

Figure 5b. These sea ice concentration maps compare the lowest September minimum Arctic sea ice extents for the periods 1850 to 1900, 1901 to 1950, 1951 to 2000, and 2000 to 2013.
Credit: F. Fetterer/National Snow and Ice Data Center, NOAA
High-resolution image
Using a compilation of maps, ship reports, and other records, NOAA has published monthly estimates of Arctic sea ice extent spanning 1850 to 2013. While data in the earlier part of the record is limited, the carefully constructed time series helps to put the more recent satellite record in a longer-term context. Figure 5a shows the decline in extent over the period of satellite observations standing out prominently in comparison with the rest of the record, especially in late summer and early autumn. An earlier period of unusually low summer sea ice extent around 1937 to 1943 (as compared to the 1850 to 2013 average) did not extend to the winter season, and was followed by a few years of significantly higher-than-average summer ice extents. Early in the record (1850 to 1900), winter ice extent was not particularly elevated relative to the 1850 to 2013 average, but summer sea ice extent was quite a bit higher higher than the average. As another way to place recent conditions into a longer context using this data set, we show the years of the lowest September extent recorded within the 50-year periods 1850 to 1900, 1901 to 1950, 1951 to 2000, along with the lowest over the period 2000 to 2013 (Figure 5b). The decline in extent is apparent.
Low sea ice extent in the Antarctic
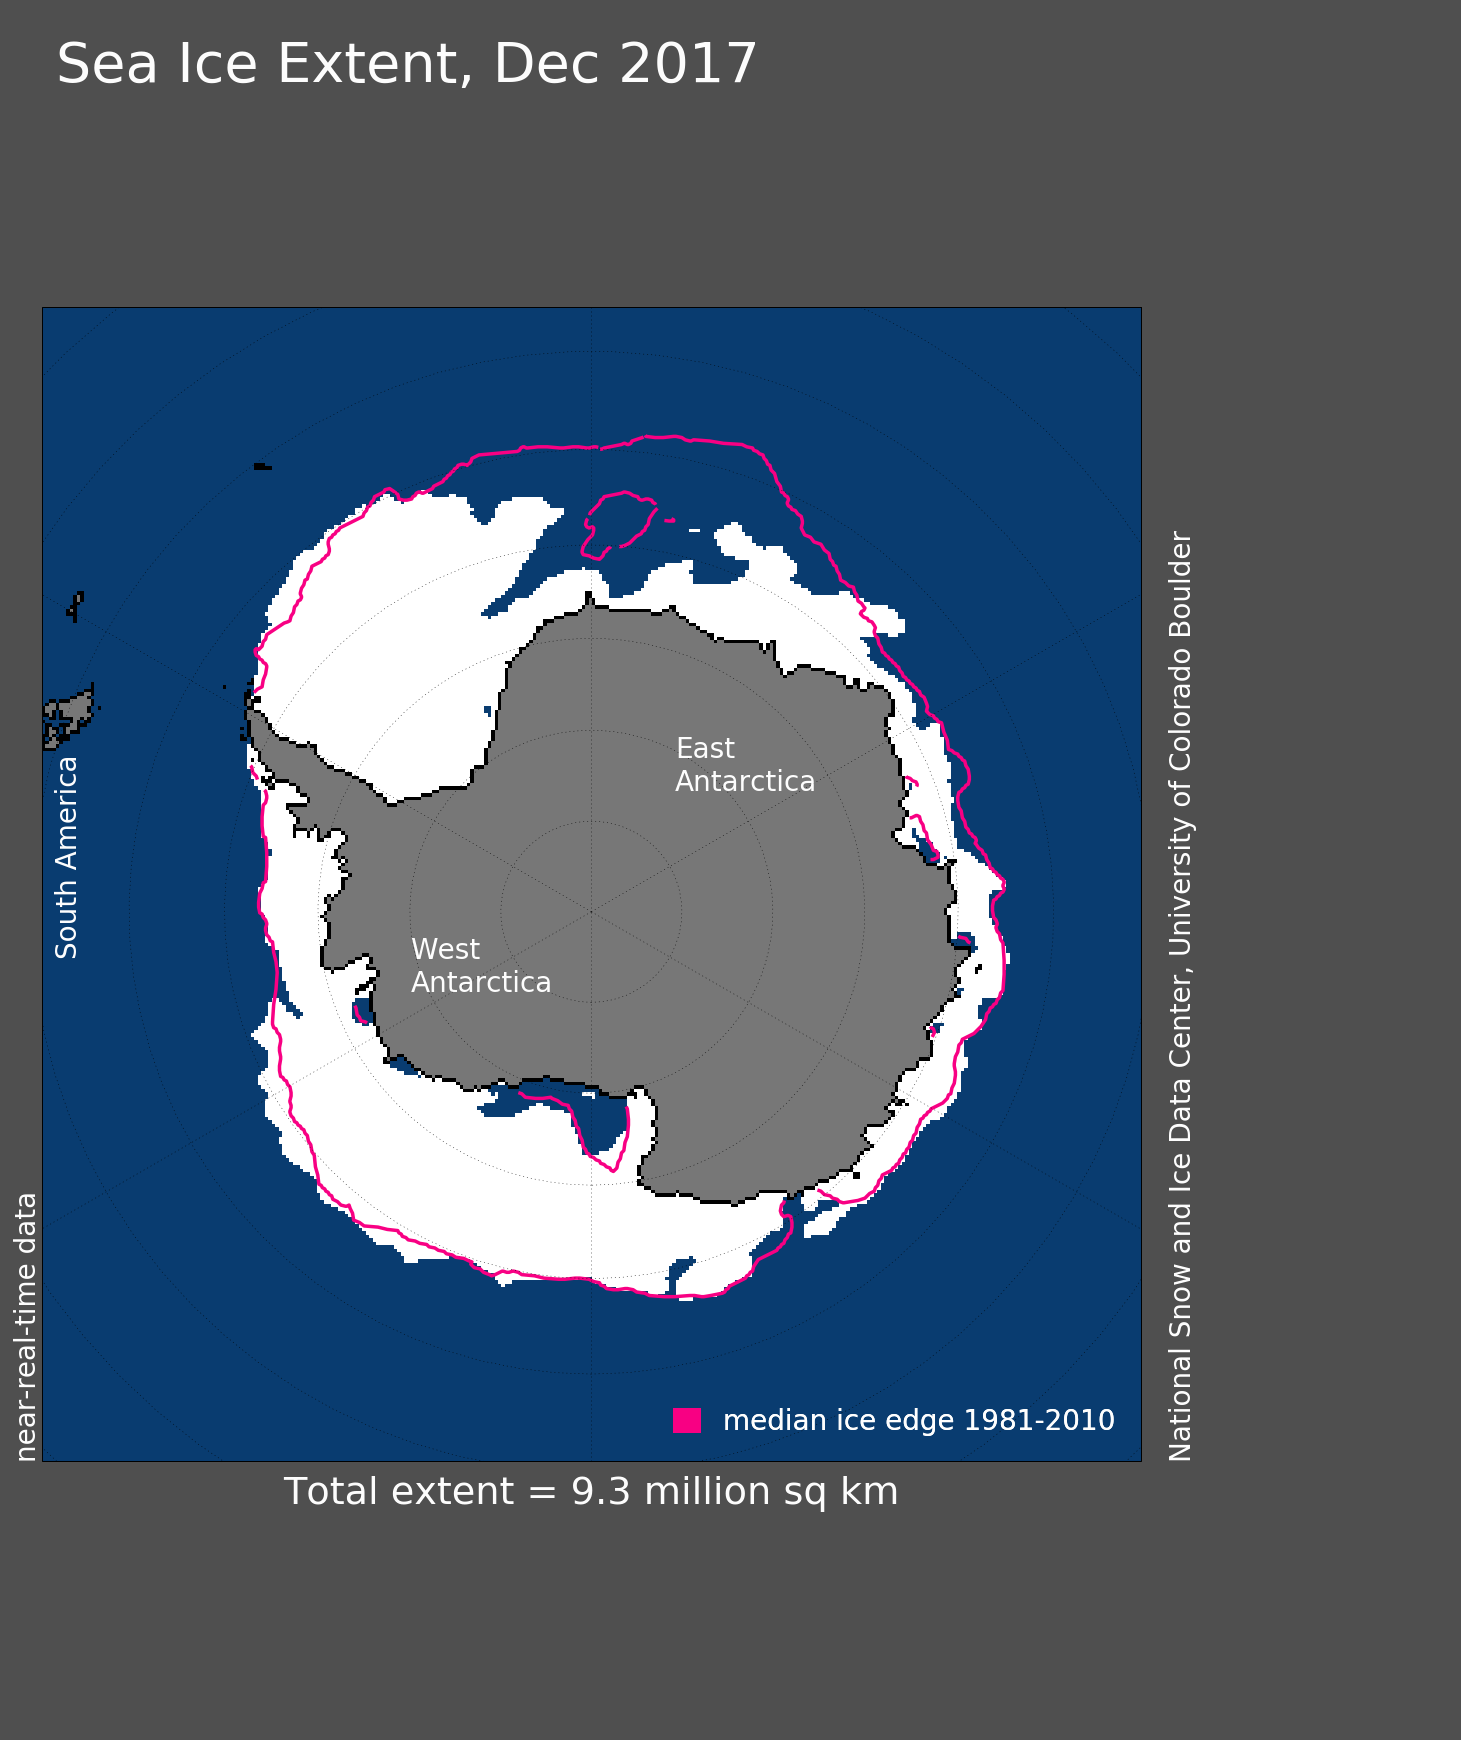
Figure 6. Antarctic sea ice extent for December 2017 was 9.34 million square kilometers (3.61 million square miles). The magenta line shows the 1981 to 2010 average extent for that month. Sea Ice Index data. About the data
Credit: National Snow and Ice Data Center
High-resolution image
In the Southern Hemisphere, sea ice for December 2017 averaged 9.34 million square kilometers (3.61 million square miles) and was the fourth lowest in the satellite record. Sea ice extent was far below average in the eastern Weddell Sea, but above average in the northwestern Weddell Sea. The East Antarctic coastline had near-average ice extent. As the Southern Hemisphere entered into the summer months, sea ice declined steeply. Temperatures at the 925 hPa level were 1 to 3 degrees Celsius (2 to 5 degrees Fahrenheit) higher than average in Dronning Maud Land and the northern Ross Sea, and generally lower than average over the ice sheet. Near-average temperatures have prevailed over the fringing Southern Ocean. Pressures were slightly above average over the continent and below average in the surrounding ocean. Consistent with this pattern, the Southern Annular Mode index, a measure of the strength of westerly winds, was moderately positive for December.
Further reading
Walsh, J. E., F. Fetterer, J. S. Stewart, and W. L. Chapman. 2016. A database for depicting Arctic sea ice variations back to 1850. Geographical Review. doi: 10.1111/j.1931-0846.2016.12195.x.

