The Arctic freeze-up season is well underway, with ice extent increasing faster than average for most regions in November. Exceptions were in the Chukchi and Barents Seas, where the ice has been slow to form. November snow cover over North America was the most extensive since 1966.
Overview of conditions
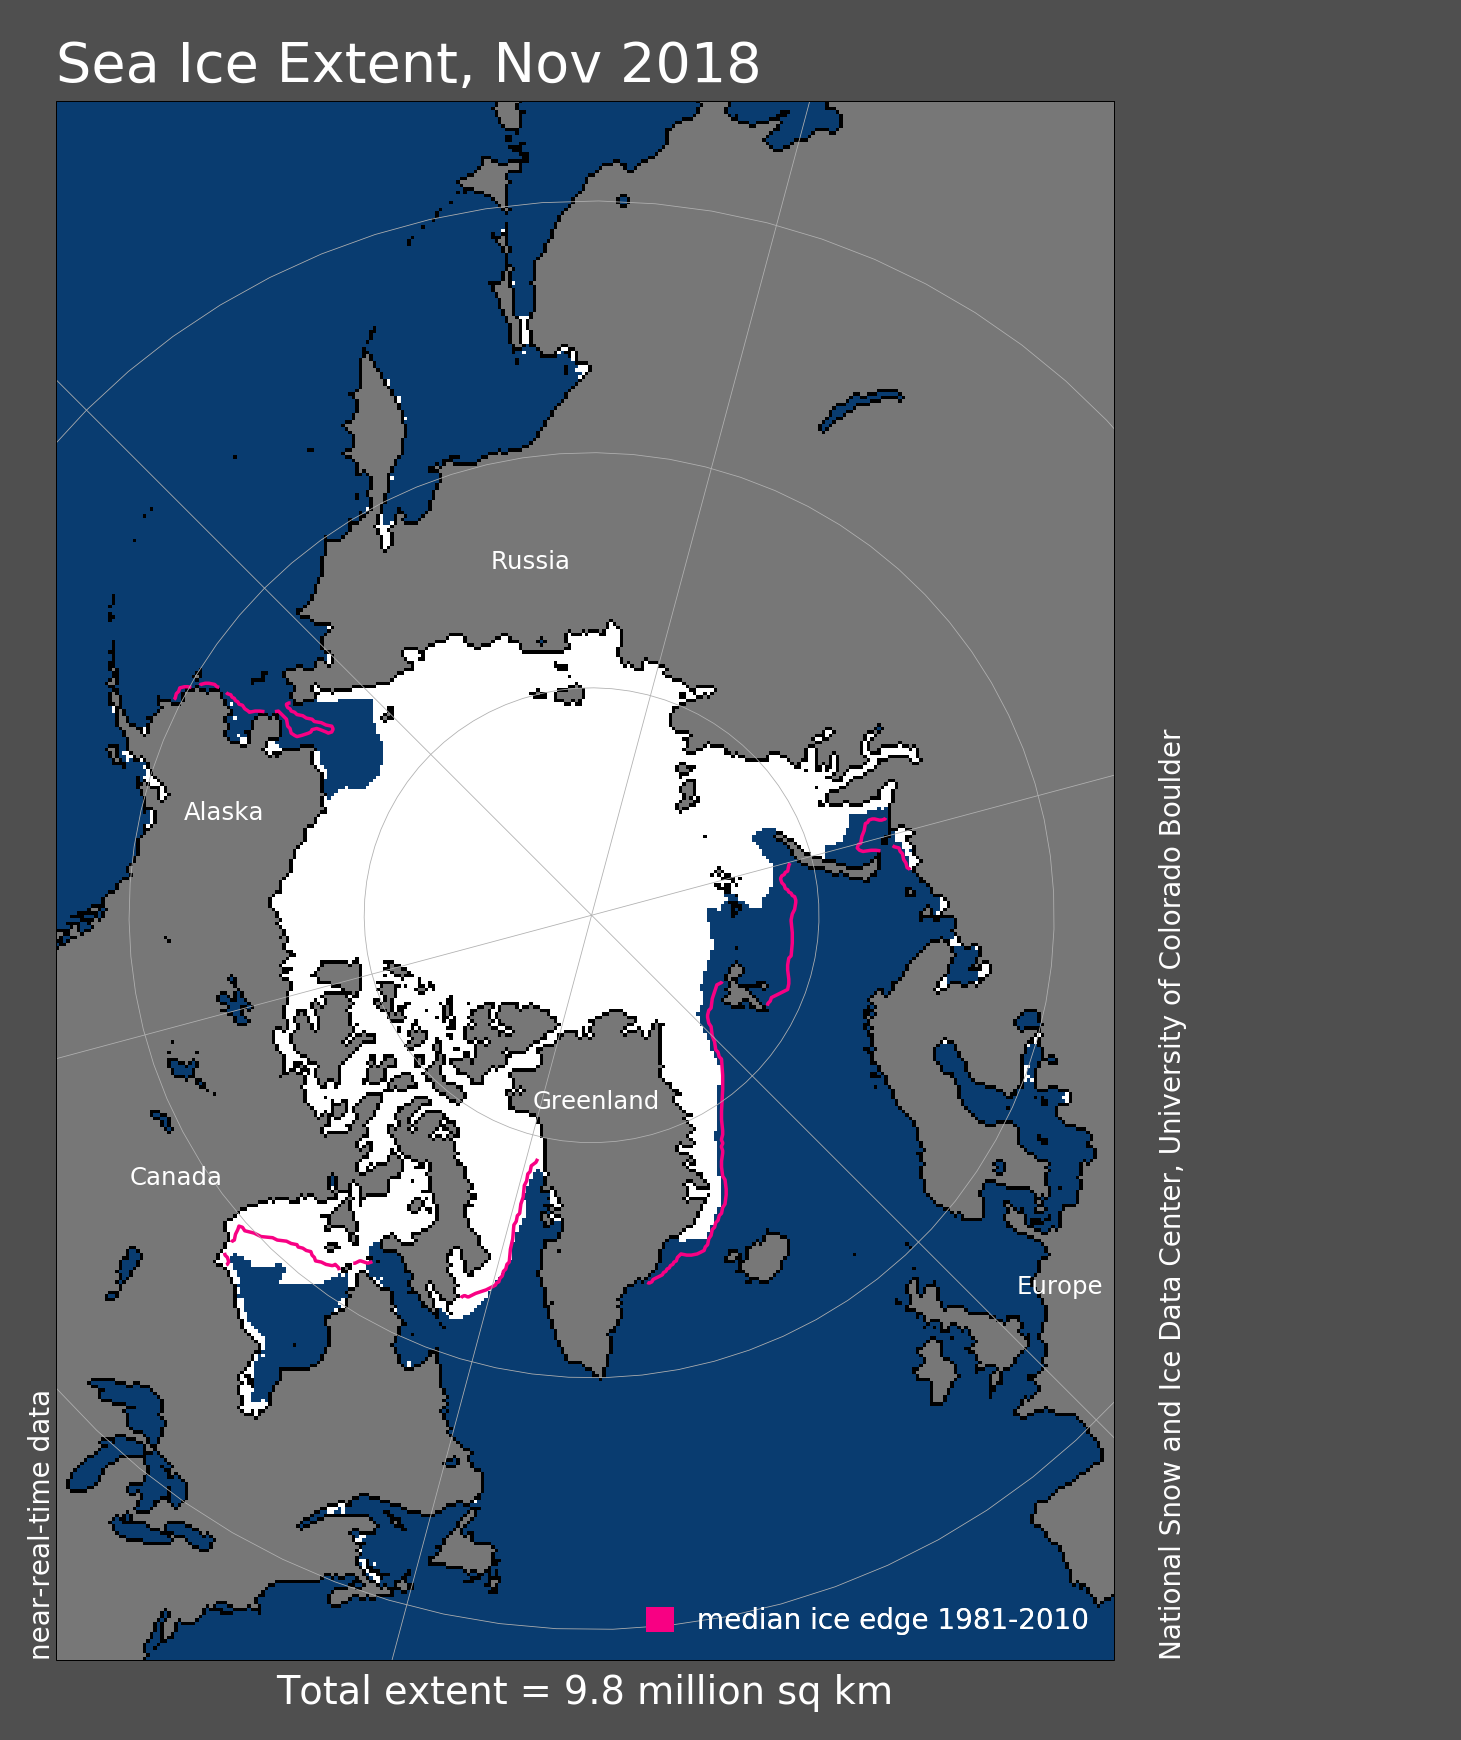
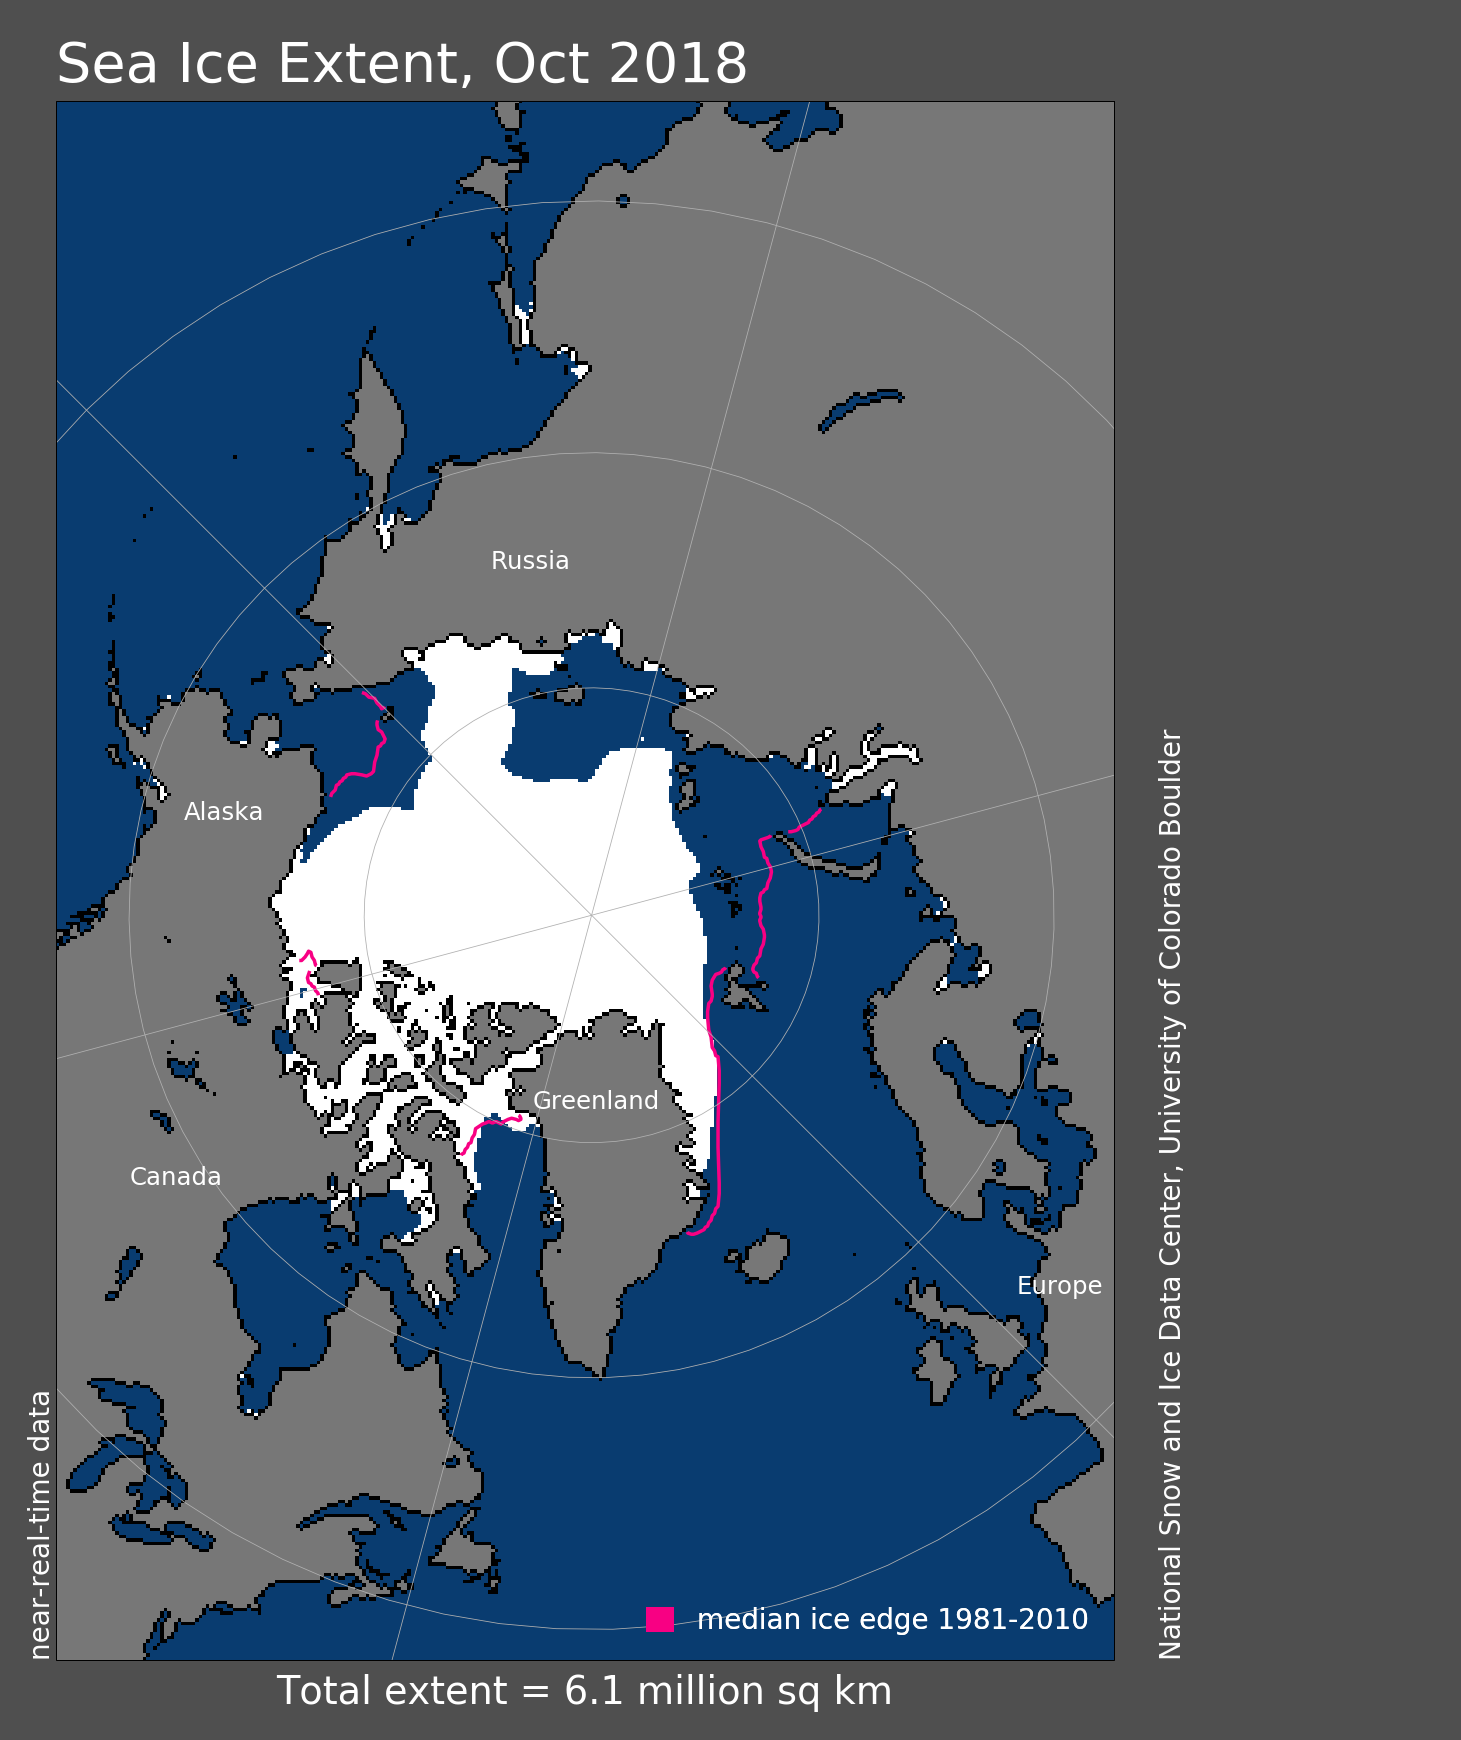
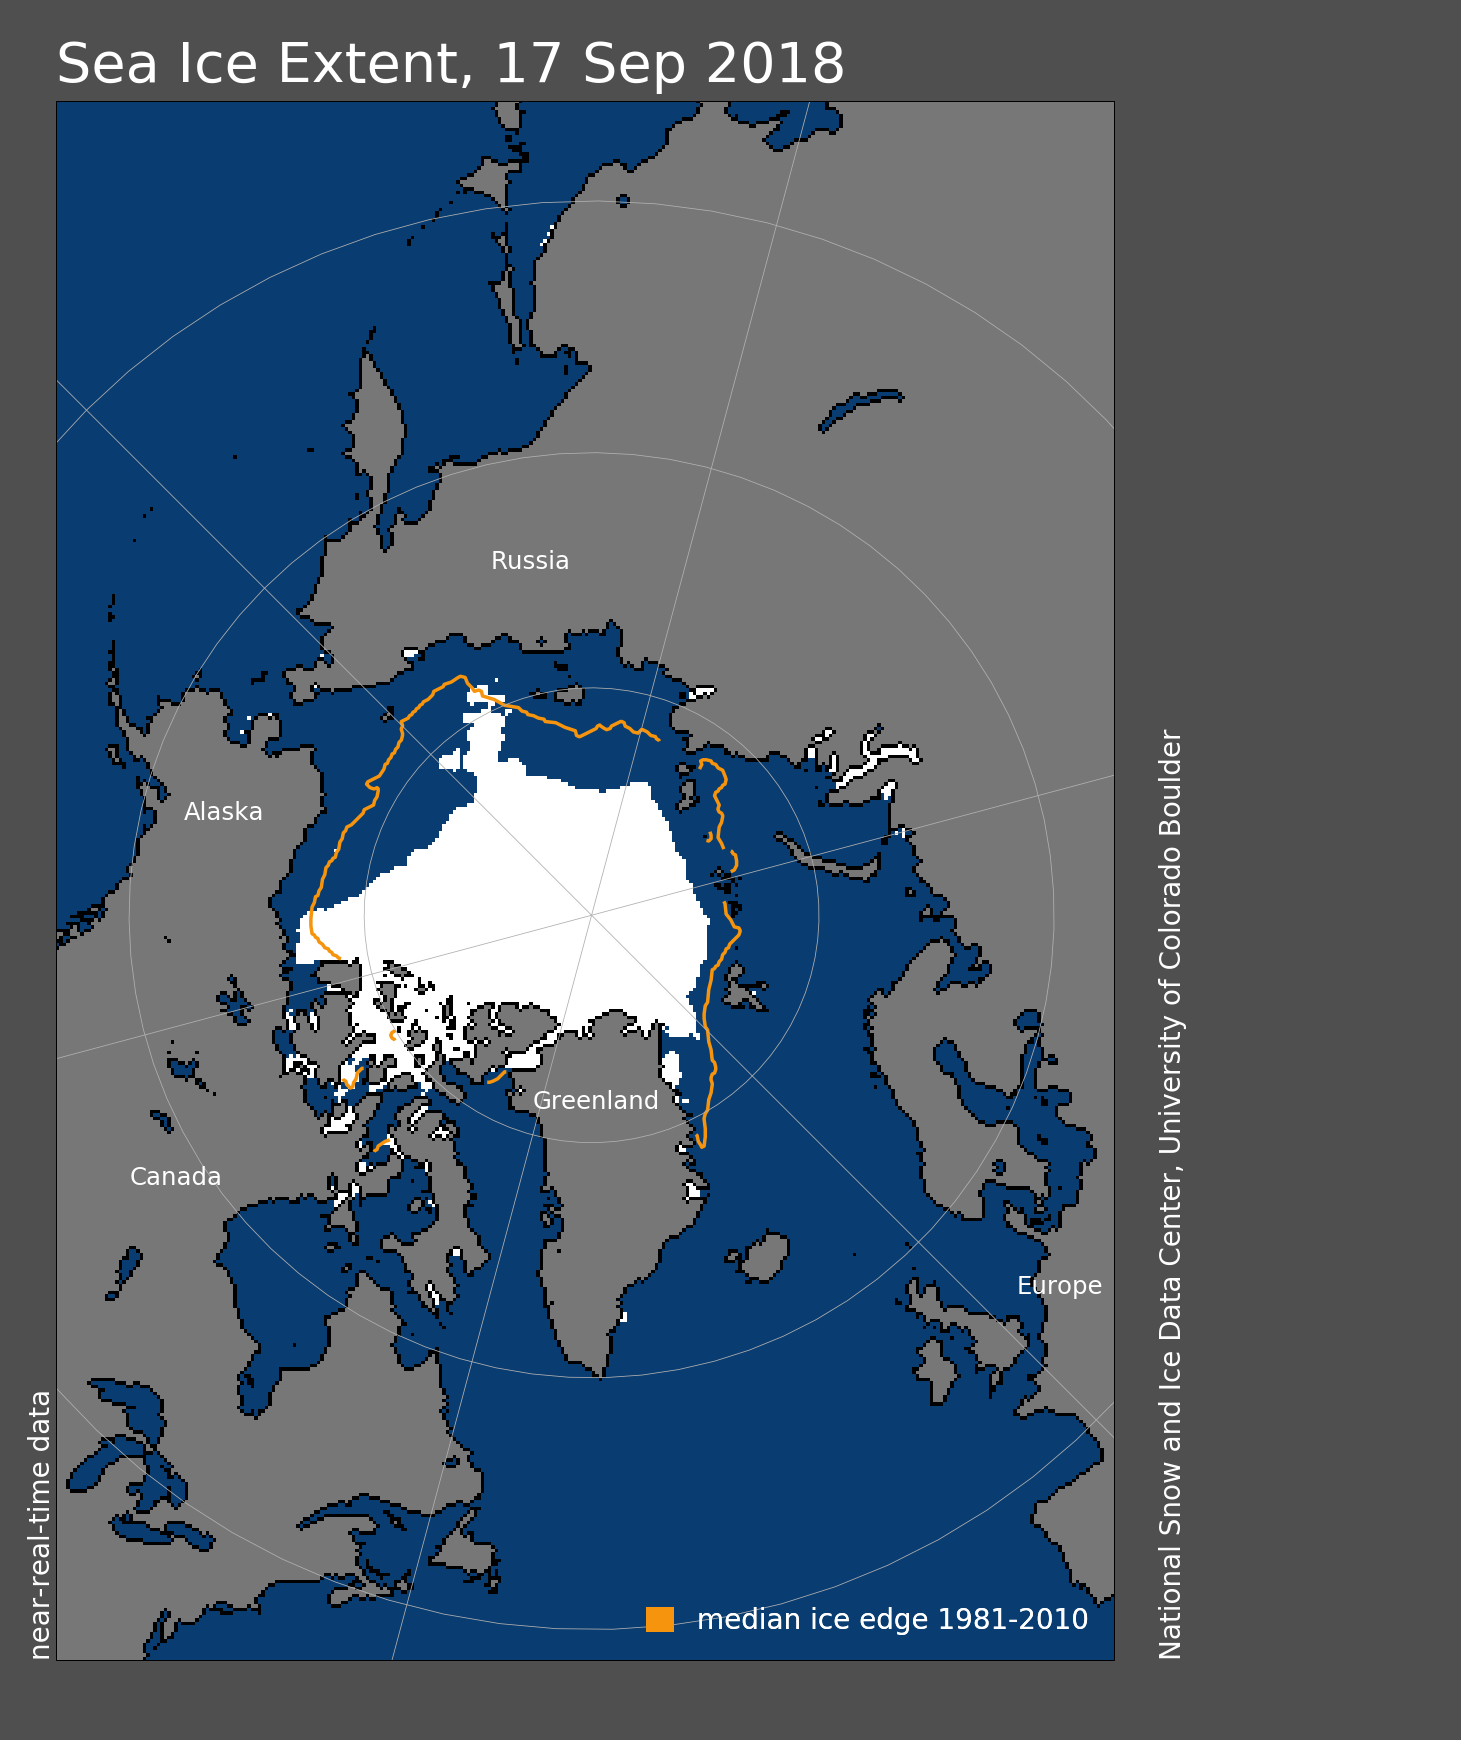
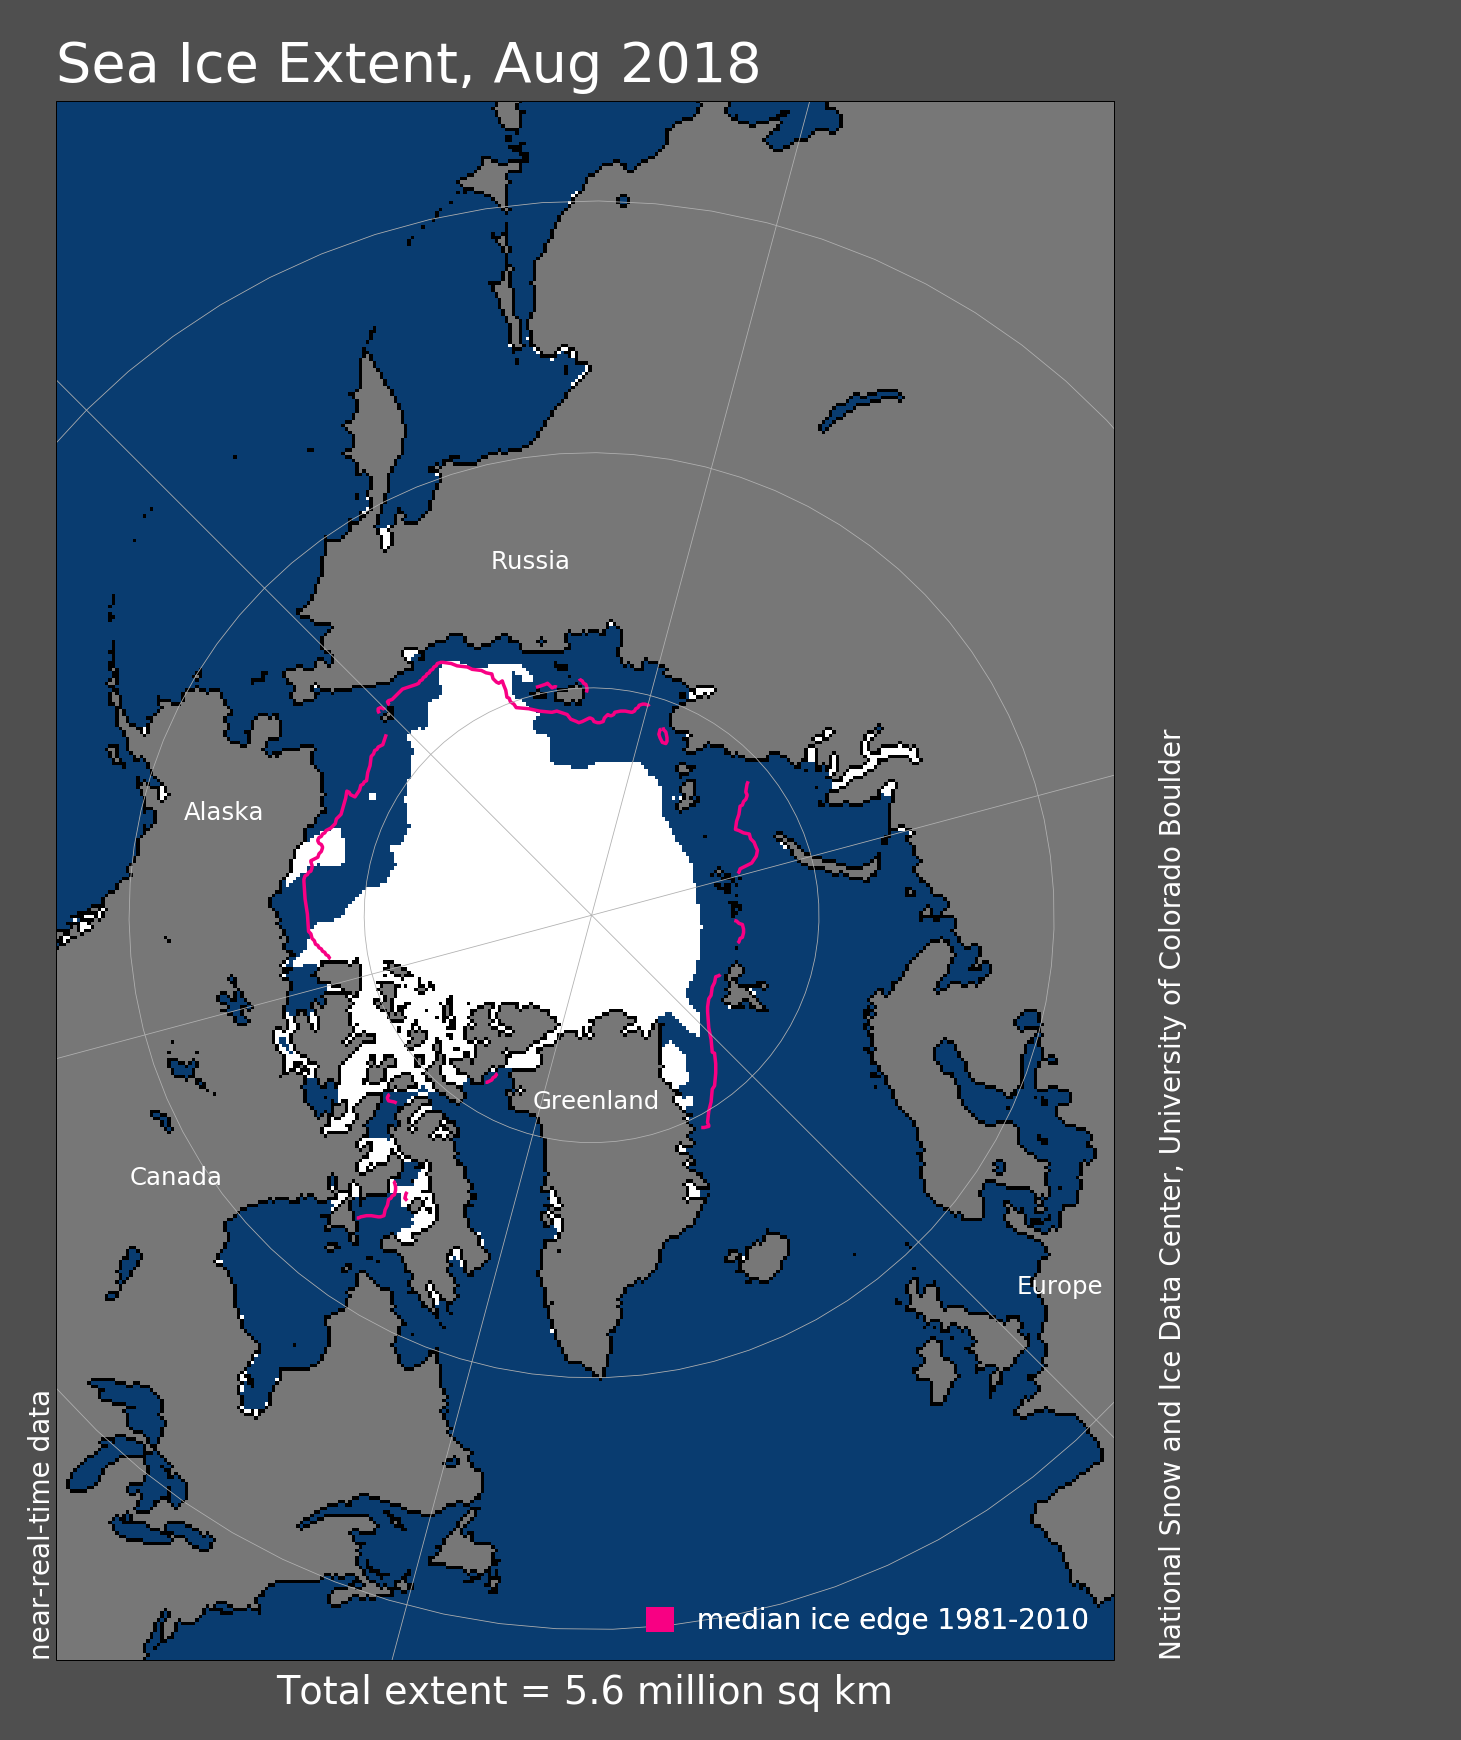
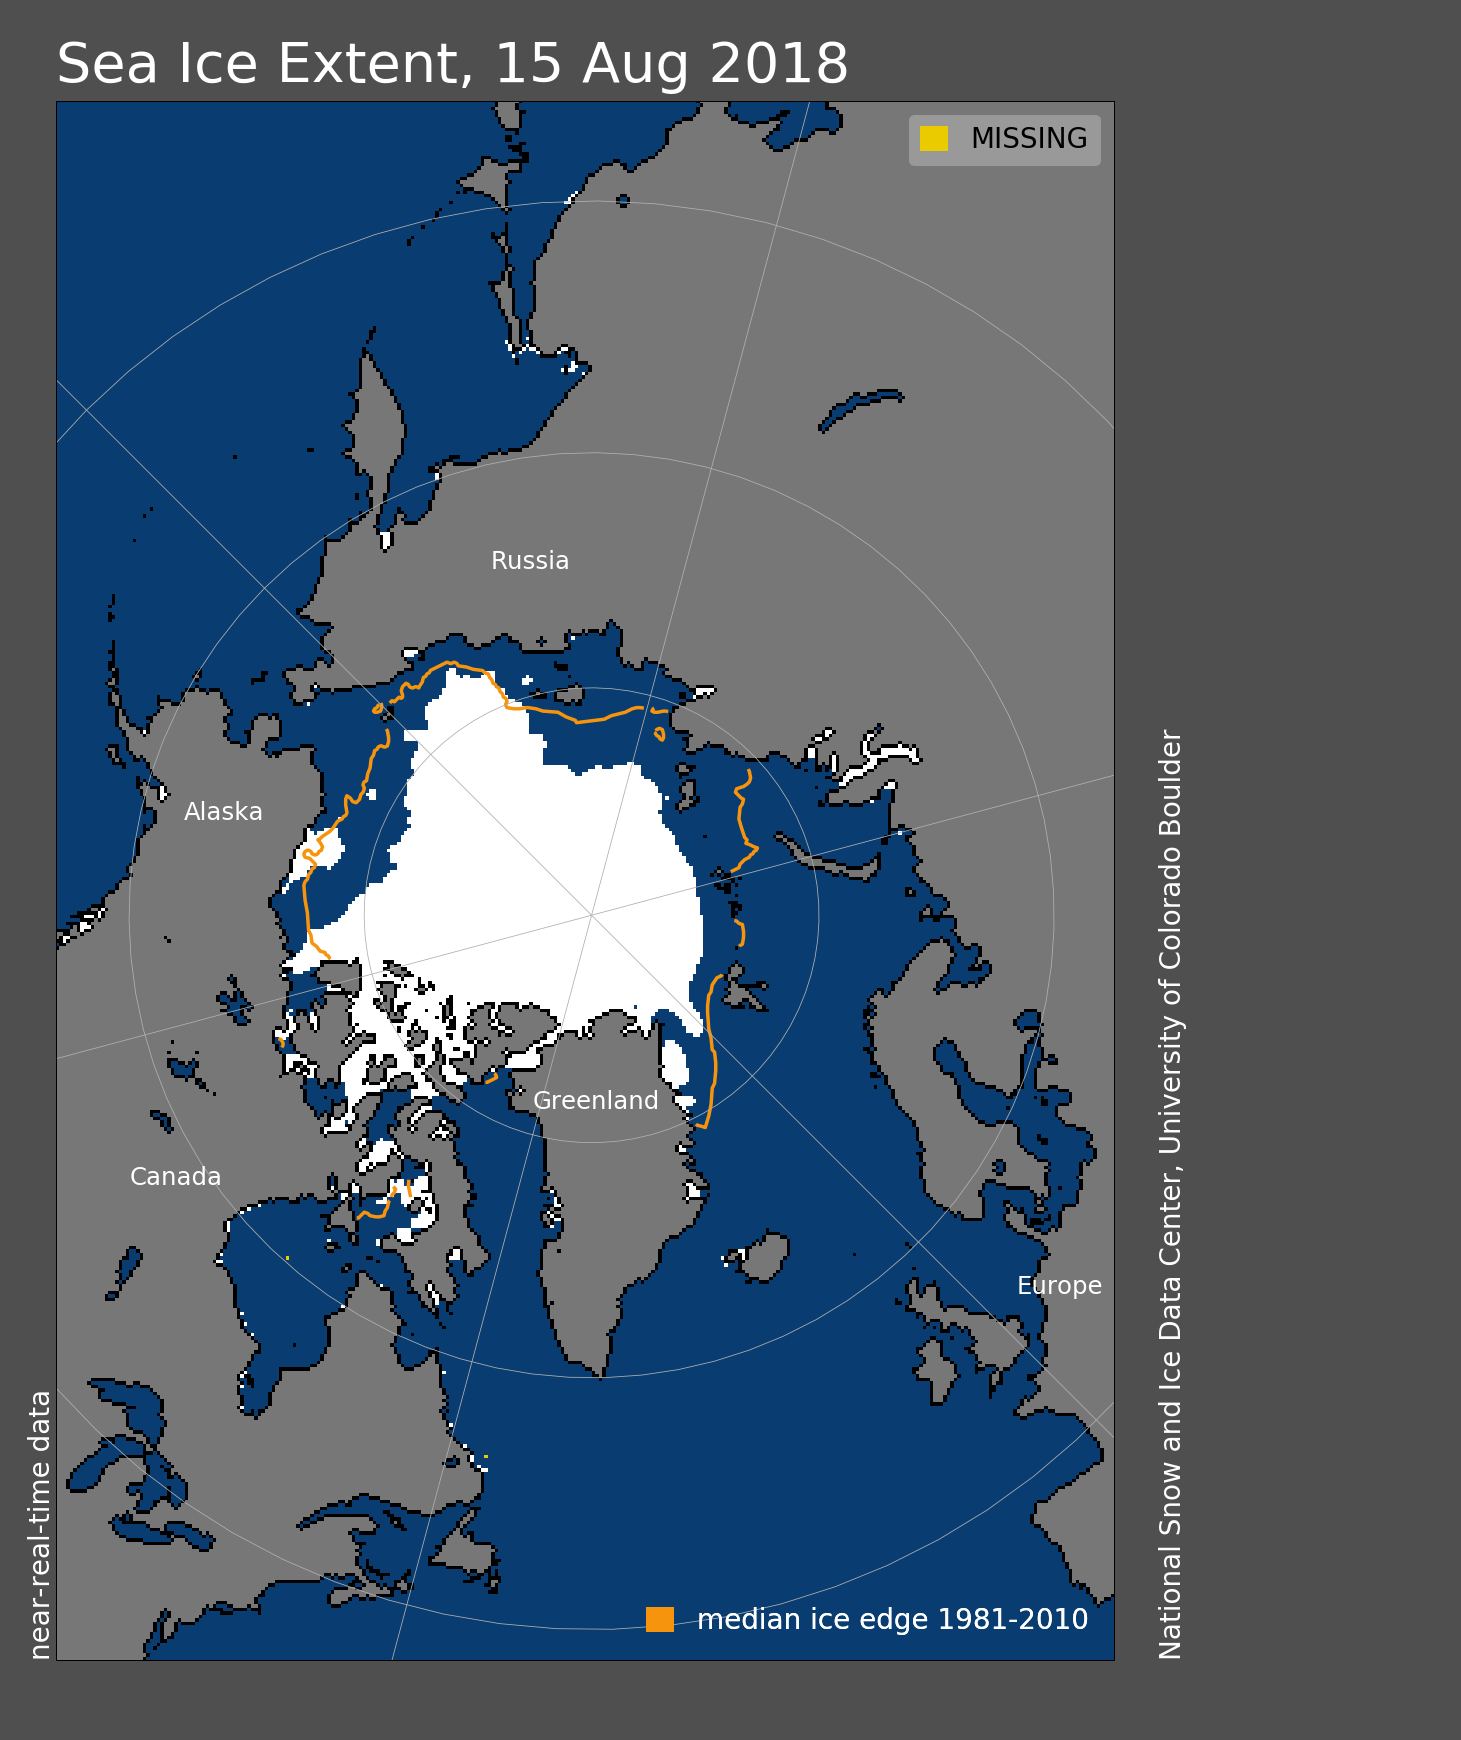
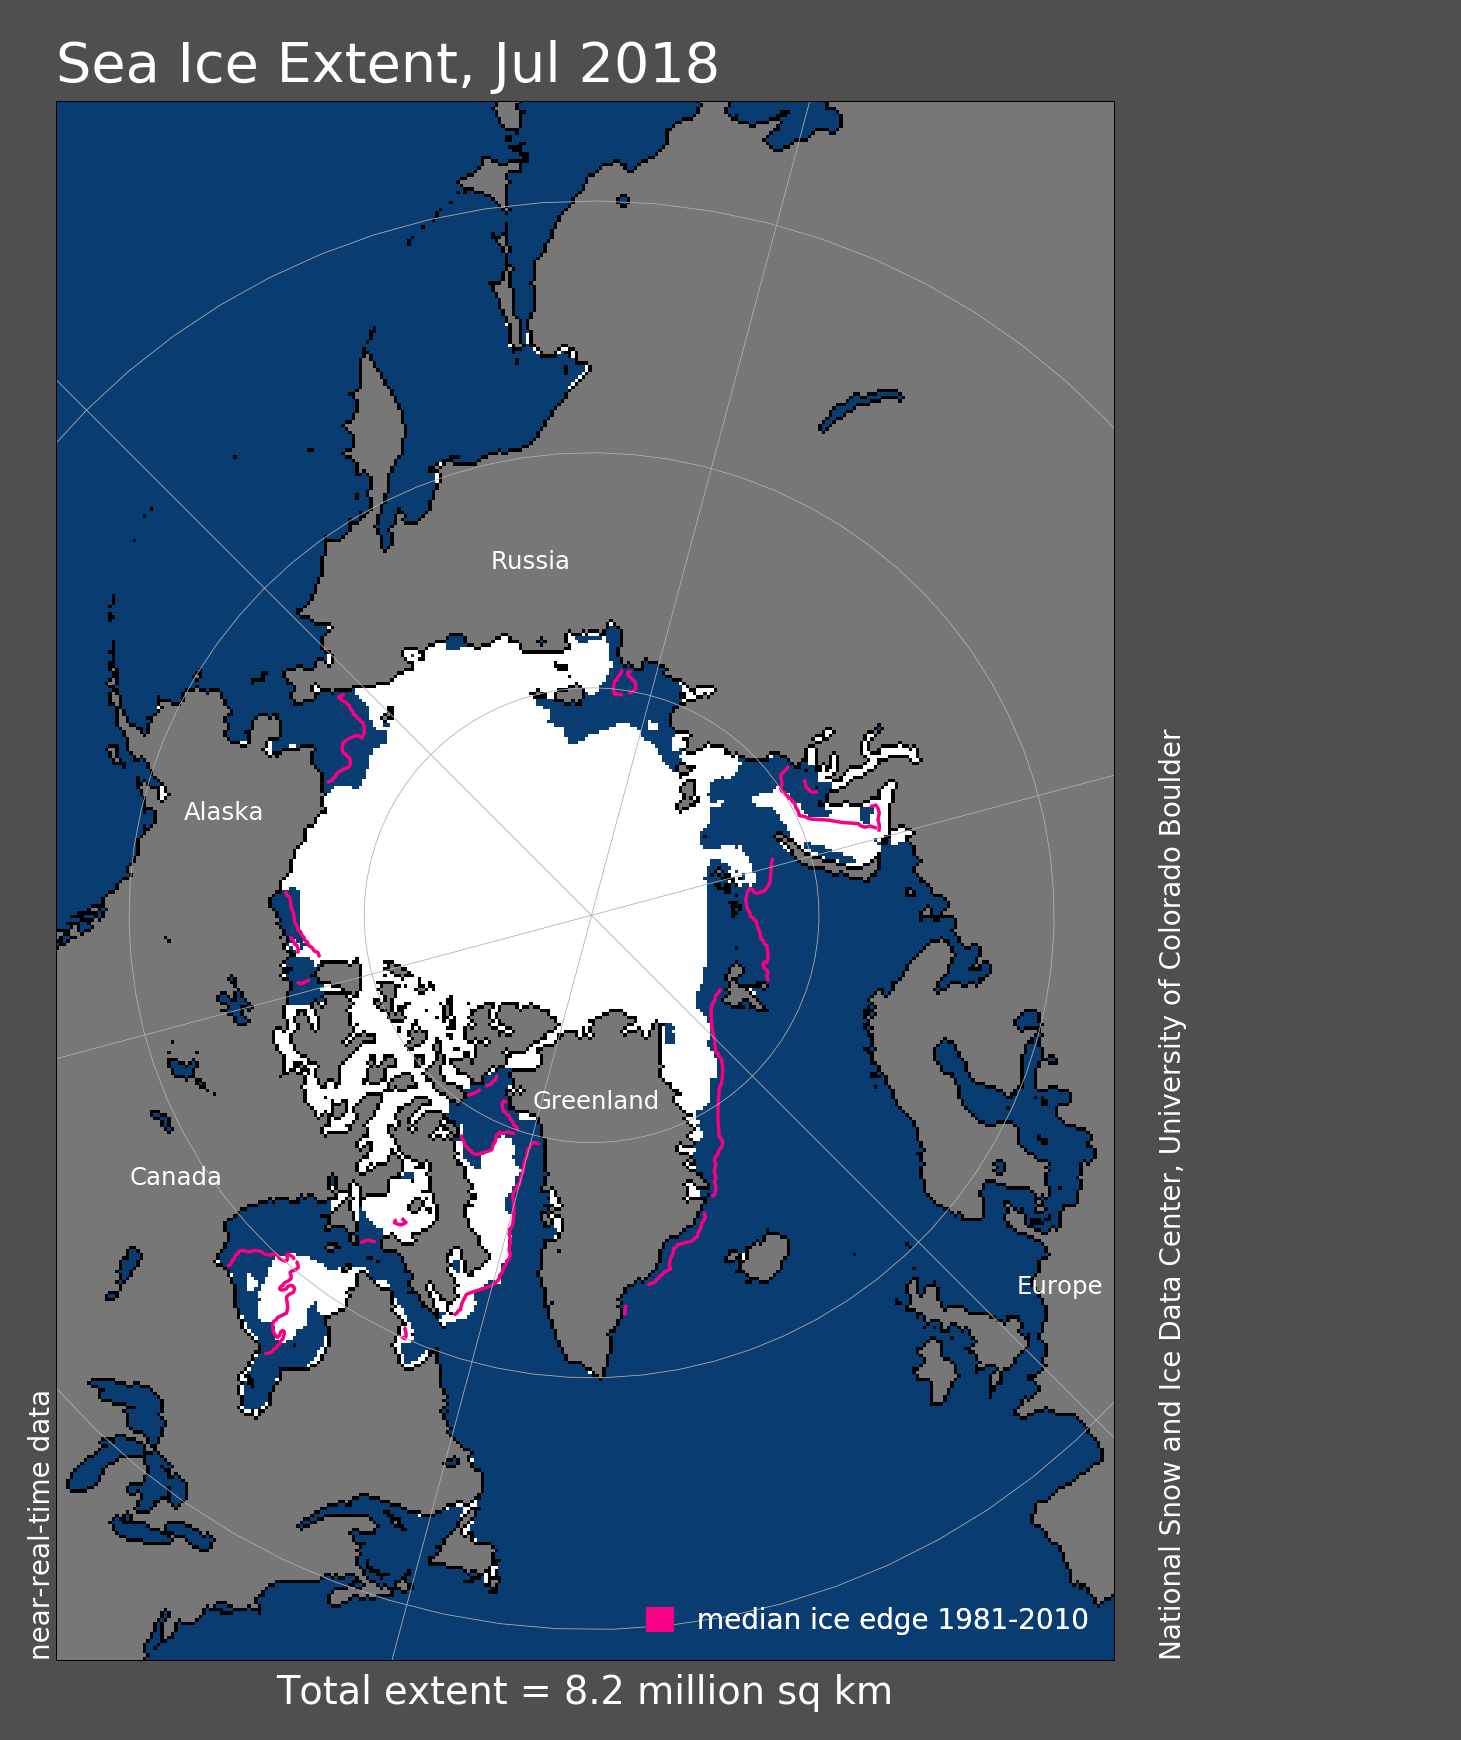
Figure 1. Arctic sea ice extent for November 2018 was 9.80 million square kilometers (3.78 million square miles). The magenta line shows the 1981 to 2010 average extent for that month. Sea Ice Index data. About the data
Credit: National Snow and Ice Data Center
High-resolution image
Arctic sea ice extent for November averaged 9.80 million square kilometers (3.78 million square miles). This was the ninth lowest November in the 1979 to 2018 satellite record, falling 900,000 square kilometers (347,000 square miles) below the 1981 to 2010 average, yet 1.14 million square kilometers (440,000 square miles) above the record November low in 2016.
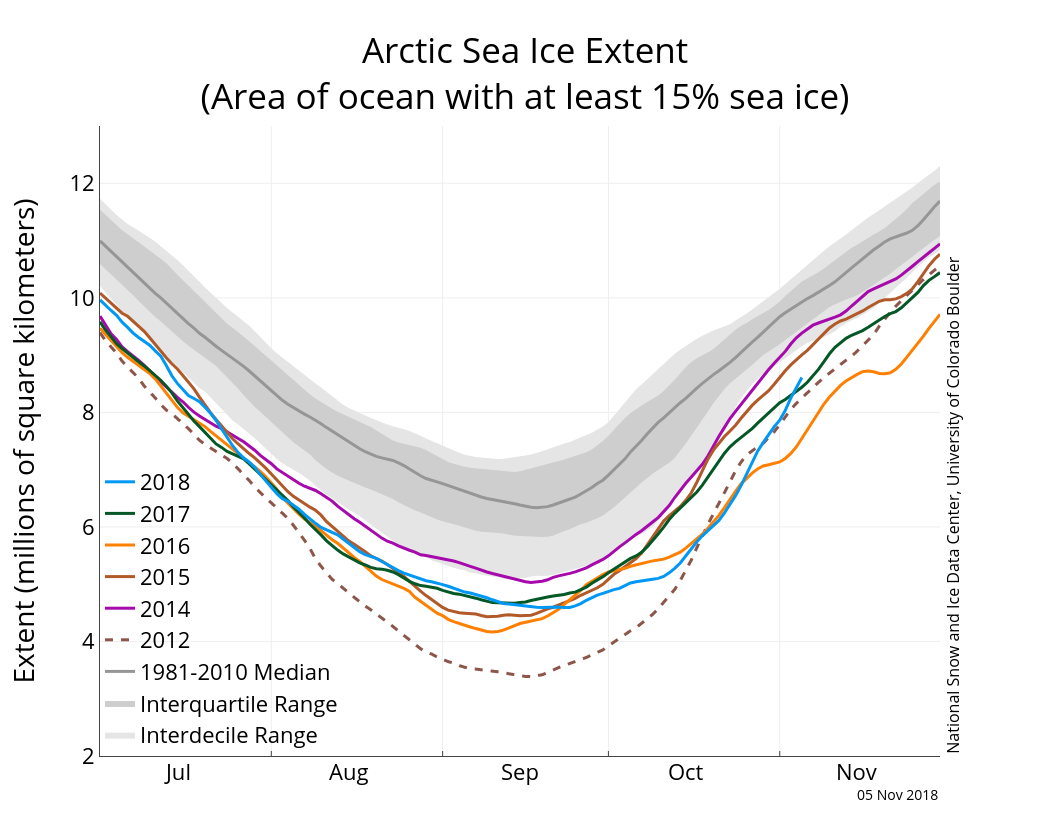
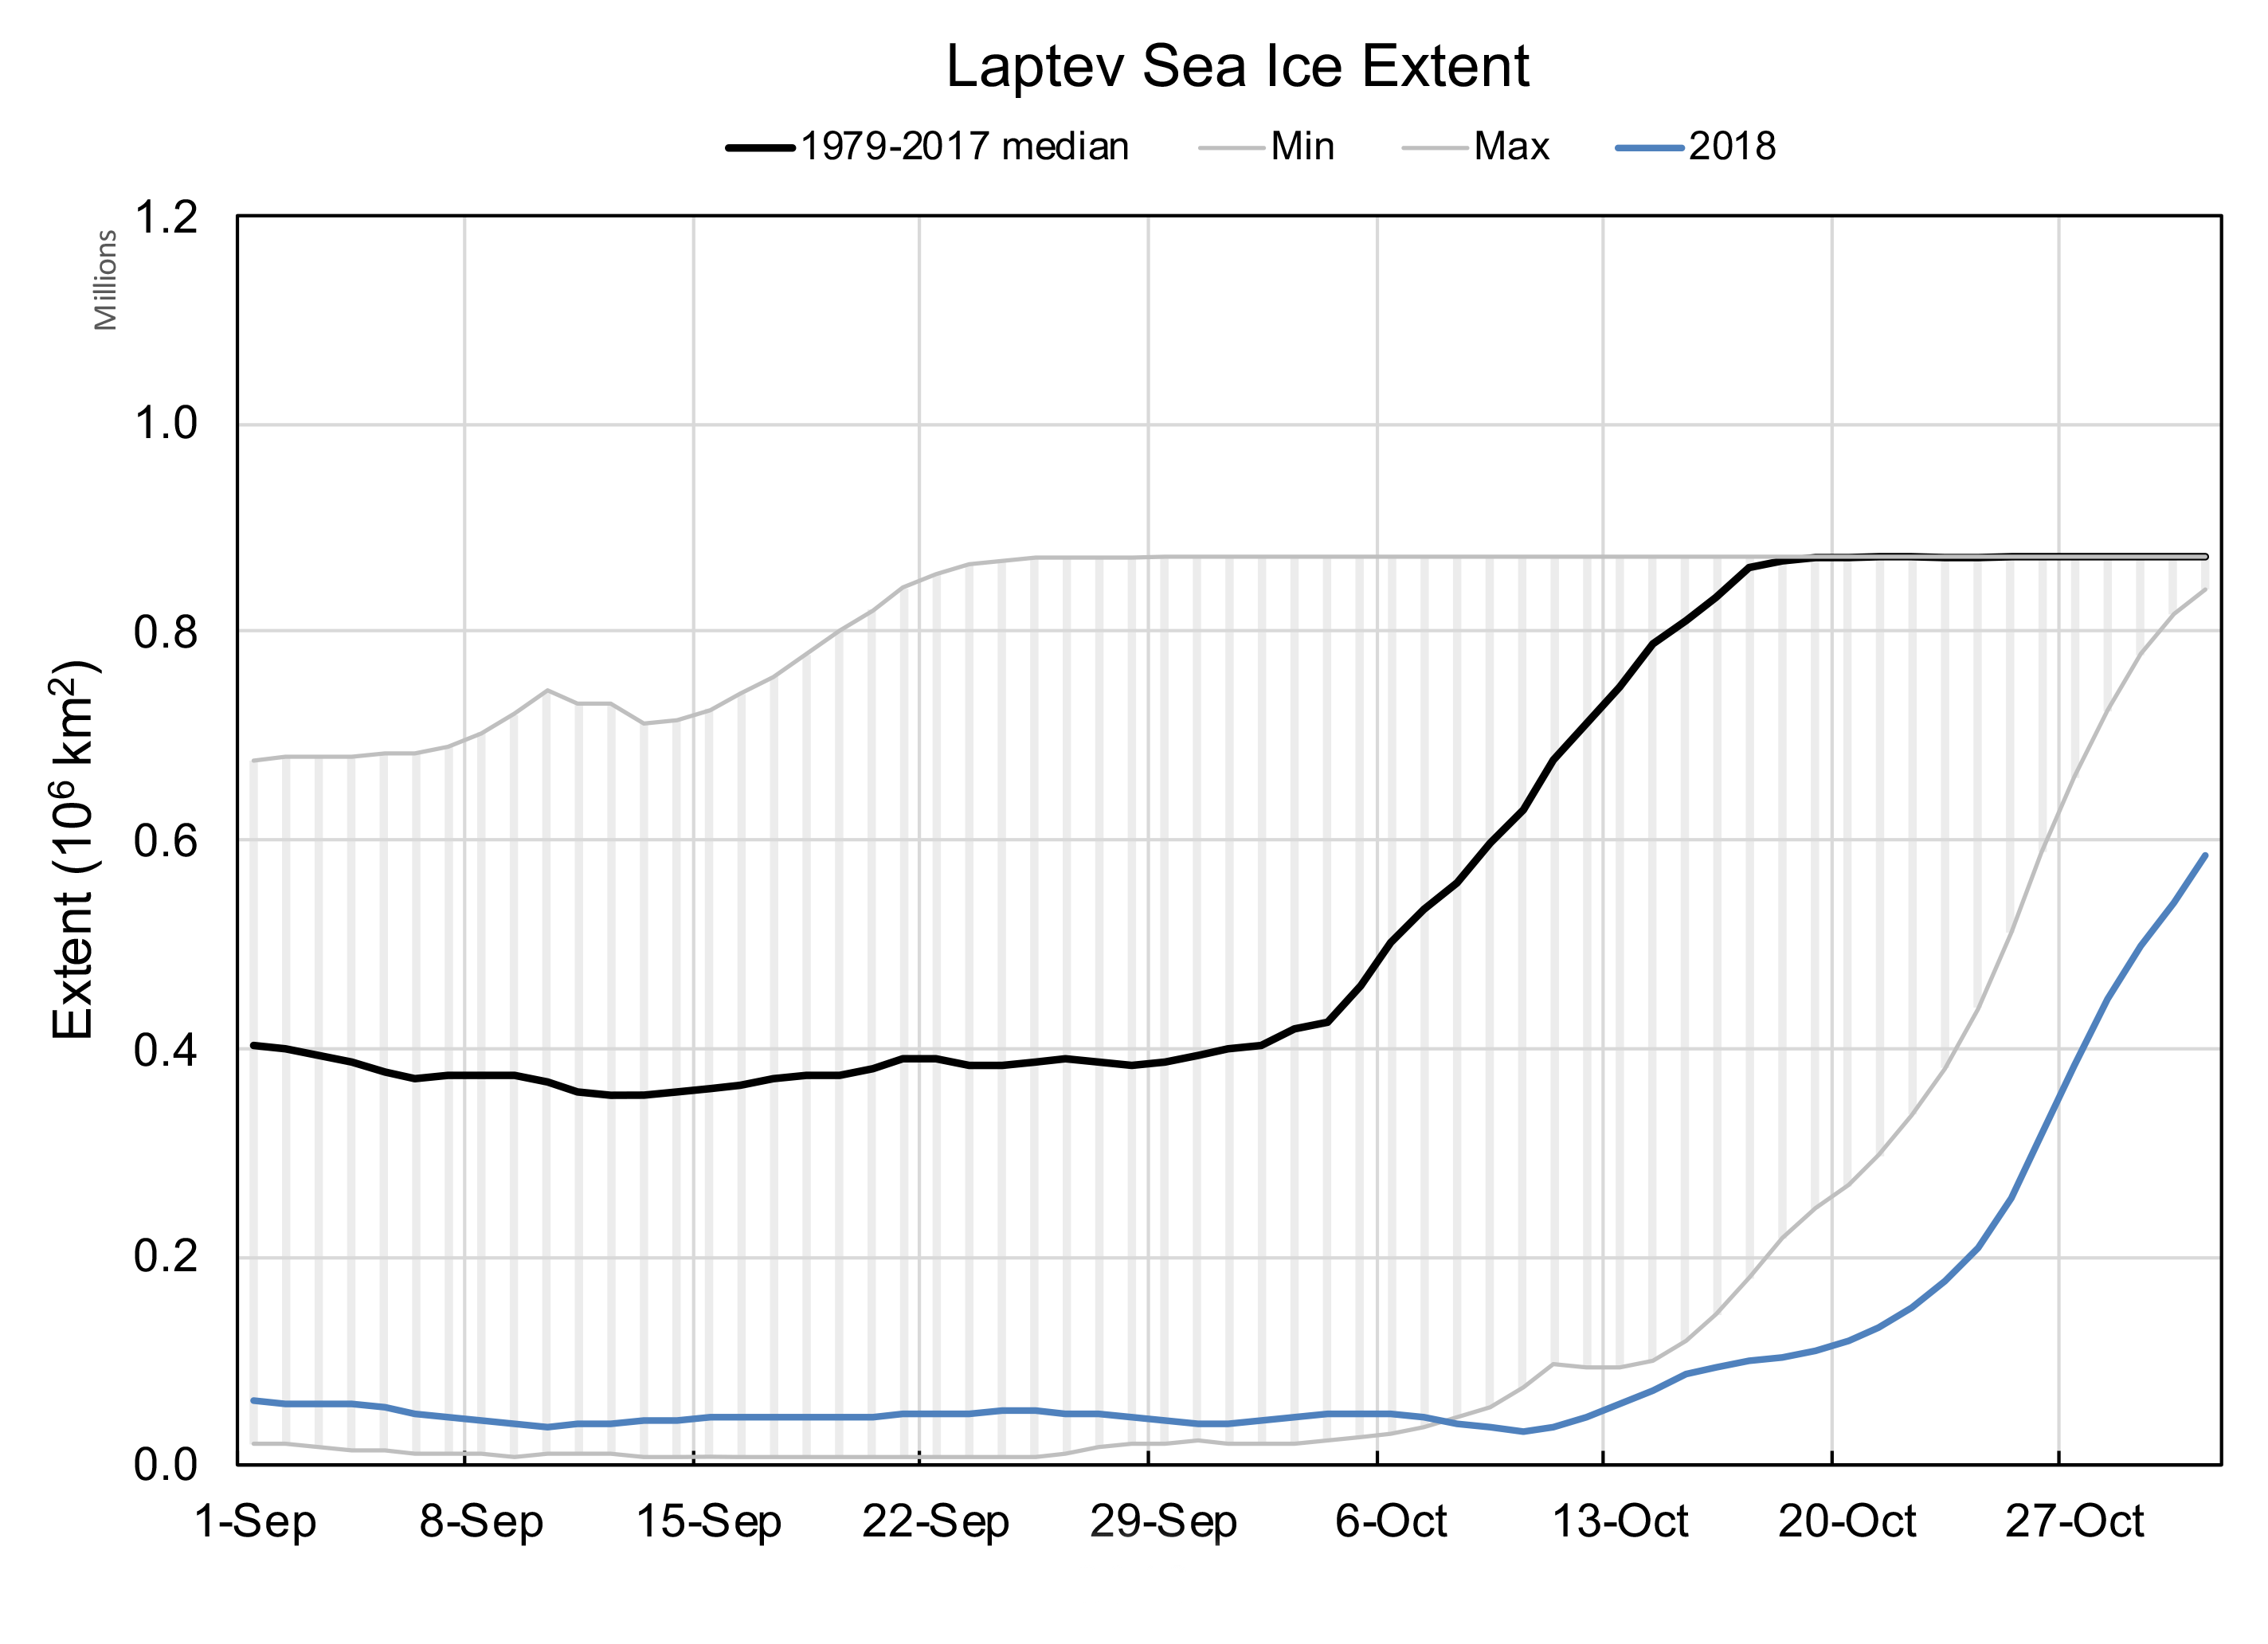
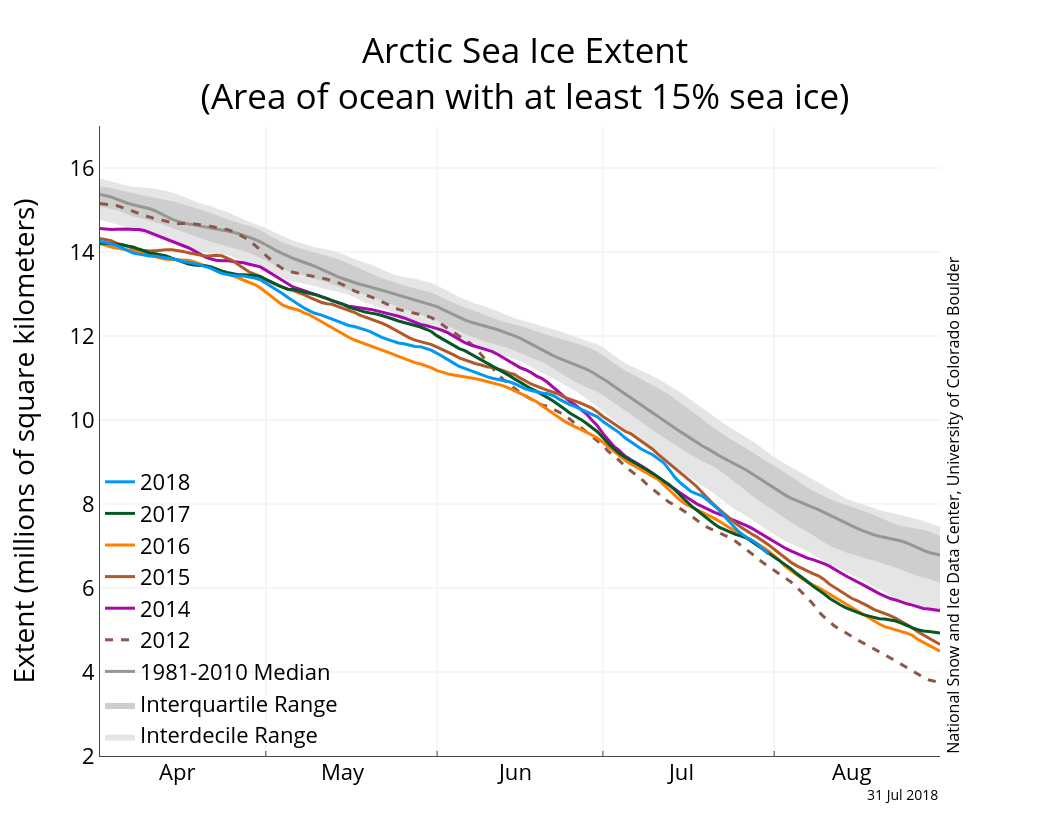
Sea ice extent increased quite rapidly during the early part of the month, bringing the extent within the interdecile range of the 1981 to 2010 climatology during the latter half of the month. This was due in part to the Laptev Sea finally freezing up after having extensive open water through the end of October, as discussed in our previous post. There was also considerable ice growth in Hudson Bay, Baffin Bay, the Chukchi Sea, and the Kara Sea. This rapid growth is not particularly surprising. As the sun has set in the Arctic, the atmosphere has strongly cooled. As soon as the remaining open ocean water loses its heat to the atmosphere, ice growth occurs. Further, the increased area of open water in summer had led to increased frequency of rapid ice growth events in mid to late autumn, in which more than 1 million square kilometers (386,000 square miles) of ice can form within a 7-day period (see Stroeve and Notz, 2018).
Despite relatively fast ice growth during November, at the end of the month substantial open water still remained in the Chukchi and Barents Seas. The Chukchi Sea was in general completely ice covered by the end of November in the 1980s through to the early 2000s. However, low ice extent in the Chukchi Sea into late autumn has become quite common in recent years and this year’s extent is comparable to the new normal for this time of year in the region. Similarly, in the Barents Sea, low autumn extent has become common in recent years as warm Atlantic water is preventing ice growth farther north—a process called “Atlantification.”
Conditions in context
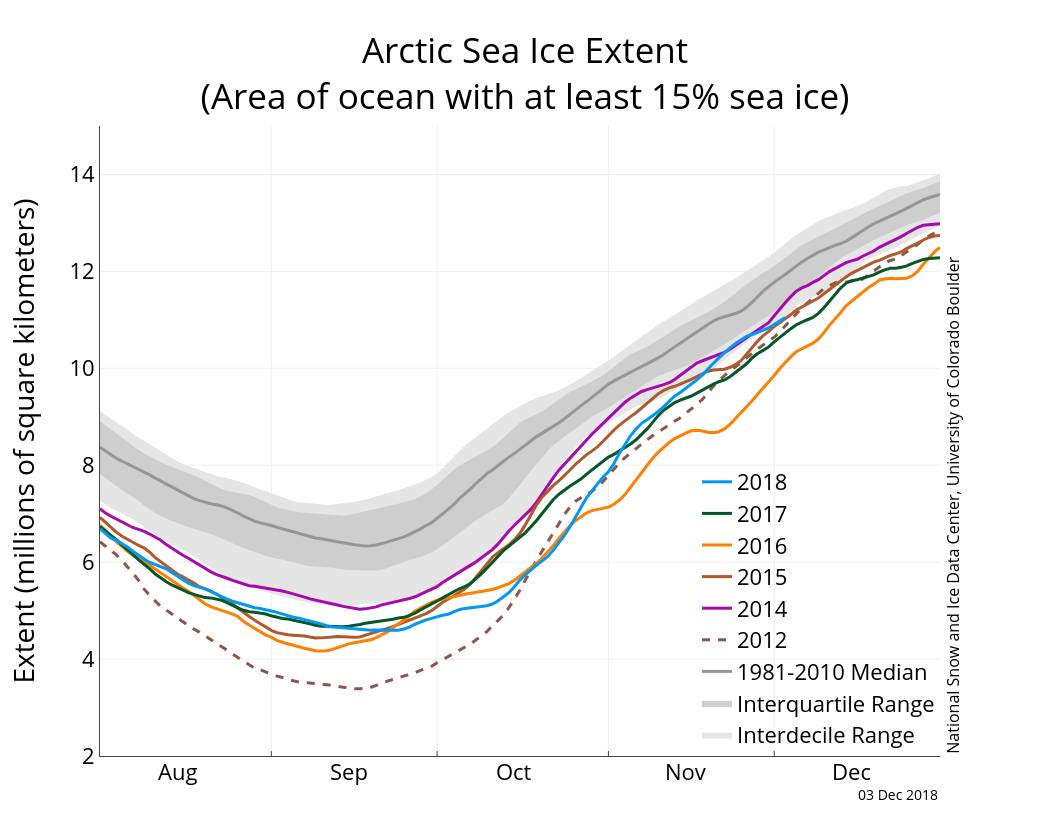
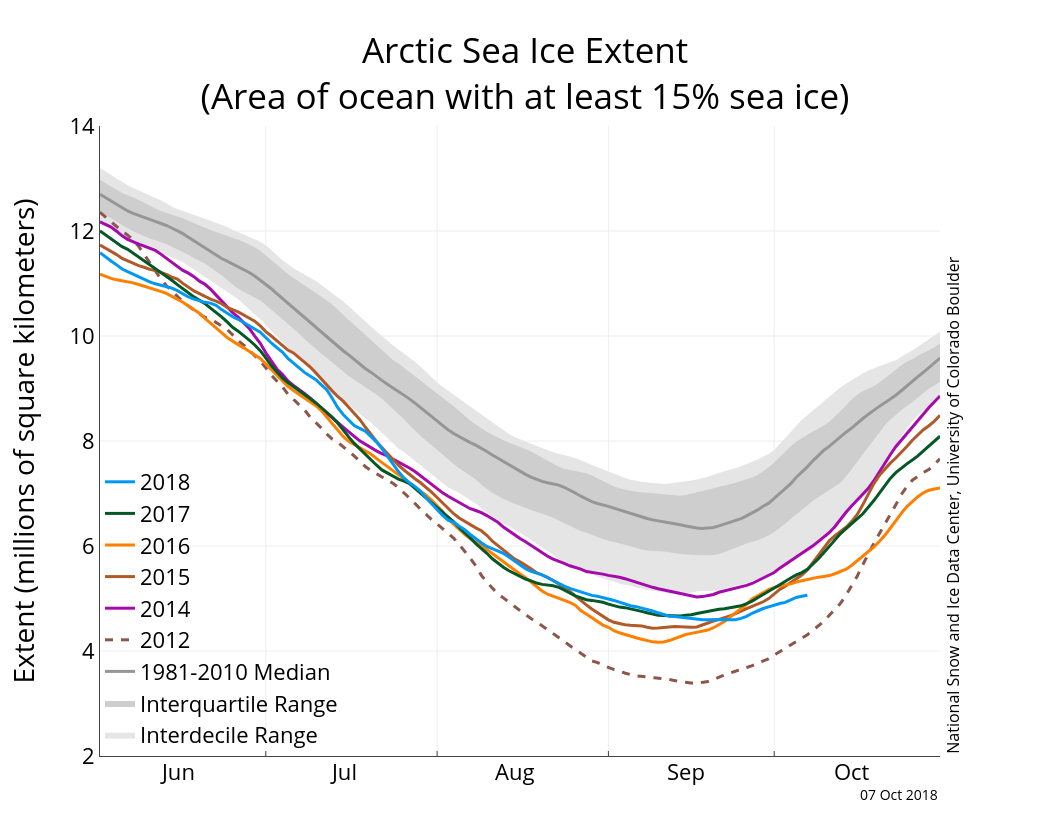
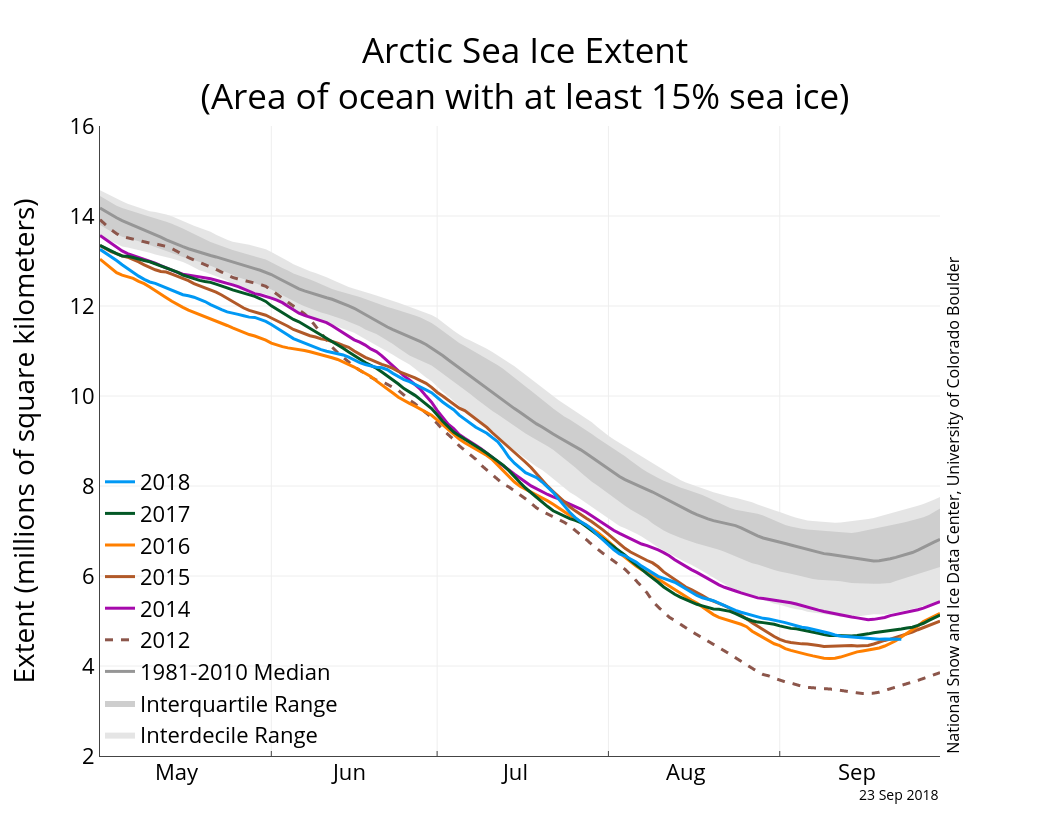
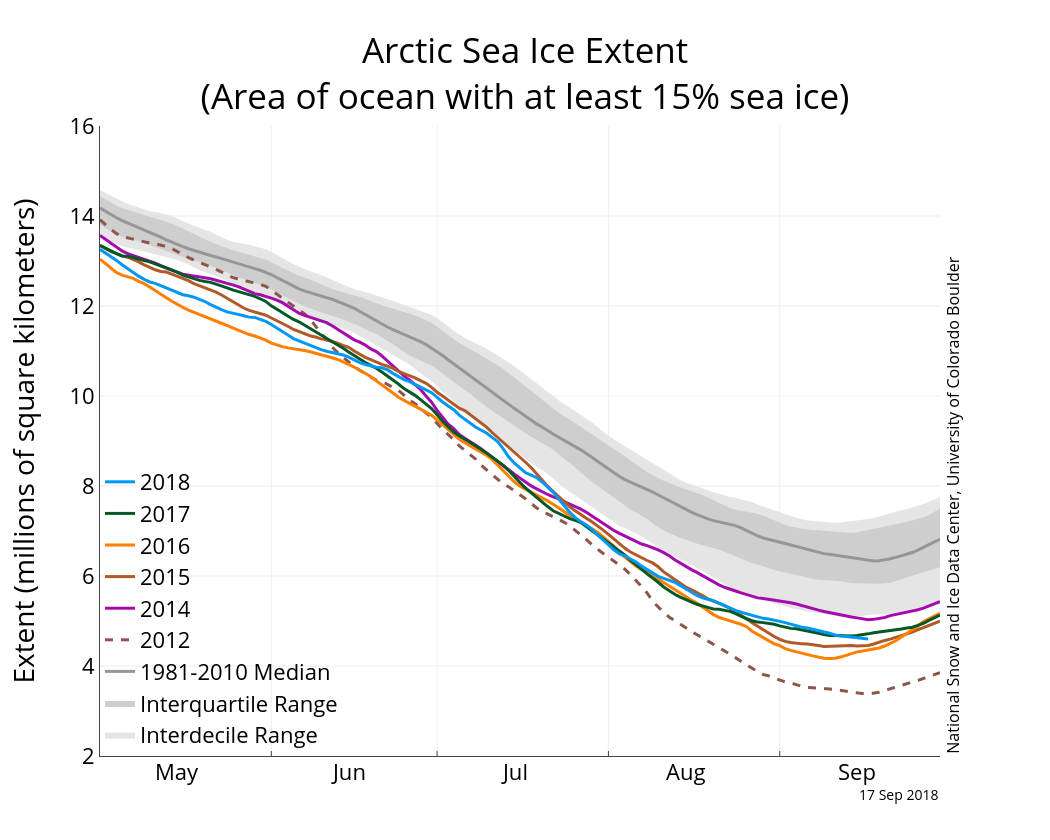
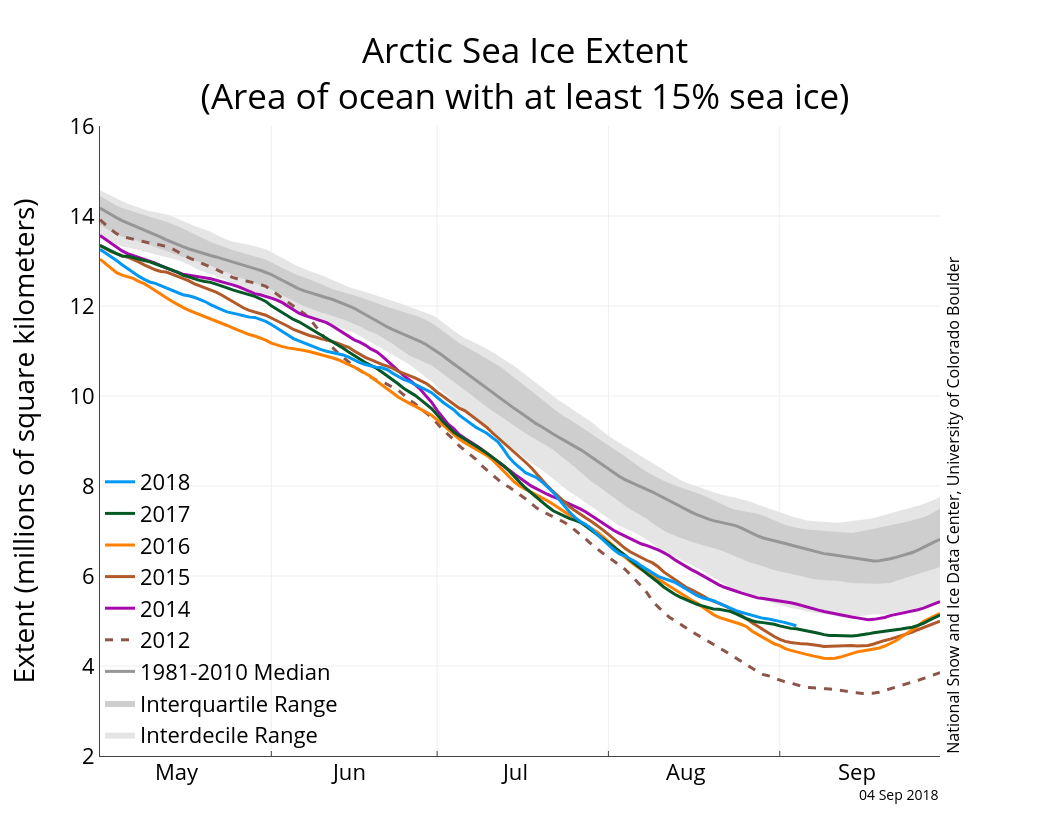
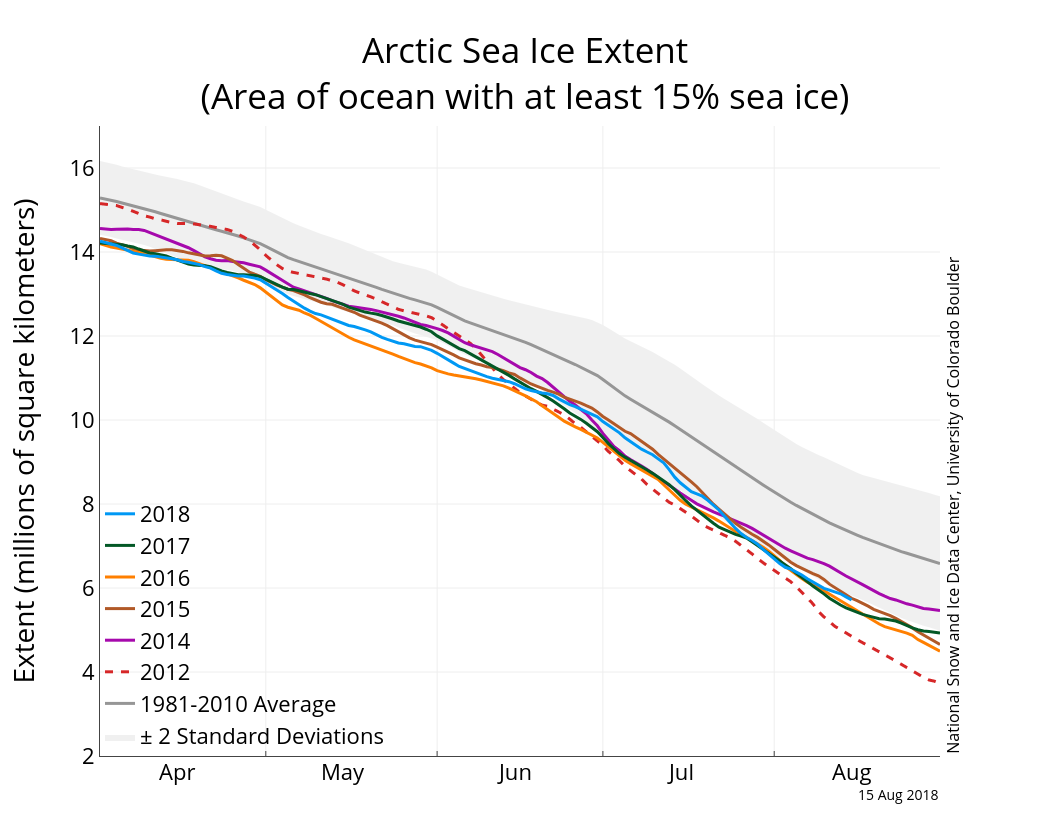
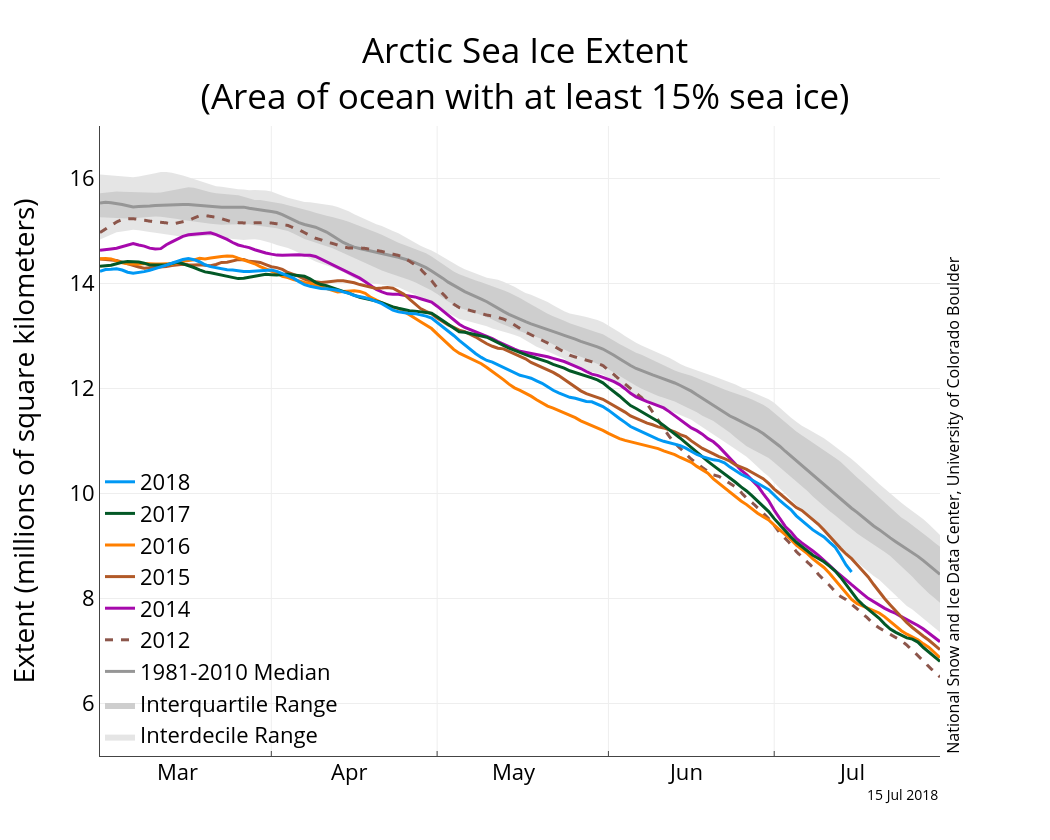
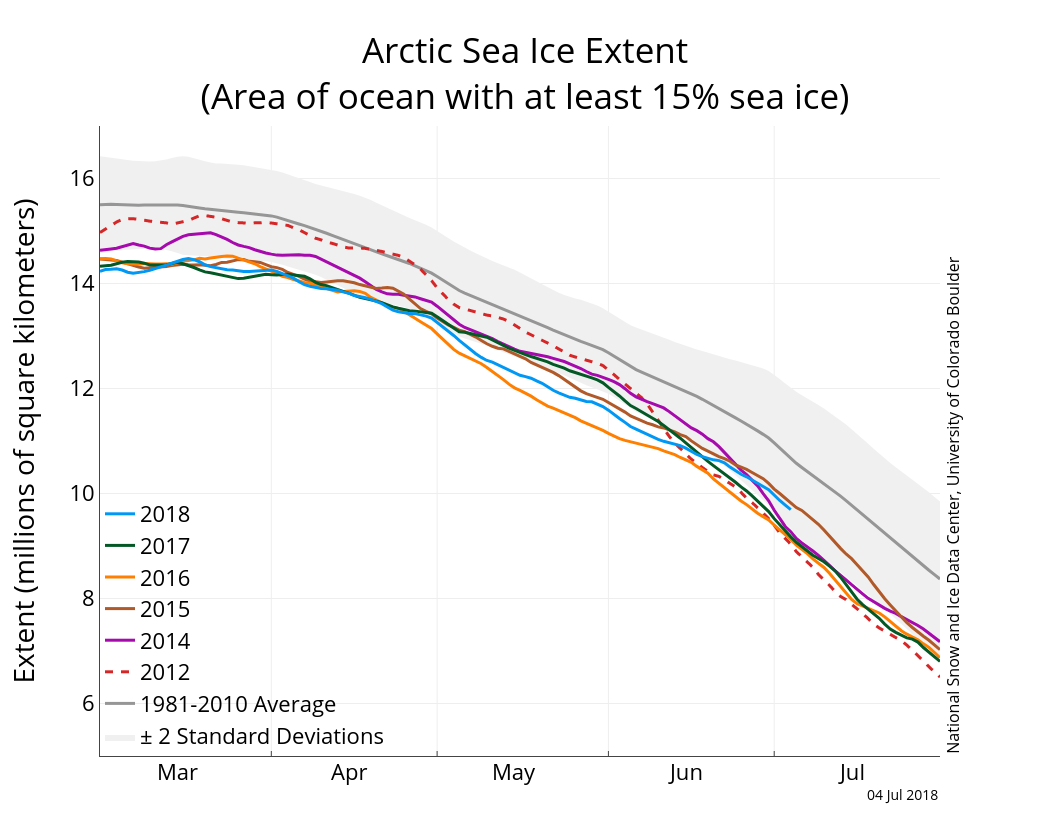
Figure 2. The graph above shows Arctic sea ice extent as of December 03, 2018, along with daily ice extent data for four previous years and the record low year. 2018 is shown in blue, 2017 in green, 2016 in orange, 2015 in brown, 2014 in purple, and 2012 in dotted brown. The 1981 to 2010 median is in dark gray. The gray areas around the median line show the interquartile and interdecile ranges of the data. Sea Ice Index data.
Credit: National Snow and Ice Data Center
High-resolution image
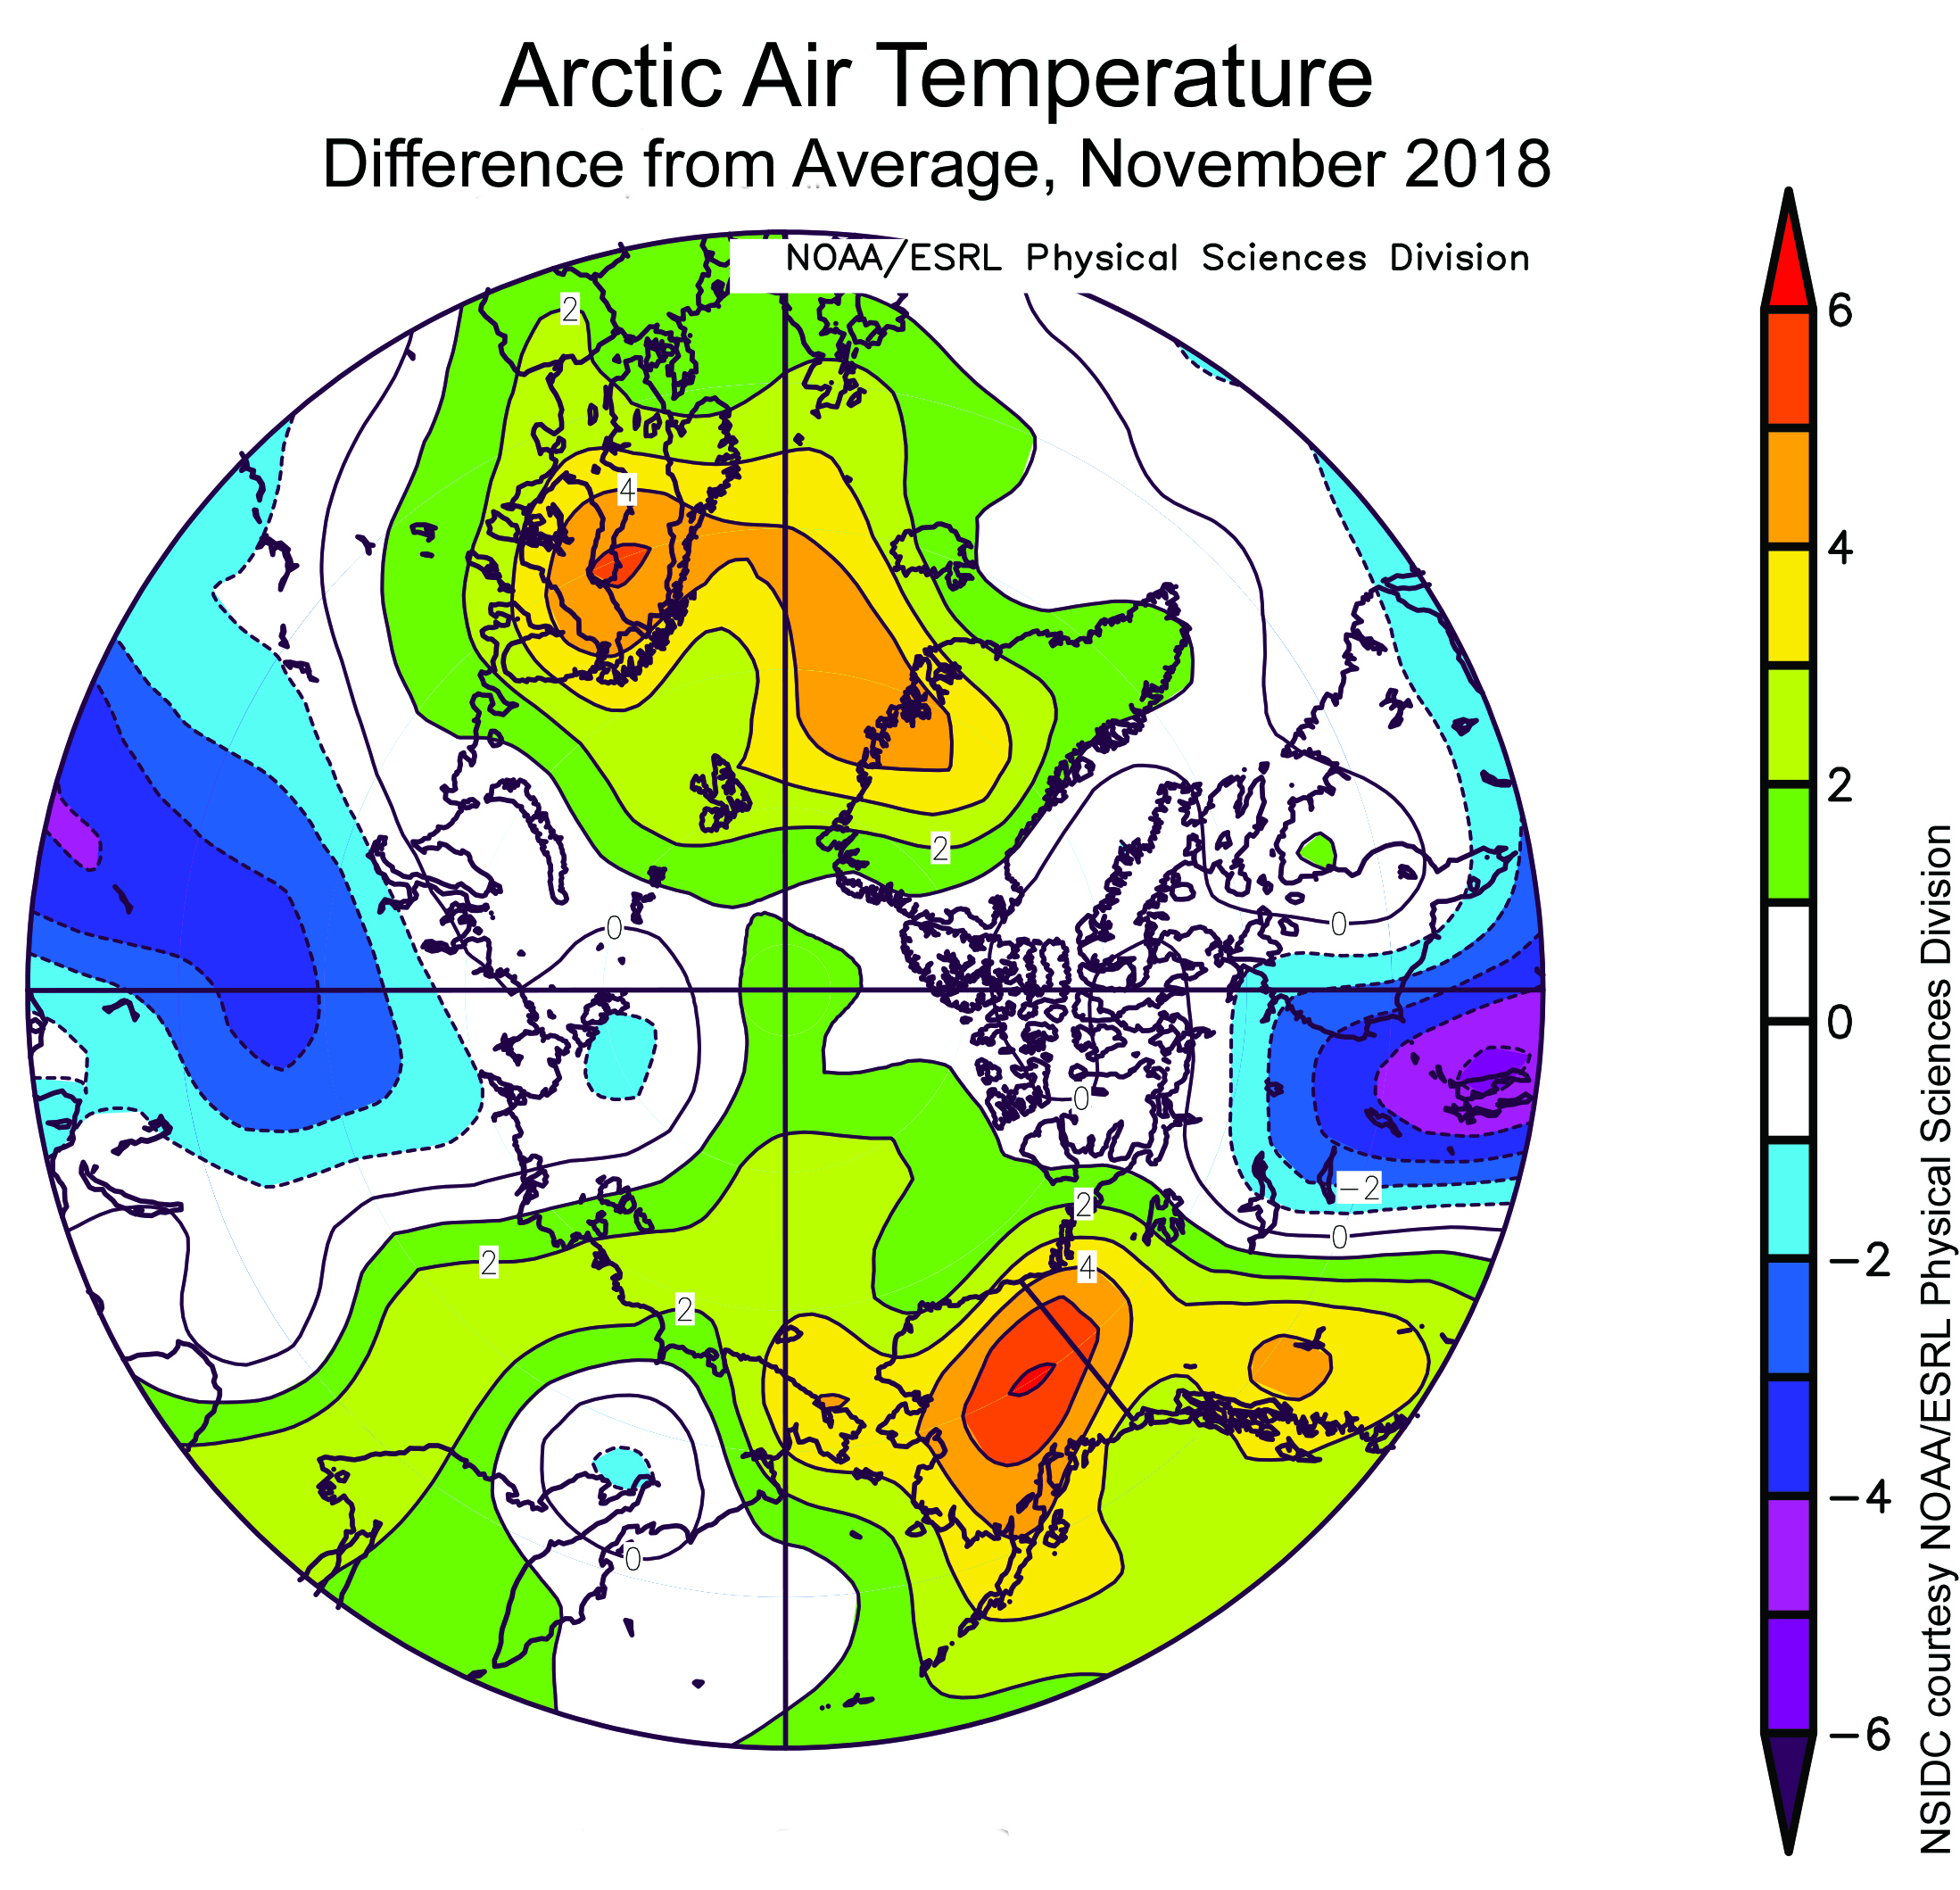
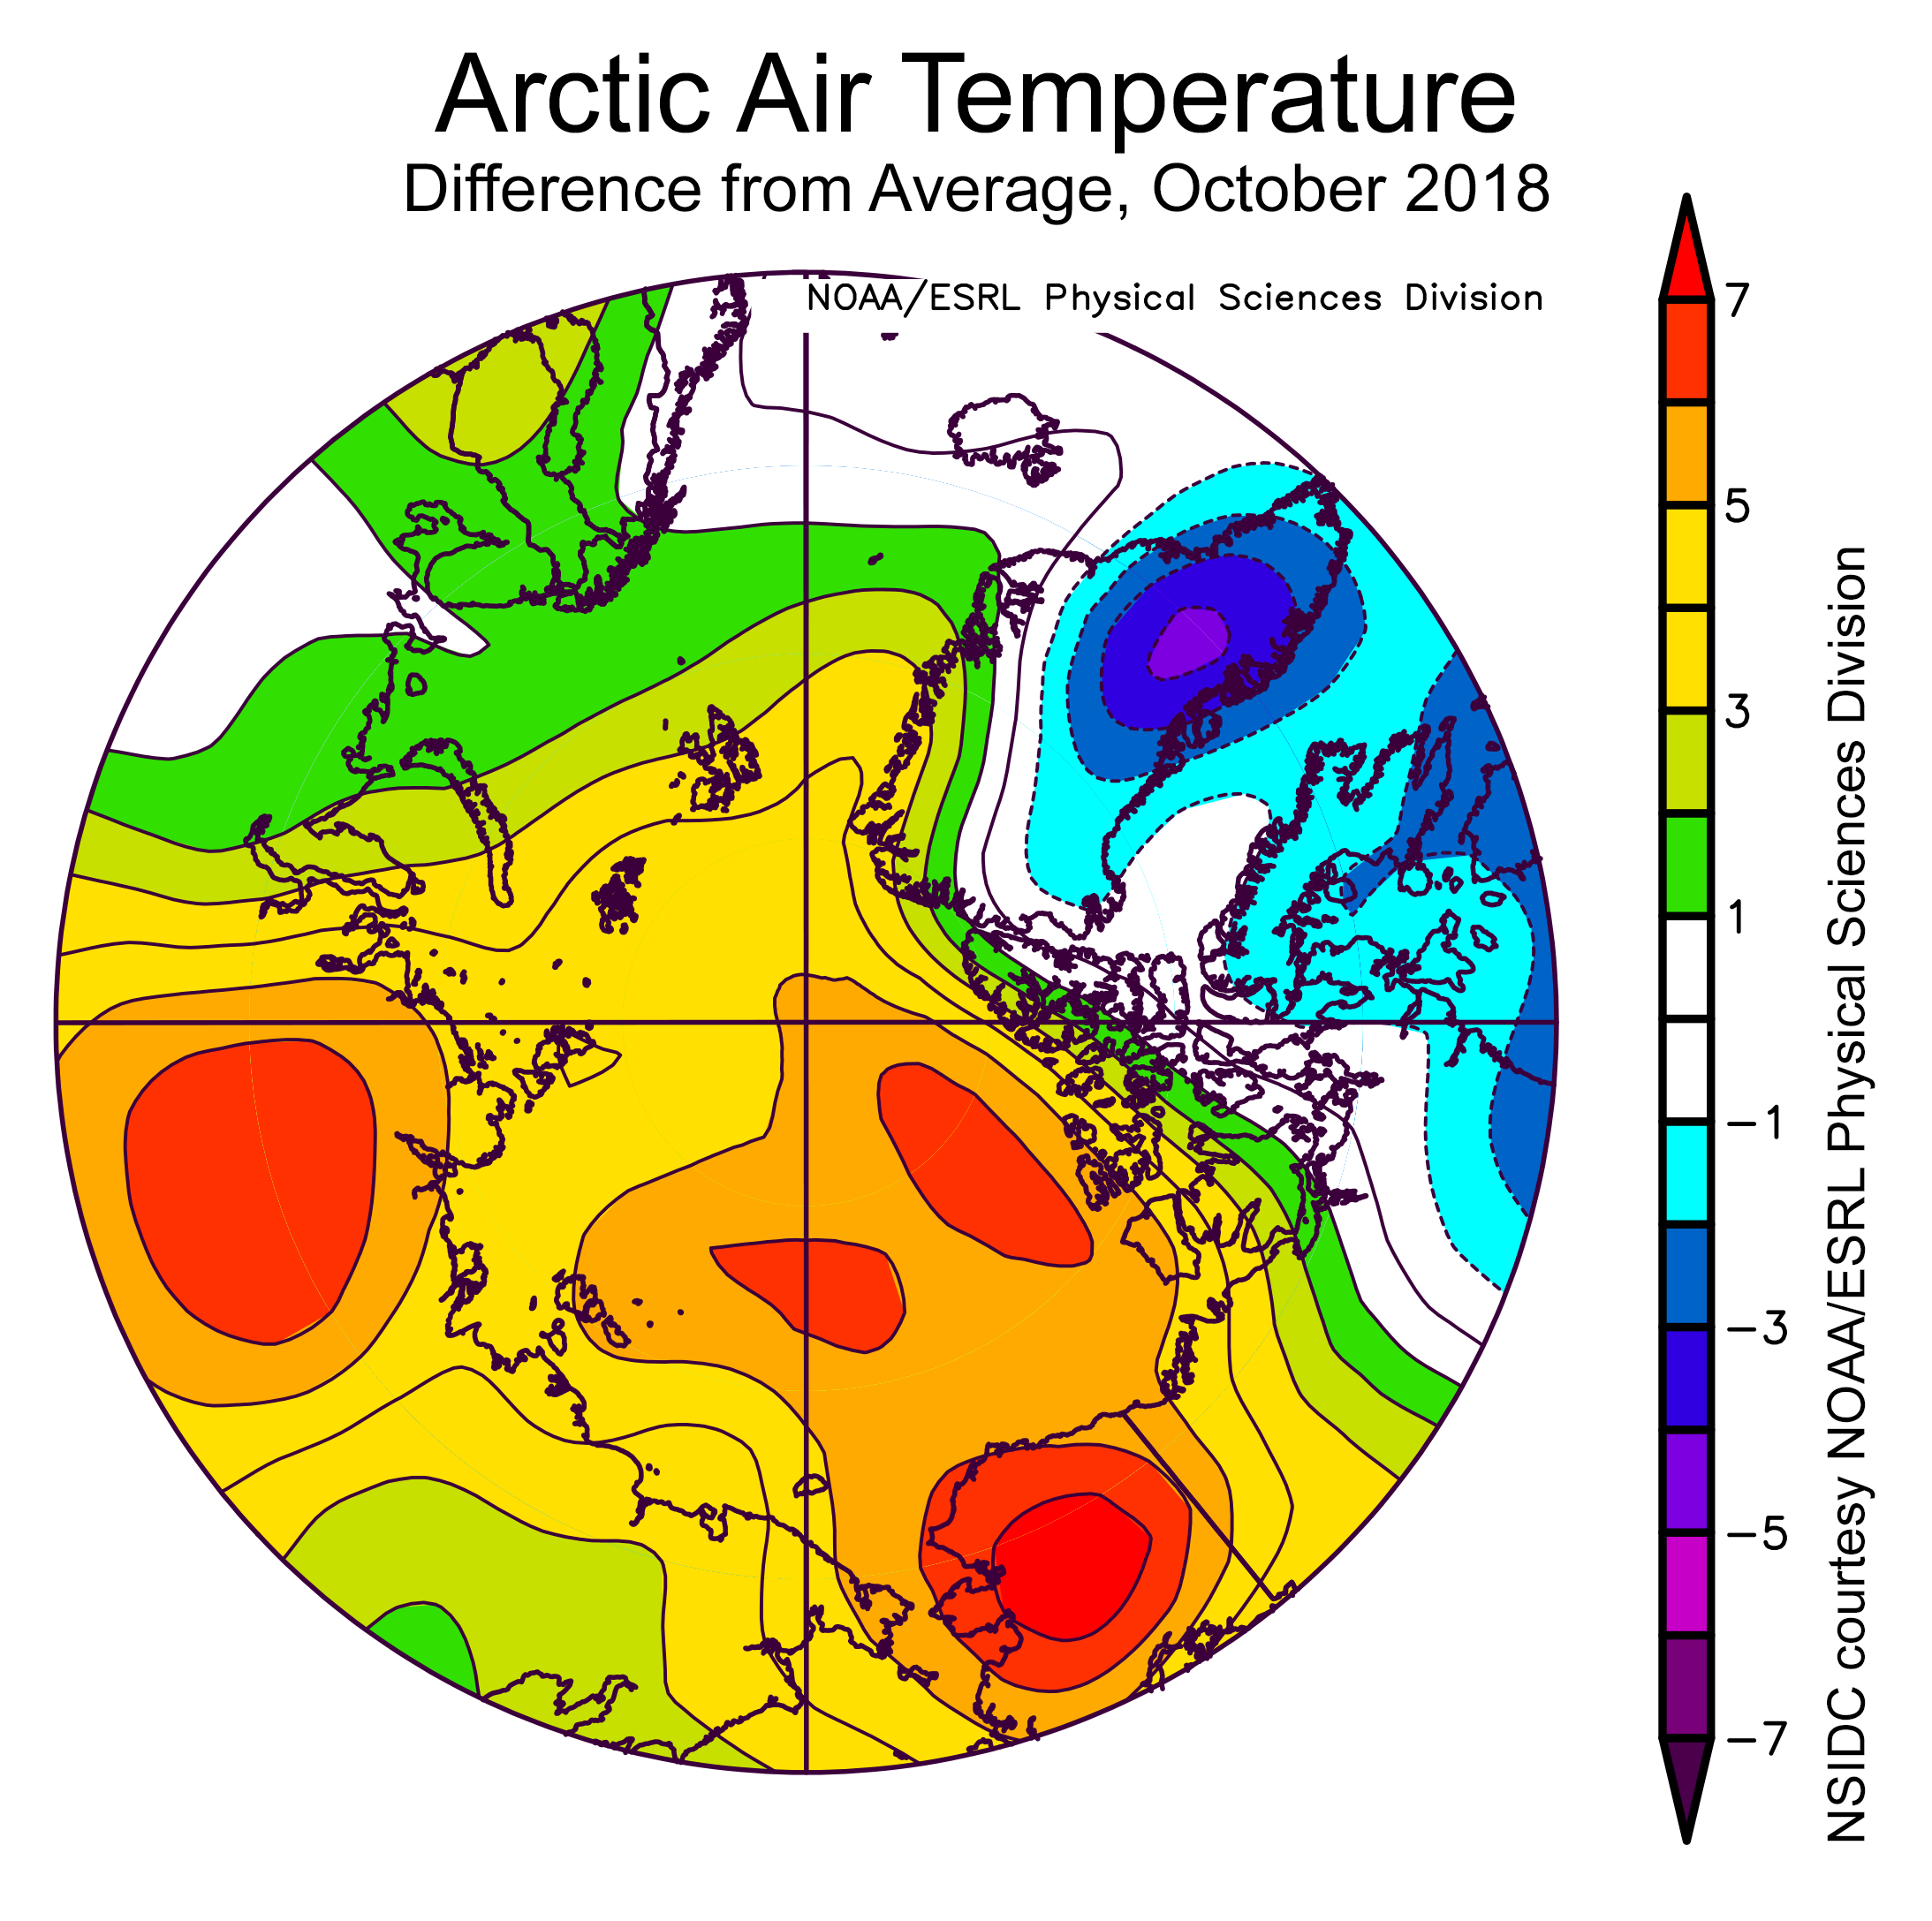
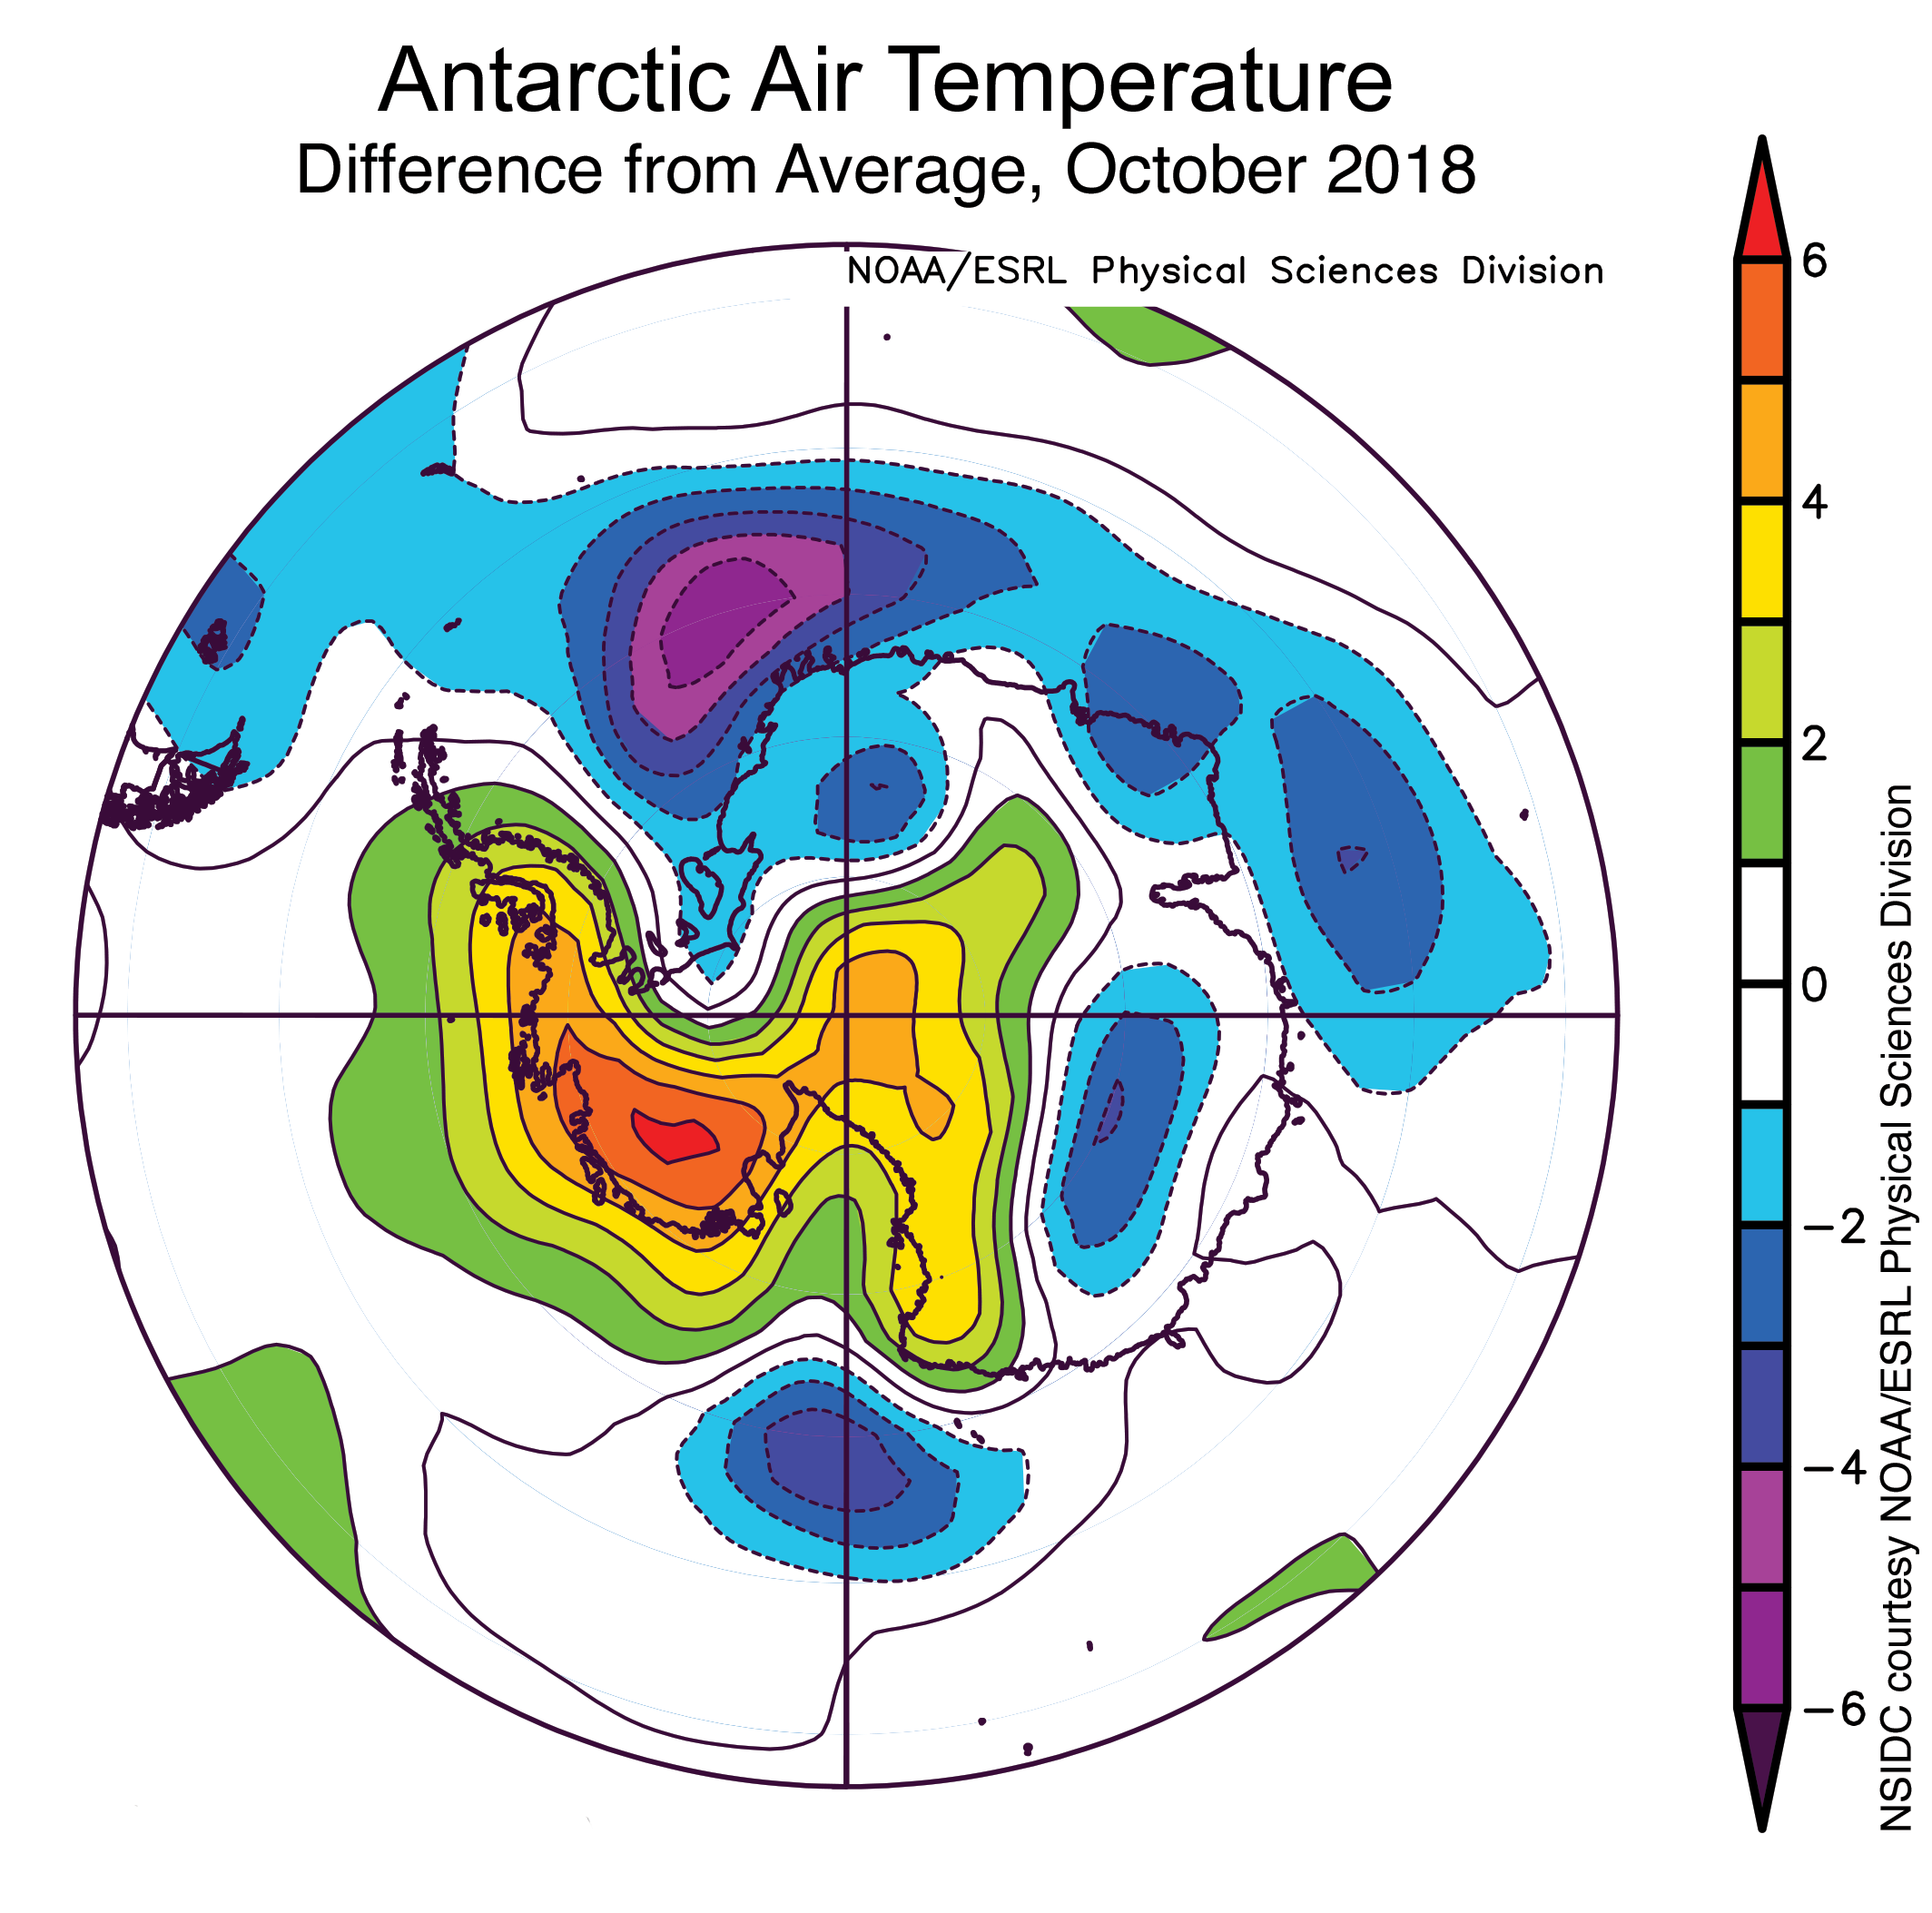
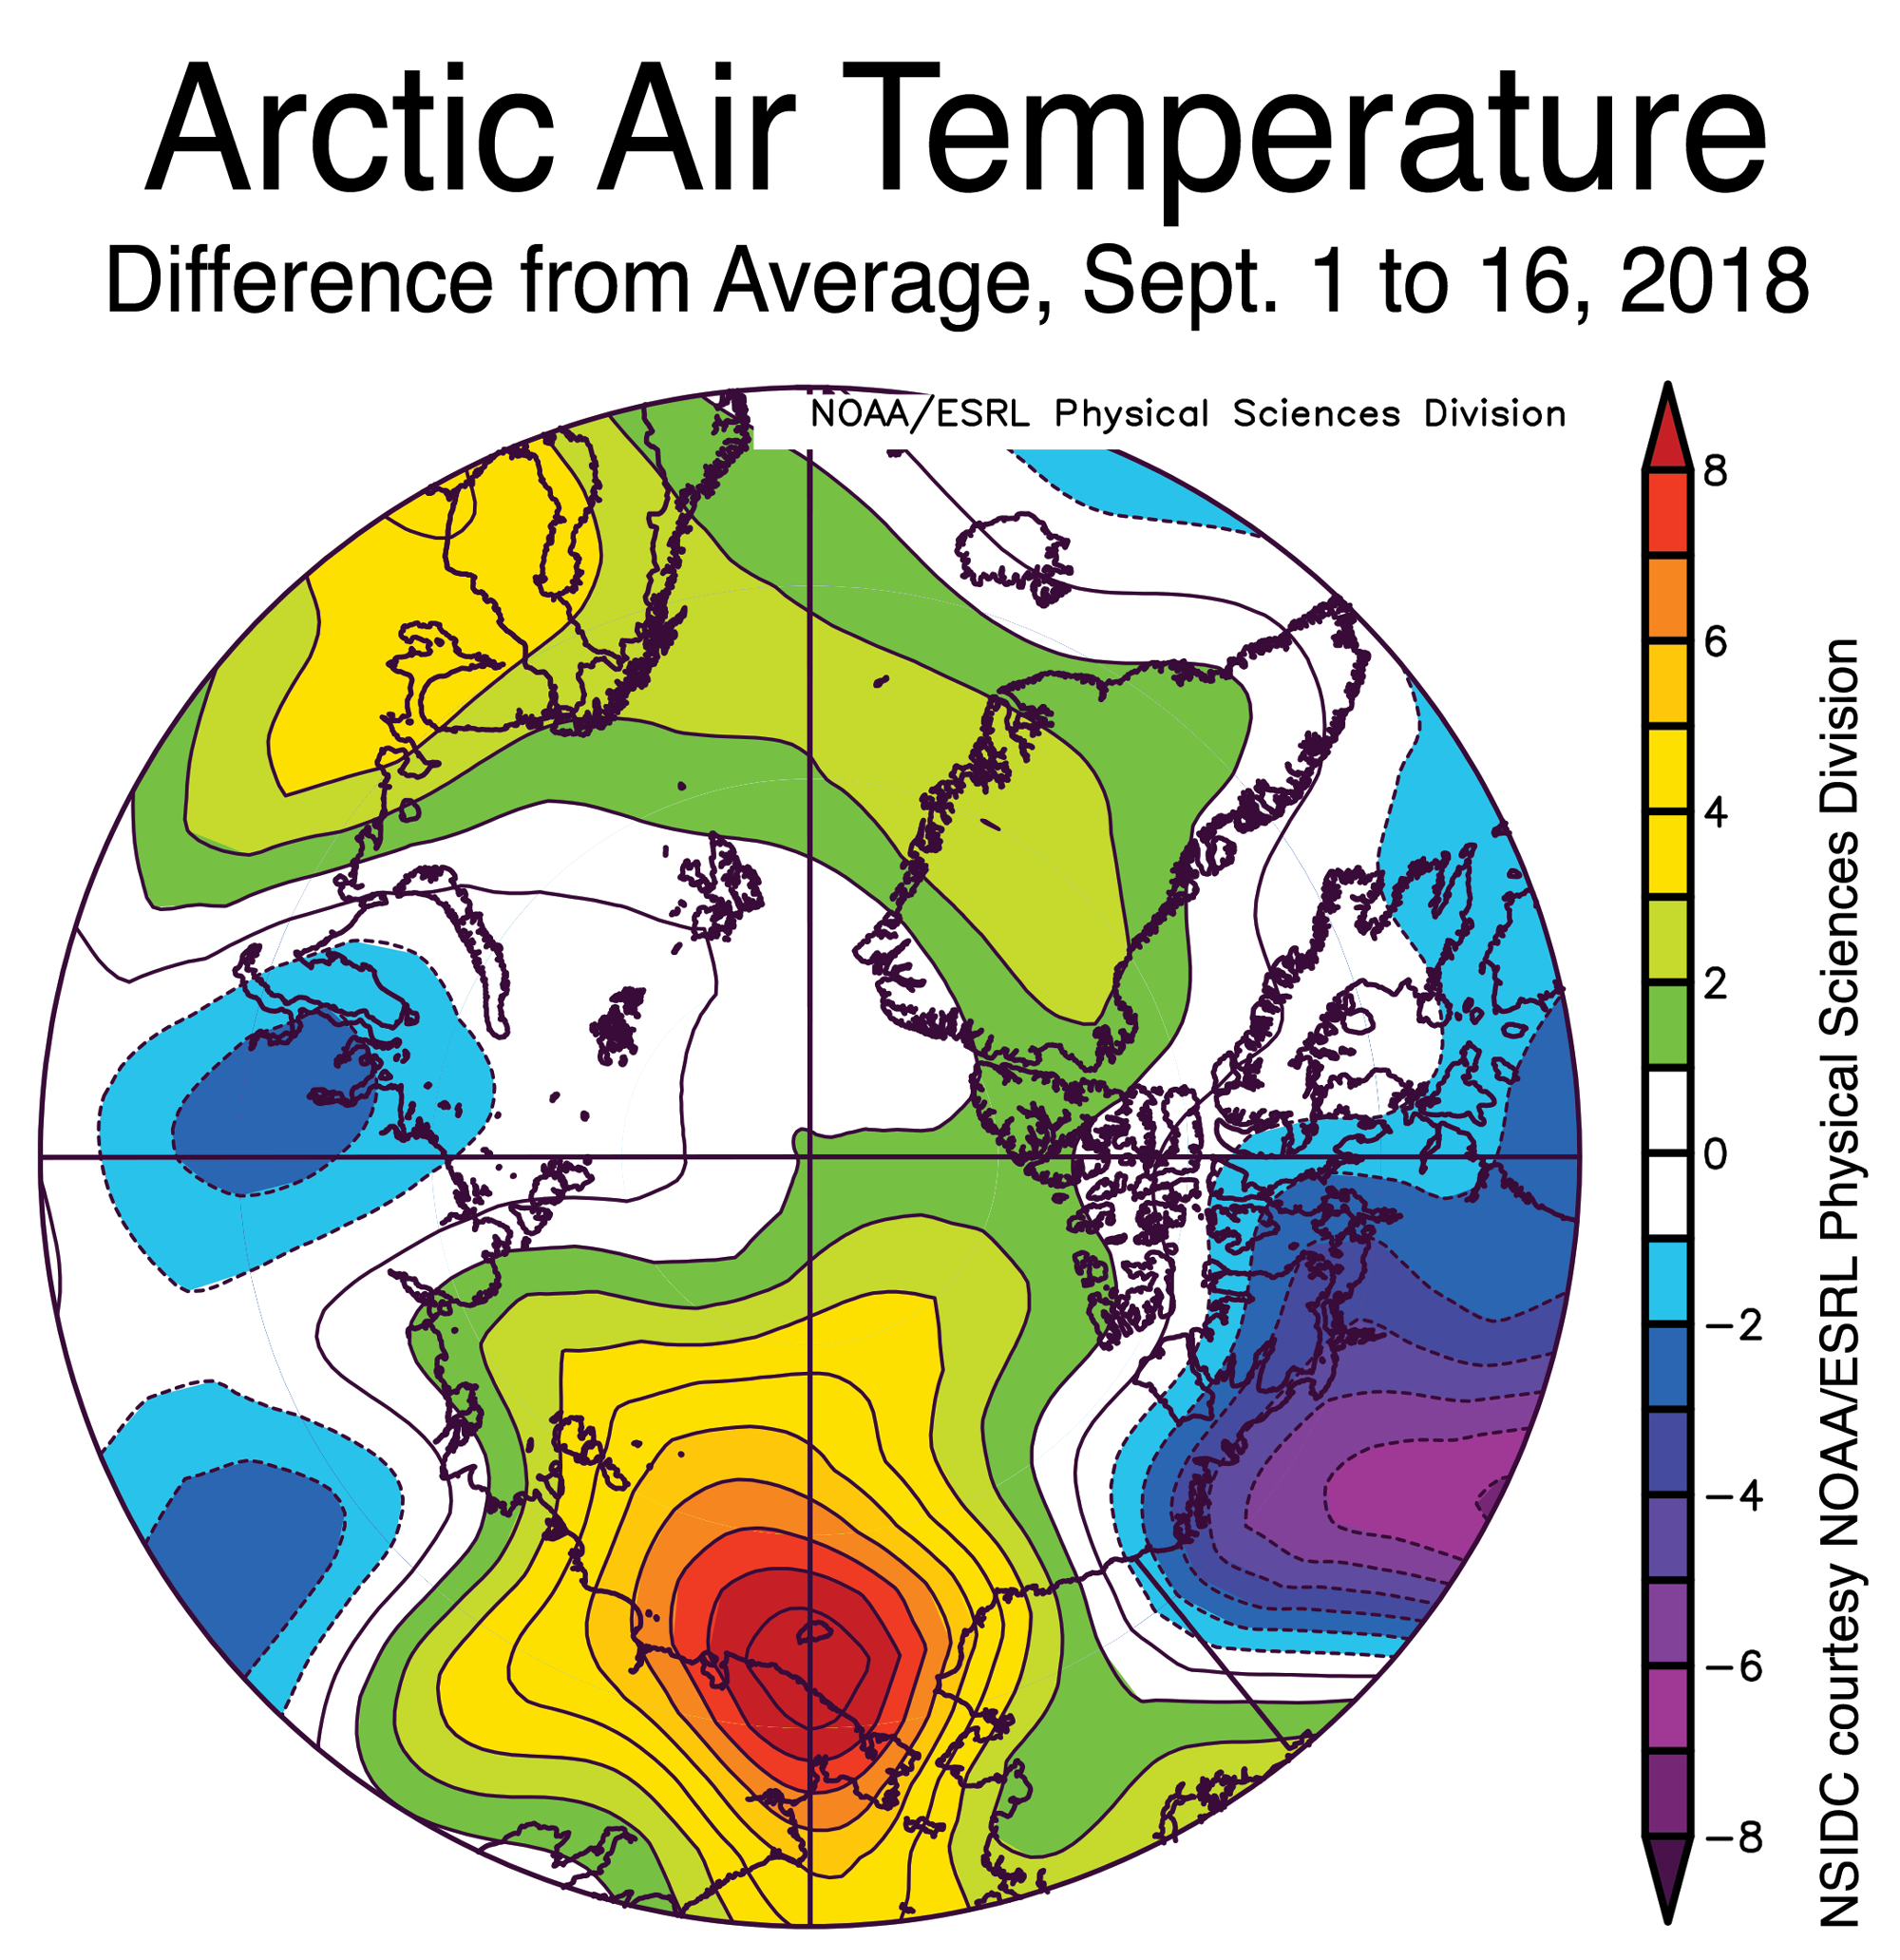
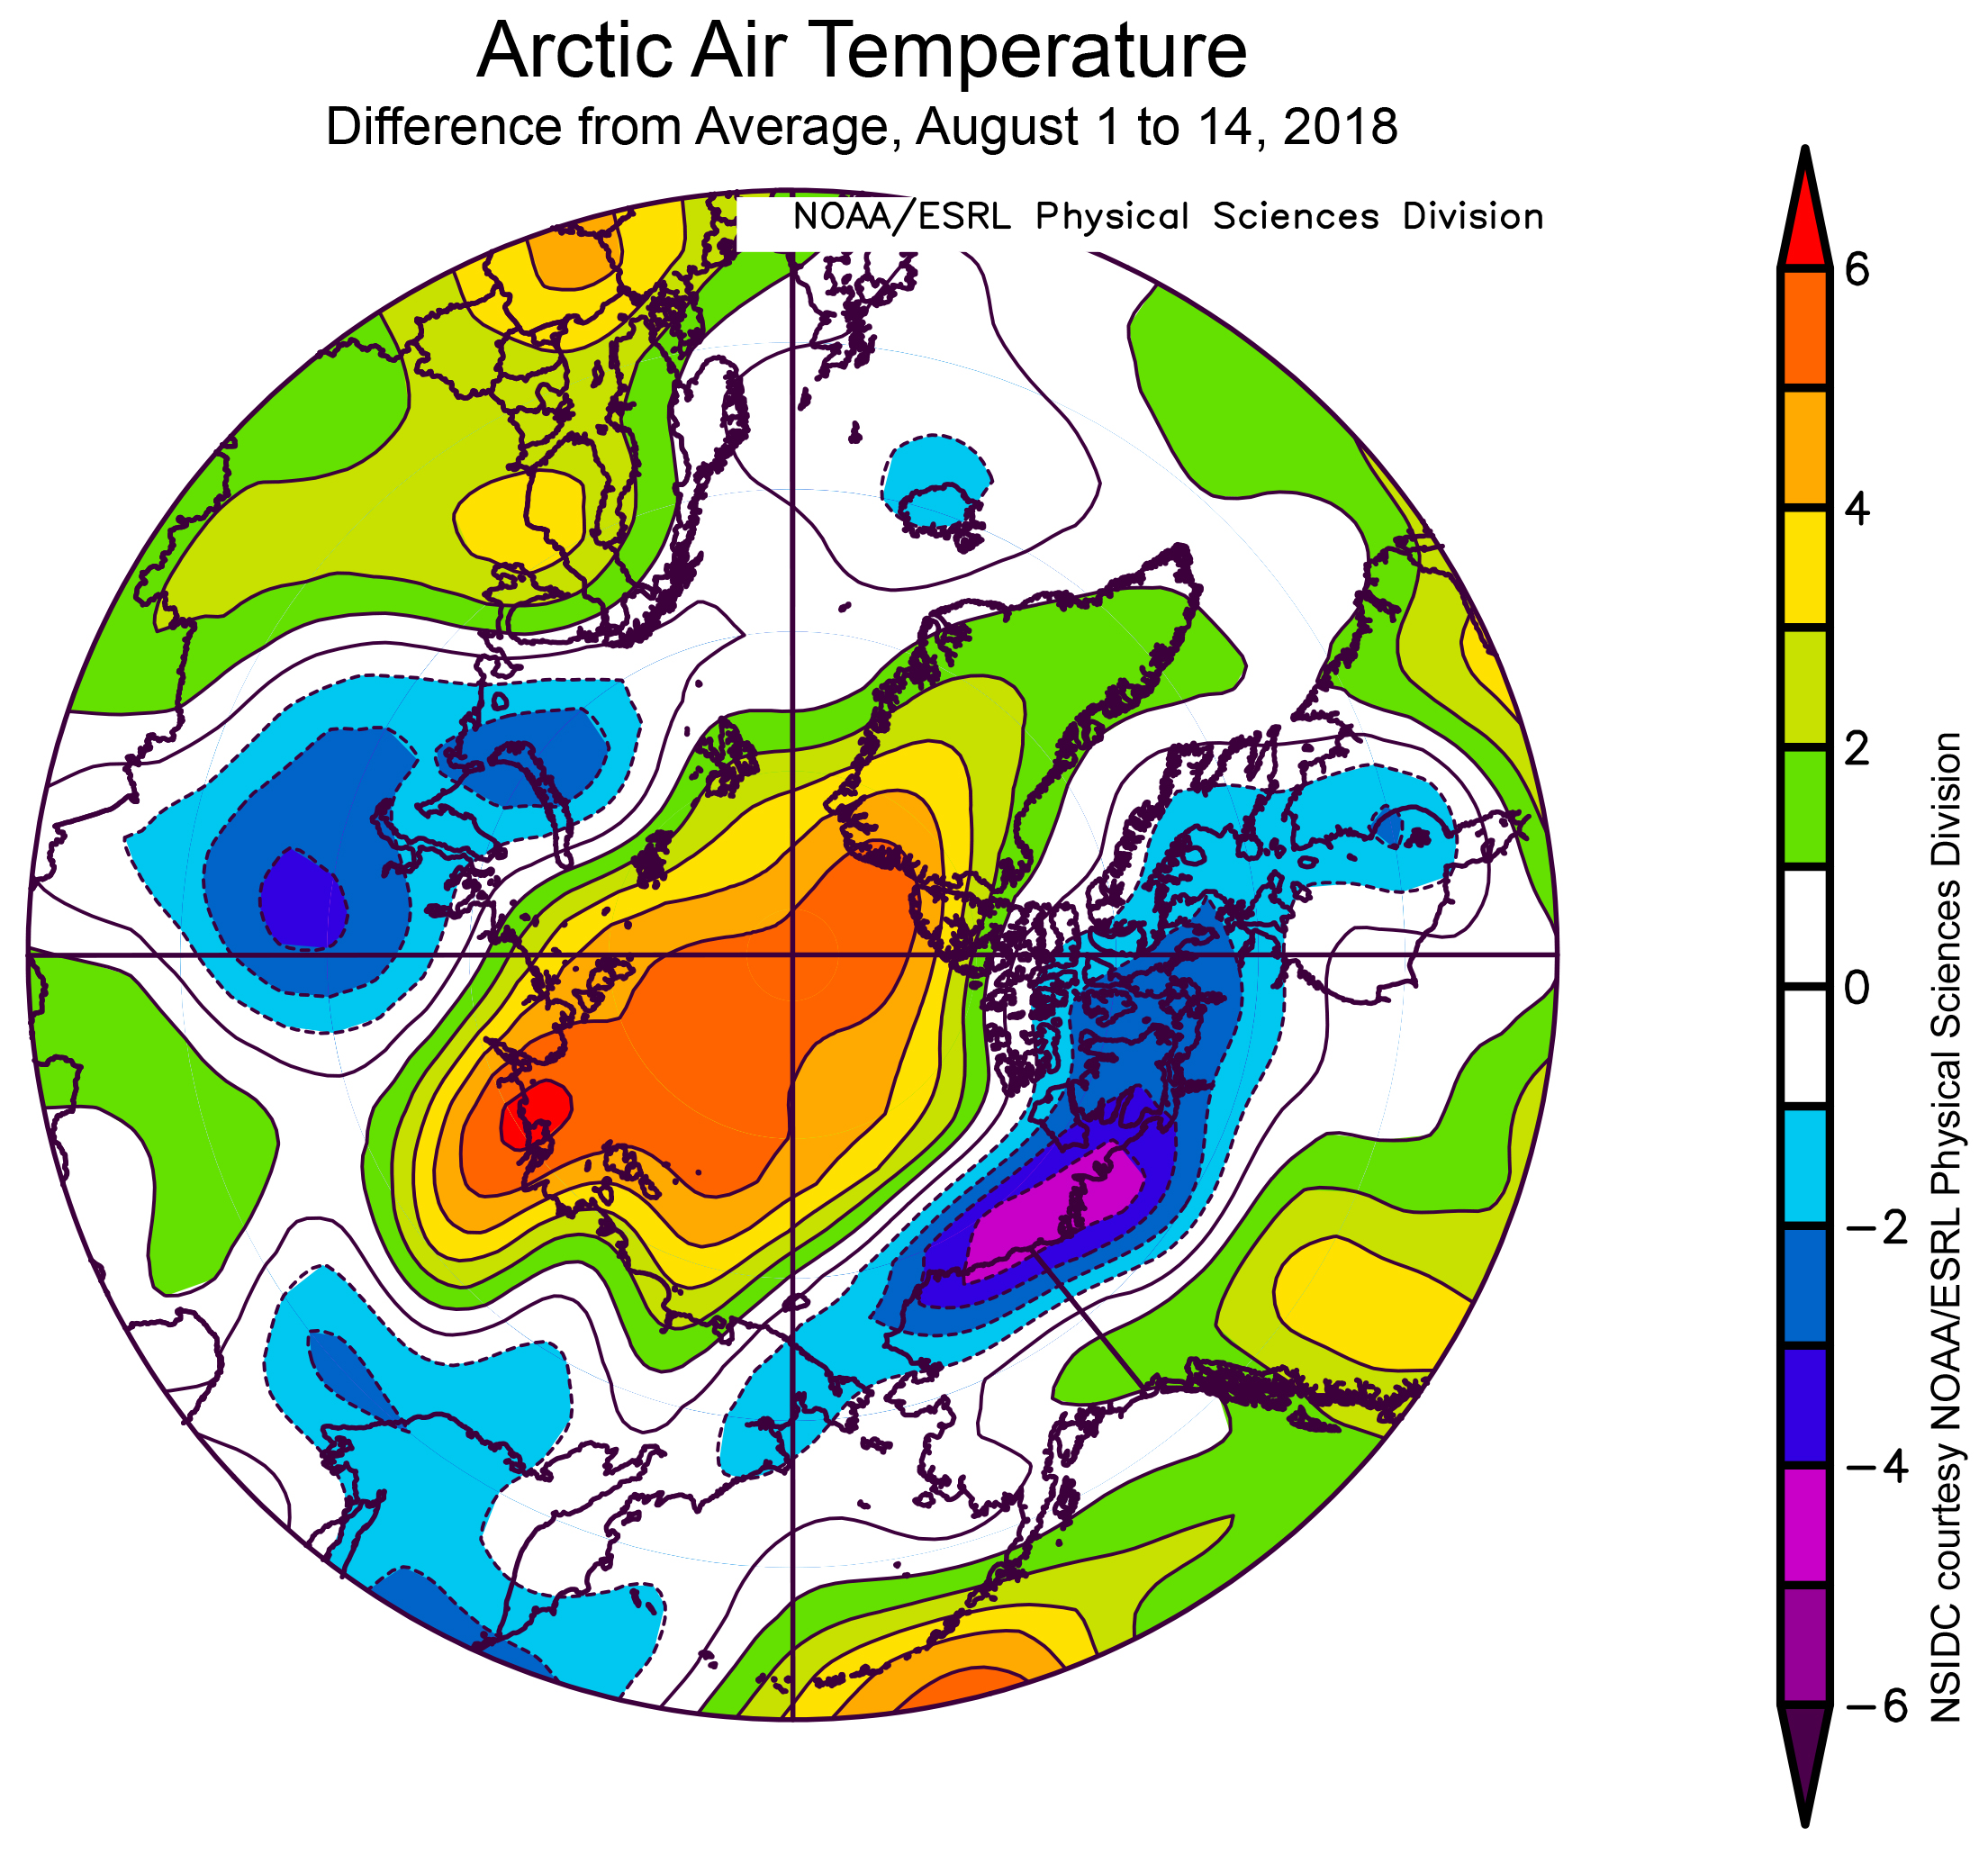
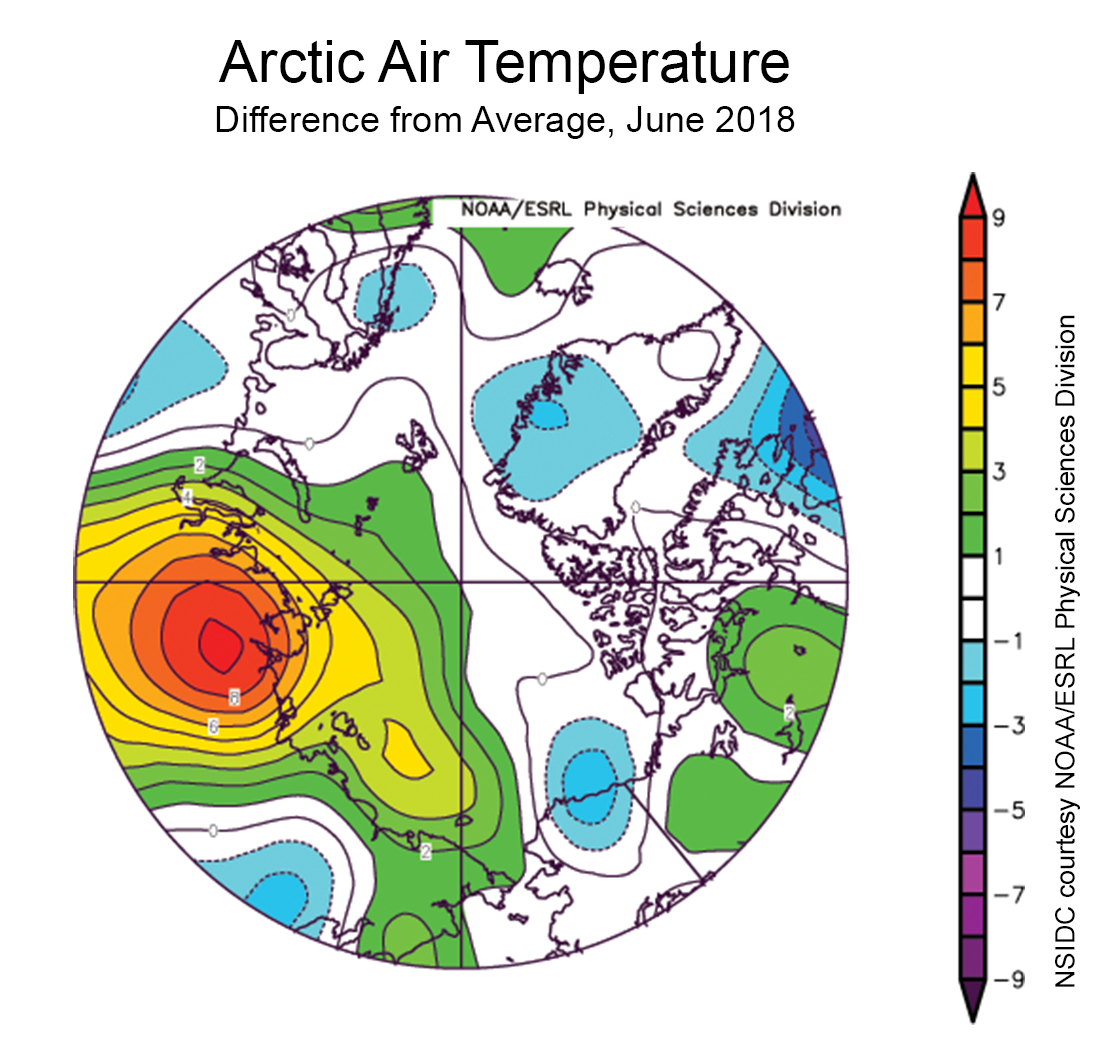
Figure 2b. This plot shows the departure from average air temperature in the Arctic at the 925 hPa level, in degrees Celsius, for November 2018. Yellows and reds indicate higher than average temperatures; blues and purples indicate lower than average temperatures.
Credit: NSIDC courtesy NOAA Earth System Research Laboratory Physical Sciences Division
High-resolution image
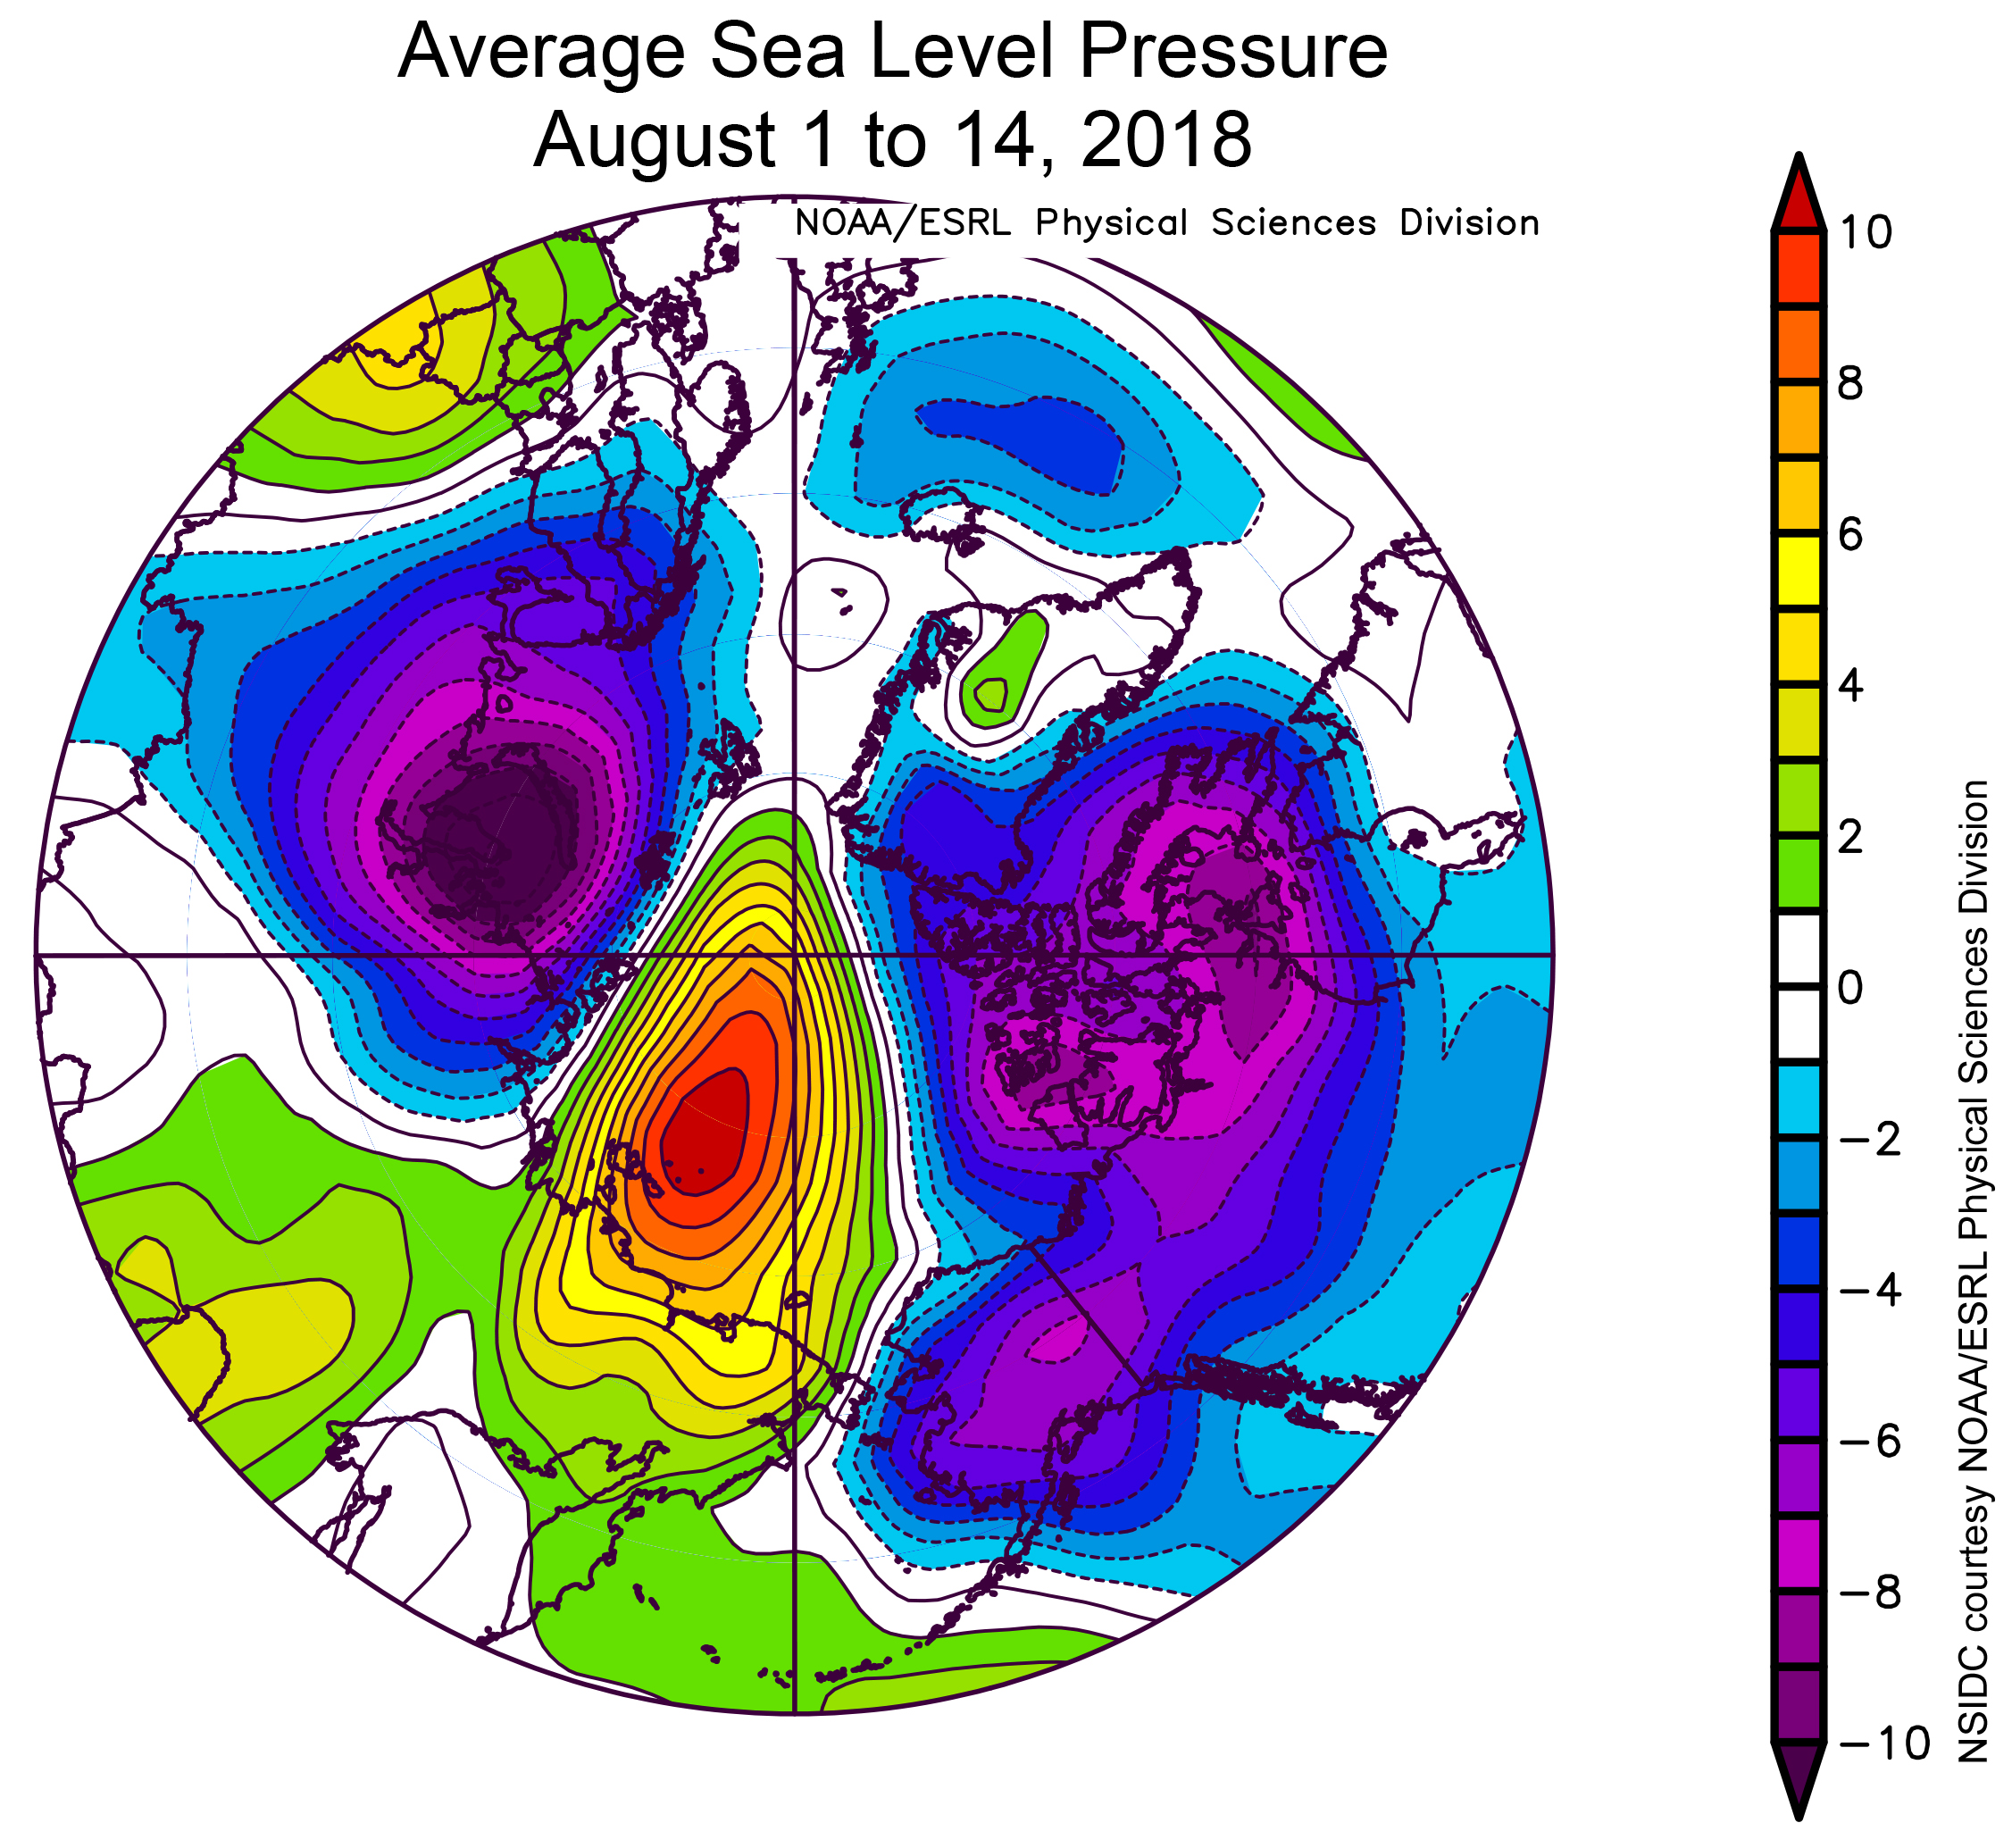
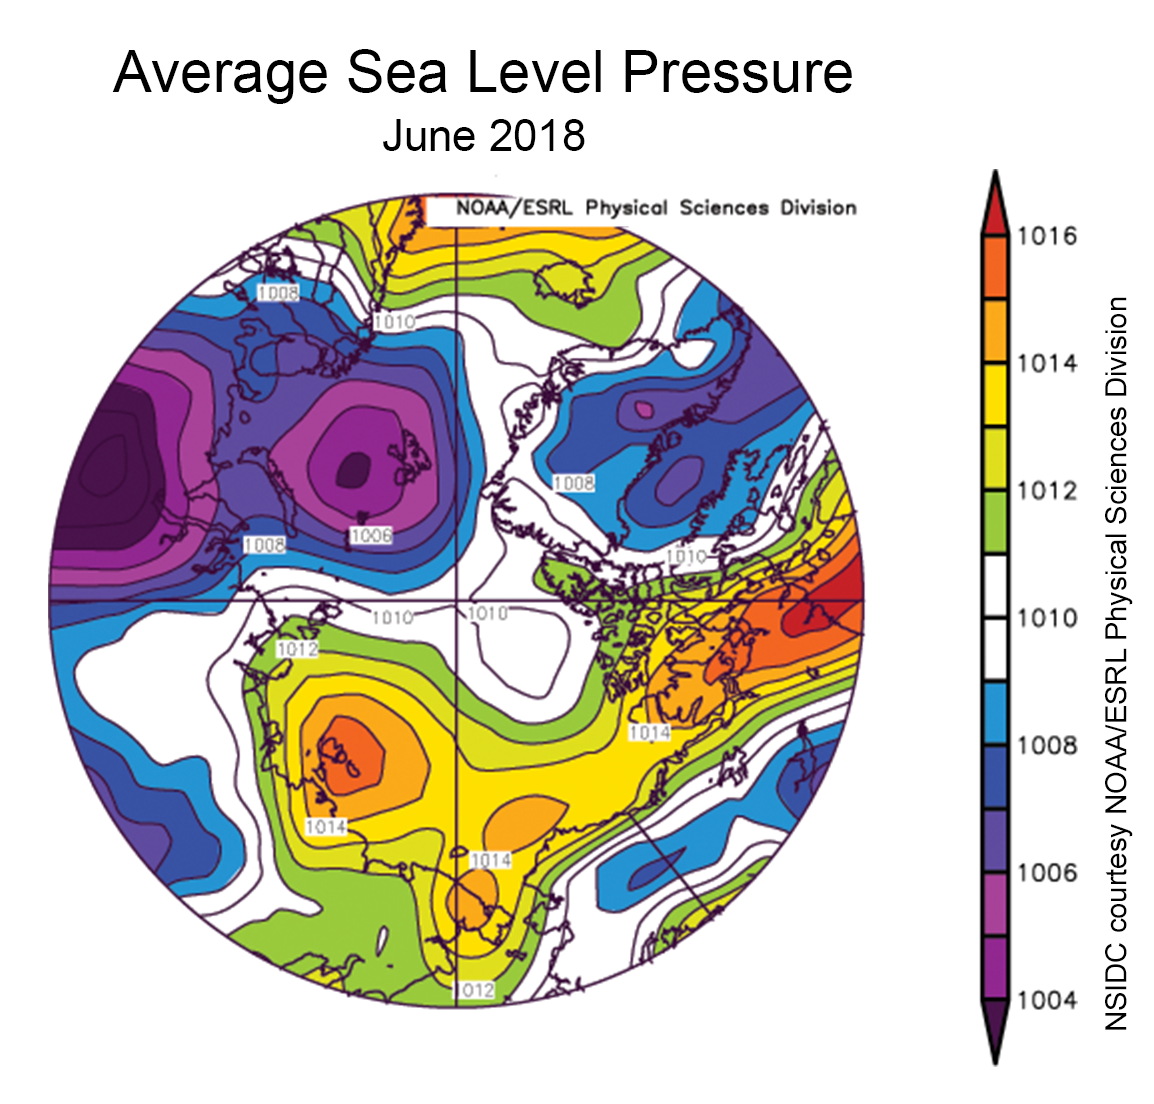
Air temperatures at the 925 mb level (about 2,500 feet above the surface) were modestly above average in November across most of the Arctic Ocean (up 2 degrees Celsius or 4 degrees Fahrenheit), the main exception being slightly cooler than average conditions in the Laptev Sea (Figure 2b). Average low sea level pressure centered over the Siberian coast of the Kara Sea, a pattern tending to draw in cold continental air from Siberia over the Laptev Sea. By contrast, temperatures were up to 4 degrees Celsius (7 degrees Fahrenheit) above average over the East Greenland Sea and extending east over Scandinavia. It was also quite warm, up to 6 degrees Celsius (11 degrees Fahrenheit), over the interior of Alaska
November 2018 compared to previous years
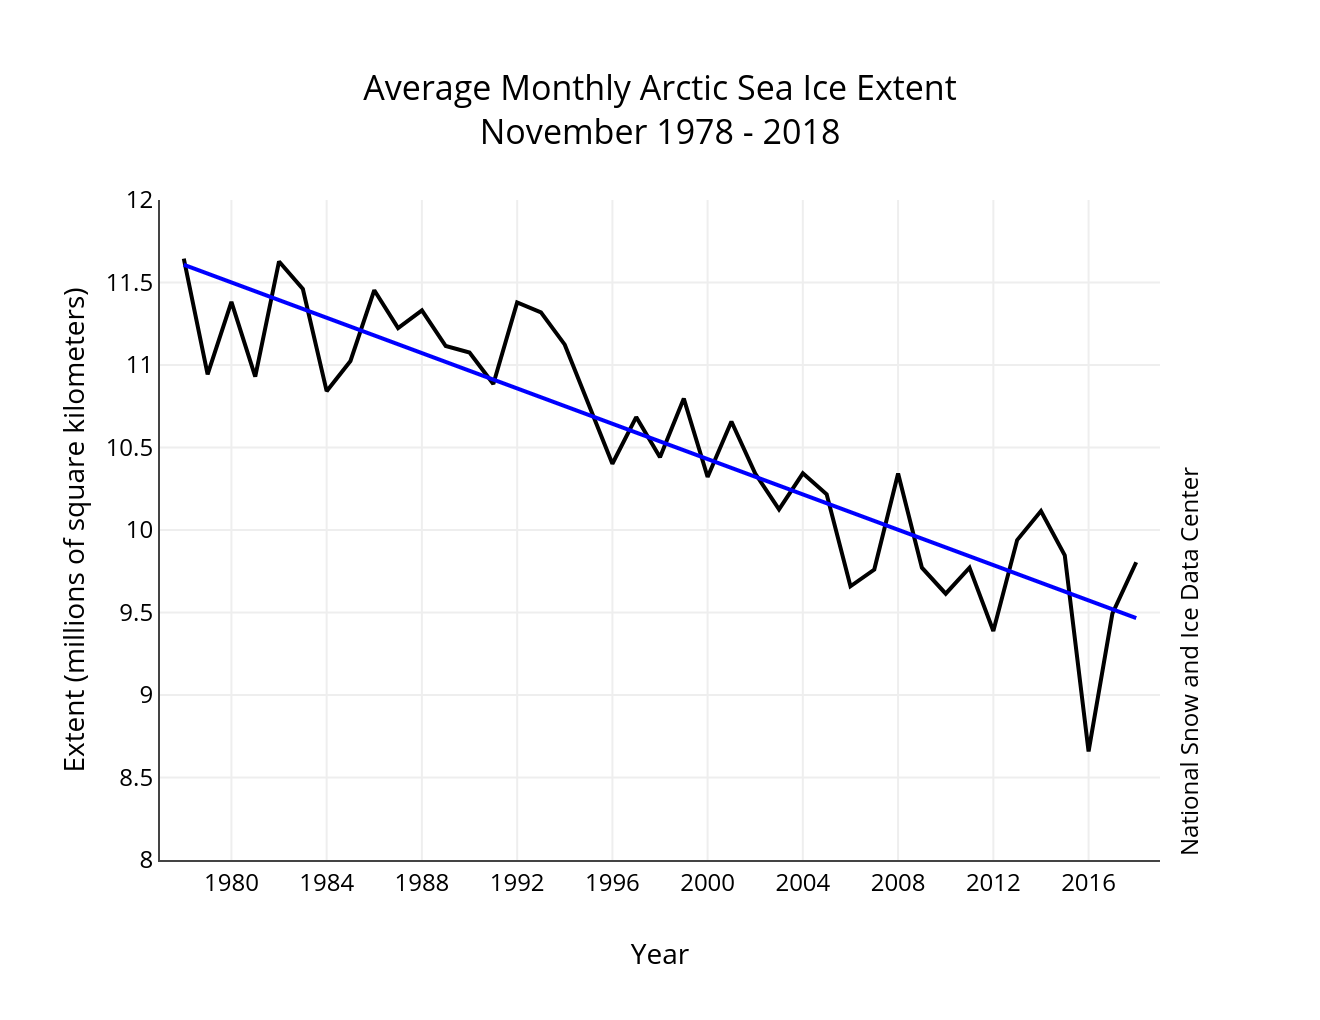
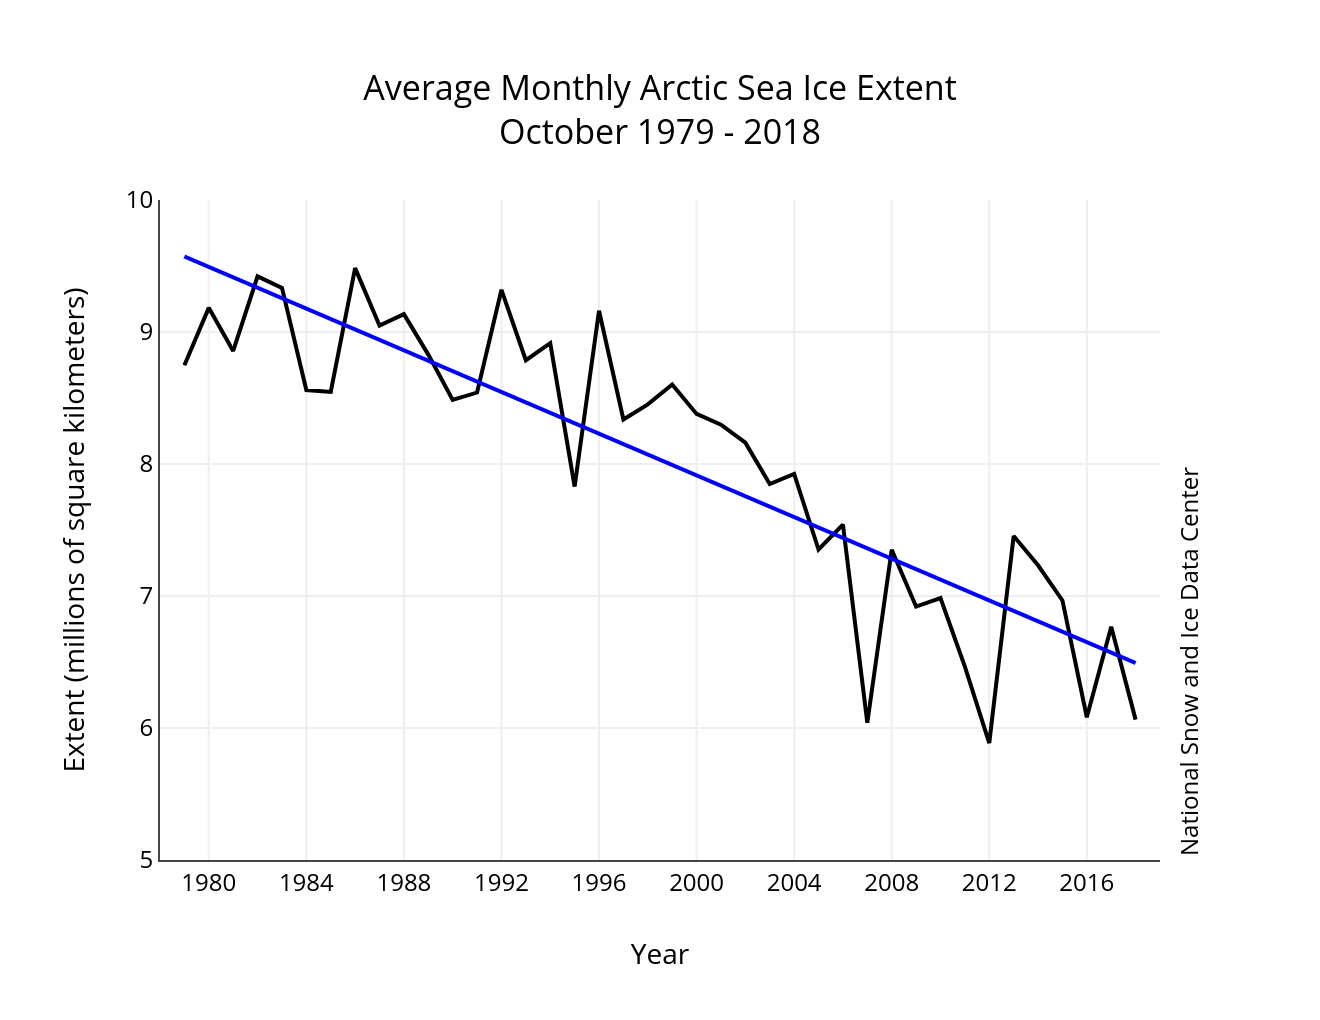
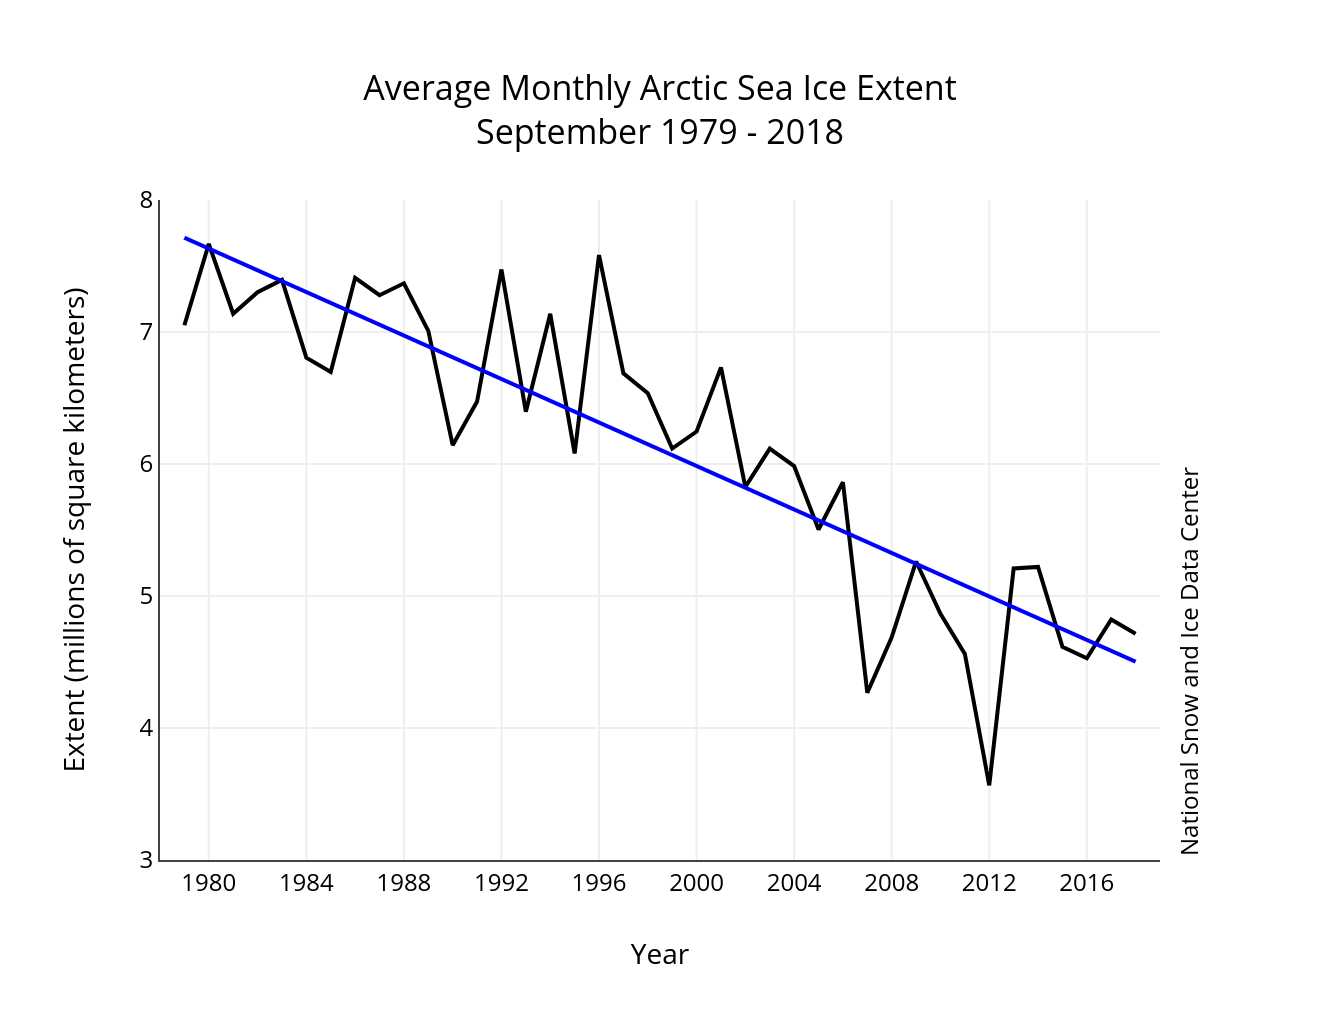
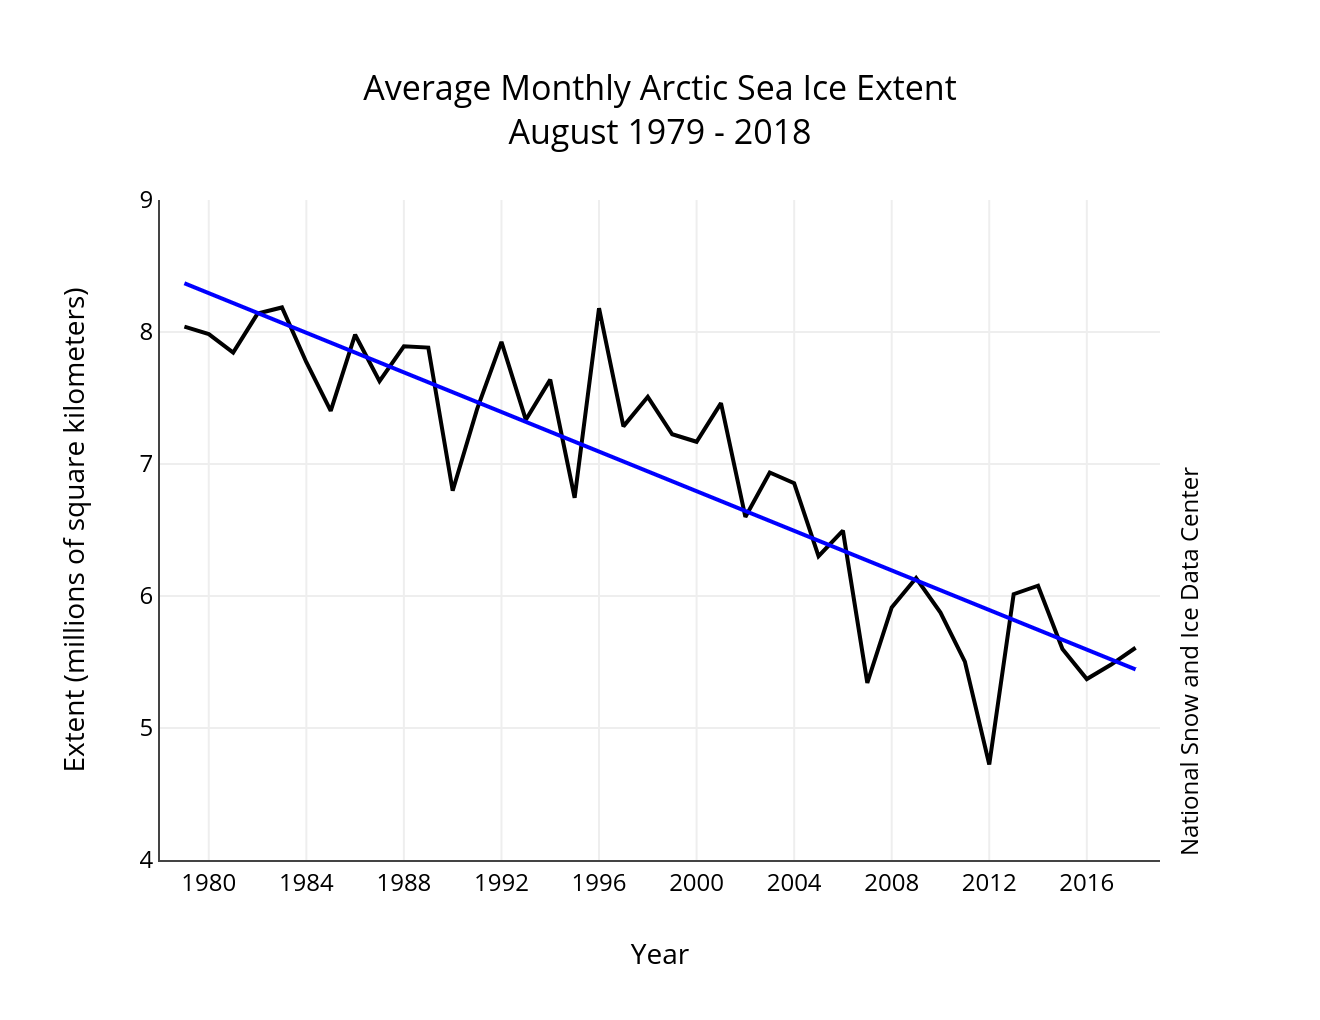
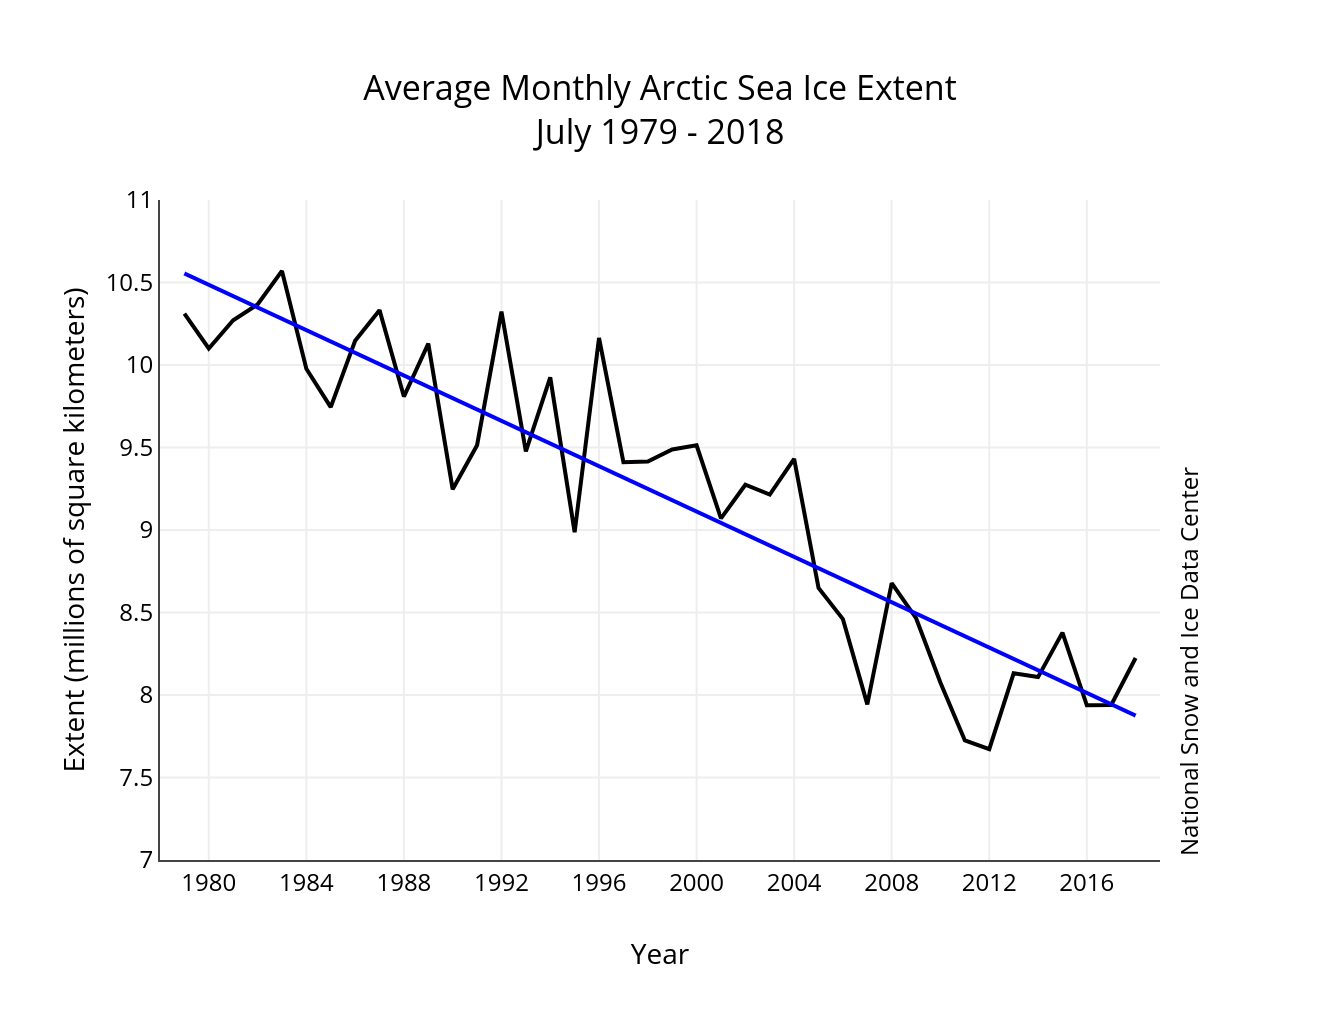
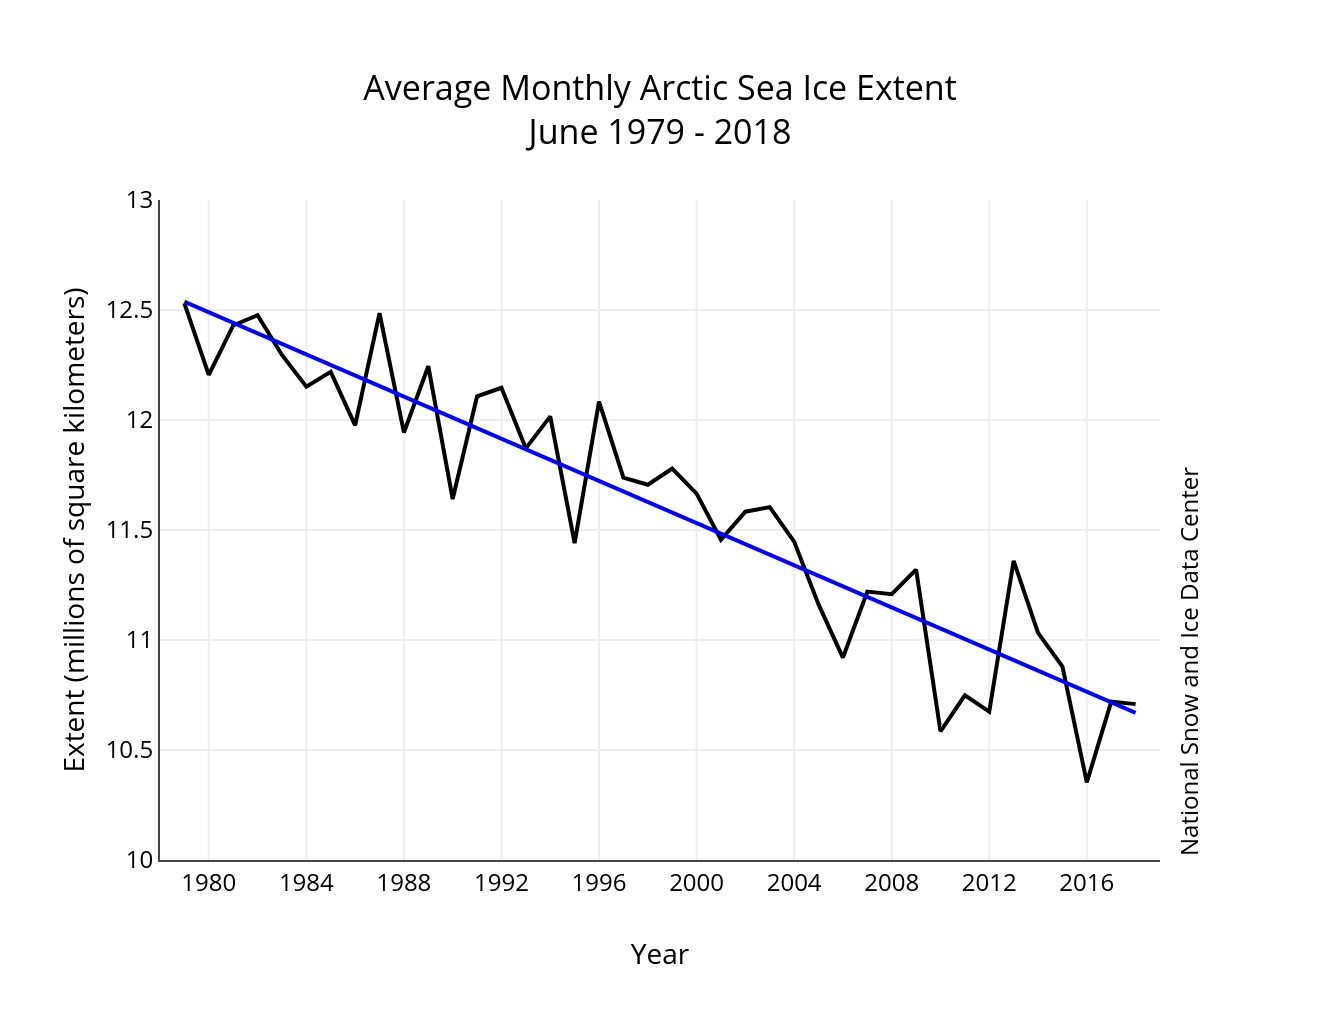
Figure 3. Monthly November ice extent for 1978 to 2018 shows a decline of 5.o percent per decade.
Credit: National Snow and Ice Data Center
High-resolution image
Overall, sea ice extent during November 2018 increased 3.08 million square kilometers (1.19 million square miles). This is 994,000 square kilometers (384,000 square miles) greater than the 1981 to 2010 average November extent increase. The linear rate of sea ice decline for November is 53,500 square kilometers (21,000 square miles) per year, or 5.0 percent per decade relative to the 1981 to 2010 average.
The “Atlantification” of the Barents Sea
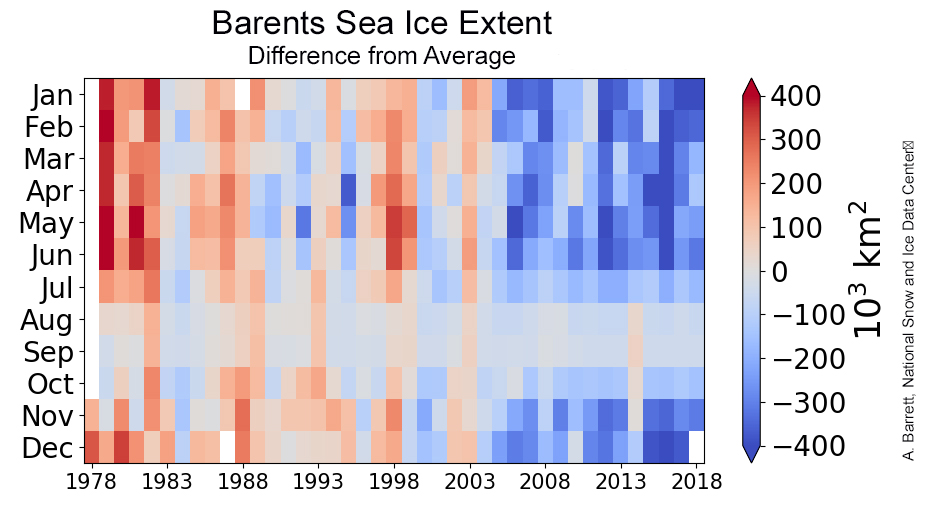
Figure 4. This figure shows departures from average sea ice extent in the Barents Sea sector of the Arctic Ocean by year and month. Above average extent is shown by red and orange colors, while below average extent is shown in blue colors.
Credit: A. Barrett, National Snow and Ice Data Center
High-resolution image

Figure 4b. This graph shows average Sea Surface Temperature (SST) across the Barents Sea with a 12-month running mean (blue line). The linear trend for the periods 1985 to 2004 and December 2004 to 2016 are shown (green lines). Credit: Barton et al., 2018, Journal of Physical Oceanography
High-resolution image
As noted above, the Barents Sea continues to be largely ice free. This is part of a broader pattern emerging over the last decade of greatly reduced ice extent in this area in all seasons, especially from autumn through spring (Figure 4). These reductions in ice extent appear to be heavily influenced by the inflow of Atlantic water into the region. While increased temperatures and inflow of Atlantic water have been observed over the last two decades, this warm and salty water usually lies below the colder, less dense Arctic surface waters. This largely keeps the ocean heat from influencing the sea cover. New research by Benjamin Barton and colleagues (Barton et al., 2018) suggests that the sea surface temperatures in the Barents Sea have increased in recent years (Figure 4b) as this warm Atlantic water has started to mix with the surface. A key factor driving this mixing appears to be the decline in sea ice itself and corresponding less freshwater at the surface when that ice melts in summer. This leads to a weaker ocean density stratification, making it easier to mix warm, salty Atlantic waters upwards. This can be viewed as a feedback mechanism—less ice means less summer melt and a weaker ocean stratification, helping to mix the Atlantic heat upwards, which in turn means less ice. Scientists have referred to this change as “Atlantification” of the Barents Sea. The warm water from the Atlantic prevents ice formation and is the main reason why the winter ice edge in the Barents is farther north than in other parts of the Arctic.
An early start to the snow season for much of North America
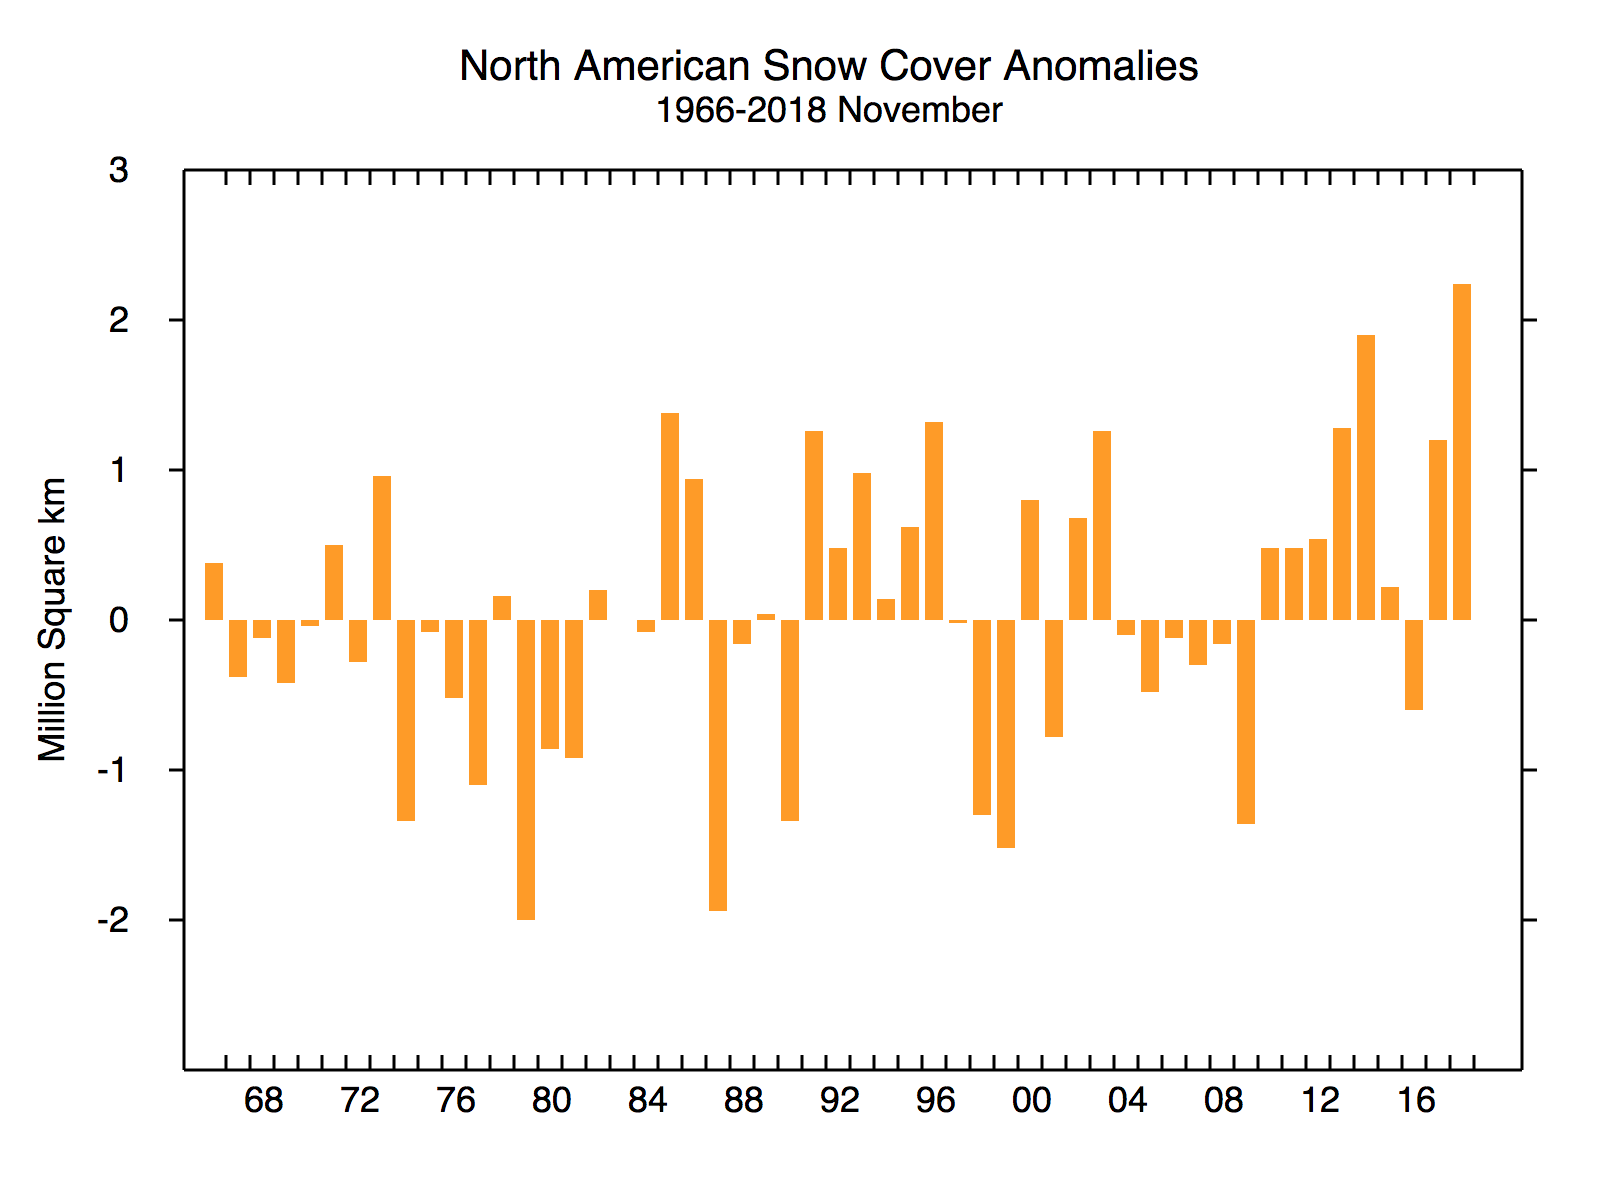
Figure 5. This graph shows snow cover extent anomalies in the Northern Hemisphere for November from 1966 to 2018. The anomaly, or departure from average, is relative to the 1981 to 2010 average.
Credit: National Snow and Ice Data Center, courtesy Rutgers University Global Snow Lab
High-resolution image
As many US travelers noticed over the Thanksgiving weekend, the snow season has arrived early over parts of North America. While parts of Alaska had their latest first snowfall, based on data at the Rutgers Global Snow Lab, North America as a whole had the highest November snow extent in the 1966 to 2018 record (Figure 5). Above average snow cover was particularly notable over central and eastern Canada. Over Eurasia, snow cover was slightly above average for this time of year. The extensive snow cover over eastern Canada was related to low pressure over the North Atlantic that brought cold air from the Arctic into the region.
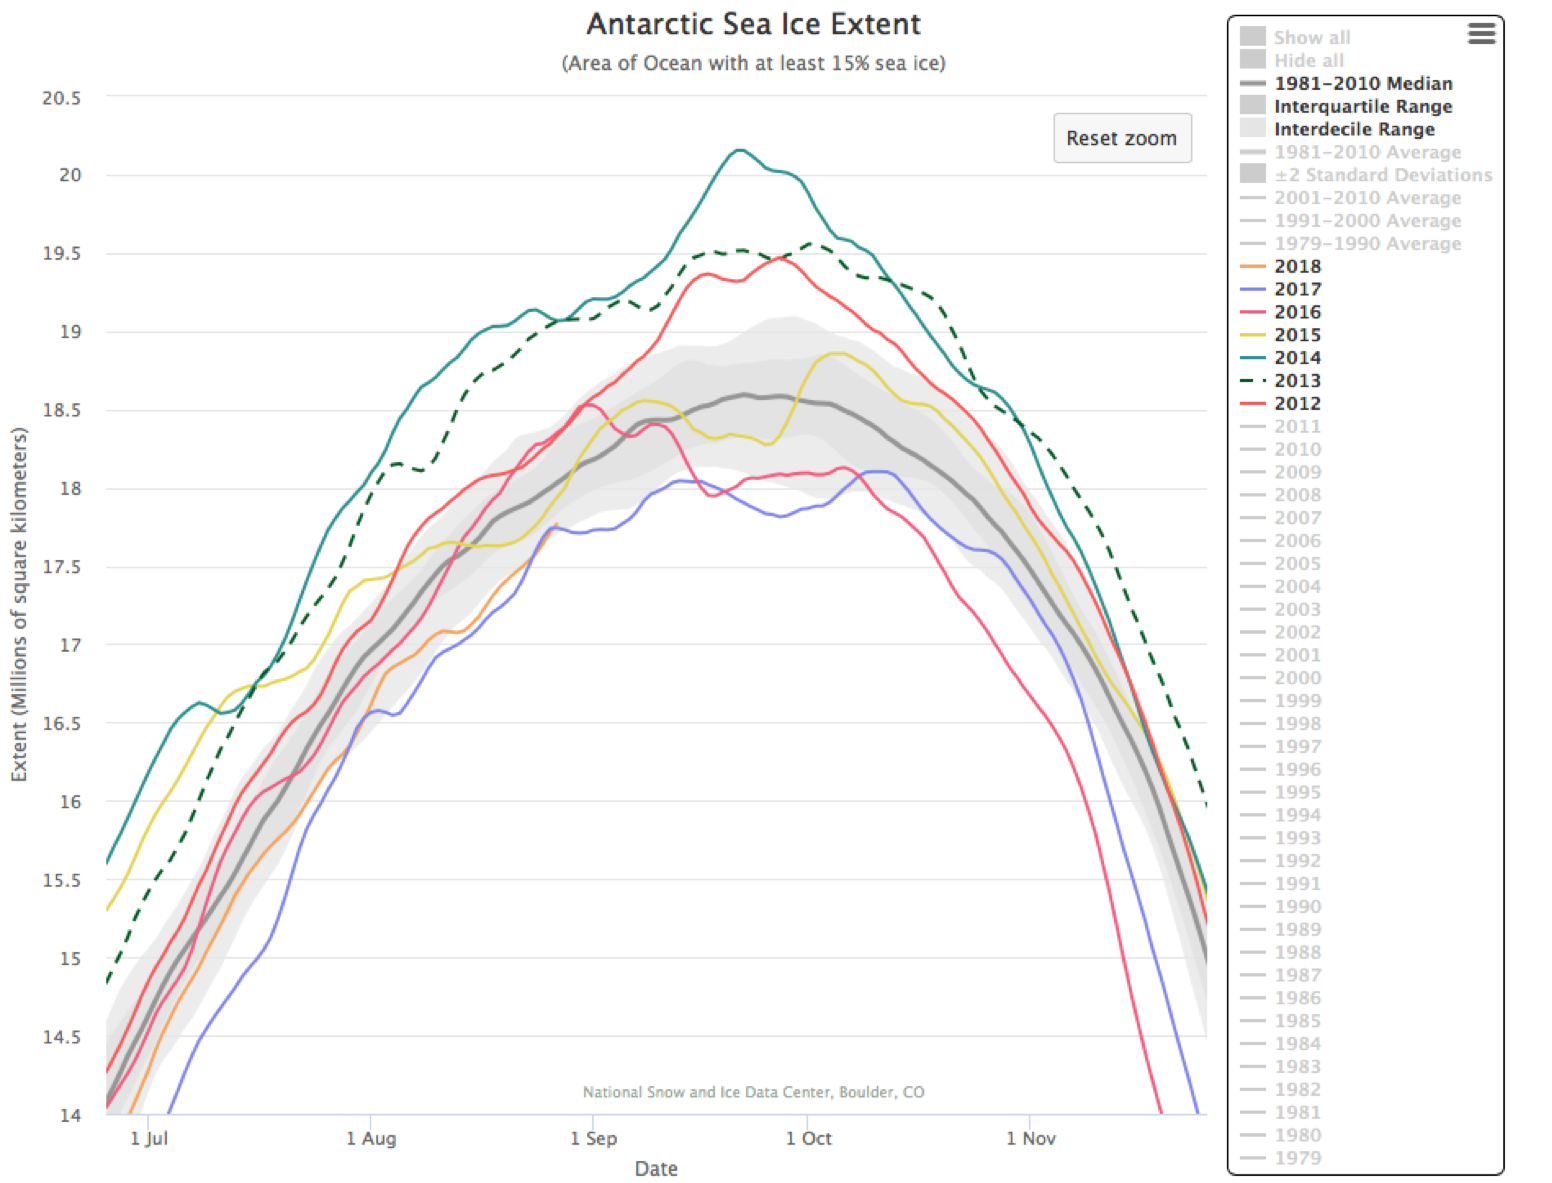
Antarctic note
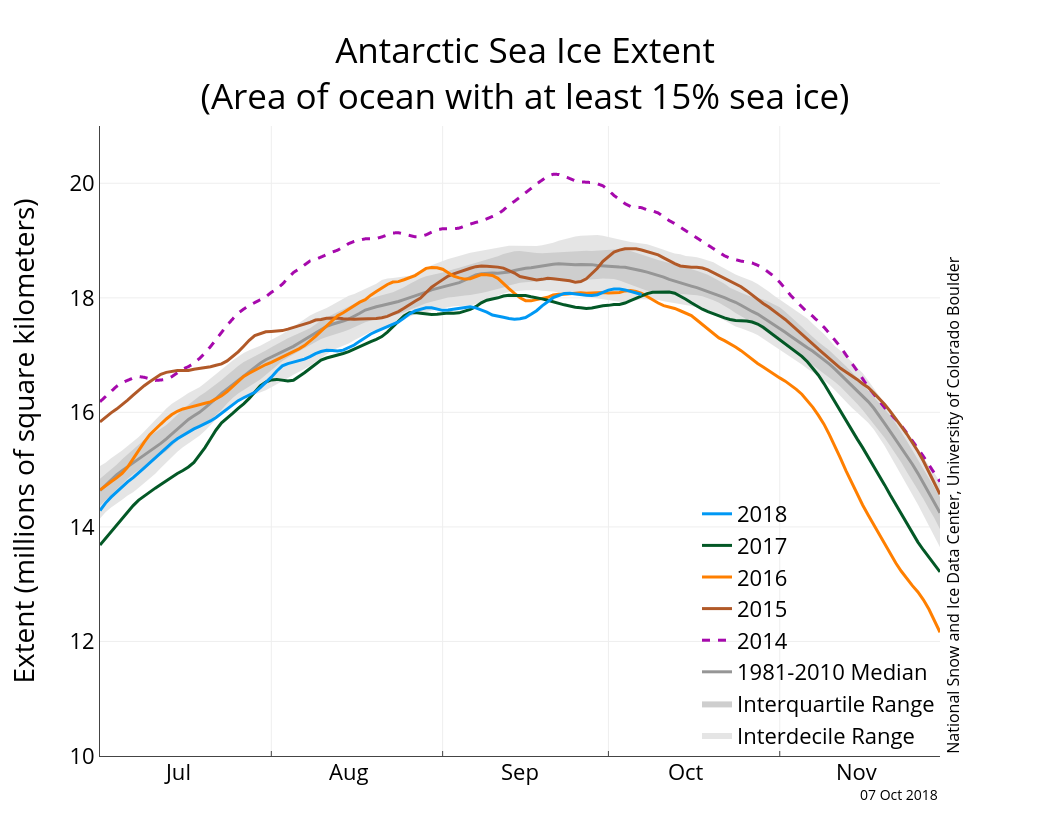
Antarctic sea ice extent declined much more slowly than average in November, but large areas in the northern Weddell Sea and the ocean north of Dronning Maud Land have open, low-concentration pack ice. Several polynyas have appeared near the Antarctic coast, in the Ross Sea, Thwaites Glacier region, Prydz Bay west of the Amery Ice Shelf, and in the Weddell Sea. The Weddell Sea polynyas are completely offshore near the region of the Maud Rise bathymetric feature, and may be an indication of a return of the Maud Rise Polynya feature (see 2016 to 2017 ASINA posts). Higher-than-average temperatures prevailed in the Ross Sea and Weddell Sea, up 1 to 3 degrees Celsius (2 to 5 degrees Fahrenheit) from the 1981 to 2010 average. Meanwhile, cool conditions were present near Thwaites Glacier and the Amery Ice Shelf region, with temperatures 1.5 degrees Celsius (3 degrees Fahrenheit) below average.
Reference
Barton, B. I., Y. Lenn, and C. Lique. 2018. Observed Atlantification of the Barents Sea causes the polar front to limit the expansion of winter sea ice. Journal of Physical Oceanography, 48, 1849–1866, doi:10.1175/JPO-D-18-0003.1.
Stroeve, J. C. and D. Notz. 2018. Changing state of Arctic sea ice across all seasons. Environmental Research Letters. doi:10.1088/1748-9326/aade56.