As temperatures at the North Pole approached the melting point at the end of February, Arctic sea ice extent tracked at record low levels for this time of year. Extent was low on both the Atlantic and Pacific sides of the Arctic, with open water areas expanding rapidly in the Bering Sea during the latter half of the month. On the other side of the globe, Antarctic sea ice has reached its minimum extent for the year, the second lowest in the satellite record.
Overview of conditions
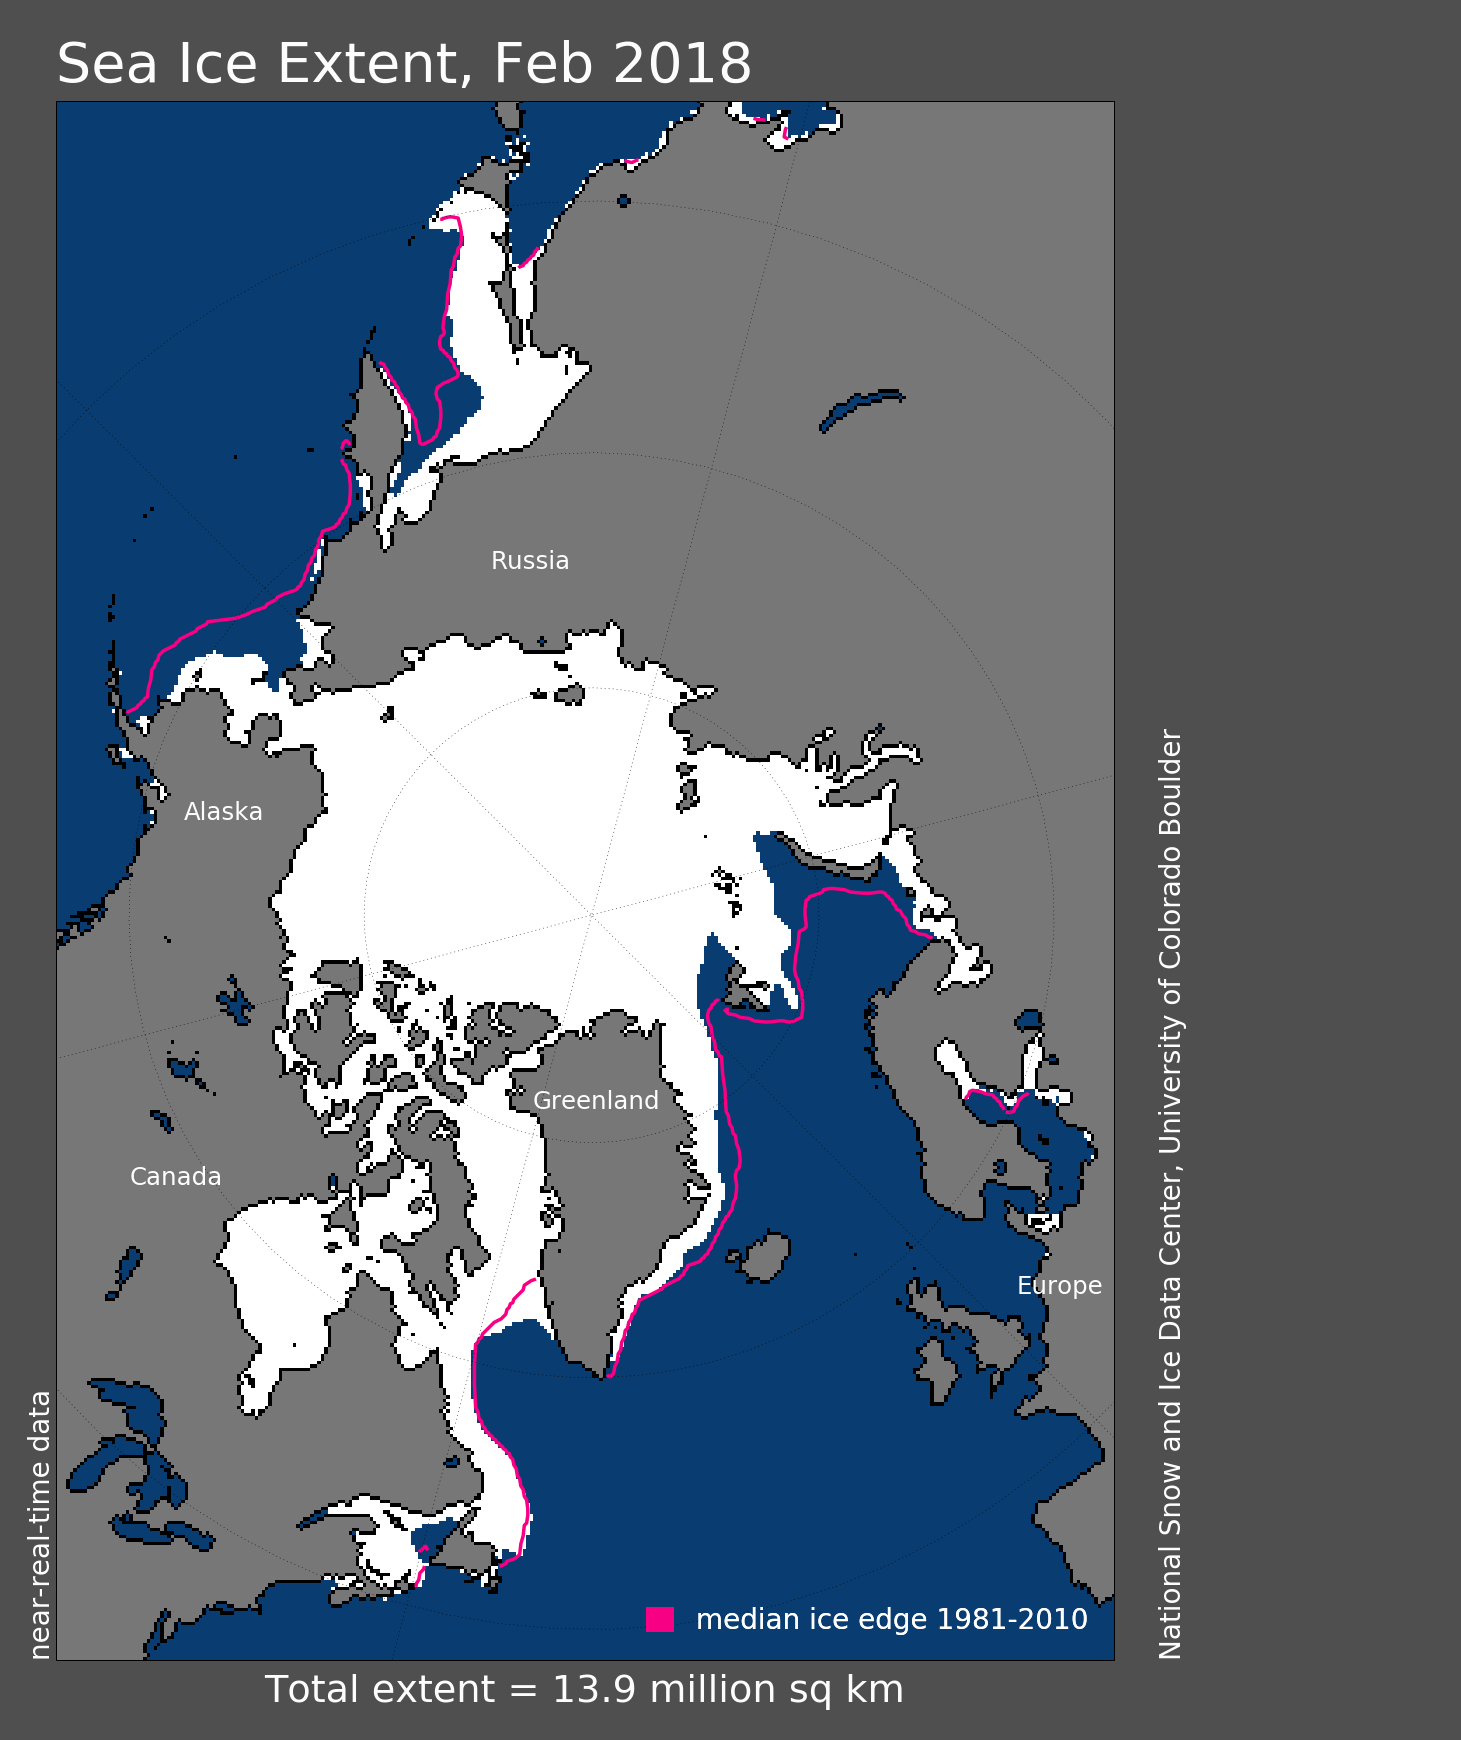
Figure 1. Arctic sea ice extent for February 2018 was 13.95 million square kilometers (5.39 million square miles). The magenta line shows the 1981 to 2010 average extent for that month. Sea Ice Index data. About the data
Credit: National Snow and Ice Data Center
High-resolution image
Winter continues to be mild over the Arctic Ocean. Sea ice extent remained at record low daily levels for the month. Arctic sea ice extent for February 2018 averaged 13.95 million square kilometers (5.39 million square miles). This is the lowest monthly average recorded for February, 1.35 million square kilometers (521,000 square miles) below the 1981 to 2010 average and 160,000 square kilometers (62,000) below the previous record low monthly average in 2017.
Extent was especially low in the Bering Sea where sea ice declined during the first three weeks of the month. The eastern part of the Bering Sea was largely ice-free for most of the month; extent was low on the western side, with the ice edge further north than normal. In the Chukchi Sea, extent also retreated during part of February, with open water developing north of the Bering Strait on both the Siberian and Alaskan coasts. As seen all winter, ice extent continued to be below average in the Barents Sea, and at the end of February, a wedge of open water formed north of Svalbard that extended well into the Arctic Ocean.
Conditions in context
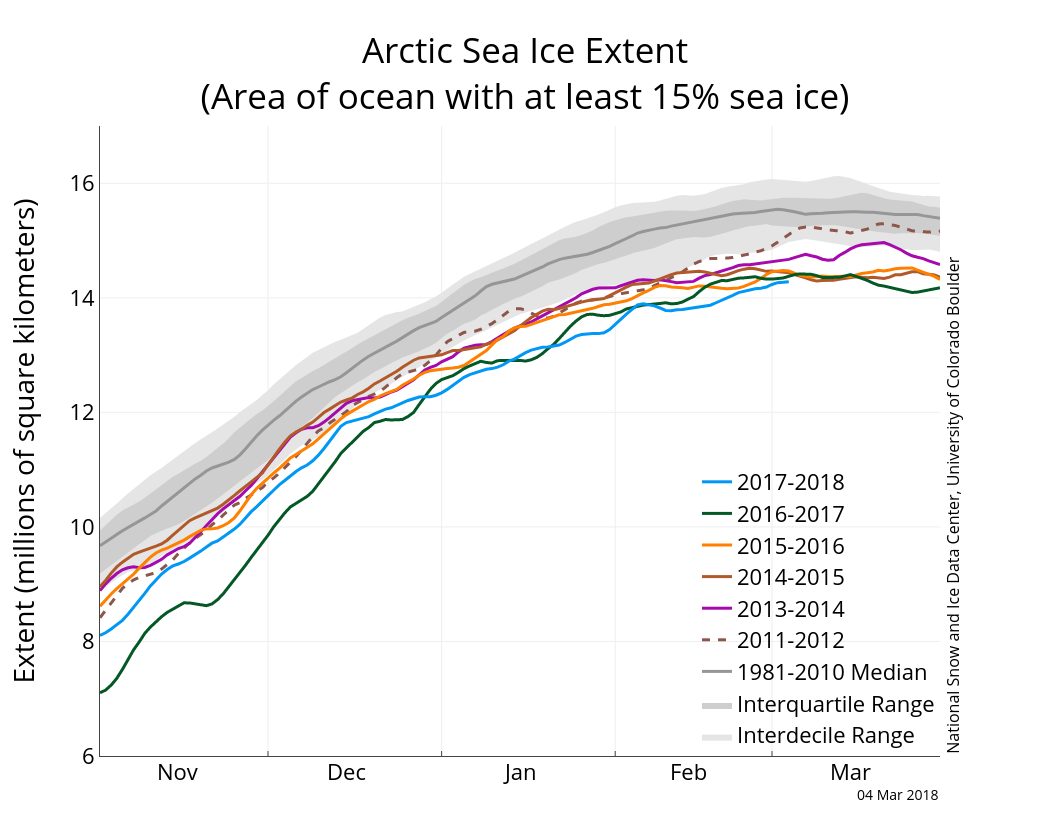
Figure 2a. The graph above shows Arctic sea ice extent as of March 4, 2018, along with daily ice extent data for four previous years. 2017 to 2018 is shown in blue, 2016 to 2017 in green, 2015 to 2016 in orange, 2014 to 2015 in brown, 2013 to 2014 in purple, and 2011 to 2012 in dotted brown. The 1981 to 2010 median is in dark gray. The gray areas around the median line show the interquartile and interdecile ranges of the data. Sea Ice Index data.
Credit: National Snow and Ice Data Center
High-resolution image
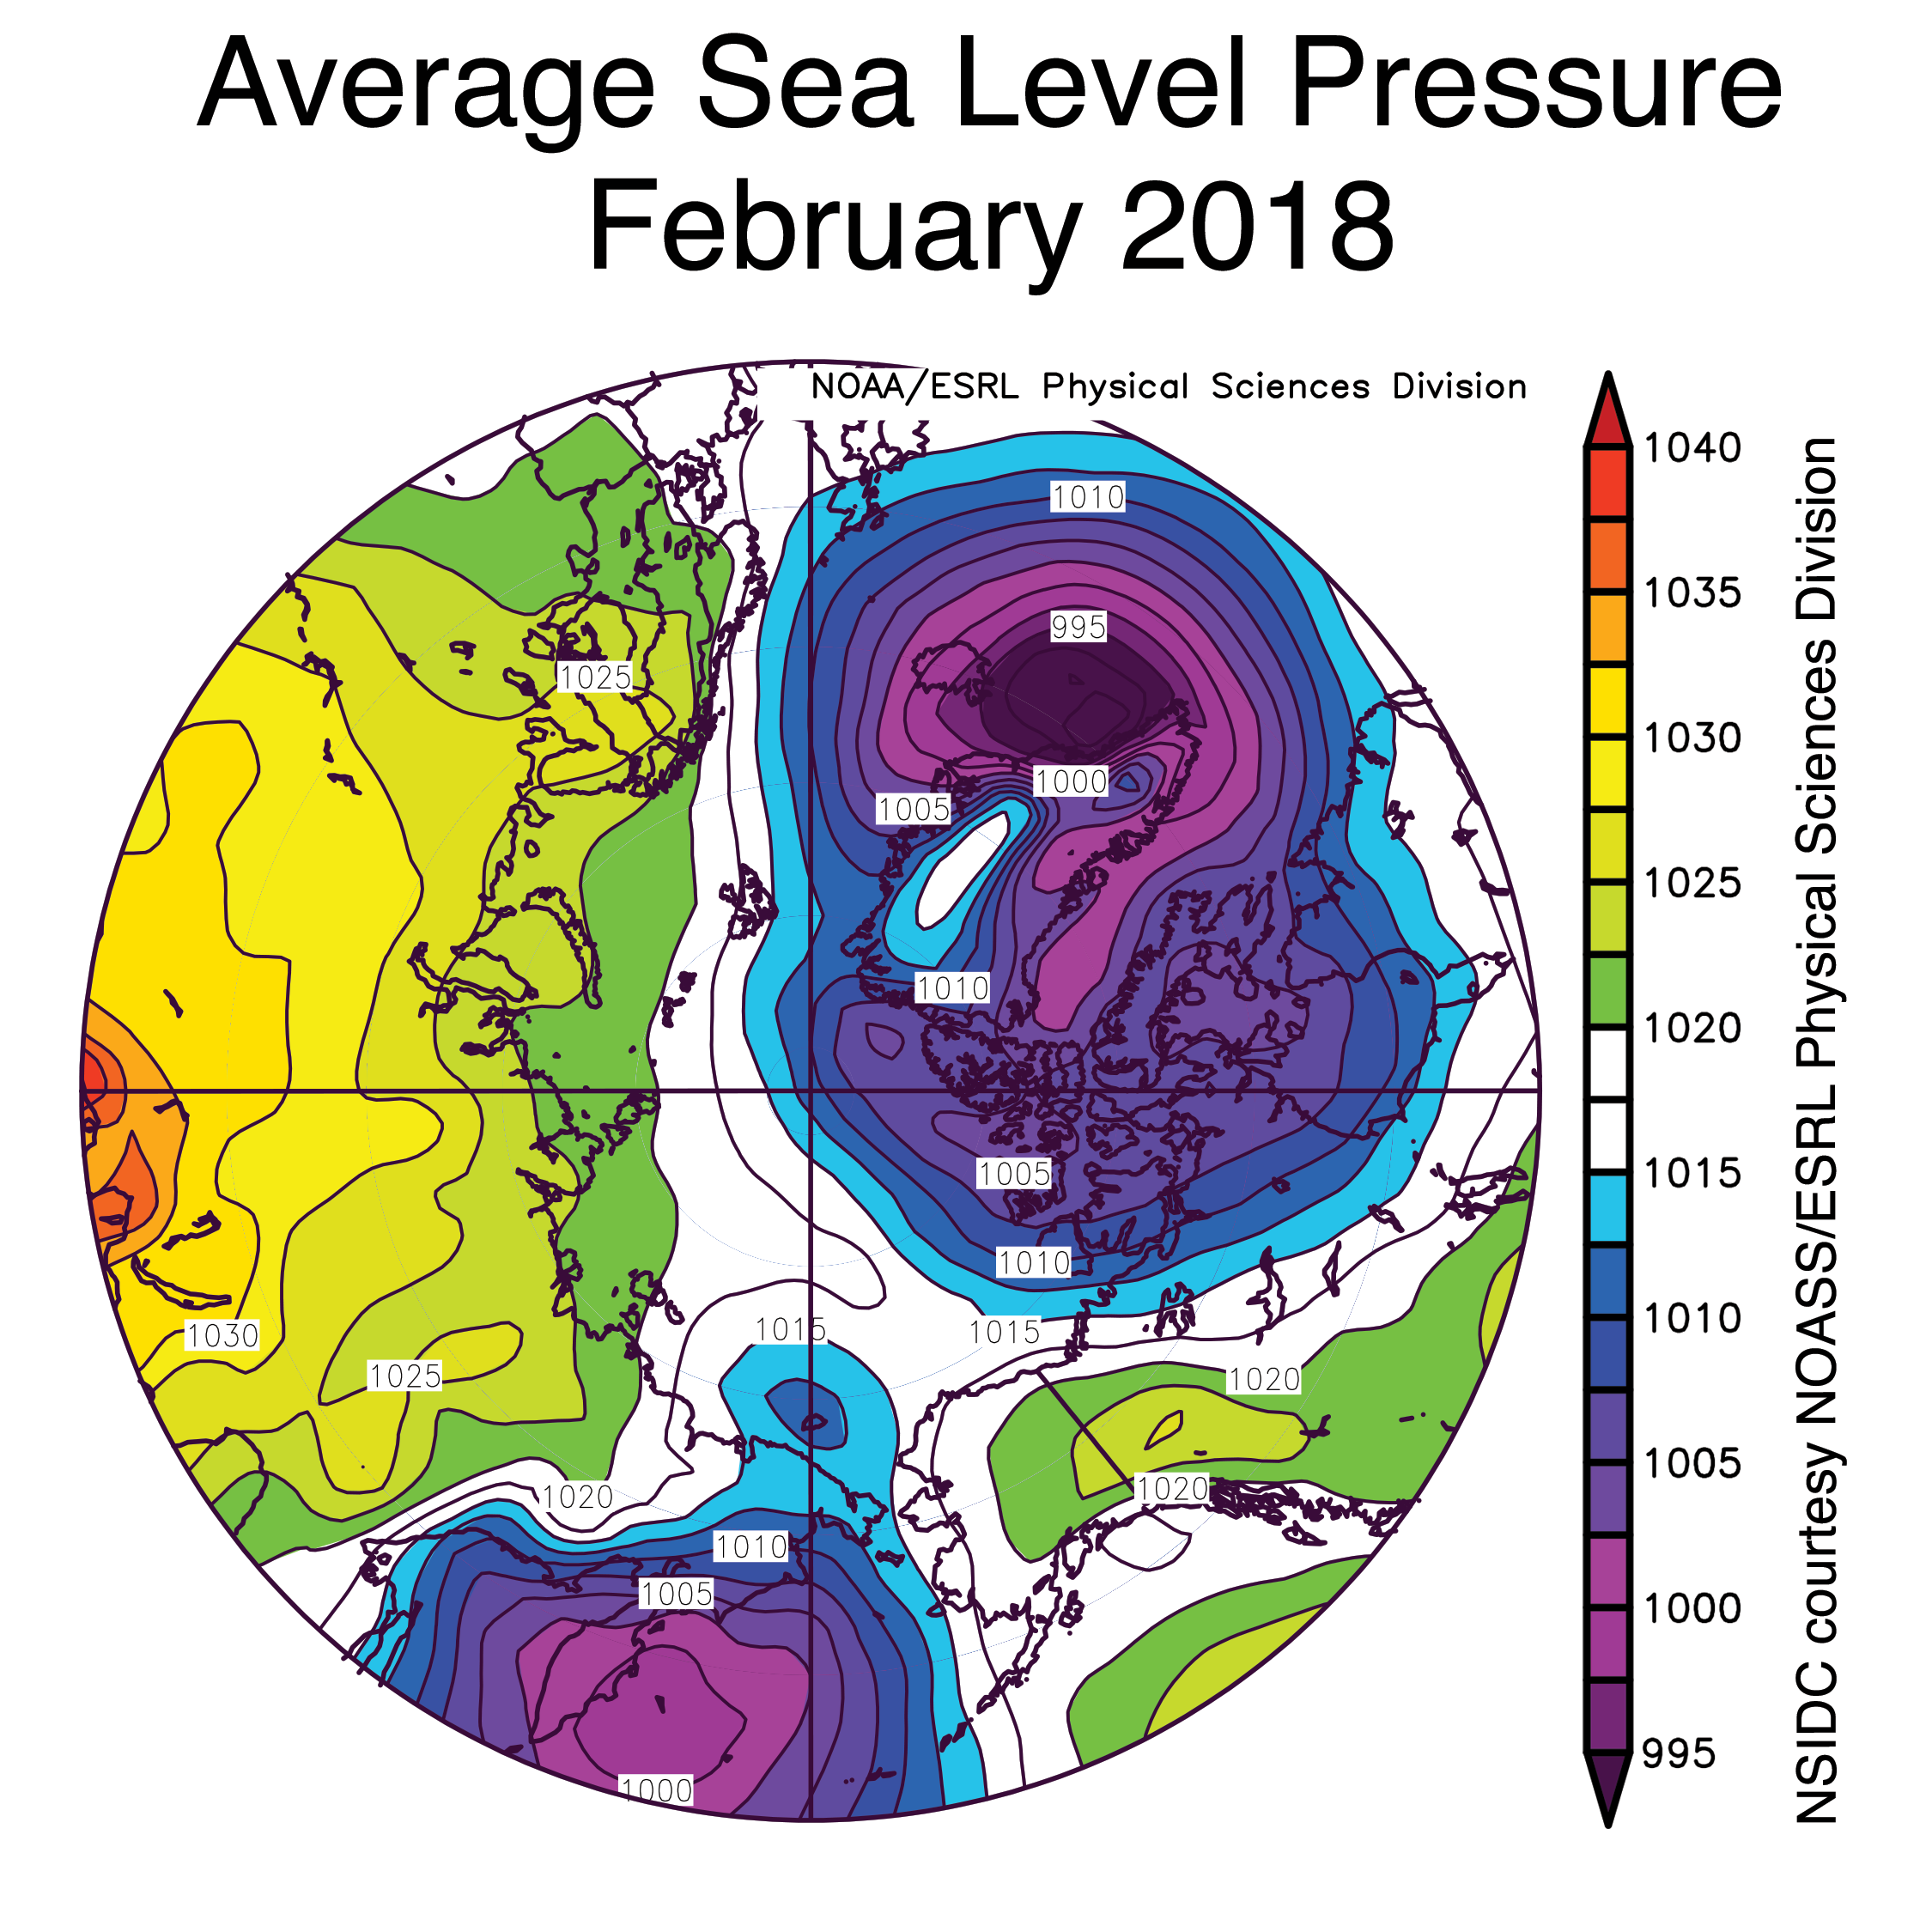
Figure 2b. This plot shows the average sea level pressures at the 925 hPa level for February 2018. Yellows and reds indicate higher than average air pressures; blues and purples indicate lower than average air pressures.
Credit: NSIDC courtesy NOAA Earth System Research Laboratory Physical Sciences Division
High-resolution image
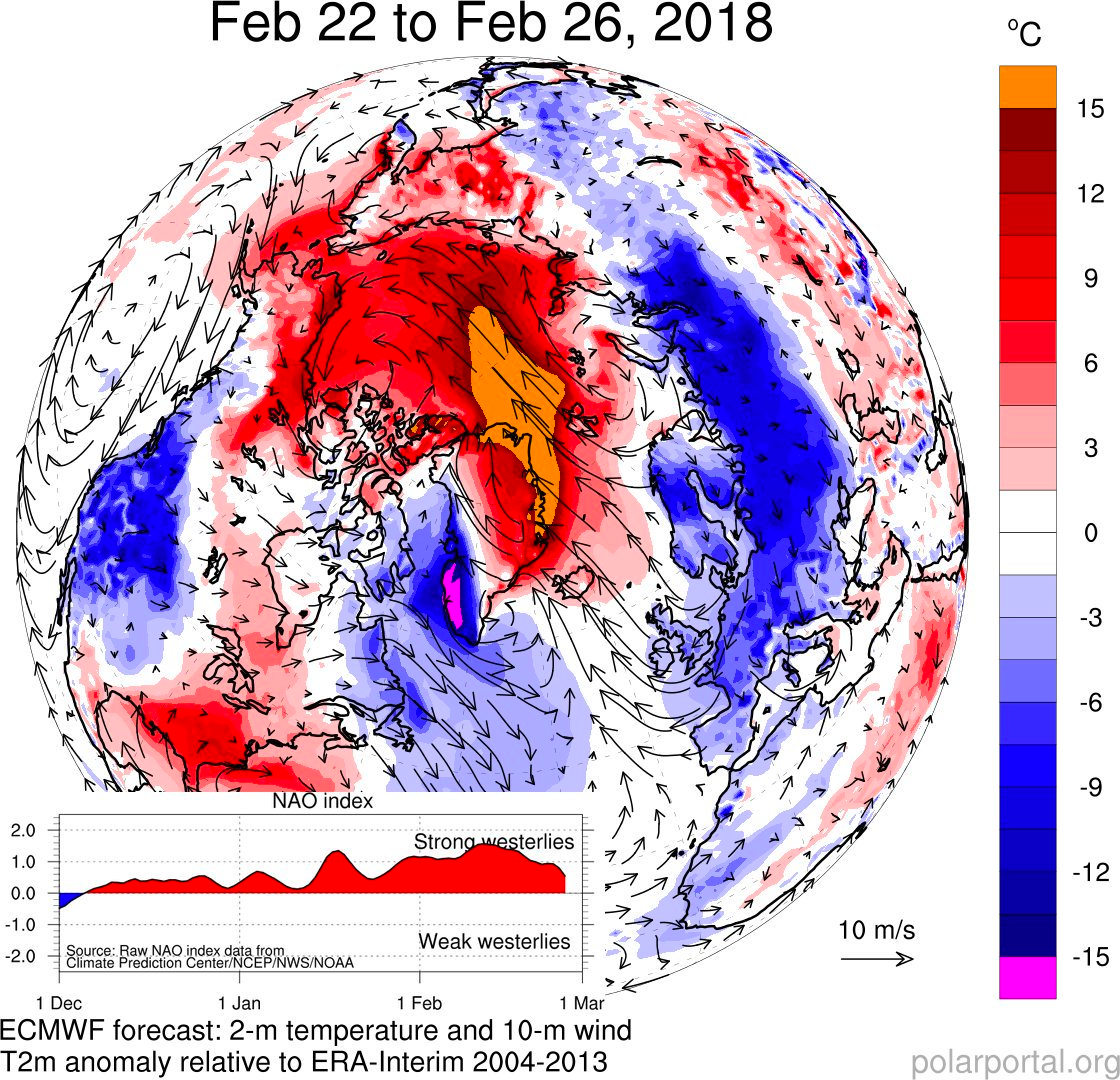
Figure 2c. This figure shows differences from average temperature in degrees Celsius, and wind conditions for the period February 22 to 26, 2018. In addition, the North Atlantic Oscillation (NAO) index is shown in the lower left. This is a measure of the strength of the westerly winds in the North Atlantic. When the index is negative, the flow is wavier, which increases the probability of transport of warm air to Greenland from the south.
Credit: European Centre for Medium-Range Weather Forecasts (ECMWF) IFS forecast model
High-resolution image
Low pressure centered just east of the Kamchatka Peninsula and high pressure centered over Alaska and the Yukon during February set up southerly winds that brought warm air and warm ocean waters into the Pacific side of the Arctic Ocean, impeding southward ice growth. This helps to explain the rapid loss of ice extent in the Bering Sea and the ice-free regions within the Chukchi Sea during the month. The warm air intrusion is evident in the 925 mb air temperatures, with monthly temperatures 10 to 12 degrees Celsius (18 to 22 degrees Fahrenheit) above average in the Chukchi and Bering Sea.
On the Atlantic side, low pressure off the southeast coast of Greenland and high pressure over northern Eurasia helped to funnel warm winds into the region and may have also enhanced the northward transport of oceanic heat. At the end of the month, this atmospheric circulation pattern was particularly strong, associated with a remarkable inflow of warm air from the south, raising the temperatures near the North Pole to above freezing, around 20 to 30 degrees Celsius (36 to 54 degrees Fahrenheit) above average. Air temperatures at Cape Morris Jesup in northern Greenland (83°37’N, 33°22’W) exceeded 0 degrees Celsius for several hours and open water formed to the north of Greenland at the end of the month. This is the third winter in a row in which extreme heat waves have been recorded over the Arctic Ocean. A study published last year by Robert Graham from the Norwegian Polar Institute showed that recent warm winters represent a trend towards increased duration and intensity of winter warming events within the central Arctic. While the Arctic has been relatively warm for this time of year, northern Europe was hit by extreme cold conditions at the end of February.
February 2018 compared to previous years
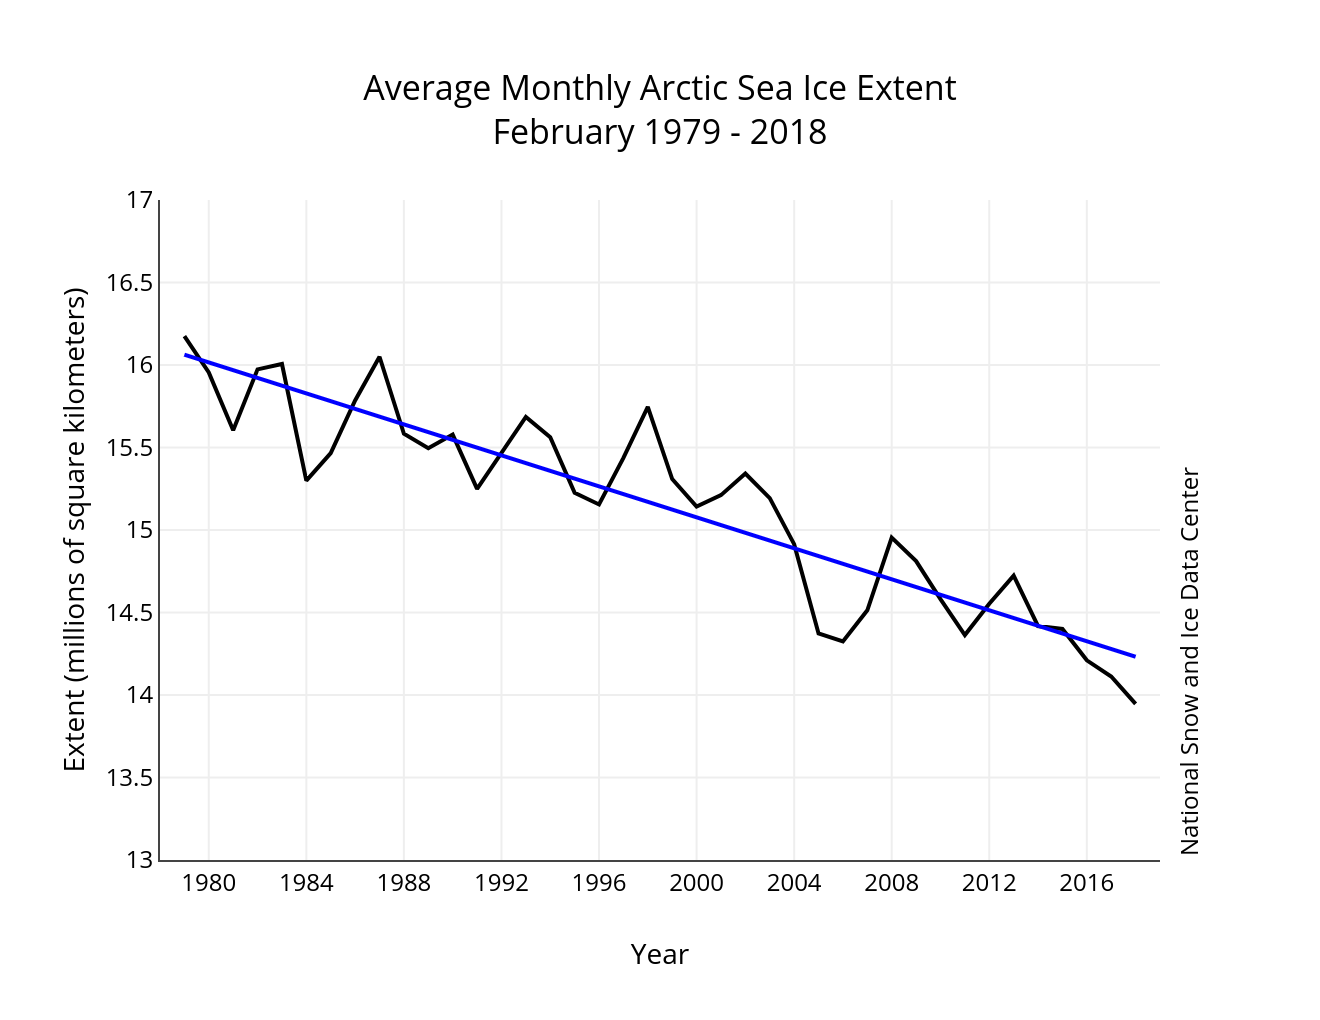
Figure 3. Monthly 2018 ice extent for 1979 to 2018 shows a decline of 3.1 percent per decade.
Credit: National Snow and Ice Data Center
High-resolution image
The linear rate of decline for February is 47,000 square kilometers per year (18,000 square miles per year), or 3.1 percent per decade.
Late freeze-up
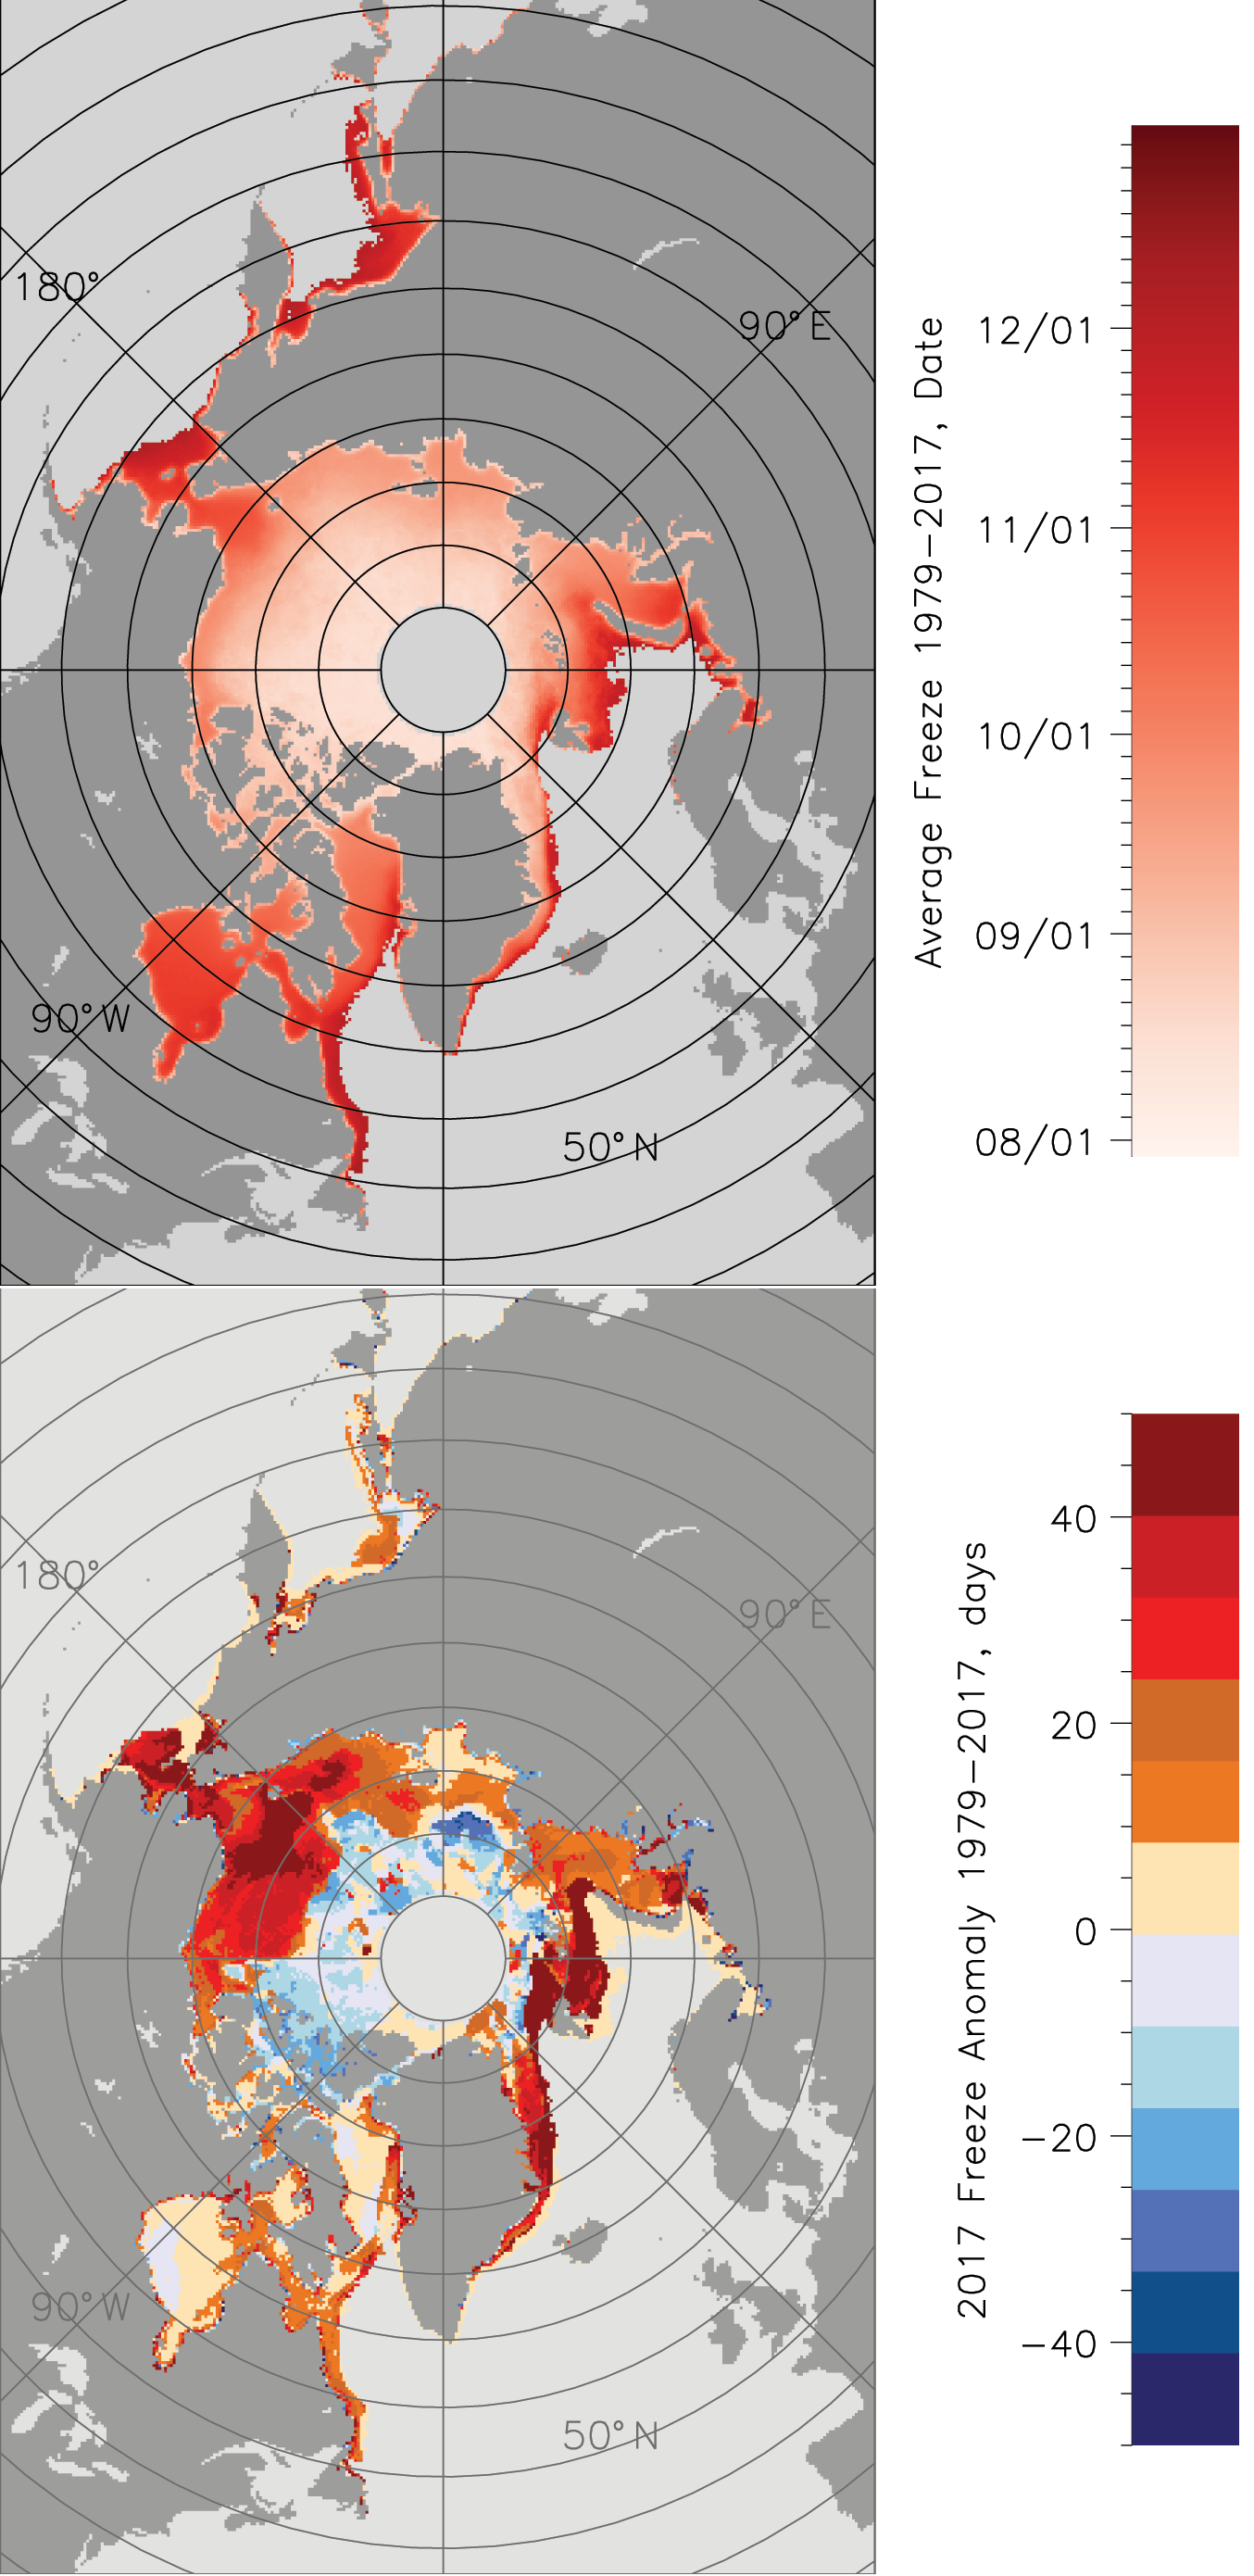
Figure 4. These graphs show the average Arctic Ocean ice freeze-up dates for 1979 to 2017 (top) and the number of days that freeze-up occurred earlier (cool colors) or later (warm colors) than average (bottom).
Credit: J. Miller, NASA Goddard Space Flight Center
High-resolution image
This year, the freeze-up started earlier than average over much of the central Arctic Ocean, near average within Hudson and Baffin Bays, but significantly later than average elsewhere. Freeze-up was delayed by more than a month later than average within the Chukchi and Bering Seas on the Pacific side, and within the Barents and East Greenland Seas on the Atlantic side. In these regions freeze-up happened after December. Later freeze-up impacts sea ice thickness, reducing the number of days over which sea ice can grow during winter.
Winter navigation in the Arctic without an icebreaker

Figure 5. This figure shows the distribution of Arctic sea ice according to stage of development, , as of February 22, 2018. Pink shows new ice; purple shows young ice; blue shows first year thin ice; orange shows first year medium ice, red shows first year thick ice, brown shows old ice, and while shows glacial ice.
Credit: U.S. National Ice Center
High-resolution image
The Arctic Ocean is becoming more accessible for shipping. Most of the increase in commercial shipping traffic has been during summer, primarily through the Northern Sea Route along the coast of Siberia. However, this February a commercial tanker, the Eduard Toll, made the first crossing of the Northern Sea Route in winter. Improvements in ship-building and the development of ice-strengthened hull technology is a major factor in enabling winter access. Previous ice-strengthened ships could only navigate safely through 0.5 meter thick ice, compared to the 1.8 meter thick ice that the Eduard Toll cruised through. A fleet of six ships with similar technology is being constructed by a South Korean shipbuilder.
While the Northern Sea Route has tended to be dominated by first-year ice, which typically reaches a maximum of around 2 meters, thicker (3- to 4-meter) multi-year ice would be a hazard even to the newer, stronger ships. According to analysis by the U.S. National Ice Center, this year’s old ice (multi-year ice) has pulled completely away from the coast and the Northern Sea Route is dominated by first-year medium (0.7- to 1.2-meter) or first-year thick (1.2- to 2-meter) ice.
Opposite pole, same near-record low extent
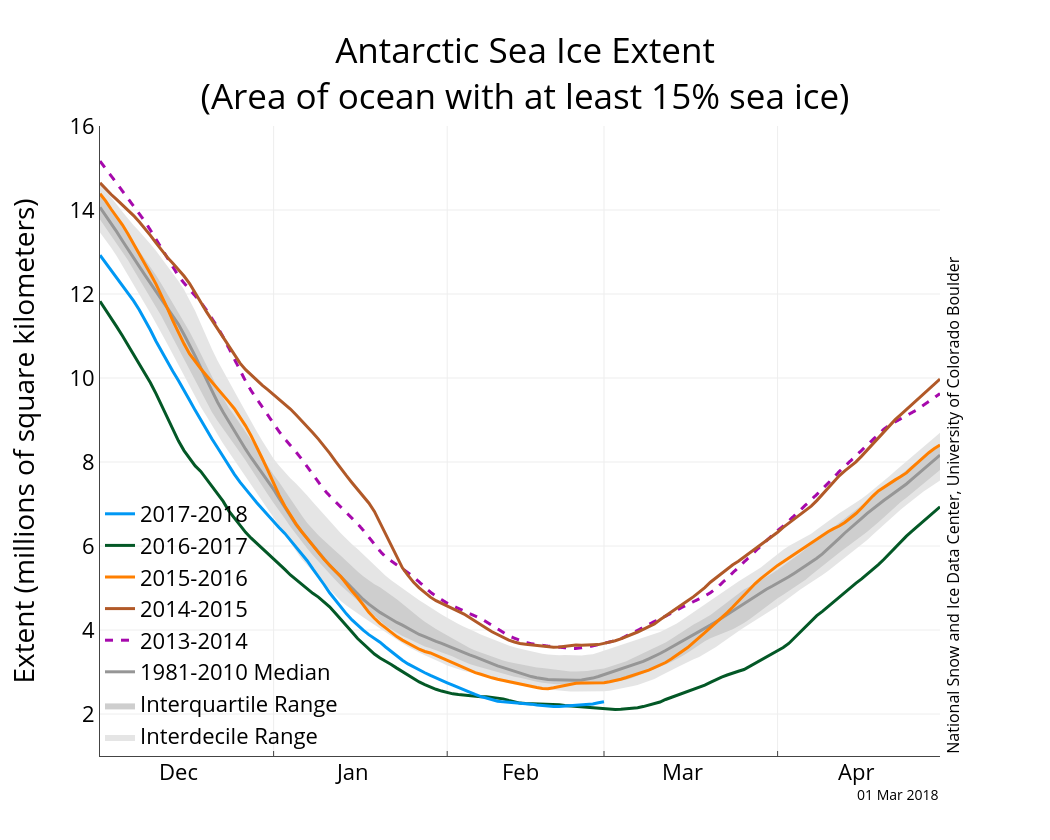
Figure 6a. The graph above shows Antarctic sea ice extent as of March 1, 2018, along with daily ice extent data for four previous years. 2017 to 2018 is shown in blue, 2016 to 2017 in green, 2015 to 2016 in orange, 2014 to 2015 in brown, 2013 to 2014 in purple, and 2011 to 2012 in dotted magenta. The 1981 to 2010 median is in dark gray. The gray areas around the median line show the interquartile and interdecile ranges of the data. Sea Ice Index data.
Credit: National Snow and Ice Data Center
High-resolution image

Figure 6b. This figure shows Antarctic sea ice extent for February 28, 2018. Sea Ice Index data. About the data
Credit: National Snow and Ice Data Center
High-resolution image
In the Antarctic, sea ice extent reached its daily seasonal minimum, 2.18 million square kilometers (842,000 square miles), on February 20 and 21. This is the second lowest minimum extent in the satellite record, 70,000 square kilometers (27,000 square miles) above the record low, which was set on March 3, 2017. The February average was 2.29 million square kilometers (884,000 square miles), second lowest in the satellite record, and 20,000 square kilometers (7,700 square miles) above the record low February in 2017.
Sea ice in the Antarctic is highly variable from year to year—much more so than in the Arctic. This is clearly seen in the February extent values, where low 2011 values were followed by record or near-record highs in 2013, 2014, and 2015. This was then followed by record or near-record lows in 2017 and this year.
Sea ice extent is particularly low in the Ross and western Amundsen Sea region, and along the southern reaches of the Bellingshausen Sea. Patchy sea ice areas along the East Antarctic coast are near-average in extent.
Further reading
Graham, R. M., L. Cohen, A. A. Petty, L. N. Boisvert, A. Rinke, S.R. Hudson, M. Nicolaus, and M. A. Granskog. 2017. Increasing frequency and duration of Arctic winter warming events, Geophys. Res. Lett., 16, 6974-6983, doi:10.1002/2017GL073395.
Kretschmer, M., D. Coumou, L. Agel, M. Barlow, E. Tziperman, and J. Cohen. 2017. More persistent weak stratospheric polar vortex states linked to cold extremes, Bull. Amer. Meteor. Soc., doi:10.1175/BAMS-D-16-0259.1.

