Western Arctic leads the way on springtime decline

April sea ice loss in the Arctic proceeded at a near-average rate overall, with the majority of ice losses in the Bering Sea and Sea of Okhotsk. In the Antarctic, sea ice grew faster than average, roughly evenly around the entire continent. Both hemispheres are well below the 1981 to 2010 reference period average, but neither are near record-low extents.

Overview of conditions
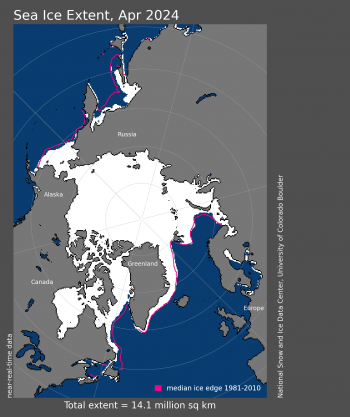
Figure 1a. Arctic sea ice extent for April 2024 was 14.12 million square kilometers (5.45 million square miles). The magenta line shows the 1981 to 2010 average extent for that month. Sea Ice Index data. About the data||Credit: National Snow and Ice Data Center|High-resolution image

Figure 1a. Arctic sea ice extent for April 2024 was 14.12 million square kilometers (5.45 million square miles). The magenta line shows the 1981 to 2010 average extent for that month. Sea Ice Index data. About the data

Credit: National Snow and Ice Data Center
High-resolution image
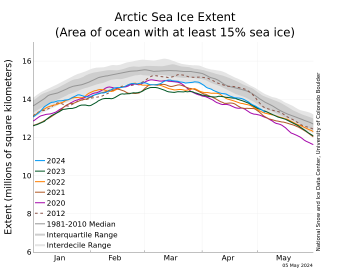
Figure 1b. The graph above shows Arctic sea ice extent as of May 5, 2024, along with daily ice extent data for four previous years and the record low year. 2024 is shown in blue, 2023 in green, 2022 in orange, 2021 in brown, 2020 in magenta, and 2012, the record low year, in dashed brown. The 1981 to 2010 median is in dark gray. The gray areas around the median line show the interquartile and interdecile ranges of the data. Sea Ice Index data.||Credit: National Snow and Ice Data Center|High-resolution image

Figure 1b. The graph above shows Arctic sea ice extent as of May 5, 2024, along with daily ice extent data for four previous years and the record low year. 2024 is shown in blue, 2023 in green, 2022 in orange, 2021 in brown, 2020 in magenta, and 2012, the record low year, in dashed brown. The 1981 to 2010 median is in dark gray. The gray areas around the median line show the interquartile and interdecile ranges of the data. Sea Ice Index data.

Credit: National Snow and Ice Data Center
High-resolution image

The average Arctic sea ice extent for April 2024 was 14.12 million square kilometers (5.45 million square miles), placing it sixteenth lowest in the passive microwave satellite record (Figure 1a and 1b). As of the beginning of May, extent is well below average in the Sea of Okhotsk, and slightly below average in the Bering and Barents Seas and off the coast of Labrador. Ice is near the average position along the eastern coast of Greenland.

Conditions in context
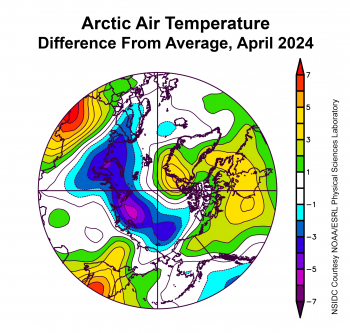
Figure 2a. This plot shows the departure from average air temperature in the Arctic at the 925 hPa level, in degrees Celsius, for April 2024. Yellows and reds indicate above average temperatures; blues and purples indicate below average temperatures.||Credit: NSIDC courtesy NOAA Earth System Research Laboratory Physical Sciences Laboratory| High-resolution image

Figure 2a. This plot shows the departure from average air temperature in the Arctic at the 925 hPa level relative to the 1991 to 2020 reference period, in degrees Celsius, for April 2024. Yellows and reds indicate above average temperatures; blues and purples indicate below average temperatures.

Credit: NSIDC courtesy NOAA Earth System Research Laboratory Physical Sciences Laboratory
High-resolution image
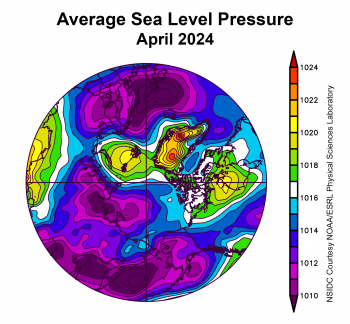
Figure 2b. This plot shows the average sea level pressure in the Arctic in millibars for April 2024. Yellows and reds indicate above average air pressures; blues and purples indicate below average air pressures.||Credit: NSIDC courtesy NOAA Earth System Research Laboratory Physical Sciences Laboratory| High-resolution image

Figure 2b. This plot shows the average sea level pressure in the Arctic in millibars for April 2024. Yellows and reds indicate above average air pressures; blues and purples indicate below average air pressures.

Credit: NSIDC courtesy NOAA Earth System Research Laboratory Physical Sciences Laboratory
High-resolution image

The global average temperature in April was at a record high in many assessments. By contrast in the Arctic, April 2024 temperatures at the 925 hPa level (about 2,500 feet above the surface) were below average by 3 to 5 degrees Celsius (5 to 9 degrees Fahrenheit) along the Siberian coast and northwestern coast of Scandinavia. Markedly warm conditions were the rule over most of Canada and northern Greenland (Figure 2a). The regions near Hudson Bay and along Peary Land on the north coast of Greenland were 3 to 5 degrees Celsius (5 to 9 degrees Fahrenheit) above the 1991 to 2020 climate reference period.

The atmospheric pattern for April featured high sea level pressure centered over the Barents Sea but lower pressure over most of the rest of the Arctic Ocean (Figure 2b). In Hudson Bay and Greenland, pressures were relatively high. The pattern in March that favored faster outflow of ice through Fram Strait did not persist into April.

April 2024 compared to previous years
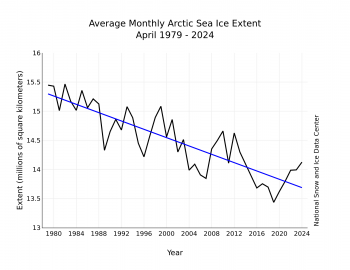
Figure 3. Monthly April ice extent for 1979 to 2024 shows a decline of 2.4 percent per decade.||Credit: National Snow and Ice Data Center| High-resolution image

Figure 3. Monthly April ice extent for 1979 to 2024 shows a decline of 2.4 percent per decade.

Credit: National Snow and Ice Data Center
High-resolution image

Including 2024, the downward linear trend in April mean monthly sea ice extent was 36,000 square kilometers (14,000 square miles) per year, or 2.4 percent per decade relative to the 1981 to 2010 average (Figure 3). Based on the linear trend since 1979, April has lost 1.61 million square kilometers (622,000 square miles) of sea ice, which is roughly equivalent to six times the size of Colorado. April 2024 had the highest sea ice extent for the month in 12 years.

Lightening the mood in the Arctic
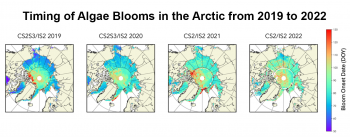
Figure 4. This set of figures shows the timing of under-ice algae bloom onset from blending CryoSat-2 (CS2), Sentinel-3 (S3), and ICESat-2 (IS2)-derived sea ice thickness data. The color bar refers to the day of the year (DOY) that enough light passes through the snow cover and sea ice to spark an algae bloom. S3 data were only available in 2019 and 2020. Missing data in 2021 and 2022 around 80N reflects missing albedo data in the Advanced Very High Resolution Radiometer (AVHRR) APP-X data product. || Credit: Stroeve et al. 2024 | High-resolution image

Figure 4. This set of figures shows the timing of under-ice algae bloom onset from blending CryoSat-2 (CS2), Sentinel-3 (S3), and ICESat-2 (IS2)-derived sea ice thickness data. The color bar refers to the day of the year (DOY) that enough light passes through the snow cover and sea ice to spark an algae bloom. S3 data were only available in 2019 and 2020. Missing data in 2021 and 2022 around 80N reflects missing albedo data in the Advanced Very High Resolution Radiometer (AVHRR) APP-X data product.

Credit: Stroeve et al. 2024
High-resolution image

When sea ice extent shrinks and thins, and there is less snow cover, more light enters the water deeper. Light is a primary driver for sea ice algae and phytoplankton blooms, which form the base of the Arctic marine foodchain. To determine the timing of when enough light is present to initiate an ice algal bloom, NSIDC scientist Julienne Stroeve and others took existing satellite data products and combined them with information on light extinction properties through snow and ice. Light extinction implies the amount of dimming as light passes through ice, beginning at 100 percent (high) and dropping to 10 percent at the base of the ice. This has only been possible recently, with the development of accurate daily sea ice thickness products blended from CryoSat-2, Sentinel-3, and the Ice, Cloud and land Elevation Satellite-2 (ICESat-2).

Figure 4 illustrates the timing of bloom onset from 2019 to 2022, highlighting large year-to-year variability that reflects variability in snow depth over sea ice. In 2019, for example, bloom onset occurred at the end of February in the Beaufort Sea, whereas in 2022 the bloom onset occurred between mid-March to early April. In general, bloom onset starts about a month earlier in the marginal ice zone than it does in the central Arctic Ocean.

Antarctic note
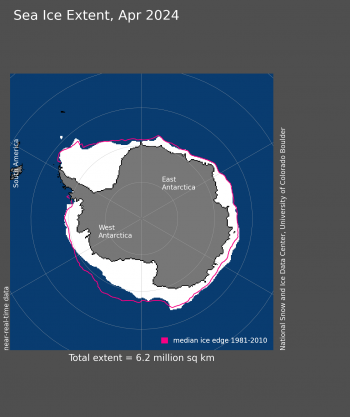
Figure 5a. Antarctic sea ice extent for April 2024 was 6.19 million square kilometers (2.39 million square miles). The magenta line shows the 1981 to 2010 average extent for that month. Sea Ice Index data. About the data||Credit: National Snow and Ice Data Center|High-resolution image

Figure 5a. Antarctic sea ice extent for April 2024 was 6.19 million square kilometers (2.39 million square miles). The magenta line shows the 1981 to 2010 average extent for that month. Sea Ice Index data. About the data

Credit: National Snow and Ice Data Center
High-resolution image
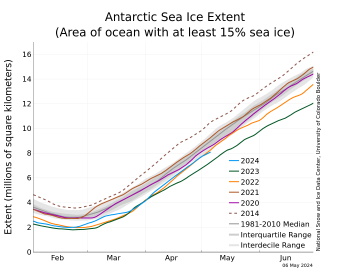
Figure 5b. The graph above shows Antarctic sea ice extent as of May 5, 2024, along with daily ice extent data for four previous years and the record high year. 2024 is shown in blue, 2023 in green, 2022 in orange, 2021 in brown, 2020 in magenta, and 2014, the record high year, in dashed brown. The 1981 to 2010 median is in dark gray. The gray areas around the median line show the interquartile and interdecile ranges of the data. Sea Ice Index data.||Credit: National Snow and Ice Data Center|High-resolution image

Figure 5b. The graph above shows Antarctic sea ice extent as of May 5, 2024, along with daily ice extent data for four previous years and the record high year. 2024 is shown in blue, 2023 in green, 2022 in orange, 2021 in brown, 2020 in magenta, and 2014, the record high year, in dashed brown. The 1981 to 2010 median is in dark gray. The gray areas around the median line show the interquartile and interdecile ranges of the data. Sea Ice Index data.

Credit: National Snow and Ice Data Center
High-resolution image

April is the month of most rapid ice growth in the south. Sea ice expanded relatively uniformly around the continent, but remained below the average extent in the eastern Weddell Sea and the Ross and western Amundsen Seas (Figure 5a). Sea ice grew at a slightly above-average rate, totaling about 3.6 million square kilometers (1.39 million square miles) in April, whereas the 1981 to 2010 average ice growth is 3.20 million square kilometers (1.24 million square miles) (Figure 5b).

Above-average temperatures of 3 to 5 degrees Celsius (5 to 9 degrees Fahrenheit) continued to persist in western Dronning Maud Land but below-average temperatures of 4 to 7 degrees Celsius (7 to 13 degrees Fahrenheit) prevailed in the eastern Amundsen Sea and much of the Wilkes Land coast.

Conditions leading to Antarctica’s record low sea ice in 2023
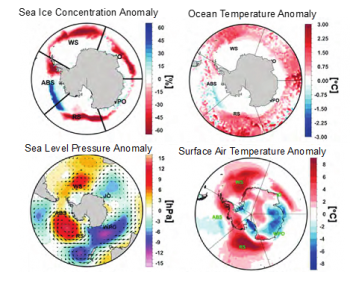
Figure 6. This figure shows climate and ocean conditions in July 2023 for the Antarctic sea ice region. The top left shows sea ice concentration difference from average in percent. The top right shows ocean temperature difference from average in degrees Celsius (1.8 degrees Fahrenheit equals 1 degree Celsius). The lower left shows sea level pressure difference from average in hectopascals (roughly equal to a millibar). The lower right shows near-surface air temperature difference from average (at 2 meters or 6.5 feet above the surface). ||Credit: M. Ionita, 2024|High-resolution image

Figure 6. This figure shows climate and ocean conditions in July 2023 for the Antarctic sea ice region. The top left shows sea ice concentration difference from average in percent. The top right shows ocean temperature difference from average in degrees Celsius (1.8 degrees Fahrenheit equals 1 degree Celsius). The lower left shows sea level pressure difference from average in hectopascals (roughly equal to a millibar). The lower right shows near-surface air temperature difference from average (at 2 meters or 6.5 feet above the surface).

Credit: M. Ionita, 2024
High-resolution image

In July 2023, mid-winter Southern Ocean sea ice fell more than 2.40 million square kilometers (927,000 square miles) below the long-term average, a huge shortfall that revised scientific perceptions of what was possible in the Antarctic climate system. A recent paper written by Monica Ionita from the Alfred Wegner Institute Helmholtz Center for Polar and Marine Research placed the cause of the extreme event with a persistent threefold pattern of alternating low and high air pressure centers surrounding the continent. This pattern, known as “zonal wave-3,” transports warmth and moist air toward the Antarctic coast, suppressing sea ice formation and leading to exceptional anomalies in air temperature and ocean temperature.

Ionita, M. 2024. Large-scale drivers of the exceptionally low winter Antarctic sea ice extent in 2023. Frontiers in Earth Science. doi: 10.3389/feart.2024.1333706.

Stroeve, J, et. al. 2024. Mapping potential timing of ice algal blooms from satellite. Geophysical Research Letters. doi: 10.1029/2023GL106486.
Arctic sea ice: Walking on sunshine

Following the 2024 maximum sea ice extent on March 14, Arctic ice extent has declined slowly such that 2024 March average is the fifteenth lowest in the passive microwave satellite record. The atmospheric circulation pattern for March 2024 featured a strong pressure gradient across Fram Strait, likely promoting strong winds from the north and therefore strong sea ice export out of the Arctic. An update on sea ice age reveals continued scarcity of the oldest age classes. A new study highlights the uncertainty as to when a seasonally ice-free Arctic Ocean can be expected.

Overview of conditions

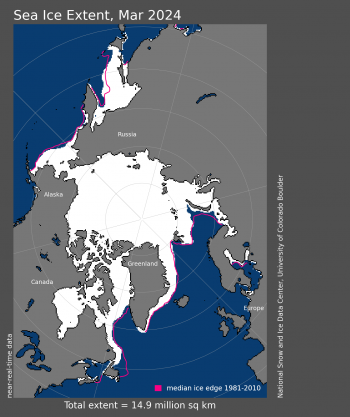
Map of Arctic sea ice extent for March 2024

Figure 1a. Arctic sea ice extent for March 2024 was 14.87 million square kilometers (5.74 million square miles). The magenta line shows the 1981 to 2010 average extent for that month. Sea Ice Index data. About the data

Credit: National Snow and Ice Data Center
High-resolution image

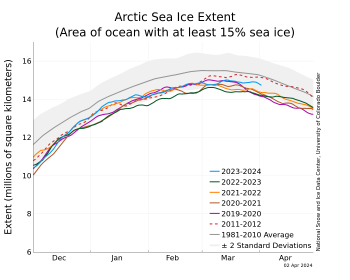
sea ice extent graph as of April 2, 2024 and other years

Figure 1b. The graph above shows Arctic sea ice extent as of April 2, 2024, along with daily ice extent data for four previous years and the record low year. 2023 to 2024 is shown in blue, 2022 to 2023 in green, 2021 to 2022 in orange, 2020 to 2021 in brown, 2019 to 2020 in magenta, and 2011 to 2012 in dashed brown. The 1981 to 2010 median is in dark gray. The gray areas around the median line show the interquartile and interdecile ranges of the data. Sea Ice Index data.

Credit: National Snow and Ice Data Center
High-resolution image

The average ice extent for March 2024 is 14.87 million square kilometers (5.74 million square miles), fifteenth lowest in the passive microwave satellite record (Figure 1a). As of the beginning of April 2024, Arctic sea ice extent had dropped by about 278,000 square kilometers (107,000 square miles) below the March 14 maximum (Figure 1b). Extent is notably low only in the Sea of Okhotsk, Barents Sea, Labrador Sea, and Davis Strait. Extent is near average in the Bering Sea, counter to the pattern of below average extent in this region characterizing many recent years.

Conditions in context

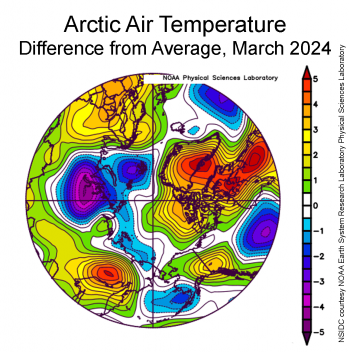
Air temperature over Arctic for March as difference from average

Figure 2a. This plot shows the departure from average air temperature in the Arctic at the 925 hPa level, in degrees Celsius, for March 2024. Yellows and reds indicate above average temperatures; blues and purples indicate below average temperatures.

Credit: NSIDC courtesy NOAA Earth System Research Laboratory Physical Sciences Laboratory
High-resolution image

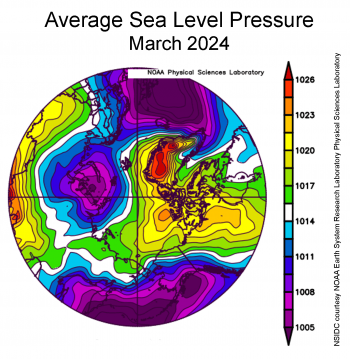
Average sea level pressure over Arctic for March 2024

Figure 2b. This plot shows average sea level pressure in the Arctic in millibars for March 2024. Yellows and reds indicate high air pressure; blues and purples indicate low pressure.

Credit: NSIDC courtesy NOAA Earth System Research Laboratory Physical Sciences Laboratory
High-resolution image

Air temperatures for March 2024 at the 925 hPa level (about 2,500 feet above the surface) were below average in the Barents Sea and along the Eurasian coast at 1 to 3 degrees Celsius (2 to 5 degrees Fahrenheit) contrasting with above average values of 2 to 5 degrees Celsius (4 to 9 degrees Fahrenheit) over the Canadian Arctic Archipelago, Greenland, and Baffin Bay (Figure 2a). This was attended by an unusual atmospheric circulation pattern at sea level (Figure 2b), with high pressure over the North American side of the Arctic and low pressure centered over the Kara Sea, leading to a strong intervening pressure gradient across the Fram Strait. This implies strong winds from the north directed down the strait, which likely favored a strong export of sea ice out of the Arctic Ocean. Whether this pattern continues to persist bears watching.

March 2024 compared to previous years

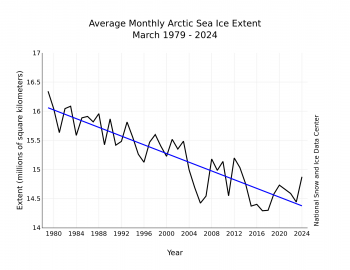
Graph showing downward linear trend of Arctic sea ice extent

Figure 3. Monthly March ice extent for 1979 to 2024 shows a decline of 2.4 percent per decade.

Credit: National Snow and Ice Data Center
High-resolution image

Including 2024, the downward linear trend in March sea ice extent is 37,000 square kilometers (14,000 square miles) per year, or 2.4 percent per decade relative to the 1981 to 2010 average. Since 1979, Arctic sea ice loss in March is 1.68 million square kilometers (649,000 square miles), which is roughly equivalent to the size of the state of Alaska or the country of Iran.

Update on sea ice age

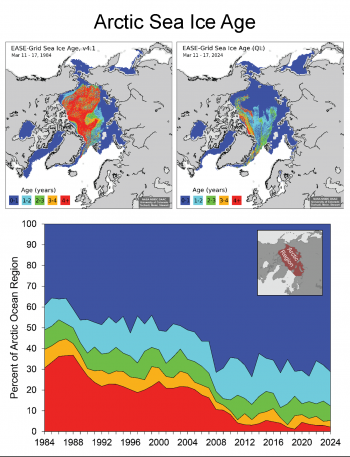
arctic sea ice age maps and graphs

Figure 4. The top maps show sea ice age for the week of March 11 to March 17 for (a) 1984 and (b) 2024. The bottom graph is a timeseries of the percent of the sea ice extent within the Arctic Ocean domain (inset map) for the same time period from 1984 through 2024; color categories are the same as in the maps. Data and images from NSIDC EASE-Grid Sea Ice Age, Version 4 (Tschudi et al., 2019a) and Quicklook Arctic Weekly EASE-Grid Sea Ice Age, Version 1.

Credit: Tschudi et al., 2019b
High-resolution image

With the passage of the seasonal maximum sea ice extent, it is appropriate to provide an updated assessment of sea ice age. Older, multiyear ice (ice that has survived at least one melt season) is generally thicker and more resistant to melting completely during the upcoming melt season than first-year ice, which represents ice growth of the previous autumn and winter. As seen in the figure, first-year ice dominates, as it has for the past several years. The extent of multiyear ice is lower than last year, mostly because of less second-year ice (one- to two-year-old ice that has survived two melt seasons), but it is within the ranges that have been seen since 2008. The oldest ice (greater than four-years old) has been at very low levels since 2012 and is slightly lower than last year.

Projections of an ice-free Arctic Ocean

Arctic sea ice free projections based on various scenarios and definitions

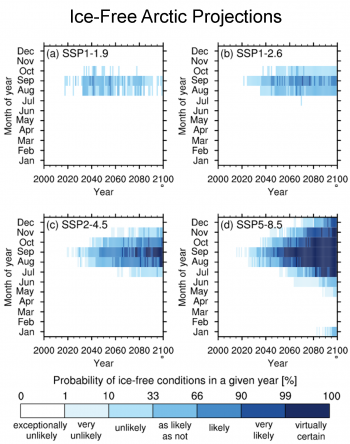
Figure 5. These charts show different probabilities of ice-free conditions in a given year and month for selected climate models and emission scenarios. The earliest ice-free conditions can be inferred when any probability of ice-free conditions exists, whereas consistently ice-free conditions start to exist when the probability in a given year reaches the likely category. Probabilities are provided for different greenhouse gas emission scenarios with SSP5-8.5 representing the most aggressive emission scenario and SSP1-2.6 the most modest. There are large differences in how likely an ice-free Arctic is to occur in the months of a given year depending on the degree of emissions and climate warming.

Credit: Jahn et al. 2024
High-resolution image

Colleagues Alexandra Jahn and Jen Kay, from the University of Colorado Boulder, and Marika Holland from the National Center for Atmospheric Research recently synthesized our current understanding of the timing and regional variability of an ice-free Arctic. In reviewing the literature, they find that a variety of different definitions of “ice-free” conditions have been used in the past, with impacts on their projected timing. For example, ice-free conditions based on sea ice area occur usually 10 years prior to ice-free conditions based on sea ice extent. Furthermore, they identify a need to clearly distinguish between projections of the first occurrence of ice-free conditions, based on the monthly average data, and consistently ice-free conditions, based on smoothed monthly averages, which occur about 10 years later than the first ice-free conditions. Using sea ice area, the earliest ice-free conditions in the September monthly average are likely to occur by 2050, but could occur as early as the late 2020s and 2030s under all greenhouse gas emission trajectories. Ice-free conditions for at least a day in September are expected approximately four years earlier on average, with the possibility of preceding the monthly average metric by over 10 years. Consistently ice-free September conditions are anticipated by mid-century (2035 to 2067) under all emission trajectories. However, future emission trajectories will determine how often and for how long the Arctic Ocean could be ice free in the future, with a possibility of ice-free conditions for nine months of the year by 2100 in some years under the high emission scenario. Future research is needed on the impact of different model selection and refinement methods on sea ice projections, as well as on the impacts of different lengths of ice-free conditions on the climate system and the ecosystem.

Antarctic note

Arctic sea ice extent in 2024 and other years

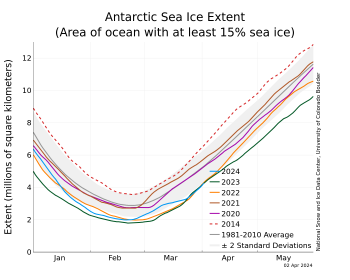
Figure 6. The graph above shows Antarctic sea ice extent as of April 2, 2024, along with daily ice extent data for four previous years and 2014, the record maximum year. 2024 is shown in blue, 2023 in green, 2022 in orange, 2021 in brown, 2020 in magenta, and 2014 in dashed brown. The 1981 to 2010 median is in dark gray. The gray areas around the median line show the interquartile and interdecile ranges of the data. Sea Ice Index data.
Credit: National Snow and Ice Data Center
High-resolution image

Antarctic sea ice extent expanded slowly in mid-March after reaching its summer minimum extent on February 21, lagging behind many of the years in the satellite record and ending the month tied with several other years for third lowest. Ice extent is particularly low in the eastern Ross Sea and western Amundsen Sea region, and in the eastern Bellingshausen Sea. Air temperatures have been near-average over much of the sea ice areas, but up to 3 degrees Celsius (5 degrees Fahrenheit) above average in the eastern Ross Sea and western Amundsen Sea region, and below average off the coast of Adelie Land by about the same amount.

Further reading

Jahn, A., M. M. Holland, and J. E. Kay. 2024. Projections of and ice-free Arctic Ocean. Nature Reviews Earth and Environment. doi:10.1038/s43017-023-00515-9.

Arctic sea ice reaches a below-average maximum

Arctic sea ice has likely reached its maximum extent for the year, at 15.01 million square kilometers (5.80 million square miles) on March 14. The 2024 maximum is the fourteenth lowest in the 46-year satellite record.

Overview of conditions

Map of arctic sea ice extent on March 14

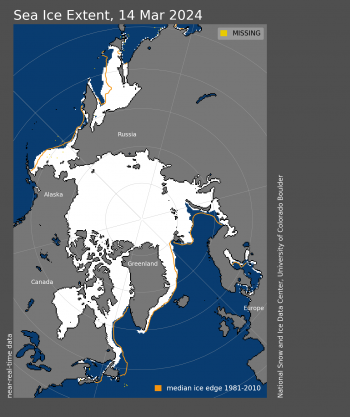
Figure 1. Arctic sea ice extent for March 14, 2024, was 15.01 million square kilometers (5.80 million square miles). The orange line shows the 1981 to 2010 average extent for that day. Sea Ice Index data. About the data

Credit: National Snow and Ice Data Center
High-resolution image

On March 14, 2024, Arctic sea ice likely reached its maximum extent for the year, at 15.01 million square kilometers (5.80 million square miles), the fourteenth lowest extent in the satellite record. This year’s maximum extent is 640,000 square kilometers (247,000 square miles) below the 1981 to 2010 average maximum of 15.65 million square kilometers (6.04 million square miles) and 600,000 square kilometers (232,000 square miles) above the lowest maximum of 14.41 million square kilometers (5.56 million square miles) set on March 7, 2017.

The date of the maximum this year, March 14, was two days later than the 1981 to 2010 average date of March 12.

Conditions in context

graph of arctic sea ice extent for March 14, 2024 and other years

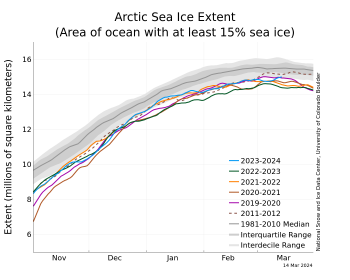
Figure 2. The graph above shows Arctic sea ice extent as of March 14, 2024, along with daily ice extent data for four previous years and the record low year. 2023 to 2024 is shown in blue, 2022 to 2023 in green, 2021 to 2022 in orange, 2020 to 2021 in brown, 2019 to 2020 in magenta, and 2011 to 2012 in dashed brown. The 1981 to 2010 median is in dark gray. The gray areas around the median line show the interquartile and interdecile ranges of the data. Sea Ice Index data.

Credit: National Snow and Ice Data Center
High-resolution image

The ice growth season ended with near average sea ice extent in Baffin Bay, average extent in the Bering Sea, above average in the northern portion of the Sea of Okhotsk and Greenland Sea, and below average in the Barents Sea. Extent was well below average in the Gulf of St. Lawrence and the southern portion of the Sea of Okhotsk.

Since the maximum on March 14, extent has dropped about 160,000 square kilometers (62,000 square miles), with losses in the northern portion of the Sea of Okhotsk and the Bering Sea. These losses have been offset by gains in the Barents Sea and Gulf of St. Lawrence.

The downward linear trend in Arctic sea ice maximum extent from1979 to 2024 is 39,800 square kilometers (15,400 square miles) per year, or 2.5 percent per decade relative to the 1981 to 2010 average. Based on the linear trend values, the maximum extent has declined 1.79 million square kilometers (691,000 square miles) since 1979. This is equivalent to the size of Alaska or five times the size of Germany.

Table 1. Ten lowest maximum Arctic sea ice extents (satellite record, 1979 to present)

Rank Year In millions of square kilometers In millions of square miles Date
1 2017 14.41 5.56 March 7
2 2018 14.47 5.59 March 17
3 2016
2015
14.51
14.52
5.60
5.61
March 23
February 25
5 2023 14.62 5.64 March 6
6 2011
2006
14.67
14.68
5.66
5.67
March 9
March 12
8 2007
2021
14.77
14.78
5.70
5.71
March 12
March 12
10 2019 14.82 5.72 March 13

For the Arctic maximum, which typically occurs in March, the uncertainty range is ~34,000 square kilometers (13,000 square miles), meaning that extents within this range must be considered effectively equal.

Leaping toward spring

During February, Arctic sea ice extent increased along the lower 10 percent interdecile value, with the average monthly extent tied for fifteenth lowest in the satellite record. Temperatures were above average over the central Arctic, but still well below freezing. Antarctic sea ice extent reached its seasonal minimum, tied for the second lowest extent in the satellite record.

Overview of conditions

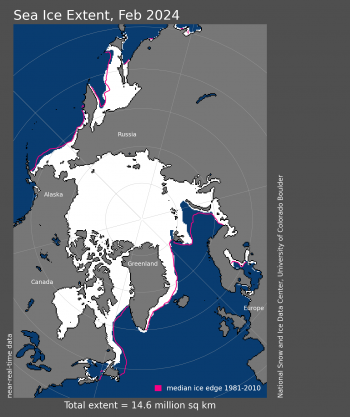
Figure 1a. Arctic sea ice extent for February 2024 was 14.61 million square kilometers (5.64 million square miles). The magenta line shows the 1981 to 2010 average extent for that month. Sea Ice Index data. About the data||Credit: National Snow and Ice Data Center|High-resolution image

Figure 1a. Arctic sea ice extent for February 2024 was 14.61 million square kilometers (5.64 million square miles). The magenta line shows the 1981 to 2010 average extent for that month. Sea Ice Index data. About the data

Credit: National Snow and Ice Data Center
High-resolution image

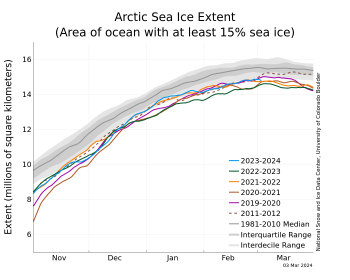
Figure 1b. The graph above shows Arctic sea ice extent as of March 3, 2024, along with daily ice extent data for four previous years and the record low year. 2023 to 2024 is shown in blue, 2022 to 2023 in green, 2021 to 2022 in orange, 2020 to 2021 in brown, 2019 to 2020 in magenta, and 2012 to 2013 in dashed brown. The 1981 to 2010 median is in dark gray. The gray areas around the median line show the interquartile and interdecile ranges of the data. Sea Ice Index data.||Credit: National Snow and Ice Data Center|High-resolution image

Figure 1b. The graph above shows Arctic sea ice extent as of March 3, 2024, along with daily ice extent data for four previous years and the record low year. 2023 to 2024 is shown in blue, 2022 to 2023 in green, 2021 to 2022 in orange, 2020 to 2021 in brown, 2019 to 2020 in magenta, and 2012 to 2013 in dashed brown. The 1981 to 2010 median is in dark gray. The gray areas around the median line show the interquartile and interdecile ranges of the data. Sea Ice Index data.

Credit: National Snow and Ice Data Center
High-resolution image

Arctic sea ice extent in February tracked near the lowest decile of 10 percent for much of the month. The February 2024 extent of 14.61 million square kilometers (5.64 million square miles) (Figure 1a) was 690,000 square kilometers (266,000 square miles) below the 1981 to 2010 average extent of 15.30 million square kilometers (5.91 million square miles) and 640,000 square kilometers (247,000 square miles) above the lowest February extent observed in 2018. It was tied with 2022 as the fifteenth lowest over the 46-year satellite data record (Figure 1b). Ice growth occurred primarily within the Sea of Okhotsk, the Bering Sea, and to a lesser extent in the Barents Sea. Overall, the ice cover in February was more expansive than average in the Sea of Okhotsk and below average in the Barents, Bering, and Labrador Seas. Elsewhere, the ice edge was near average for this time of year.

Conditions in context

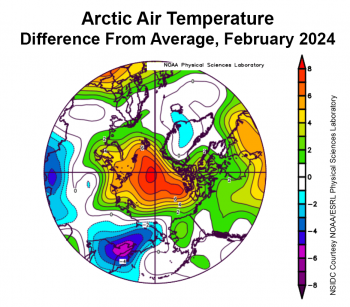
Figure 2a. This plot shows the departure from average air temperature in the Arctic at the 925 hPa level, in degrees Celsius, for February 2024. Yellows and reds indicate above average temperatures; blues and purples indicate below average temperatures.||Credit: NSIDC courtesy NOAA Earth System Research Laboratory Physical Sciences Laboratory| High-resolution image

Figure 2a. This plot shows the departure from average air temperature in the Arctic at the 925 hPa level, in degrees Celsius, for February 2024. Yellows and reds indicate above average temperatures; blues and purples indicate below average temperatures.

Credit: NSIDC courtesy NOAA Earth System Research Laboratory Physical Sciences Laboratory
High-resolution image

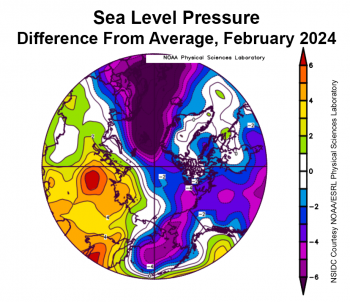
Figure 2b. This plot shows the departure from average sea level pressure in the Arctic in millibars for February 2024. Yellows and reds indicate above average air pressures; blues and purples indicate below average air pressures.||Credit: NSIDC courtesy NOAA Earth System Research Laboratory Physical Sciences Laboratory| High-resolution image

Figure 2b. This plot shows the departure from average sea level pressure in the Arctic in millibars for February 2024. Yellows and reds indicate above average air pressures; blues and purples indicate below average air pressures.

Credit: NSIDC courtesy NOAA Earth System Research Laboratory Physical Sciences Laboratory
High-resolution image

While temperatures are usually well below freezing over the Arctic Ocean in February, this February they were not as low as is typical for this time of year. Over the central Arctic Ocean, air temperatures at the 925 millibar level (about 2,500 feet above sea level) were up to 10 degrees Celsius (18 degrees Fahrenheit) above average (Figure 2a). Above-average temperatures also extended over Alaska and the Canadian Arctic while below-average temperatures prevailed over much of Siberia.

The unusual warmth near the North Pole stemmed from strong high pressure over Siberia extending into the Laptev Sea (Figure 2b). This high pressure combined with exceptionally below-average sea level pressure over Bering Sea and near Iceland led to a strong pressure gradient that forced relatively warm air over western Eurasia to flow into the central Arctic Ocean and cold Arctic air to flow out into the Bering Sea.

February 2024 compared to previous years

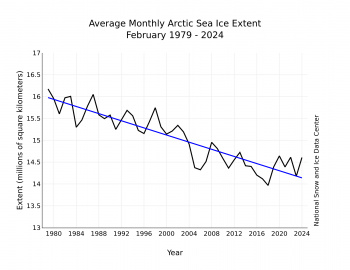
Figure 3. Monthly December ice extent for 1979 to 2024 shows a decline of 2.7 percent per decade. ||Credit: National Snow and Ice Data Center| High-resolution image

Figure 3. Monthly February ice extent for 1979 to 2024 shows a decline of 2.7 percent per decade.

Credit: National Snow and Ice Data Center
High-resolution image

The downward linear trend in Arctic sea ice extent for February over the 46-year satellite record is 41,000 square kilometers (16,000 square miles) per year, or 2.7 percent per decade relative to the 1981 to 2010 average (Figure 3). Based on the linear trend, February has lost 1.84 million square kilometers (710,000 square miles) of ice since 1979. This is equivalent to the size of Alaska.

Less ice means more autumn clouds

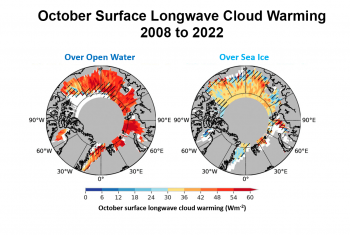
Figure 4. These plots show average October surface longwave cloud warming for 2008 to 2020 estimated from spaceborne lidar over open water (left) and over sea ice (right). Areas of mixed ocean and sea are indicated in white. Areas under the black lines indicate regions with fewer than 5 years of data for the given surface type. ||Credit: Adapted from Figure 3 of Arouf et al., 2023 | High-resolution image

Figure 4. These plots show average October surface longwave cloud warming for 2008 to 2020 estimated from spaceborne lidar over open water (left) and over sea ice (right). Areas of mixed ocean and sea are indicated in white. Areas under the black lines indicate regions with fewer than 5 years of data for the given surface type.

Credit: Adapted from Figure 3 of Arouf et al., 2023
High-resolution image

As Arctic sea ice declines during summer, the increased absorption of solar energy by the open ocean delays autumn freeze up. Satellite observations reveal that with less autumn sea ice, increased air-sea coupling has led to more low-level clouds over open water areas. Quantifying the radiative effect of this increased cloud cover is challenging. A recent study by colleagues at the University of Colorado Boulder addressed this issue using lidar observations at high resolution from the NASA Cloud-Aerosol Lidar and Infrared Pathfinder Satellite Observations (CALIPSO) satellite. They found large warming at the surface induced by clouds occurs much more frequently over open water than over sea ice during autumn months (Figure 4). Thus, while the ocean heat effect on delayed sea ice growth is well known, these results provide quantitative evidence that Arctic clouds can also delay autumn sea ice formation.

Antarctic summer comes to an end

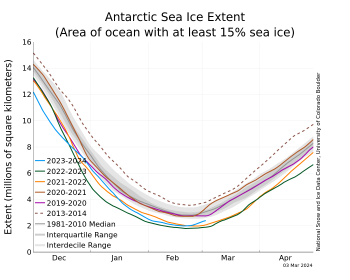
Figure 5a. The graph above shows Antarctic sea ice extent as of March 3, 2024, along with daily ice extent data for four previous years and the record high year. 2023 to 2024 is shown in blue, 2022 to 2023 in green, 2021 to 2022 in orange, 2020 to 2021 in brown, 2019 to 2020 in magenta, and 2014 to 2015 in dashed brown. The 1981 to 2010 median is in dark gray. The gray areas around the median line show the interquartile and interdecile ranges of the data. Sea Ice Index data.||Credit: National Snow and Ice Data Center|High-resolution image

Figure 5a. The graph above shows Antarctic sea ice extent as of March 3, 2024, along with daily ice extent data for four previous years and the record high year. 2023 to 2024 is shown in blue, 2022 to 2023 in green, 2021 to 2022 in orange, 2020 to 2021 in brown, 2019 to 2020 in magenta, and 2014 to 2015 in dashed brown. The 1981 to 2010 median is in dark gray. The gray areas around the median line show the interquartile and interdecile ranges of the data. Sea Ice Index data.

Credit: National Snow and Ice Data Center
High-resolution image

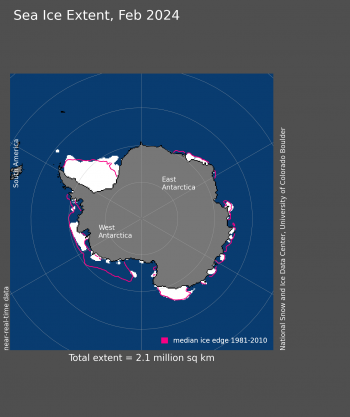
Figure 5b. Antarctic sea ice extent for February 2024 was 2.14 million square kilometers (826,000 square miles). The magenta line shows the 1981 to 2010 average extent for that month. Sea Ice Index data. About the data||Credit: National Snow and Ice Data Center|High-resolution image

Figure 5b. Antarctic sea ice extent for February 2024 was 2.14 million square kilometers (826,000 square miles). The magenta line shows the 1981 to 2010 average extent for that month. Sea Ice Index data. About the data

Credit: National Snow and Ice Data Center
High-resolution image

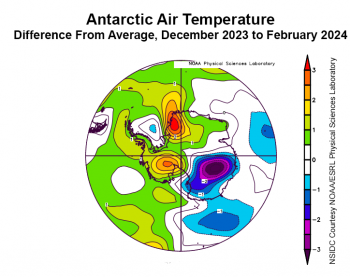
Figure 5c. This plot shows the departure from average air temperature in the Antarctic at the 925 hPa level, in degrees Celsius, for December 2023 through February 2024. Yellows and reds indicate above average temperatures; blues and purples indicate below average temperatures.||Credit: NSIDC courtesy NOAA Earth System Research Laboratory Physical Sciences Laboratory| High-resolution image

Figure 5c. This plot shows the departure from average air temperature in the Antarctic at the 925 hPa level, in degrees Celsius, for December 2023 through February 2024. Yellows and reds indicate above average temperatures; blues and purples indicate below average temperatures.

Credit: NSIDC courtesy NOAA Earth System Research Laboratory Physical Sciences Laboratory
High-resolution image

Antarctic sea ice extent appears to have reached its seasonal minimum, ending up as tied with 2022 for second lowest in the satellite data record, just above 2023. Thus, the last three years are the three lowest in the 46-year record and the first three years that reached an extent below 2.0 million square kilometers (772,000 square miles). Having three such years in a row is unusual. Extent is especially low in the Ross, Amundsen, and Bellingshausen Seas, whereas over the Weddell Sea and along the East Antarctic coast the ice cover is at average levels (Figure 5b).

This pattern of above-average ice extent in the Weddell Sea coupled with below-average extent in the Ross, Amundsen, and Bellingshausen Seas is broadly consistent with the expected response to atmospheric conditions during an El Niño. However, the atmospheric circulation pattern this year was atypical of El Niño conditions for most of the season. During a typical El Niño, the Amundsen Sea low pressure weakens, allowing for increased advection of warm air and warm sea surface temperatures from lower latitudes to the Ross–Amundsen Seas, while winds from the south to the east of the anticyclone tend to advect cold air to the Weddell Sea (Figure 5c). However, this past austral summer, there was no weakening of the Amundsen Sea Low and average temperatures prevailed over the Weddell Sea. Below average sea level pressure dominated the continent for the first half of the winter, but this changed to a pattern that favored warm winds from the north over the eastern Weddell Sea and the eastern Ross Sea regions. Early melting and ice loss along the eastern side of the Peninsula stopped abruptly in mid-January.

Further reading

Arouf, A., H. Chepfer, J. E. Kay, T. S. L’Ecuyer, and J. Lac. 2024. Surface cloud warming increases as late fall Arctic sea ice cover decreasesGeophysical Research Letters, 51, e2023GL105805, doi:10.1029/2023GL105805.

Kay, J. E. and A. Gettelman. 2009. Cloud influence on and response to seasonal Arctic sea ice loss. Journal of Geophysical Research, 114, D18204, doi:10.1029/2009JD011773.

Antarctic sea ice extent hits a third low in a row

On February 20, Antarctic sea ice likely reached its minimum extent of 1.99 million square kilometers (768,000 square miles), tying for second lowest extent in the 1979 to 2024 satellite record. This is the third consecutive year that Antarctic sea ice has reached a minimum below 2.0 million square miles (772,000 square miles).

Please note that this is a preliminary announcement. Changing winds or late-season melt could still reduce the Antarctic ice extent. NSIDC scientists will release a full analysis of the Antarctic and Arctic February conditions in early March.

Overview of conditions

Antarctic sea ice extent on February 20, 2024

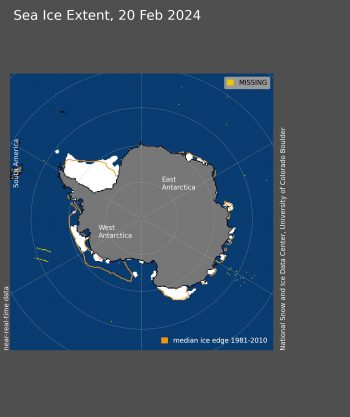
Figure 1. Antarctic sea ice extent for February 20, 2024, was 1.99 million square kilometers (768,000 square miles). The orange line shows the 1981 to 2010 average extent for that day. Sea Ice Index data. About the data

Credit: National Snow and Ice Data Center
High-resolution image

On February 20, 2024, sea ice surrounding Antarctica reached an annual minimum extent of 1.99 million square kilometers (768,000 square miles), tying for second lowest minimum with 2022 in the 46-year satellite record. This year’s minimum is 850,000 square kilometers (328,000 square miles) below the 1981 to 2010 average Antarctic minimum extent of 2.84 millions square kilometers (1.10 million square miles). It is also 200,000 square kilometers (77,000 square miles) above the previous record low set on February 21, 2023. Nearly all of the remaining sea ice is in the Weddell Sea, Amundsen Sea, and the Southern Ocean off of Victoria Land, with isolated patches along the coasts of Enderby Land and Wilkes Land.

The Antarctic minimum extent was reached four days earlier than the 1981 to 2010 median date of February 24. The interquartile range for the date of the Antarctic minimum is February 20 to February 27.

Conditions in context

Antarctic sea ice extent on February 20, 2024, compared with other years

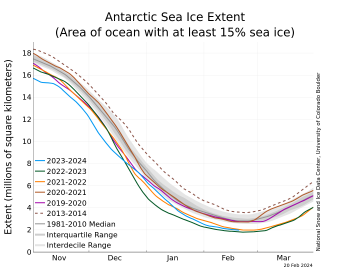
Figure 2a. The graph above shows Antarctic sea ice extent as of February 20, 2024, along with daily ice extent data for four previous years and the record high year. 2023 to 2024 is shown in blue, 2022 to 2023 in green, 2021 to 2022 in orange, 2020 to 2021 in brown, 2019 to 2020 in magenta, and 2013 to 2014 in dashed brown. The 1981 to 2010 median is in dark gray. The gray areas around the median line show the interquartile and interdecile ranges of the data. Sea Ice Index data.

Credit: National Snow and Ice Data Center
High-resolution image

trend of antarctic sea ice loss from 1979 to 2024

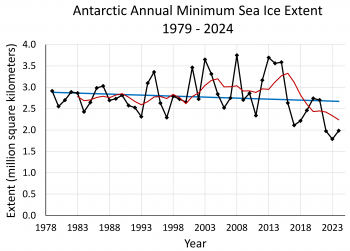
Figure 2b. This graph shows Antarctic annual sea ice minimum extent, depicted as black diamonds, from 1979 to 2024, based on a 5-day running average of daily extent. The linear trend line is in blue with a 1.7 percent per decade downward trend, which is not statistically significant. A five-year running average is shown in red.

Credit: W. Meier, NSIDC
High-resolution image

This year marks the third consecutive minimum Antarctic sea ice extent below 2.0 million square kilometers (772,000 square miles) (Figure 2a). The three minimums set in 2022, 2023, and 2024 are the three lowest in the 46-year record. Five of the lowest Antarctic sea ice extents have occurred since 2017 (see table below). With this series of low years, the trend in Antarctic minimum extent is negative and it is natural to speculate if this decline is significant. However, the period since 2017 is still too short to assess if these recent low extents indicate a clear decreasing signal; the magnitude of the trend is still small relative to the year-to-year variations in the ice cover. Note in this respect that 2013 through 2015 saw near record high minimum extents.

Overall, the downward trend in the annual Antarctic sea ice minimum extent computed over the complete satellite record is 4,700 square kilometers (1,800 square miles) per year, or 1.7 percent per decade relative to the 1981 to 2010 average. This trend is not statistically significant (Figure 2b). This is in stark contrast to the Arctic where the trend in the sea ice minimum is larger in magnitude and has strong statistical significance.

Five lowest minimum Antarctic sea ice extents (satellite record, 1979 to present)

Table 1. Five lowest minimum Antarctic sea ice extents (satellite record, 1979 to present)
RANK YEAR MINIMUM ICE EXTENT DATE
IN MILLIONS OF SQUARE KILOMETERS IN SQUARE MILES
1 2023 1.79 691,000 Feb. 21
2 2022
2024
1.98
1.99
764,000
768,000
Feb. 25
Feb. 20
4 2017 2.11 815,000 Mar. 3
5 2018 2.22 857,000 Feb. 21

Values within 40,000 square kilometers (15,000 square miles) are considered tied. 

For more information

NASA visualization of 2024 Antarctic sea ice minimum extent
NASA video of 2024 Antarctic sea ice minimum extent

Nothing Swift about January’s Arctic sea ice

Arctic sea ice growth was slower than average through most of the month, but with extent slightly declining towards the end of the month. Antarctic sea ice extent returned to near-record daily lows after a brief excursion out of the lowest five years.

Overview of conditions

Figure 1. Arctic sea ice extent for XXXX 20XX was X.XX million square kilometers (X.XX million square miles). The magenta line shows the 1981 to 2010 average extent for that month. Sea Ice Index data. About the data||Credit: National Snow and Ice Data Center|High-resolution image

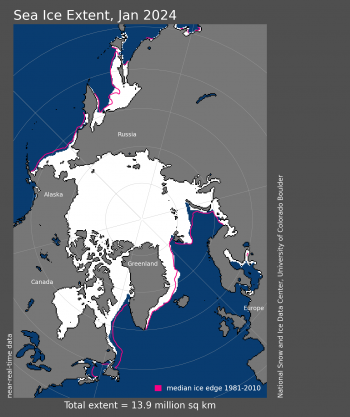
Figure 1a. Arctic sea ice extent for January 2024 was 13.92 million square kilometers (5.37 million square miles). The magenta line shows the 1981 to 2010 average extent for that month. Sea Ice Index data. About the data

Credit: National Snow and Ice Data Center
High-resolution image

Figure 2. The graph above shows Arctic sea ice extent as of XXXXX XX, 20XX, along with daily ice extent data for four previous years and the record low year. 2022 to 2023 is shown in blue, 2021 to 2022 in green, 2020 to 2021 in orange, 2019 to 2020 in brown, 2018 to 2019 in magenta, and 2011 to 2012 in dashed brown. The 1981 to 2010 median is in dark gray. The gray areas around the median line show the interquartile and interdecile ranges of the data. Sea Ice Index data.||Credit: National Snow and Ice Data Center|High-resolution image

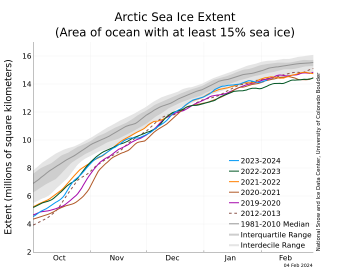
Figure 1b. The graph above shows Arctic sea ice extent as of February 4, 2024, along with daily ice extent data for four previous years and the record low year. 2023 to 2024 is shown in blue, 2022 to 2023 in green, 2021 to 2022 in orange, 2020 to 2021 in brown, 2019 to 2020 in magenta, and 2012 to 2013 in dashed brown. The 1981 to 2010 median is in dark gray. The gray areas around the median line show the interquartile and interdecile ranges of the data. Sea Ice Index data.

Credit: National Snow and Ice Data Center
High-resolution image

The year 2024 began with an average January Arctic sea ice extent of 13.92 million square kilometers (5.37 million square miles), the twentieth lowest in the 45-year satellite record (Figure 1a). During the month, extent increased by 1.09 million square kilometers (421,000 square miles), which was slower than the 1981 to 2010 average increase of 1.33 million square kilometers (514,000 square miles) (Figure 1b). Extent actually declined for a few days at the end of the month. During the growth season, such short-term declines are not unusual at this time of year and are caused by weather systems that temporarily halt ice growth or push the ice northwards.

Extent was low in the Barents Sea with open water extending offshore of the northwest tip of Novaya Zemlya, as well as in the Gulf of St. Lawrence. Elsewhere, extent was near average.

Conditions in context

Arctic air temperature for January 2024 as difference from long-term average

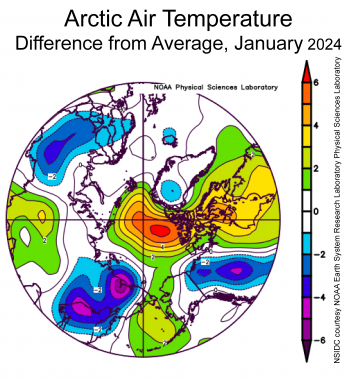
Figure 2a. This plot shows the departure from average air temperature in the Arctic at the 925 hPa level, in degrees Celsius, for January 2024. Yellows and reds indicate above average temperatures; blues and purples indicate below average temperatures.

Credit: NSIDC courtesy NOAA Earth System Research Laboratory Physical Sciences Laboratory
High-resolution image

Average sea level pressure for Arctic for Jan 2024

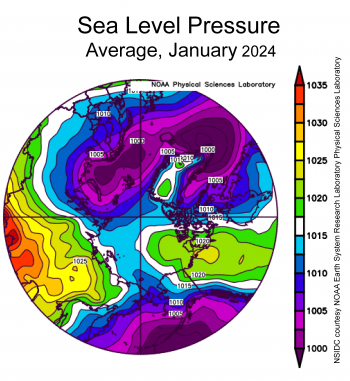
Figure 2b. This plot shows average sea level pressure in the Arctic in millibars for January 2024. Yellows and reds indicate high air pressure; blues and purples indicate low pressure.

Credit: NSIDC courtesy NOAA Earth System Research Laboratory Physical Sciences Laboratory
High-resolution image

Overall, it was relatively warm over the Arctic Ocean during January (Figure 2a). Air temperatures at the 925 millibar level (about 2,500 feet above sea level) were up to 6 degrees Celsius (11 degrees Fahrenheit) above average over the central Arctic Ocean and the Canadian Archipelago. Air temperatures in the Bering Sea were 2 to 3 degrees Celsius (4 to 5 degrees Fahrenheit) above average. It was slightly cooler than average over the East Siberian Sea.

The sea level pressure pattern was characterized by low pressure over the Barents and Bering Seas and a saddle of relatively high pressure extending from Eastern Siberia across the Arctic Ocean into northwestern Canada (Figure 2b). Overall, pressure gradients were not particularly strong, indicating slack winds.

January 2024 compared to previous years

linear decline of sea ice in Arctic 1979 to 2024

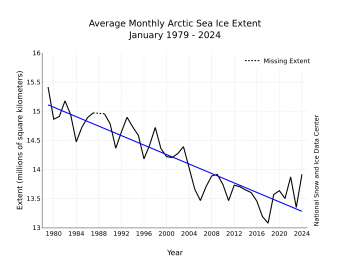
Figure 3. Monthly January ice extent for 1979 to 2024 shows a decline of 2.8 percent per decade.

Credit: National Snow and Ice Data Center
High-resolution image

The downward linear trend in Arctic sea ice extent for January over the 45-year satellite record is 41,000 square kilometers (16,000 square miles) per year, or 2.8 percent per decade relative to the 1981 to 2010 average (Figure 3). Based on the linear trend, January has lost 1.73 million square kilometers (668,000 square miles) of ice since 1979. This is equivalent to the 2.5 times the size of state of Alaska or the country of Iran. However, the relatively high ice extent for January 2024 is notable.

Arctic sea ice thickness update

map of sea ice thickness as of December 15, 2023

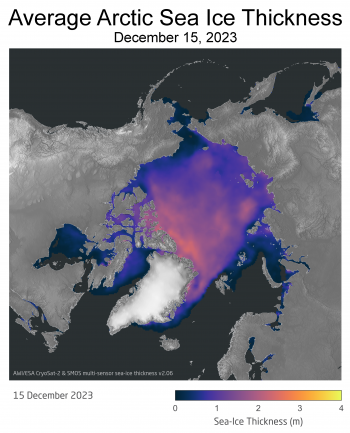
Figure 4a. This map of the Arctic shows average sea ice thickness in meters on December 15, 2023. Warmer colors indicate thicker ice; cooler colors indicate thinner ice. The European Space Agency’s (ESA’s) Soil Moisture Ocean Salinity (SMOS) and CryoSat-2 satellites help determine average sea ice thickness.

Credit: Images from ESA SMOS & CryoSat-2 Sea Ice Data Product Processing and Dissemination Service, provided by Stefan Hendricks, Alfred Wegener Institute
High-resolution image

map of Arctic sea ice thickness as of December 15, 2023

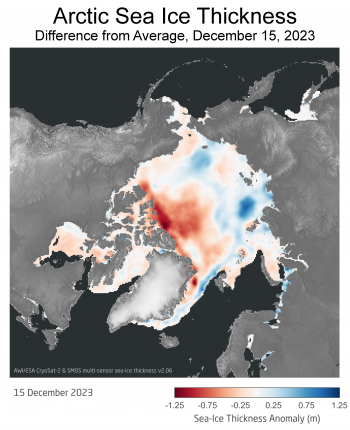
Figure 4b. This map of the Arctic shows sea ice thickness as a difference from the 2011 to 2023 average on December 15, 2023. The European Space Agency’s (ESA’s) Soil Moisture Ocean Salinity (SMOS) and CryoSat-2 satellites help determine average sea ice thickness.

Credit: Images from ESA SMOS & CryoSat-2 Sea Ice Data Product Processing and Dissemination Service, provided by Stefan Hendricks, Alfred Wegener Institute
High-resolution image

Sea ice thickness can be estimated from satellite-borne altimeters. Currently, two altimeters are providing thickness estimates over the Arctic Ocean. One is the NASA Ice, Cloud, Land elevation Satellite 2 (ICESat-2), a laser altimeter; ICESat-2 data products are archived at the NASA Snow and Ice Distributed Active Archive Center (DAAC) at NSIDC. The other is the European Space Agency’s (ESA’s) CryoSat-2, a radar altimeter. In combination with estimates for thin regions from the ESA Soil Moisture Ocean Salinity (SMOS) satellite, CryoSat-2 provides daily updated weekly average thickness (Figure 4a).

As Arctic sea ice extent starts approaching its maximum, ice thickness can provide an indication of the state of the ice cover. The most recent (mid-December 2023) thickness analysis from the ESA SMOS & CryoSat-2 Sea Ice Data Product Processing and Dissemination Service at Alfred Wegener Institute indicates up to 1.25 meters (4.1 feet) thicker ice than the 2011to 2023 average over the Siberian side of the Arctic, with ice on the North American side up to 1.25 meters (4.1 feet) thinner than average (Figure 4b). This suggests that there may be a slower melt out of ice in the Siberian coastal seas, but perhaps faster in the Beaufort Sea.

Antarctic sea ice

Sea ice extent for Antarctica for January 2024

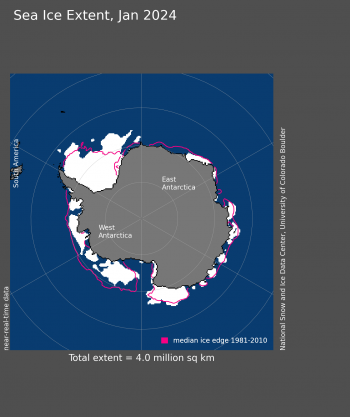
Figure 5. Antarctic sea ice extent for January 2024 was 3.96 million square kilometers (1.53 million square miles). The magenta line shows the 1981 to 2010 average extent for that month. Sea Ice Index data. About the data

Credit: National Snow and Ice Data Center
High-resolution image

Sea ice extent in the Antarctic started the year at 6.37 million square kilometers (2.46 million square miles), or sixth lowest in the satellite record for January 1. As the melt season continued in the Southern Hemisphere, a rapid decline in daily extent led to it ending the month at 2.58 million square kilometers (996,000 square miles), tying for second lowest with 2017 for that date. Antarctic sea ice extent for January overall averaged 3.96 million square kilometers (1.53 million square miles), tying for fourth lowest extent with 2022. Extent was particularly low in the Ross, Bellingshausen, and Amundsen Seas, but has been near average in the Weddell Sea. Little ice remains in the East Antarctic sectors.

A team from the University of Colorado and the Instituto Argentino Antartico are en route to the Antarctic Peninsula and the Larsen B embayment. This region’s glaciers have become more active again after an area of multiyear fast ice broke away in 2022.


Fast December expansion

The end of 2023 had above average sea ice growth, bringing the daily extent within the interdecile range, the range spanning 90 percent of past sea ice extents for the date. Rapid expansion of ice in the Chukchi and Bering Seas and across Hudson Bay was responsible. The Antarctic summer sea ice decline slowed, moving the daily ice extent values above previous record low levels. For the year as a whole, however, low Antarctic sea ice was the dominant feature.

Overview of conditions

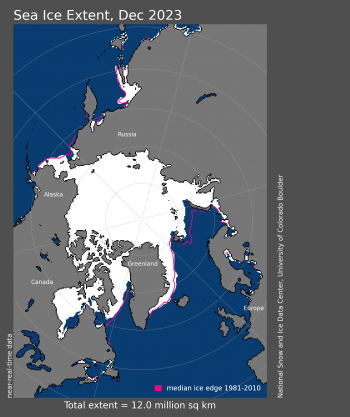
Figure 1a. Arctic sea ice extent for December 2023 was 12.00 million square kilometers (4.63 million square miles). The magenta line shows the 1981 to 2010 average extent for that month. Sea Ice Index data. About the data||Credit: National Snow and Ice Data Center|High-resolution image

Figure 1a. Arctic sea ice extent for December 2023 was 12.00 million square kilometers (4.63 million square miles). The magenta line shows the 1981 to 2010 average extent for that month. Sea Ice Index data. About the data

Credit: National Snow and Ice Data Center
High-resolution image

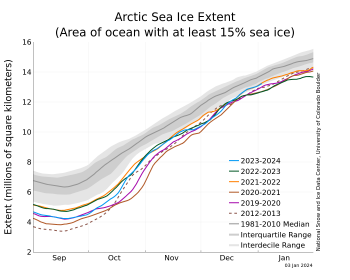
Figure 1b. The graph above shows Arctic sea ice extent as of January 3, 2024, along with daily ice extent data for four previous years and the record low year. 2023 to 2024 is shown in blue, 2022 to 2023 in green, 2021 to 2022 in orange, 2020 to 2021 in brown, 2019 to 2020 in magenta, and 2012 to 2013 in dashed brown. The 1981 to 2010 median is in dark gray. The gray areas around the median line show the interquartile and interdecile ranges of the data. Sea Ice Index data.||Credit: National Snow and Ice Data Center|High-resolution image

Figure 1b. The graph above shows Arctic sea ice extent as of January 3, 2024, along with daily ice extent data for four previous years and the record low year. 2023 to 2024 is shown in blue, 2022 to 2023 in green, 2021 to 2022 in orange, 2020 to 2021 in brown, 2019 to 2020 in magenta, and 2012 to 2013 in dashed brown. The 1981 to 2010 median is in dark gray. The gray areas around the median line show the interquartile and interdecile ranges of the data. Sea Ice Index data.

Credit: National Snow and Ice Data Center
High-resolution image

Average Arctic sea ice extent for December 2023 was 12.00 million square kilometers (4.63 million square miles), ninth lowest in the 45-year satellite record (Figure 1a). Sea ice extent increased by an average of 87,400 square kilometers (33,700 thousand square miles) per day, markedly faster than the 1981 to 2010 average of 64,100 square kilometers (24,700 square miles) per day (Figure 1b). After a delayed start to the freeze-up in Hudson Bay, sea ice formed quickly from west to east across the bay, leaving only a small area of open ocean near the Belcher Islands at month’s end. In the northern Atlantic, sea ice extent remained below average extent, as has been typical for the past decade.

For December overall, 2023 had the third highest monthly gain in the 45-year record at 2.71 million square kilometers (1.05 square miles), behind 2006 at 2.85 million square kilometers (1.10 million square miles) and 2016 at 2.78 million square kilometers (1.07 million square miles).

Conditions in context

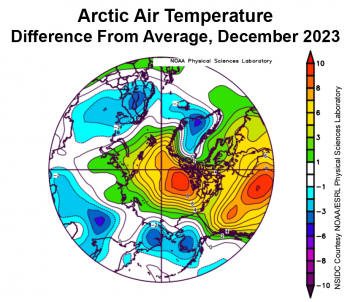
Figure 2a. This plot shows the departure from average air temperature in the Arctic at the 925 hPa level, in degrees Celsius, for December 2023. Yellows and reds indicate above average temperatures; blues and purples indicate below average temperatures.||Credit: NSIDC courtesy NOAA Earth System Research Laboratory Physical Sciences Laboratory| High-resolution image

Figure 2a. This plot shows the departure from average air temperature in the Arctic at the 925 hPa level, in degrees Celsius, for December 2023. Yellows and reds indicate above average temperatures; blues and purples indicate below average temperatures.

Credit: NSIDC courtesy NOAA Earth System Research Laboratory Physical Sciences Laboratory
High-resolution image

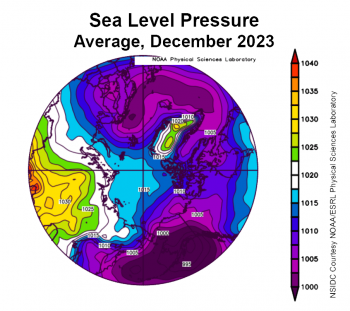
Figure 2b. This plot shows average sea level pressure in the Arctic in millibars for December 2023. Yellows and reds indicate above average air pressures; blues and purples indicate below average air pressures.||Credit: NSIDC courtesy NOAA Earth System Research Laboratory Physical Sciences Laboratory| High-resolution image

Figure 2b. This plot shows average sea level pressure in the Arctic in millibars for December 2023. Yellows and reds indicate above average air pressures; blues and purples indicate below average air pressures.

Credit: NSIDC courtesy NOAA Earth System Research Laboratory Physical Sciences Laboratory
High-resolution image

Warm conditions prevailed over the central Arctic Ocean and Beaufort Sea regions, as well as over Hudson Bay and much of northern Canada, with air temperatures at the 925 millibar level (around 2,500 feet above sea level) 8 to 9 degrees Celsius (14 to 16 degrees Fahrenheit) above the 1991 to 2020 average (Figure 2a). Elsewhere, relatively cool conditions prevailed, with air temperatures 2 to 4 degrees Celsius (4 to 7 degrees Fahrenheit) below average in southwestern Alaska, easternmost Russia, Scandinavia, and southeast Greenland. Cool conditions in the Bering and southern Chukchi Seas explain the rapid ice growth there. By contrast, the warm conditions over Hudson Bay, continuing since November, explain its delayed start of ice formation there.

The atmospheric circulation pattern for December was marked by low sea level pressure over the Gulf of Alaska and northern Europe and high sea level pressure over central Russia (Figure 2b). This pattern led to cold Arctic air flowing across the Chukchi Sea and into the Bering Sea as well as advection of relatively warm air across Canada into the Beaufort Sea.

December 2023 compared to previous years

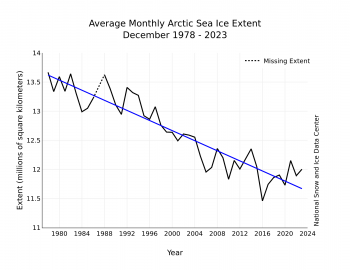
Figure 3. Monthly December ice extent for 1979 to 2023 shows a decline of 3.4 percent per decade.||Credit: National Snow and Ice Data Center| High-resolution image

Figure 3. Monthly December ice extent for 1979 to 2023 shows a decline of 3.4 percent per decade.

Credit: National Snow and Ice Data Center
High-resolution image

The downward linear trend in Arctic sea ice extent for December over the 45-year satellite record is 43,400 square kilometers (16,800 square miles) per year, or 3.4 percent per decade relative to the 1981 to 2010 average (Figure 3). Based on the linear trend, December has lost 1.97 million square kilometers (761,000 million square miles) of ice since 1979. This is equivalent to three times the size of Texas.

Fast growth of ice cover over Hudson Bay

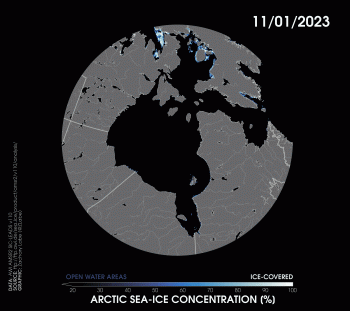
Figure 4. This animation shows the rapid expansion of sea ice cover in November to December 2023 for Hudson Bay. ||Credit: Zachary Labe, Princeton University| High-resolution image

Figure 4. This animation shows the rapid expansion of sea ice cover in November to December 2023 for Hudson Bay (click to animate).

Credit: Zachary Labe, Princeton University
High-resolution image

As noted above, sea ice formation in Hudson Bay was unusually late, but the ice cover expanded quickly from west to east in mid-December. This is approximately 10 to 20 days later than usual, a result of warm water conditions over the bay extending into late fall. As of early January 2024, a small region of open water persisted near the Belcher Islands, roughly three weeks after freeze-up normally occurs.

Antarctic sea ice: slower decline

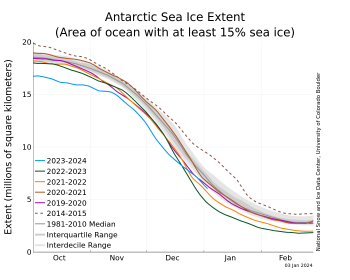
Figure 5a. The graph above shows Antarctic sea ice extent as of January 3, 2024, along with daily ice extent data for four previous years and the record high year. 2023 to 2024 is shown in blue, 2022 to 2023 in green, 2021 to 2022 in orange, 2020 to 2021 in brown, 2019 to 2020 in magenta, and 2014 in dashed brown. The 1981 to 2010 median is in dark gray. The gray areas around the median line show the interquartile and interdecile ranges of the data. Sea Ice Index data.||Credit: National Snow and Ice Data Center|High-resolution image

Figure 5a. The graph above shows Antarctic sea ice extent as of January 3, 2024, along with daily ice extent data for four previous years and the record high year. 2023 to 2024 is shown in blue, 2022 to 2023 in green, 2021 to 2022 in orange, 2020 to 2021 in brown, 2019 to 2020 in magenta, and 2014 in dashed brown. The 1981 to 2010 median is in dark gray. The gray areas around the median line show the interquartile and interdecile ranges of the data. Sea Ice Index data.

Credit: National Snow and Ice Data Center
High-resolution image

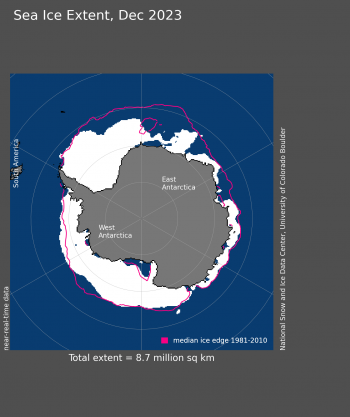
Figure 5b. Antarctic sea ice extent for December 2023 was 8.67 million square kilometers (3.35 million square miles). The magenta line shows the 1981 to 2010 average extent for that month. Sea Ice Index data. About the data||Credit: National Snow and Ice Data Center|High-resolution image

Figure 5b. Antarctic sea ice extent for December 2023 was 8.67 million square kilometers (3.35 million square miles). The magenta line shows the 1981 to 2010 average extent for that month. Sea Ice Index data. About the data

Credit: National Snow and Ice Data Center
High-resolution image

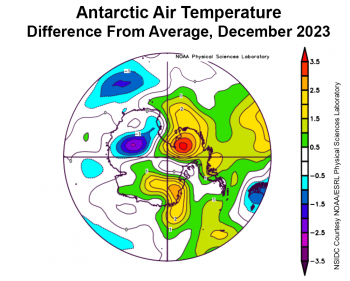
Figure 5c. This plot shows the departure from average air temperature in the Arctic at the 925 hPa level, in degrees Celsius, for December 2023. Yellows and reds indicate above average temperatures; blues and purples indicate below average temperatures.||Credit: NSIDC courtesy NOAA Earth System Research Laboratory Physical Sciences Laboratory| High-resolution image

Figure 5c. This plot shows the departure from average air temperature in the Arctic at the 925 hPa level, in degrees Celsius, for December 2023. Yellows and reds indicate above average temperatures; blues and purples indicate below average temperatures.

Credit: NSIDC courtesy NOAA Earth System Research Laboratory Physical Sciences Laboratory
High-resolution image

At the beginning of December, ice extents were at record low levels. However, the seasonal decline in Antarctic ice extent subsequently slowed. As a result, by the beginning of the new year, extent was only sixth lowest (Figure 5a). Despite the slow ice loss, few areas of the Southern Ocean have above average sea ice extent, and extent is still well below the average for 1981 to 2010 in the Weddell Sea, along the coast of Dronning Maud Land, and in the western Ross Sea (Figure 5b). Typical for this time of year, a large polynya has opened up in front of the Ross and Sulzberger Ice Shelves. Low sea ice concentrations in the Ross Sea and western Amundsen Sea portend upcoming ice extent declines in these areas. Air temperatures were above average over West Antarctica and the Ross Sea by 1 to 3 degrees Celsius (2 to 5 degrees Fahrenheit) for the month, and over the Bellingshausen Sea by 1 to 2 degrees Celsius (2 to 4 degrees Celsius) (Figure 5c). Dronning Maud Land was above average by up to 2.5 degrees Celsius (4.5 degrees Fahrenheit). Below average conditions prevailed over Wilkes Land, at 1 to 2 degrees Celsius (2 to 4 degrees Fahrenheit) below the 1991 to 2020 reference period.

Looking back at 2023

The extremely low Antarctic sea ice extent for most of the year was the most noteworthy characteristic of either polar region for 2023. At one point in mid-August, southern hemisphere sea ice was more than 1.80 million square kilometers (695,000 square miles) below the previous record low years (2022, 2002, or 1986 depending on the day of year), and more than 2.6 million square kilometers (1.00 million square miles) below the 1981 to 2010 average extent. The difference between 2023 daily extent and the 1981 to 2010 average was greater than 1 million square kilometers (386,000 square kilometers) for nearly the entire year. Several studies have argued that low sea ice extents in recent years for the Southern Ocean represent a response to unusually high temperatures in the upper ocean layer.

In the Arctic, sea ice extent followed a pattern typical of the past decade, with persistently below-average extent in the northernmost Atlantic (Barents and Norwegian Seas) and large summer retreat along the eastern Siberian coast. However, the pace of sea ice decline (e.g. summer minimums or monthly average extents) has slowed since 2012, and the 2012 record low summer minimum has not been surpassed. While explanations have been offered to account for this “hiatus,” notably involving variations on ocean heat transport to the Arctic Ocean, questions remain.

Further reading

Polyakov, I. V., et al. 2023. Fluctuating Atlantic inflows modulate Arctic atlantification. Science. doi: 10.1126/science.adh51