While Arctic sea ice extent was tracking at record low levels in July and August, the pace of ice loss slowed considerably after the middle of August, despite above-average air temperatures over much of the Arctic Ocean. By August 14, extent started tracking above levels observed in 2012, resulting in the second lowest August extent in the satellite record. Although Arctic air temperatures are now falling below freezing, sea ice loss will likely continue for several weeks as heat stored in the ocean melts the underside of sea ice. Winds can also compress the pack further reducing sea ice extent. As of this post, the rate of sea ice loss has sped up again.
Overview of conditions

Figure 1. Arctic sea ice extent for August 2019 was 5.03 million square kilometers (1.94 million square miles). The magenta line shows the 1981 to 2010 average extent for that month. Sea Ice Index data. About the data
Credit: National Snow and Ice Data Center
High-resolution image
On August 14, Arctic sea ice extent began tracking above 2012 levels, and continued to do so for the remainder of the month, resulting in a monthly average extent of 5.03 million square kilometers (1.94 million square miles). This is 310,000 square kilometers (120,000 square miles) above the 2012 average extent, the lowest in the satellite record, and 2.17 million square kilometers (838,000 square miles) below the 1981 to 2010 average for August. On August 13, ice extent dropped below 5 million square kilometers (1.9 million square miles). This never occurred prior to 2007, but has occurred every subsequent year apart from 2009 and 2013. Overall sea ice retreat during the second half of August was modest, taking place along the periphery of the ice edge within the Arctic Ocean. Sea ice concentrations remain low over many areas, especially along the ice edge in the Beaufort Sea and within the Laptev Sea.
For the month as a whole, sea ice loss was most pronounced in the East Siberian Sea as the ice that had persisted in that region finally melted out. The ice edge is presently far north of its climatological average position everywhere except for a tongue of ice in the eastern part of the Beaufort Sea west of Banks Island, and around the island of Svalbard, where the ice edge remains near or slightly south of its average location for this time of year. While sea ice concentrations from the passive microwave record suggest that the Northwest Passage southerly route, or Amundsen’s route, is free of ice, operational ice analyses, which employ higher resolution visible band and radar satellite data, show some remaining ice around the Prince of Wales Island. The more northerly route through the Parry Channel and M’Clure Strait still has significant amounts of ice and will likely not open this year.
On August 31, sea ice extent dropped to 4.62 million square kilometers (1.78 million square miles), the third lowest extent for this date in the satellite record.
Conditions in context

Figure 2a. The graph above shows Arctic sea ice extent as of September 4, 2019, along with daily ice extent data for four previous years and the record low year. 2019 is shown in blue, 2018 in green, 2017 in orange, 2016 in brown, 2015 in purple, and 2012 in dotted brown. The 1981 to 2010 median is in dark gray. The gray areas around the median line show the interquartile and interdecile ranges of the data. Sea Ice Index data.
Credit: National Snow and Ice Data Center
High-resolution image
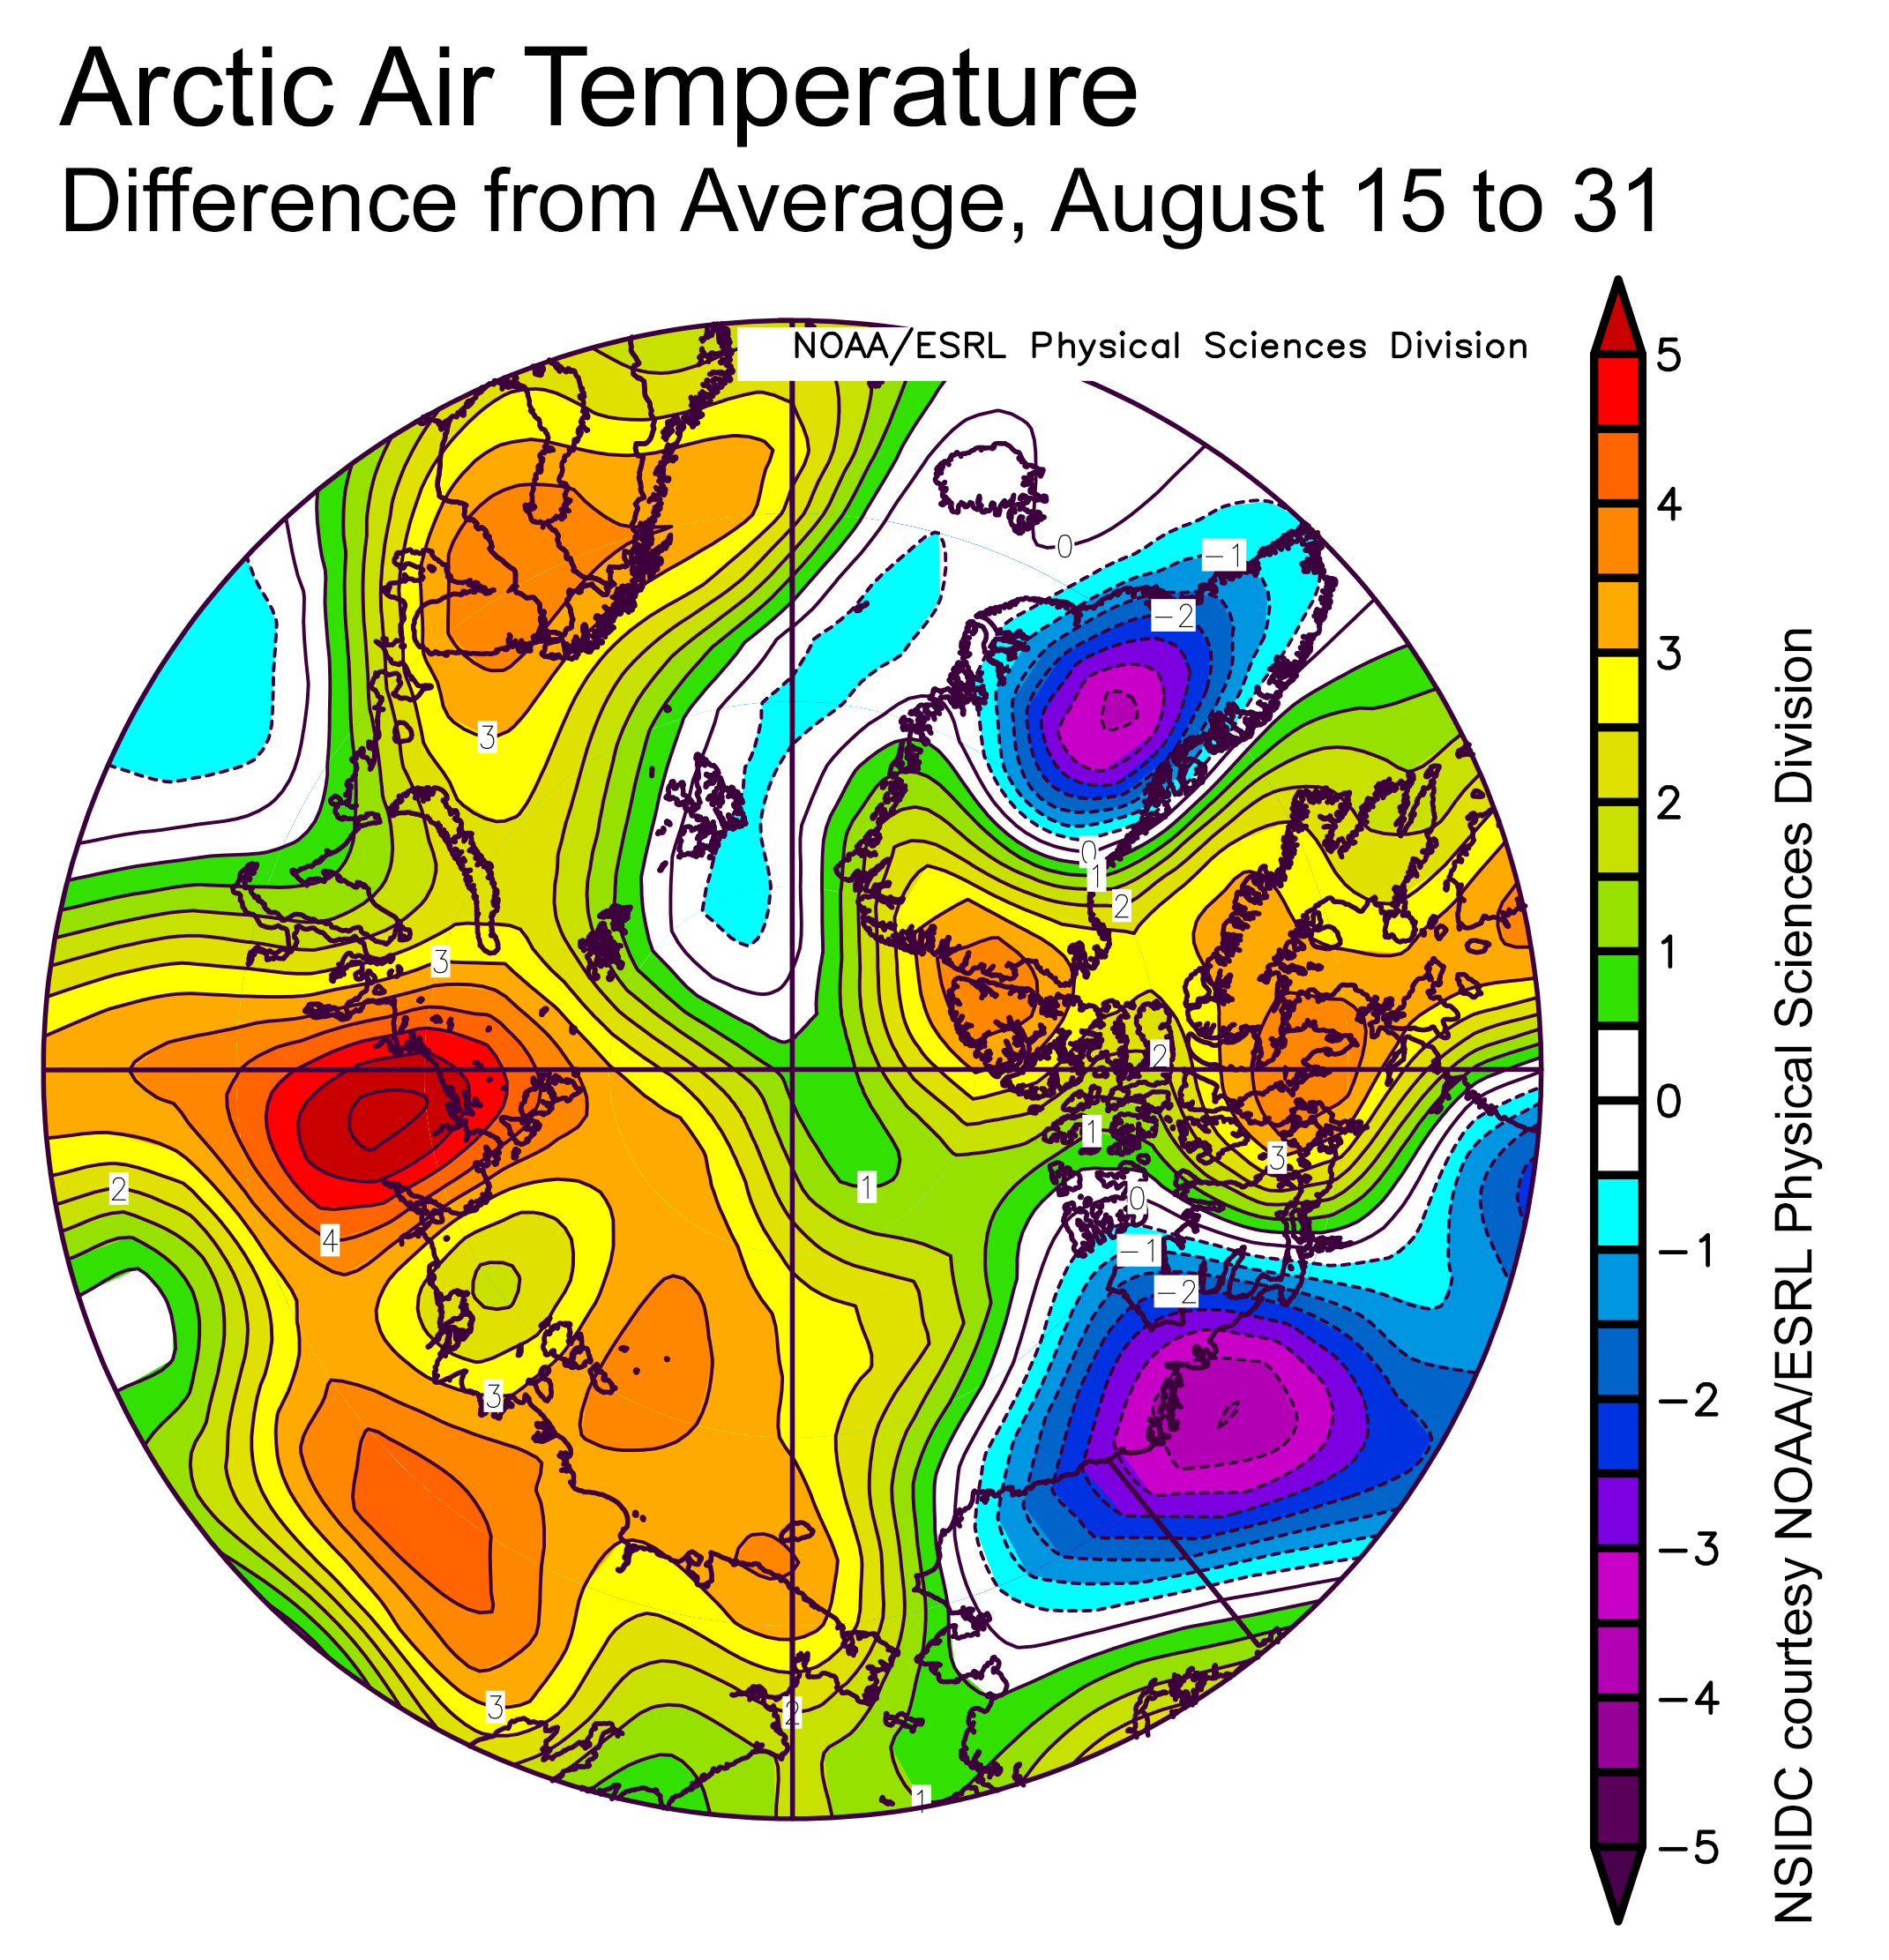
Figure 2b. This plot shows the departure from average air temperature in the Arctic at the 925 hPa level, in degrees Celsius, from August 15 to 31, 2019. Yellows and reds indicate higher than average temperatures; blues and purples indicate lower than average temperatures.
Credit: NSIDC courtesy NOAA Earth System Research Laboratory Physical Sciences Division
High-resolution image
During the second half of August, air temperatures at the 925 hPa level (about 2,500 feet above the surface) were above average over most of the Arctic Ocean. Temperatures over the East Siberian through the Laptev and Kara Seas were 3 to 5 degrees Celsius (5 to 9 degrees Fahrenheit) above the 1981 to 2010 average. Air temperatures over the Canadian Arctic Archipelago were up to 3 degrees Celsius (5 degrees Fahrenheit) above average. By contrast, air temperatures around Svalbard were around 1 degree Celsius (2 degrees Fahrenheit) below average (Figure 2b). Cold conditions were also present in the southern Beaufort Sea and in the Yukon and MacKenzie districts of Canada’s Northwest Territories.
During the third week of August, a cyclone developed over the Northwest Territories and entered the Beaufort Sea on August 23. It then moved east over the Canadian Arctic Archipelago. This cyclone began pulling warm air from the south over northwestern Greenland and the Canadian Arctic Archipelago and into the Lincoln Sea. While this cyclone was short-lived, air temperatures during the cyclone passage within the Lincoln Sea were up to 10 degrees Celsius (18 degrees Fahrenheit) above the 1981 to 2010 average. While a notable event, the storm does not appear to have had much of an effect on ice extent.
August 2019 compared to previous years

Figure 3. Monthly August ice extent for 1979 to 2019 shows a decline of 10.59 percent per decade.
Credit: National Snow and Ice Data Center
High-resolution image
Overall, the pace of ice loss in August 2019 was 54,900 square kilometers (21,200 square miles) per day. This was considerably slower than the 2012 rate of decline of 89,500 square kilometers (34,600 square miles) per day, but only slightly slower than the 1981 to 2010 climatological rate of decline of 57,300 square kilometers (22,100 square miles) per day. In total, 1.70 million square kilometers (656,000 square miles) of ice were lost during August 2019. The linear rate of sea ice decline for August from 1979 to 2019 is 76,200 square kilometers (29,400 square miles) per year, or 10.59 percent per decade relative to the 1981 to 2010 average.
The melt season is not over until bottom melt ends
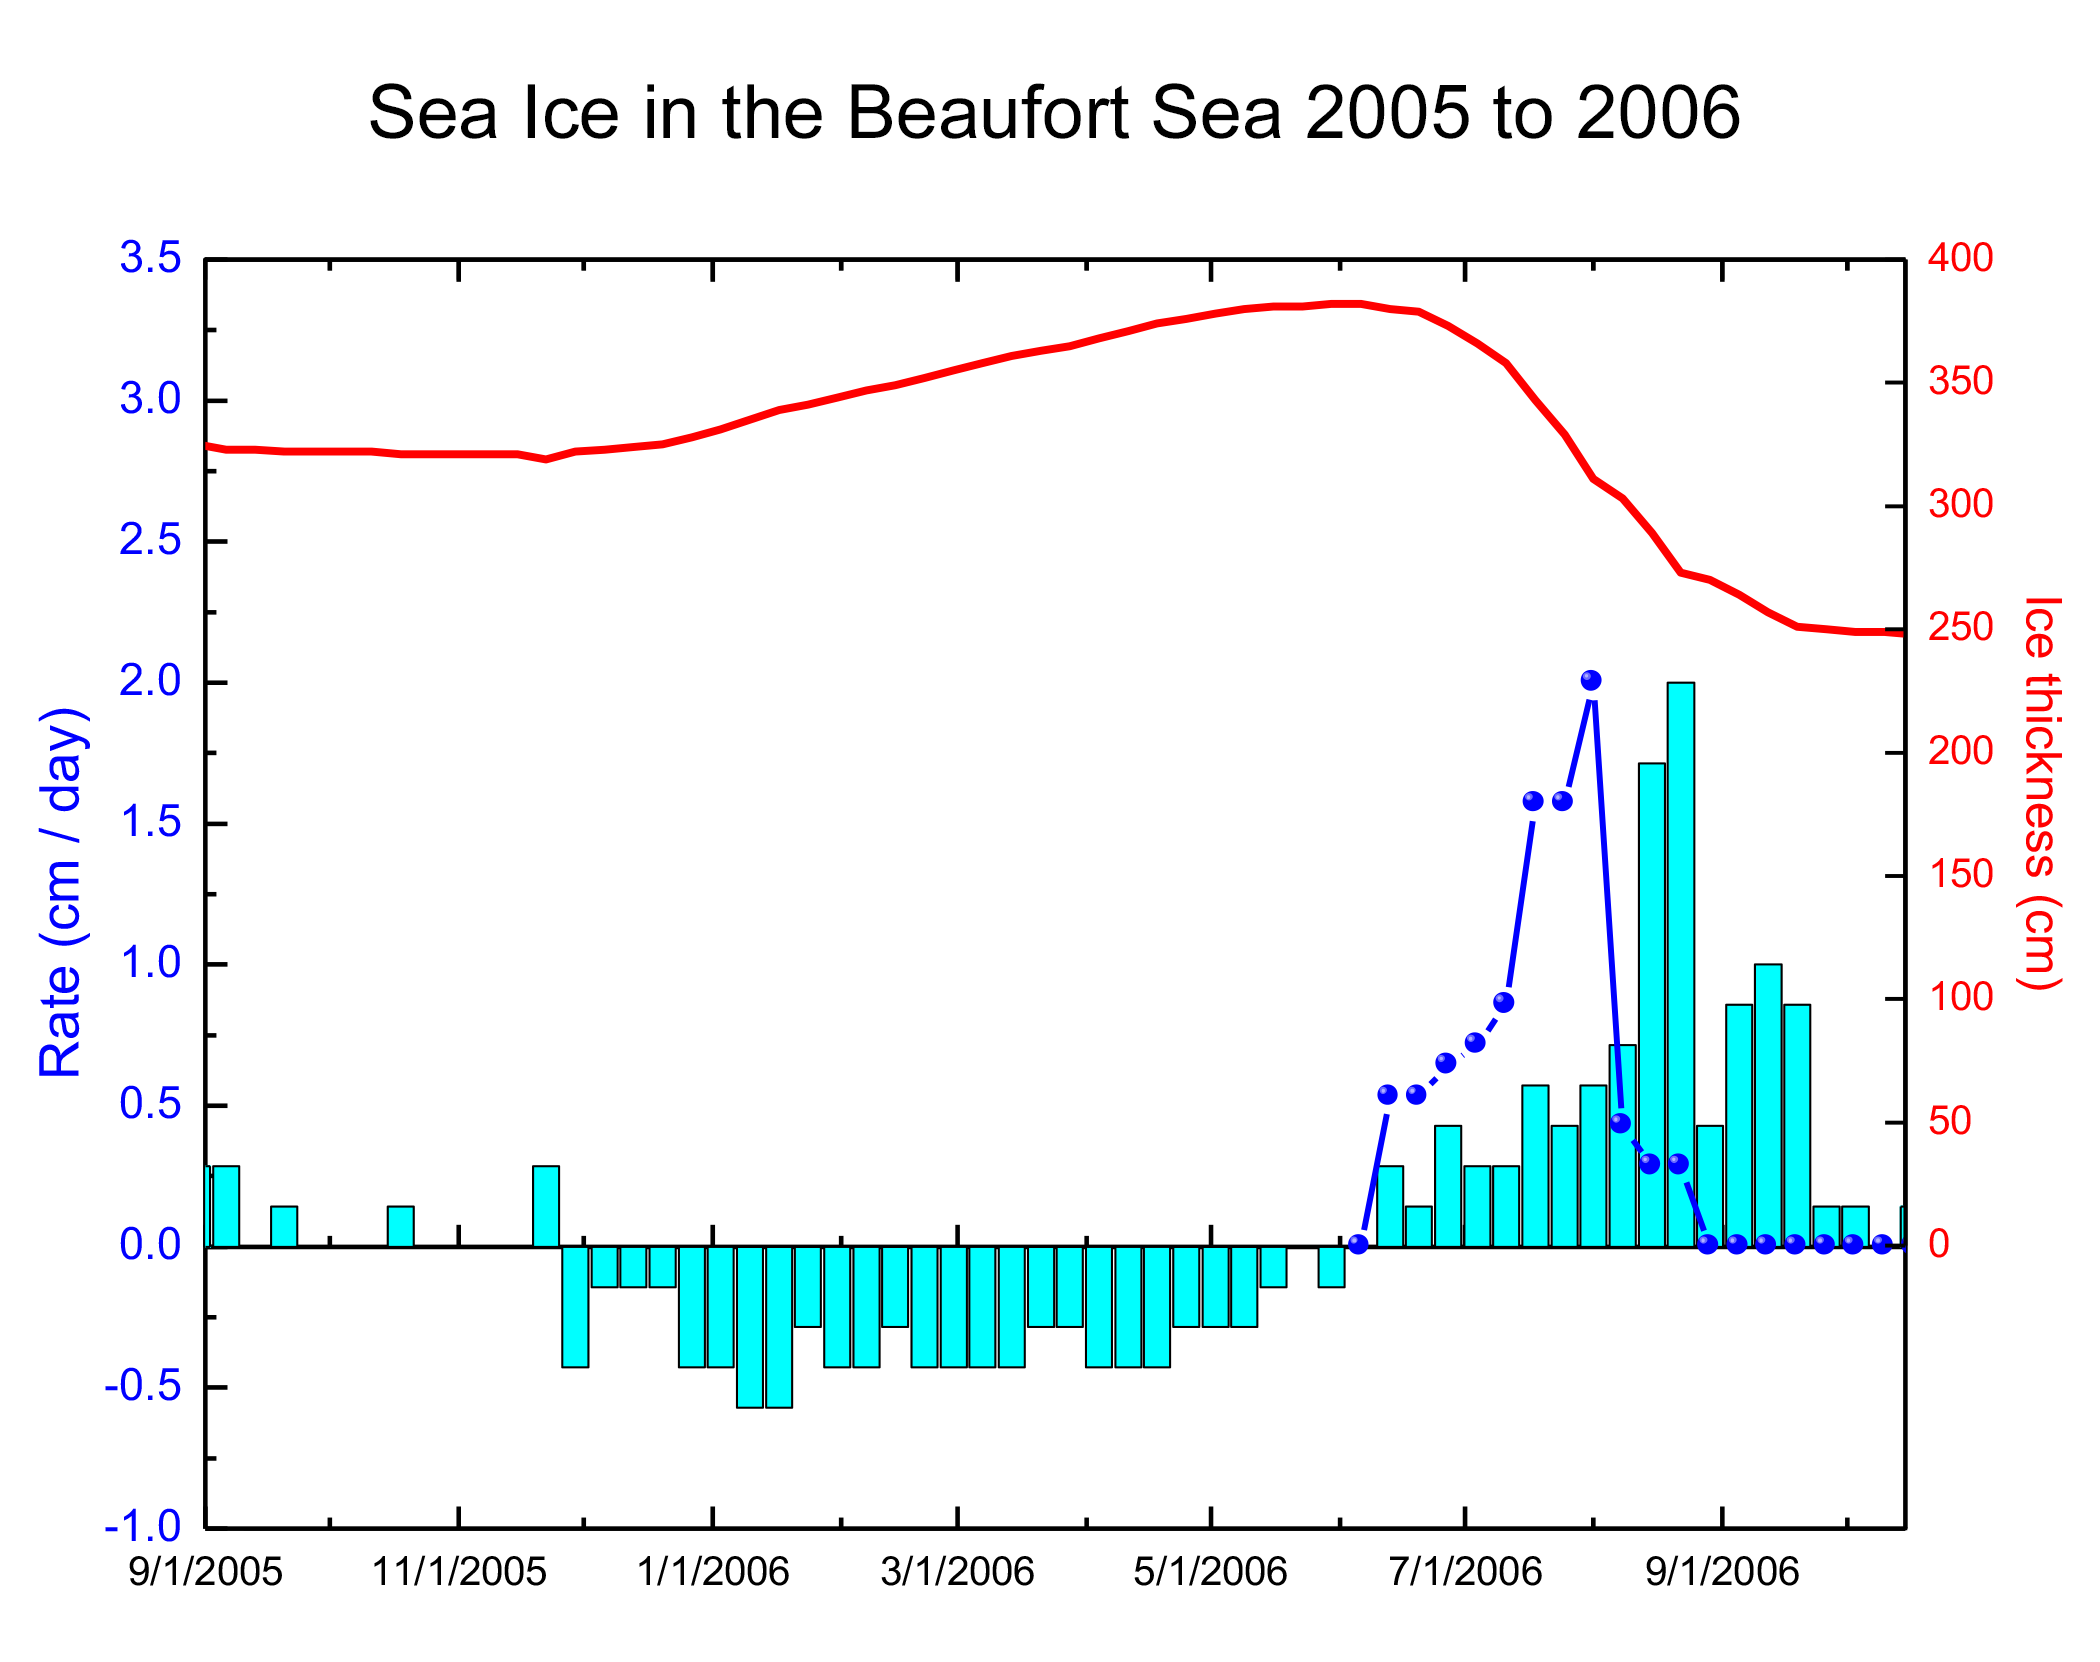
Figure 4a. This 2005 to 2006 time series from the Beaufort Sea shows ice thickness (red line), growth rate (blue bars with negative values), bottom melt (blue bars with positive values), and surface melt (dark blue line with points). Both surface and bottom melt started on June 10. Surface melt peaked on August 1, and peak bottom melt was two weeks later on August 15. Surface melting ended on August 24, while bottom melting continued until October 24.
Credit: Don Perovich
High-resolution image
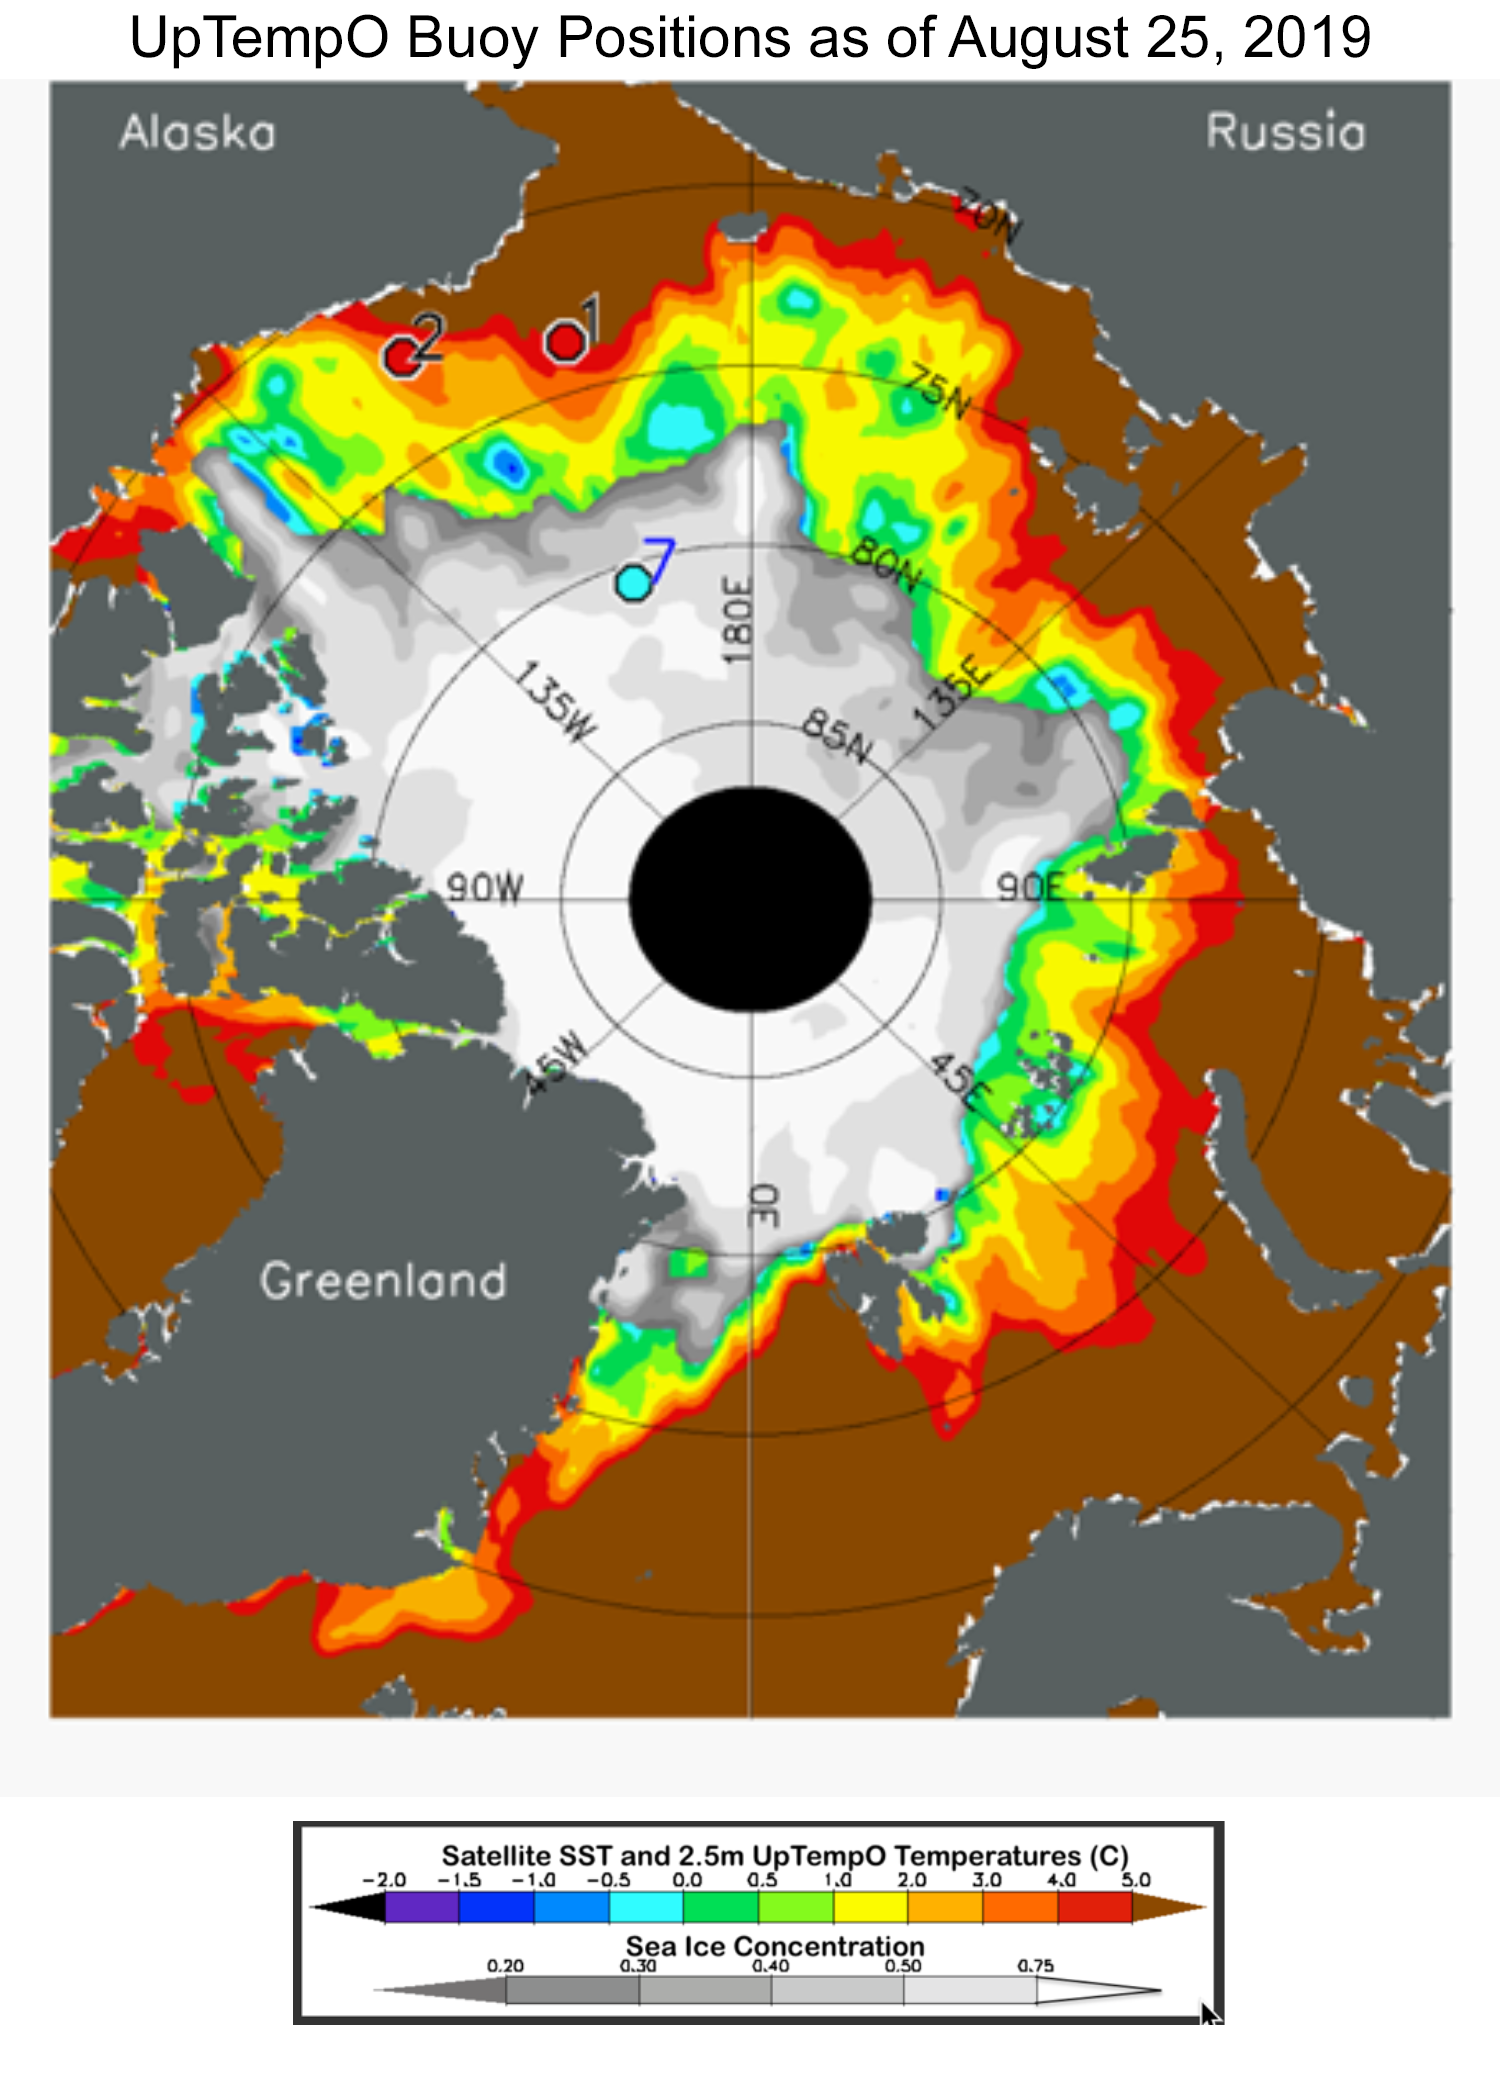
Figure 4b. This map shows sea surface temperature and ice concentration for August 25, 2019. The locations of three Upper layer Temperature of the Polar Oceans (UpTempO) drifting buoys are marked as 1, 2, and 7. Sea surface temperature data are from the National Oceanic and Atmospheric Administration daily Optimum Interpolation Sea Surface Temperature (OISST), and ice concentration from the NSIDC Sea Ice Index. Download data from UptempO drifting buoy locations.
Credit: University of Washington
High-resolution image
By August, the sun hangs low on the horizon in the Arctic, air temperatures drop below the freezing, melt ponds begin to freeze, and the first snows fall. It seems as though summer is over, but it is not. Even though surface melting has largely ended, there still is ample heat remaining in the ocean and the bottom of the ice is still melting. Colleague Don Perovich discussed these issues at the International Glaciological Society: Sea Ice at the Interface meeting, held August 18 to 23, 2019 in Winnipeg, Canada. Surface melting peaks in July and usually ends in mid-August. By contrast, bottom melting peaks in August and often continues into September or October (Figure 4a). This is supported by observations in regions with early sea ice retreat like the Chukchi, Bering, Laptev, and Kara Seas, where sea surface temperatures were 5 degrees Celsius (41 degrees Fahrenheit) or higher on August 25 (Figure 4b).
Update on ice conditions in the Northwest Passage
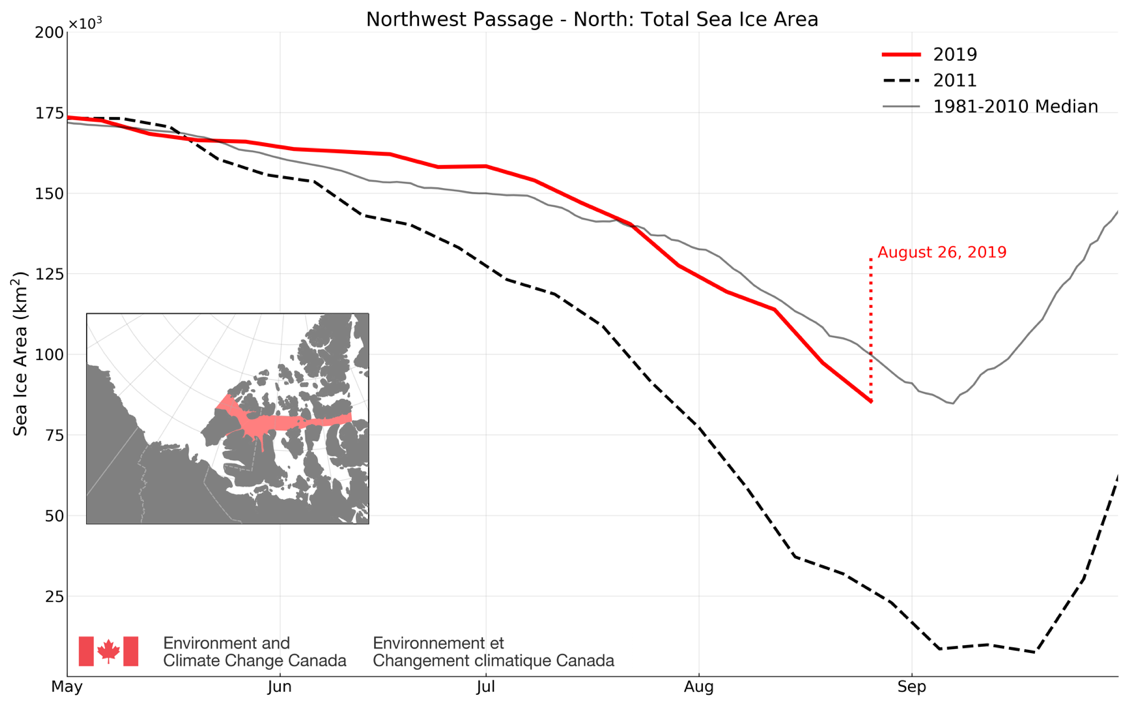
Figure 5a. This time series shows total sea ice area for 2019, 2011, and the 1981 to 2010 median within the northern route of the Northwest Passage.
Credit: Canadian Ice Service
High-resolution image

Figure 5b. The time series shows total sea ice area for 2019, 2011, and the 1981 to2010 median within the southern route of the Northwest Passage.
Credit: Canadian Ice Service
High-resolution image
As of August 26, sea ice area in the northern (deep water) route of the Northwest Passage is currently tracking just below the 1981 to 2010 average (Figure 5a). Concentrations are well above the record low for this area recorded in 2011, with 83 percent of the ice cover consisting of multiyear ice. It is unlikely the northern route will open this year. By sharp contrast, the southern route of the Northwest Passage, Amundsen’s route, is tracking well below the 1981 to 2010 average and just above 2011 (Figure 5b). Areas of low ice concentration are still present to the east and south of Prince of Wales Island but it is likely the southern route will completely clear in the coming weeks. The Northern Sea Route along the Siberian coast has been essentially open for several weeks.
Another year of sea ice loss in the Beaufort Sea
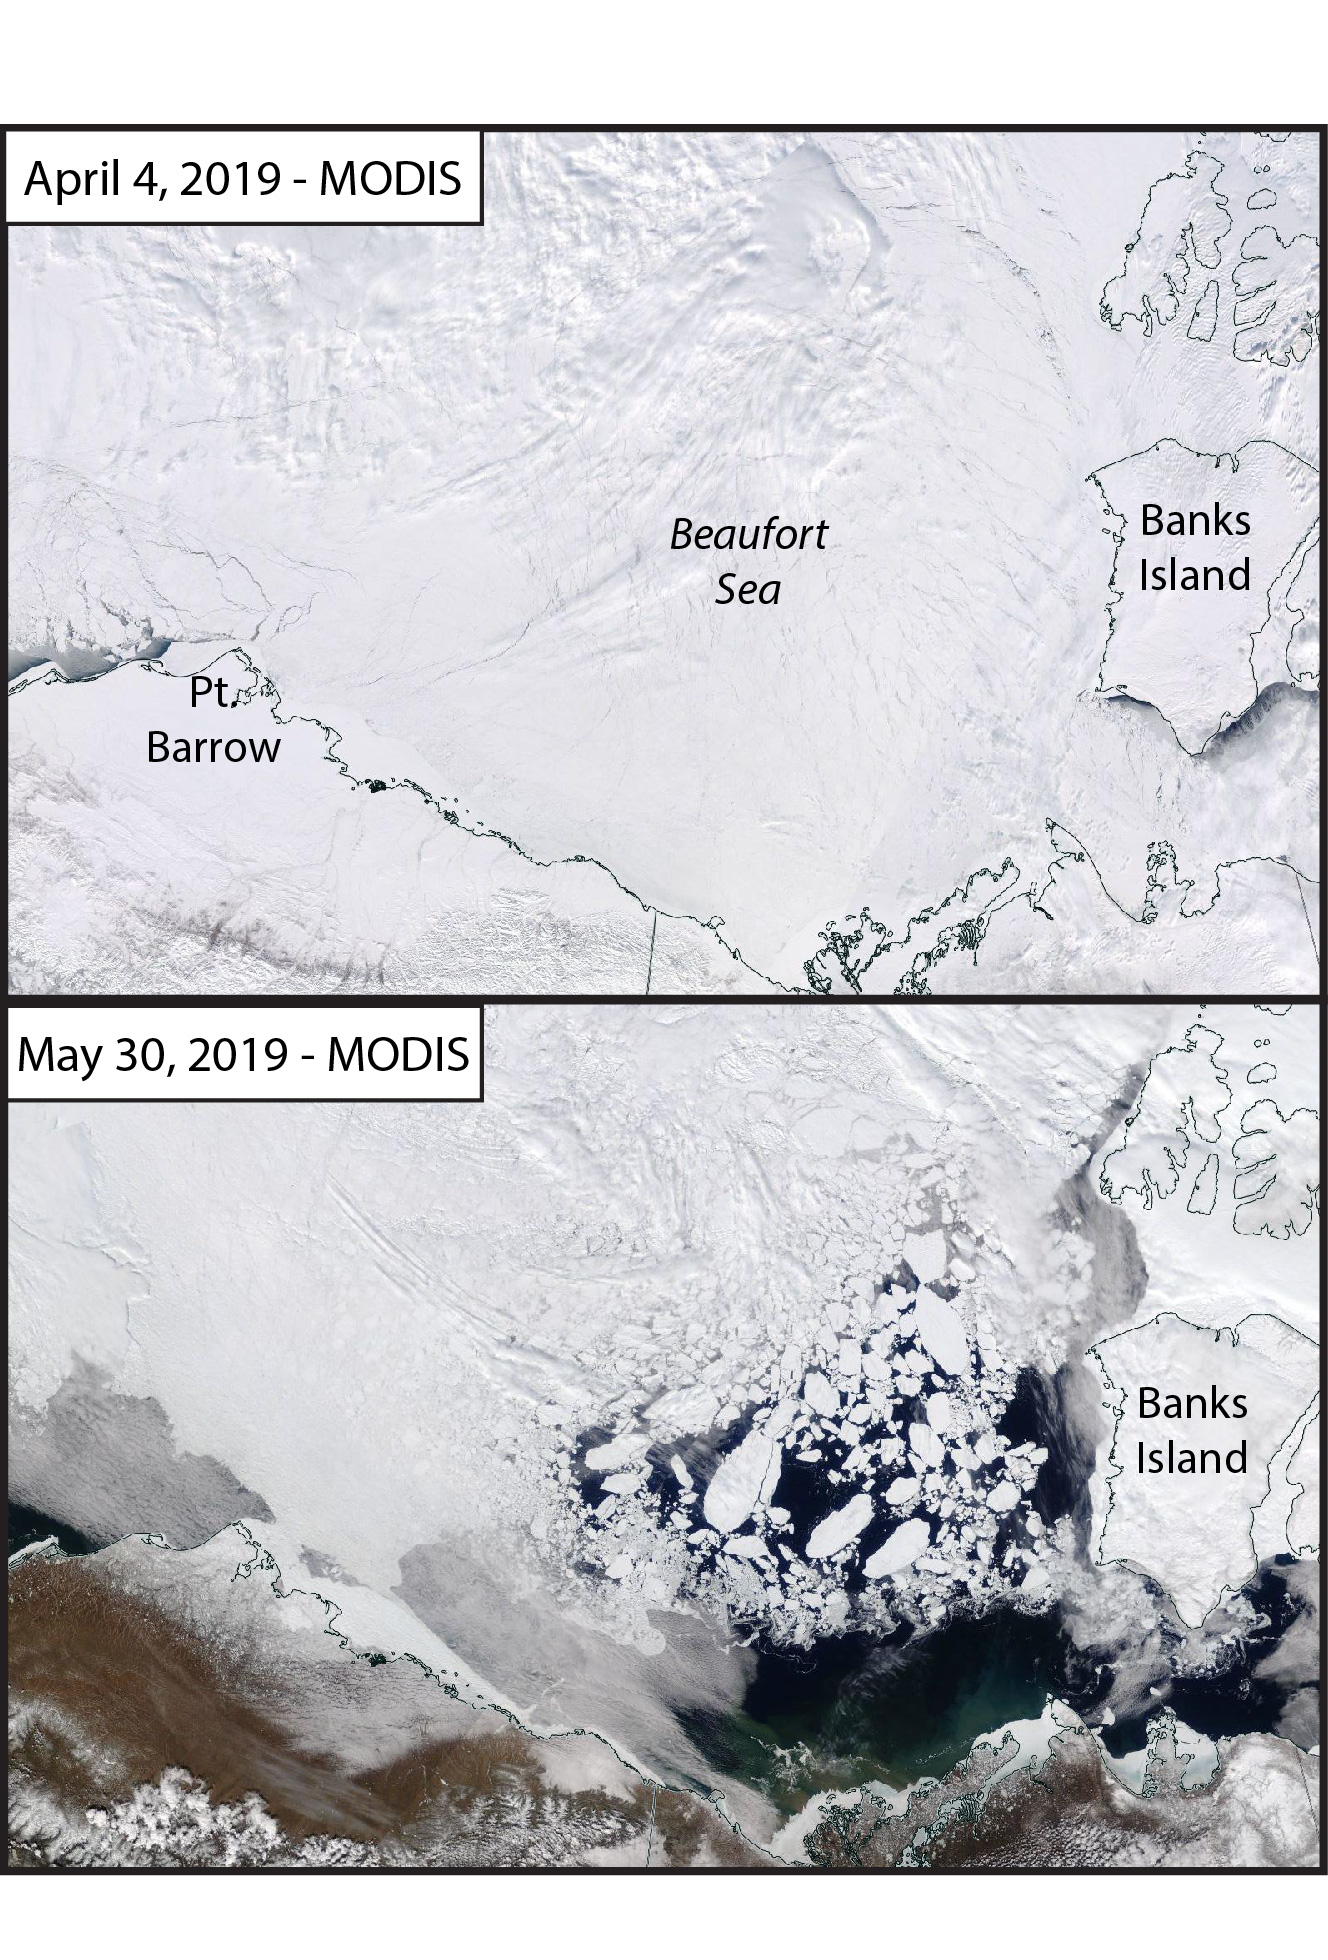
Figure 6a. This NASA Worldview image taken by the Moderate Resolution Imaging Spectroradiometer (MODIS) sensor on the NASA Terra satellite shows the Beaufort Sea on April 4 and May 30, 2019. The two images show a transition in sea ice extent where the April 4 image depicts an ice-covered sea while the May 30 image contains large areas of open water.
Credit: NASA Worldview
High-resolution image
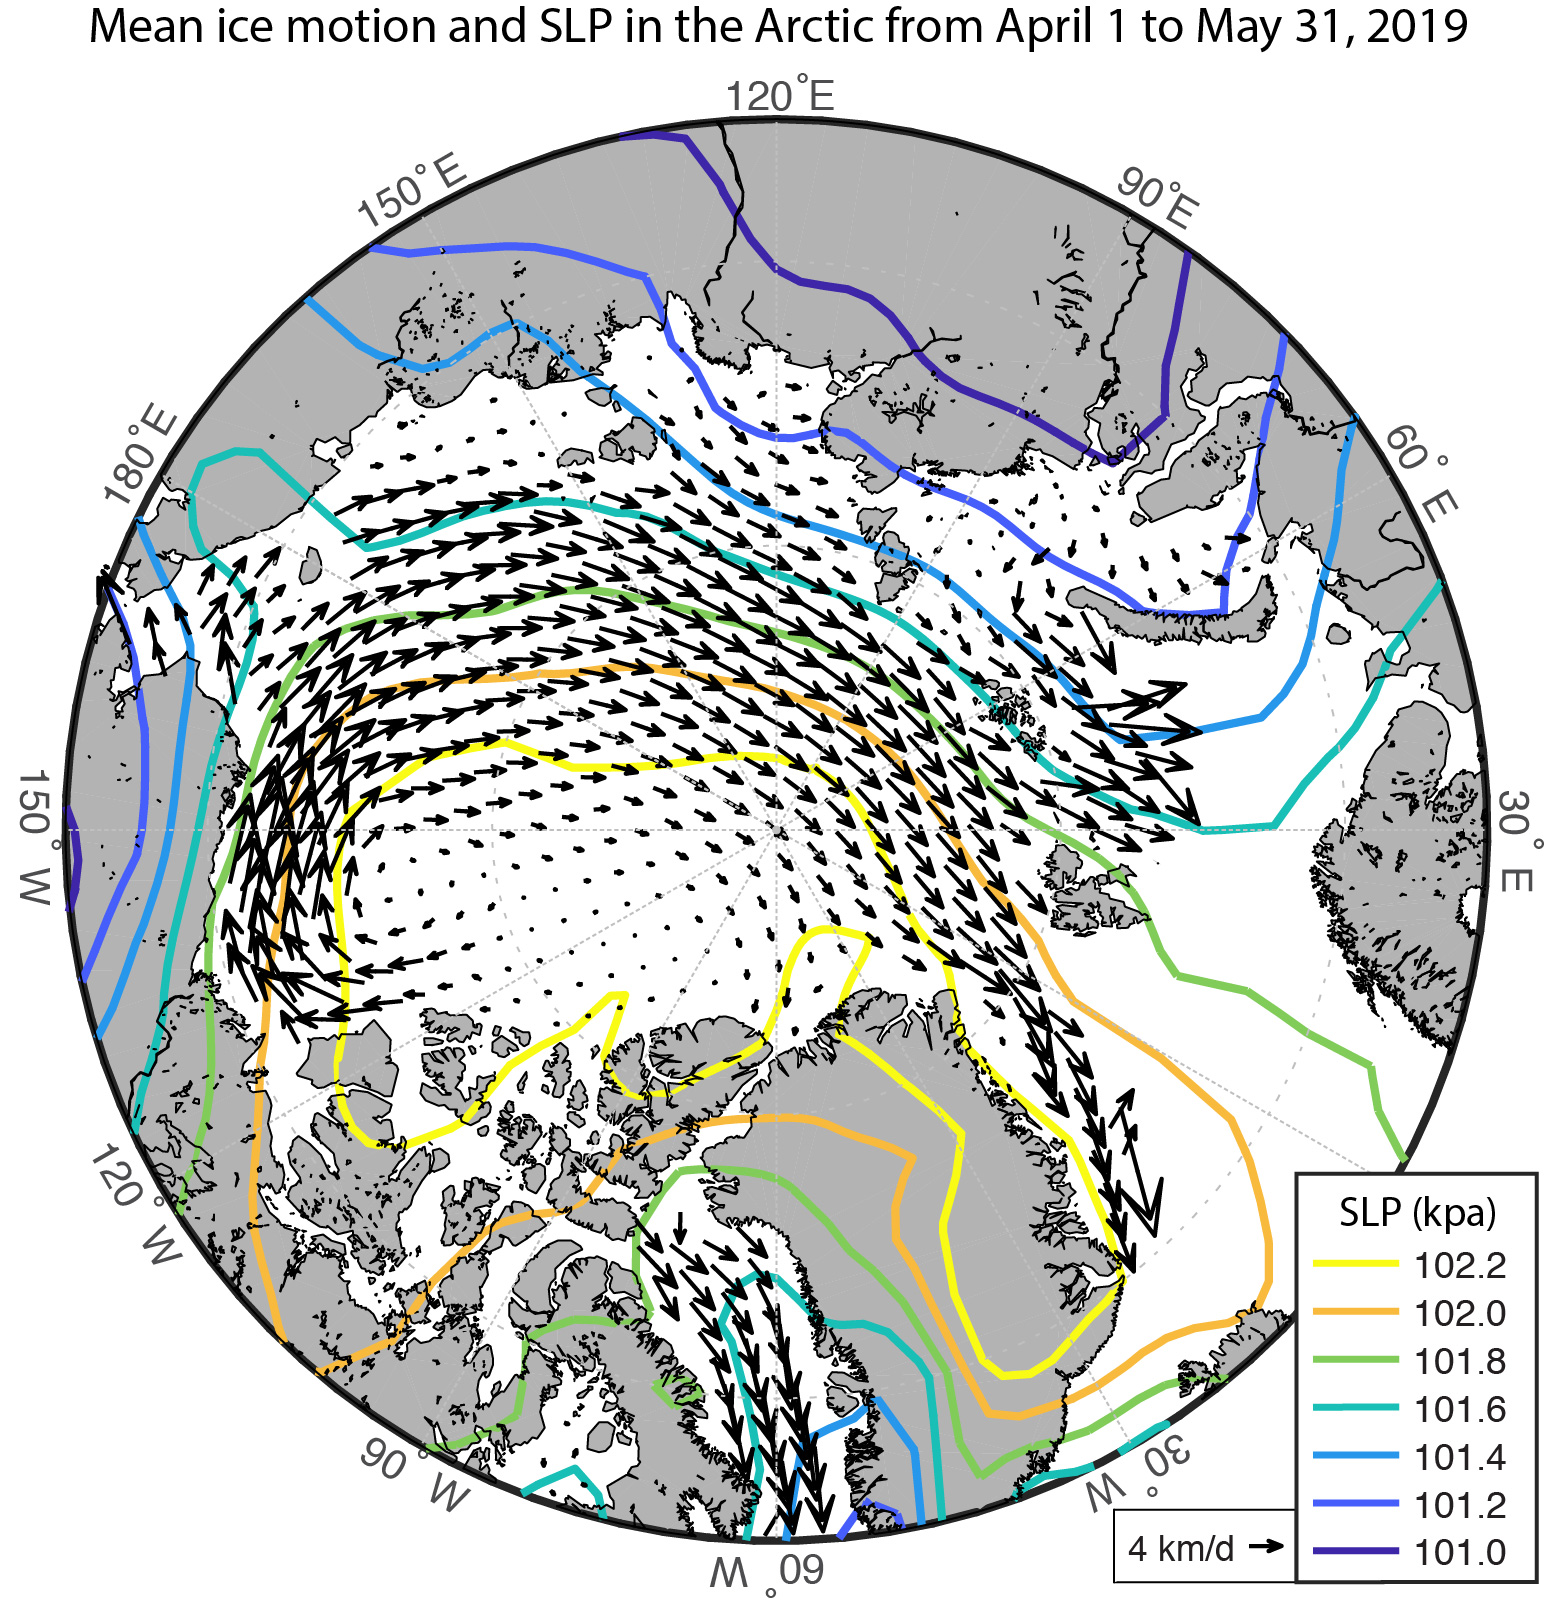
Figure 6b. This map of the Arctic shows average fields of ice drift and sea level pressure (SLP) from April 1 to May 31, 2019. Ice Drift data is from Ocean and Sea Ice (OSI) Satellite Application Facilities (SAF) Low Resolution Sea Ice Drift product and SLP fields are from National Centers for Environmental Prediction (NCEP) reanalysis.
Credit: Meteorologisk Institutt and NCEP
High-resolution image
Sea ice loss during 2019 has been particularly pronounced in the Beaufort Sea, where only a dispersed tongue of multiyear sea ice remains. On August 31, sea ice extent fell to its sixth lowest in the 40-year satellite record and continues the long-term trend towards the Beaufort becoming seasonally ice free, meaning that no ice survives the melt season. Recent work by David Babb and colleagues at the University of Manitoba has focused on the dynamic and thermodynamic processes influencing summer sea ice loss in the Beaufort Sea, and connected summer ice loss back to the timing of sea ice breakup.
In early April 2019, a consolidated mix of first year and multiyear sea ice covered the Beaufort Sea (Figure 6a). However, high sea level pressure over the western Arctic during April and May increased ice export out of the Beaufort Sea (Figure 6b), dynamically opening up the region and dropping its sea ice area by 50 percent in May. (Sea ice area represents the area of a grid cell multiplied by the ice concentration.) The transition from a snow-covered icescape to vast areas of open water occurred between one to two months earlier than usual, initiating a cycle of increased open water—increased solar energy absorption—and therefore accelerated ice melt (ice-albedo feedback). Subsequently, regional sea ice area in June fell to one of its lowest values in the satellite record, indicating that the Beaufort was bound to once again become ice free in September like it had in 2012 and 2016. However, ice import during June and July generated a tongue of multiyear ice in the eastern Beaufort Sea that led to positive thickness anomalies in July and persisted through summer. Low sea ice once again characterizes the Beaufort Sea, where nine of the ten lowest sea ice areas occurred within the last 13 years. Sea ice extent has a significant negative trend in this region, losing 5,006 square kilometers (1,933 square miles) per year at the end of August. While it will be interesting to see if this multiyear ice tongue persists through September, it will also be instructive to see how the warm surface waters affect fall freeze up, which may then impact the 2019 to 2020 ice growth season.
Antarctic sea ice note
Sea ice surrounding Antarctica has grown at a faster-than-average pace since late July, climbing from a record low level on July 25 to about tenth lowest at the end of August. Most of the increase in extent was along the sea ice edge of the Weddell and Cosmonaut Seas, and north of Wilkes Land, while the northern Ross Sea and Amundsen Sea saw significant ice retreat. The annual sea ice maximum for Antarctic sea ice is usually around October 1.
Further reading
Babb, D. G., J. C. Landy, D. G. Barber, and R. J. Galley. 2019. Winter sea ice export from the Beaufort Sea as a preconditioning mechanism for enhanced summer melt: A case study of 2016. Journal of Geophysical Research: Oceans, 124, doi:10.1029/2019JC015053.
Galley, R. J., D. Babb, M. Ogi, B. G. T. Else, N.-X. Geilfus, O. Crabeck, D. G. Barber, and S. Rysgaard. 2016. Replacement of multiyear sea ice and changes in the open water season duration in the Beaufort Sea since 2004, Journal of Geophysical Research: Oceans, 121, doi:10.1002/2015JC011583.

