Arctic sea ice extent for February 2019 was the seventh lowest in the satellite record for the month, tying with 2015. So far this winter, sea ice extent has remained above the 2017 record low maximum. Extent in the northern Barents Sea, which has been quite low in recent years from “Atlantification,” is closer to average this February. Extent is very low in the Bering Sea at the end of February after unusual ice loss throughout the month. In Antarctica, the sea ice minimum may have been reached on both February 28 and March 1.
Overview of conditions
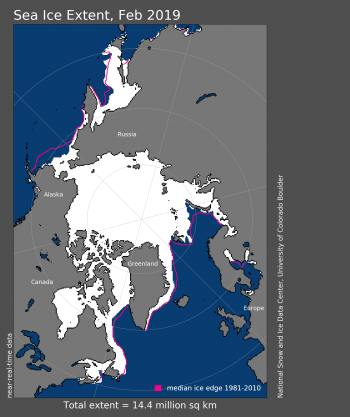
Figure 1a. Arctic sea ice extent for February 2019 was 14.40 million square kilometers (5.56 million square miles). The magenta line shows the 1981 to 2010 average extent for that month. Sea Ice Index data. About the data
Credit: National Snow and Ice Data Center
High-resolution image
Arctic sea ice extent for February 2019 averaged 14.40 million square kilometers (5.56 million square miles). This was 900,000 square kilometers (347,000 square miles) below the 1981 to 2010 long-term average extent, and 450,000 square kilometers (174,000 square miles) above the record low for the month set in February 2018. For the Arctic as a whole, February 2019 tied with 2015 for the seventh lowest average February extent in the 1979 to 2019 satellite record.
The daily average ice growth rate of 19,400 square kilometers (7,500 square miles) was near the long term average of 20,200 square kilometers (7,800 square miles). Ice growth during February primarily occurred in the Barents Sea and in the Sea of Okhotsk. Some ice growth was also observed in the Labrador Sea. Recent years have seen reduced ice coverage in the northern Barents Sea related to “Atlantification”—a greater influence of warm waters brought in from the Atlantic (see previous post). Sea ice extent toward the end of February 2019, however, was much closer to average in this region. By sharp contrast, sea ice extent drastically retreated in the Bering Sea in February and continues to as of this post.
Conditions in context
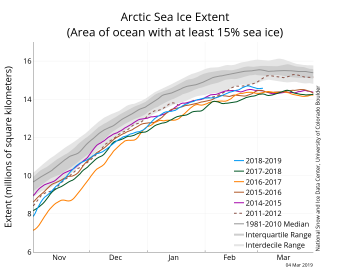
Figure 2a. The graph above shows Arctic sea ice extent as of March 4, 2019, along with daily ice extent data for four previous years and the record low year. 2018 to 2019 is shown in blue, 2017 to 2018 in green, 2016 to 2017 in orange, 2015 to 2016 in brown, 2014 to 2015 in purple, and 2011 to 2012 in dotted brown. The 1981 to 2010 median is in dark gray. The gray areas around the median line show the interquartile and interdecile ranges of the data. Sea Ice Index data.
Credit: National Snow and Ice Data Center
High-resolution image
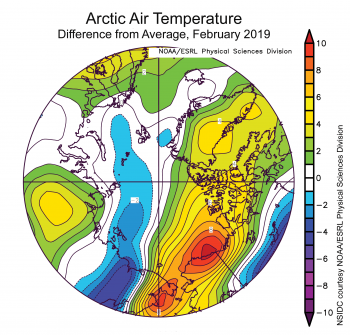
Figure 2b. This plot shows the departure from average air temperature in the Arctic at the 925 hPa level, in degrees Celsius, for February 2019. Yellows and reds indicate higher than average temperatures; blues and purples indicate lower than average temperatures.
Credit: NSIDC courtesy NOAA Earth System Research Laboratory Physical Sciences Division
High-resolution image
Arctic temperatures at the 925 hPa level (approximately 2500 feet above the surface) were from 4 to 10 degrees Celsius (7 to 18 degrees Fahrenheit) above the 1981 to 2010 average for a region extending from the Bering Sea, through the Beaufort Sea, and into the Canadian Arctic Archipelago (Figure 2b). This is consistent with a pattern for the month of low pressure at sea level centered over the western Bering Sea, and high pressure centered over northwestern Canada (Figure 4b). Low pressure dominated both the central Arctic Ocean and the northern North Atlantic. As such, it comes as no surprise that the Arctic Oscillation index was positive overall for the month.
February 2019 compared to previous years
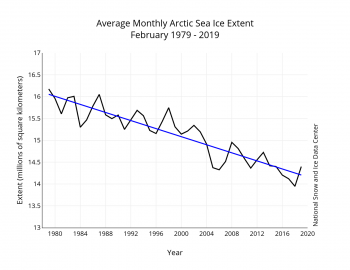
Figure 3. Monthly February ice extent for 1979 to 2019 shows a decline of 3.0 percent per decade.
Credit: National Snow and Ice Data Center
High-resolution image
Overall, sea ice extent during February 2019 increased by 543,000 square kilometers (210,000 square miles). This was fairly close to the 1981 to 2010 average increase for the month. The linear rate of sea ice decline for February is 46,300 square kilometers (17,900 square miles) per year, or 3.0 percent per decade relative to the 1981 to 2010 average.
Ice loss in the Bering Sea
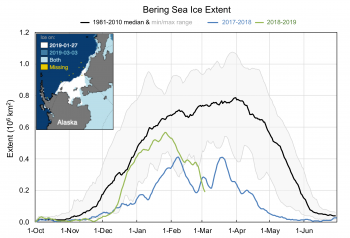
Figure 4a. This graph shows the sharp decline in sea ice extent in the Bering Sea starting at the end of January and continuing as of this post. The inset map in the top left compares sea ice extent at the beginning of January 27 and at the end of March 3, 2019.
Credit: W. Meier, National Snow and Ice Data Center
High-resolution image
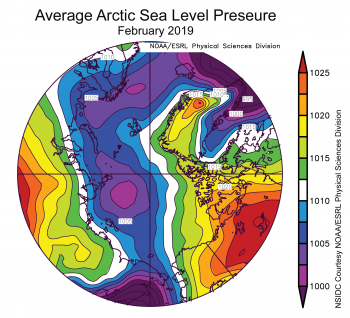
Figure 4b. This plot shows average sea level pressure in the Arctic in millibars (or hPa) for February 2019. Yellows and reds indicate high air pressure; blues and purples indicate low air pressure.
Credit: NSIDC courtesy NOAA Earth System Research Laboratory Physical Sciences Division
High-resolution image
As noted above, sea ice in the Bering Sea region is the most remarkable Arctic feature this month. On average, Bering sea ice extent increases until late March or early April. The ice in the region is volatile, responding to winds and waves. Extent often fluctuates during the winter when thin ice near the edge moves north or south and melts or grows. However, this year is quite extreme. From January 27 through March 3, extent decreased from 566,000 square kilometers (219,000 square miles) to 193,000 square kilometers (74,500 square miles), roughly equivalent to the size of Montana (Figure 4). A similar ice loss occurred last year, but 2018 and 2019 appear to be extreme in the satellite record. As of the beginning of March, the 2019 Bering Sea ice extent was the lowest in the satellite record for this time of year.
A major cause of the ice loss is the strong low pressure in the Bering Sea and the high pressure over northwestern Canada (Figure 4b). Strong winds between these pressure centers drew warm air into the region from the south, inhibiting ice growth in the Bering Sea while also pushing ice to the north. Storms also broke up large areas of ice near the ice edge and reduced the sea ice extent. Warmer than average sea surface temperatures have also been observed in the region.
An early look at sea ice freeboard from ICESat-2
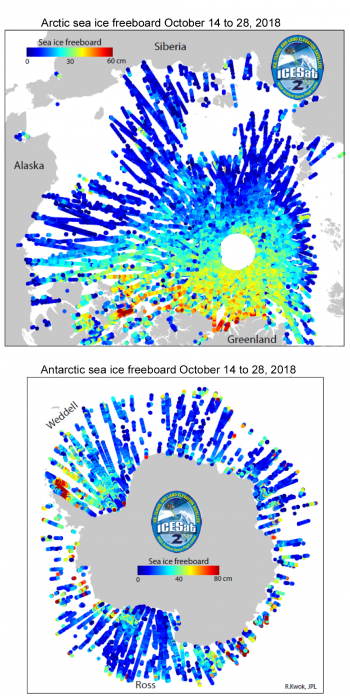
Figure 5. These maps show preliminary sea ice freeboard (height of snow or ice surface above the ocean) from two weeks of ICESat-2 data acquired in October 2018. Note that both the spatial scale and the vertical scale are different for the two maps.
Credit: R. Kwok, Jet Propulsion Laboratory
High-resolution image
Colleague Ron Kwok of the Jet Propulsion Laboratory in Pasadena, CA, provided a first look of Arctic sea ice freeboard from the NASA Ice, Cloud and land Elevation Satellite 2 (ICESat-2) at the Fall 2018 American Geophysical Union conference. Freeboard represents the height of the top of the ice or snow above the adjacent ocean surface. Figure 5 shows the maps produced for both the Arctic and the Antarctic from the first two weeks of preliminary data from the satellite, October 14 to 28, 2018.
Freeboard measurements can be used to estimate sea ice thickness and volume, given certain assumptions. While in general freeboard and ice thickness increase and decrease together, the exact conversion from one to the other depends very much on snow thickness, snow and ice density, and degree of surface melt (if any). These maps are based on ~210 orbits using a single laser track from one of the six ICESat-2 laser profiles, smoothed to a 25-kilometer (15.5-mile) running average of the difference between snow and sea ice cover height, and ocean surface height. The ocean surface height is measured in ice-free ocean areas in gaps, or leads, within the sea ice.
Note how for the Arctic ICESat-2 captures the expected pattern of higher freeboard (thicker ice) north of the coast of the Canadian Arctic Archipelago and Greenland and lower freeboard (thinner ice) on the Eurasian side of the Arctic. As also expected, there is little thick ice (i.e. few areas with high freeboard) in Antarctica which consists of mostly first-year ice (less than 1 year old); the obvious exceptions are the areas of high freeboard in the northwestern Weddell Sea and along the northern coast of West Antarctica (Bellingshausen and Amundsen seas) where some older sea ice persists.
ICESat-2 data will be distributed by the NASA Snow and Ice Distributed Active Archive Center (DAAC) at NSIDC and will be available to the public soon.
Antarctic minimum sea ice extent was likely reached on February 28 and March 1
After plummeting in late December to record daily lows in sea ice extent, Antarctica’s melt slowed significantly in January and February, reaching its likely minimum of 2.47 million square kilometers (954,000 square miles) on both February 28 and March 1. This is the seventh lowest extent in the satellite record.
Sea ice extent has been particularly low in the central and eastern Weddell Sea and in the eastern Ross Sea, but above average ice extent remains along the East Antarctic coastline and the Bellingshausen Sea. Temperatures in the sea ice areas surrounding Antarctica have been near average to slightly below average at 1 degree Celsius to -2 degrees Celsius (34 degrees Fahrenheit to 28 degrees Fahrenheit), except in the Central Pacific/Ross Sea region where temperatures have been up to 3 degrees Celsius (5 degrees Fahrenheit) above the 1981 to 2010 average.
Further reading
Anchorage Daily: “Bering Sea ice is at an ‘unprecedented’ low right now”

